Embed Size (px)
Citation preview
Automated System Monitoring
Josh [email protected]
Systems AdministratorNational Radio Astronomy Observatory
Charlottesville, VA
2
https://blogs.nrao.edu/jmalone
One night, about 8 or 9 years ago, the chiller in our DC failed. Co-worker arrive in the morning to find room was 90F ambient. Quickly set up fans to vent the room. Checked servers - found that main web server had lost both disks in its OS RAID mirror. (15k disks, ran hot) Main page was being served from memory, but the OS was freaking out.
We had minimal monitoring scripts. No environment monitoring. No disk health checks. Failure caught us completely by surprise. We decided that we weren’t going to let this happen ever again.
Over the next year or so we implemented 2 independent monitoring systems - one for servers/services and one for environmentals. Set up each system to also monitor the other.
WHAT IS AUTOMATED MONITORING?
7
Some sort of dedicated, automatic instrumentation to check services and/or serversDetect and report service problems, server hardware issuesUsually provides a central “dashboard” to track problemsCan be distributed; but still under control of a central daemon * Differentiates it from “a bunch of scripts” used to check on things; that doesn’t have the ability to determine cause or eliminate false alarms.
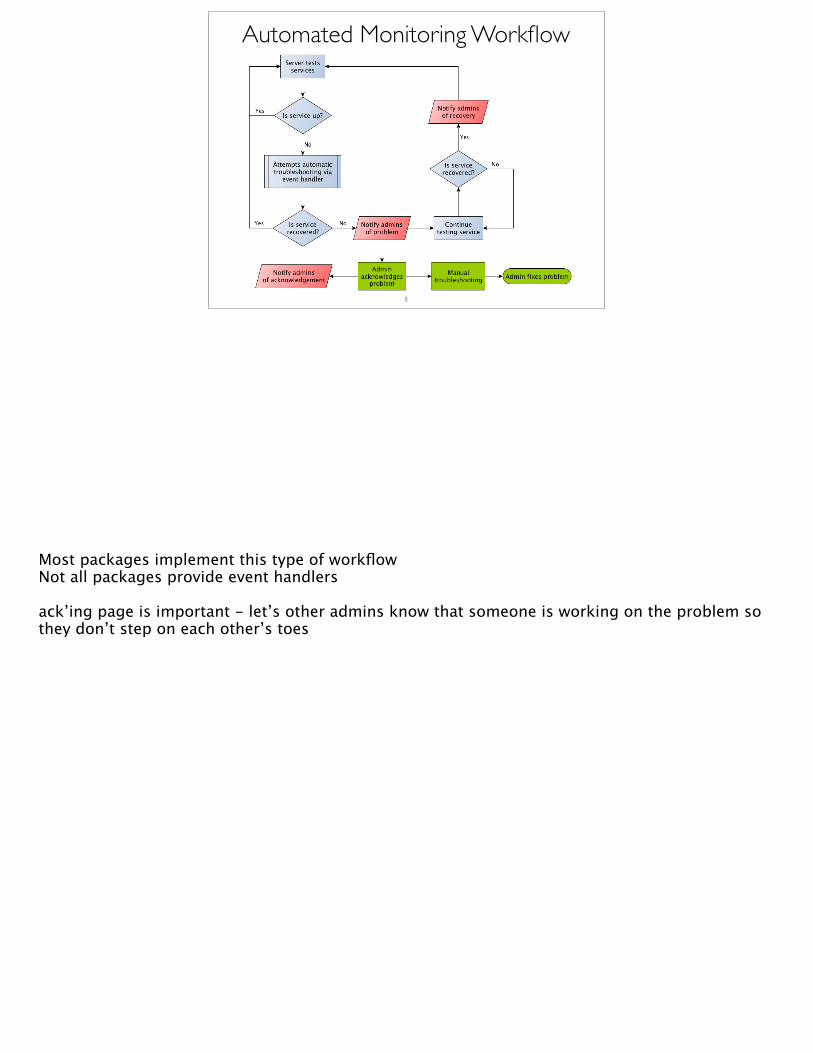
Automated Monitoring Workflow
8
Most packages implement this type of workflowNot all packages provide event handlers
ack’ing page is important - let’s other admins know that someone is working on the problem so they don’t step on each other’s toes
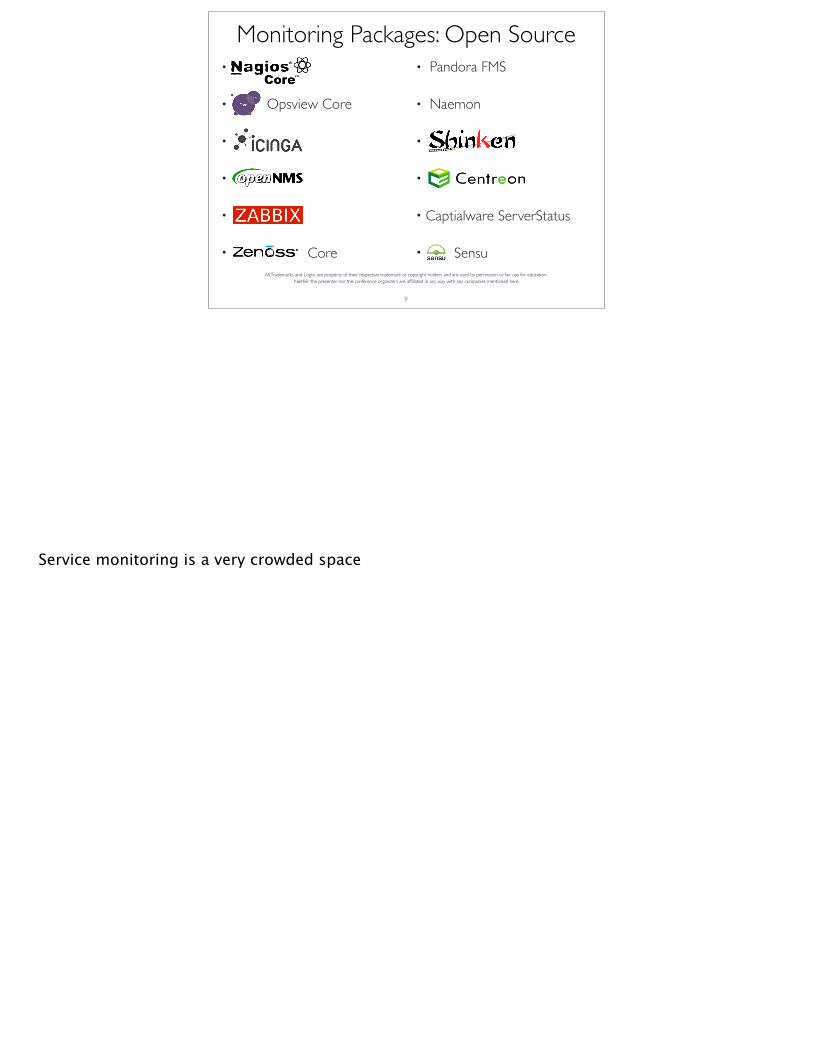
Monitoring Packages: Open Source•
• Opsview Core
•
•
•
• Core
• Pandora FMS
• Naemon
•
•
• Captialware ServerStatus
• Sensu
9
All Trademarks and Logos are property of their respective trademark or copyright holders and are used by permission or fair use for education. Neither the presenter nor the conference organizers are affiliated in any way with any companies mentioned here.
Service monitoring is a very crowded space
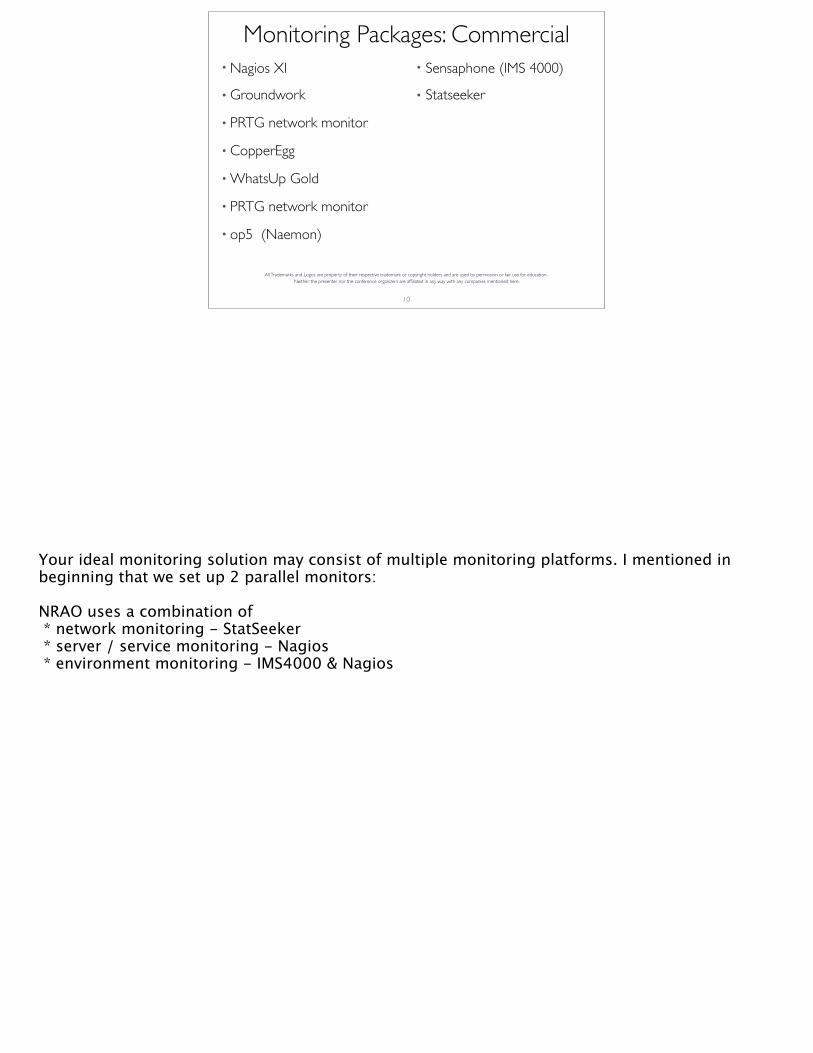
Monitoring Packages: Commercial• Nagios XI
• Groundwork
• PRTG network monitor
• CopperEgg
• WhatsUp Gold
• PRTG network monitor
• op5 (Naemon)
• Sensaphone (IMS 4000)
• Statseeker
10
All Trademarks and Logos are property of their respective trademark or copyright holders and are used by permission or fair use for education. Neither the presenter nor the conference organizers are affiliated in any way with any companies mentioned here.
Your ideal monitoring solution may consist of multiple monitoring platforms. I mentioned in beginning that we set up 2 parallel monitors:
NRAO uses a combination of * network monitoring - StatSeeker * server / service monitoring - Nagios * environment monitoring - IMS4000 & Nagios
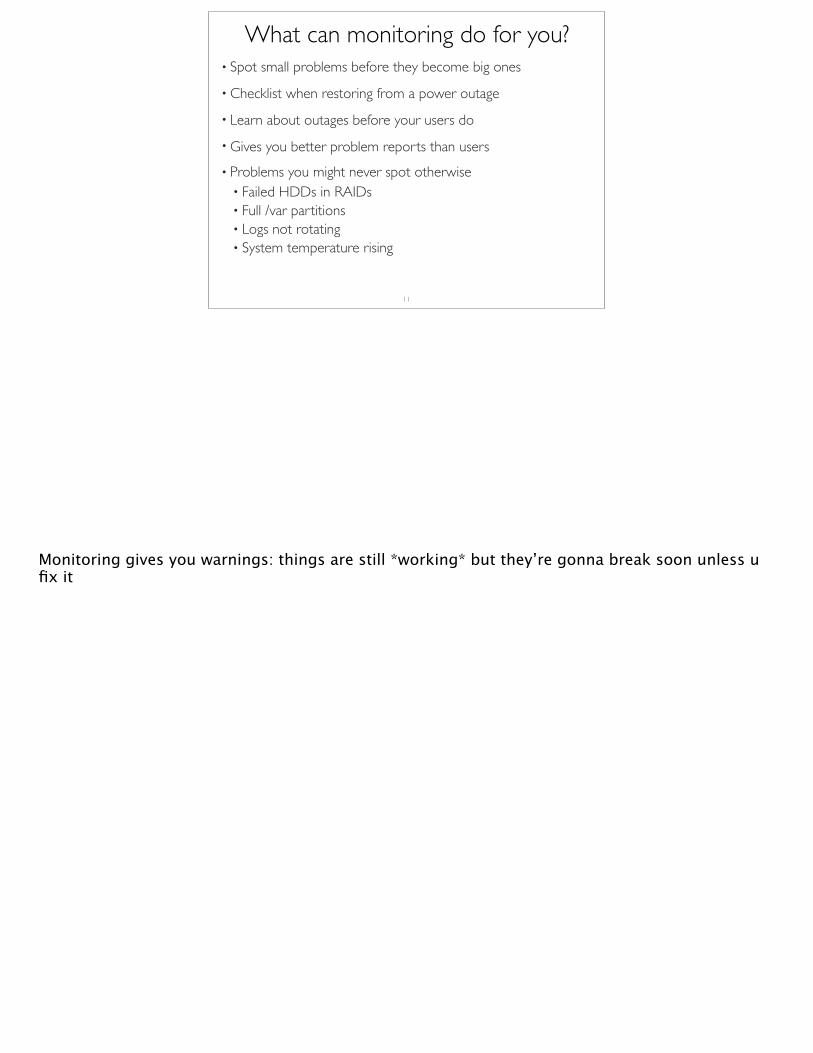
What can monitoring do for you?• Spot small problems before they become big ones
• Checklist when restoring from a power outage
• Learn about outages before your users do• Gives you better problem reports than users• Problems you might never spot otherwise
• Failed HDDs in RAIDs• Full /var partitions• Logs not rotating• System temperature rising
11
Monitoring gives you warnings: things are still *working* but they’re gonna break soon unless u fix it
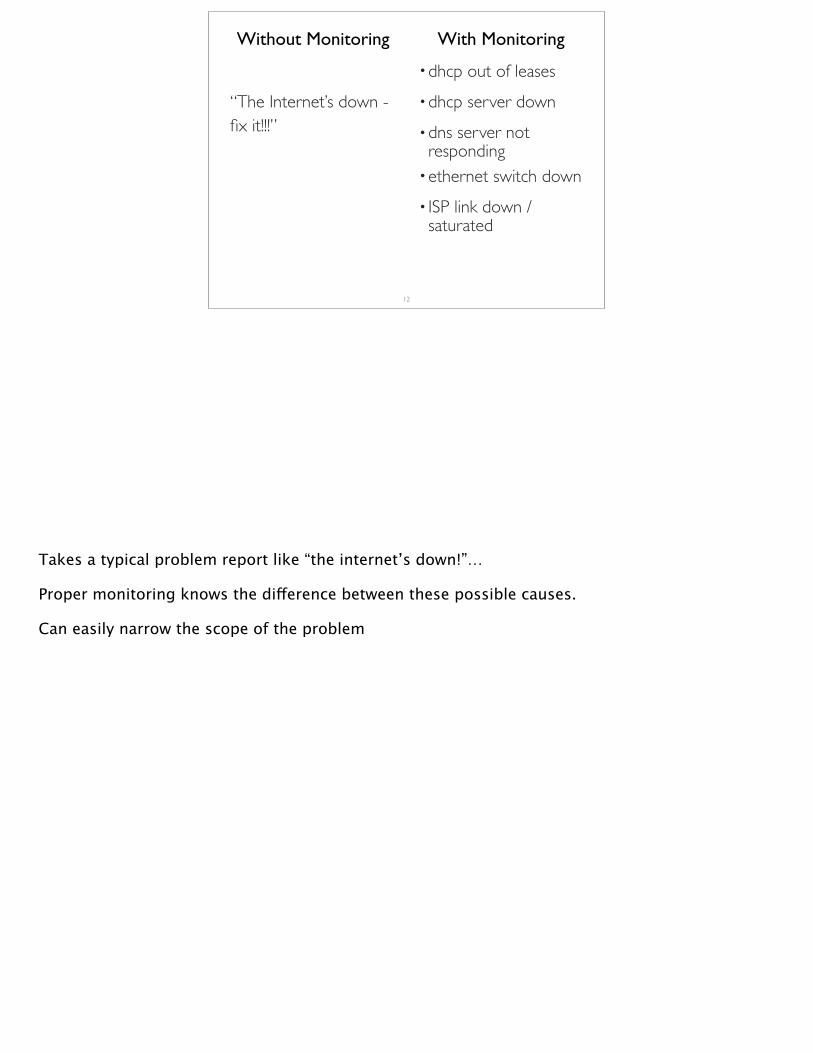
With Monitoring
•dhcp out of leases•dhcp server down•dns server not responding
•ethernet switch down• ISP link down / saturated
12
Without Monitoring
“The Internet’s down - fix it!!!”
Takes a typical problem report like “the internet’s down!”…
Proper monitoring knows the difference between these possible causes.
Can easily narrow the scope of the problem
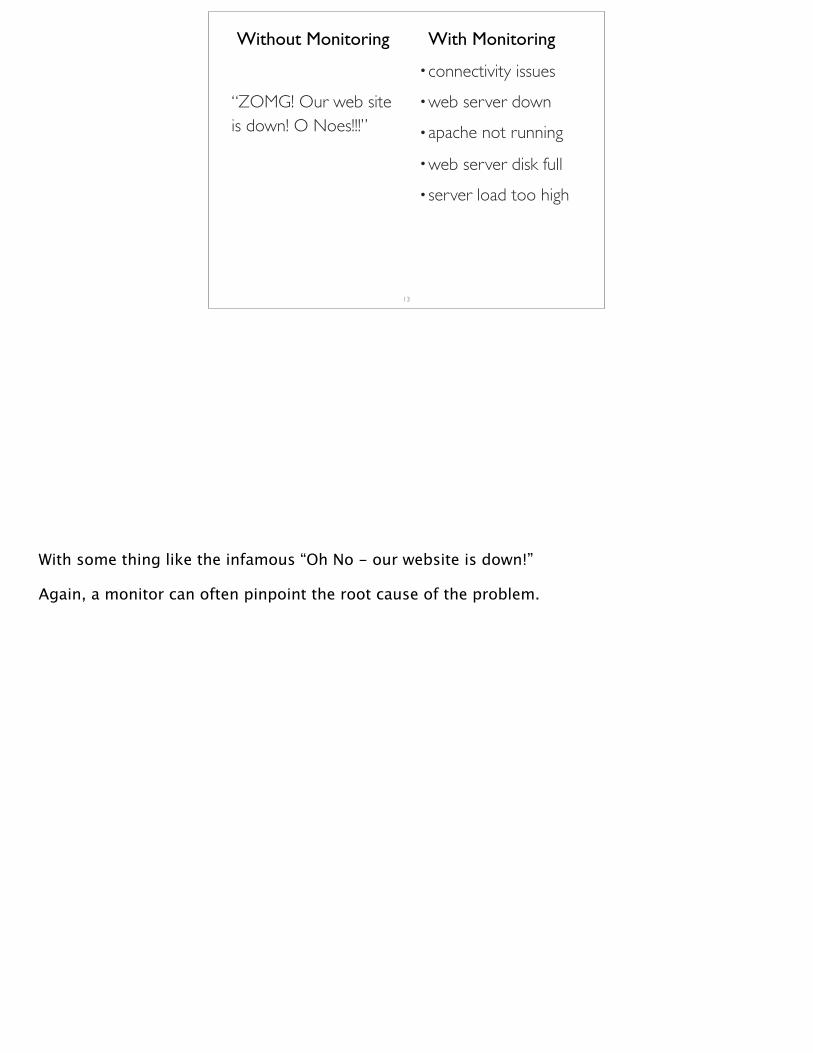
With Monitoring
•connectivity issues•web server down•apache not running•web server disk full•server load too high
13
Without Monitoring
“ZOMG! Our web site is down! O Noes!!!”
With some thing like the infamous “Oh No - our website is down!”
Again, a monitor can often pinpoint the root cause of the problem.
What can monitoring do for you?• Capacity planning
• Performance data can generate graphs of utilization• RAM, Disk, etc.
• Availability reports - CAUTION• Easy to generate -- even easier to generate wrong• Make sure your configurations actually catch problems• Will also include problems with Nagios itself :(• If you’re going to quote your availability numbers (SLAs,
etc.) make sure you understand what you’re actually monitoring.
14
Beyond just spotting problems, monitoring can be good for capacity planning.
In Nagios, graphing requires add-on (PNP4Nagios); many other packages include it in the base install
Nagios builds a wealth of historical data about your services. PNP graphs that data so you can visualize it.
availability: make sure Nagios is being honest; audit your plugins
ENVIRONMENT MONITORING
15
Before we get to host and service monitoring, take a quick look at options for environment monitoring.
Environment Monitoring• Temperature• Smoke
• Water
• Humidity• Motion• Door / closure
• Mains power
16
What do we mean by environment monitoring? Any of these, plus perhaps many more.
Basically - anything about your servers or server room other than the services.
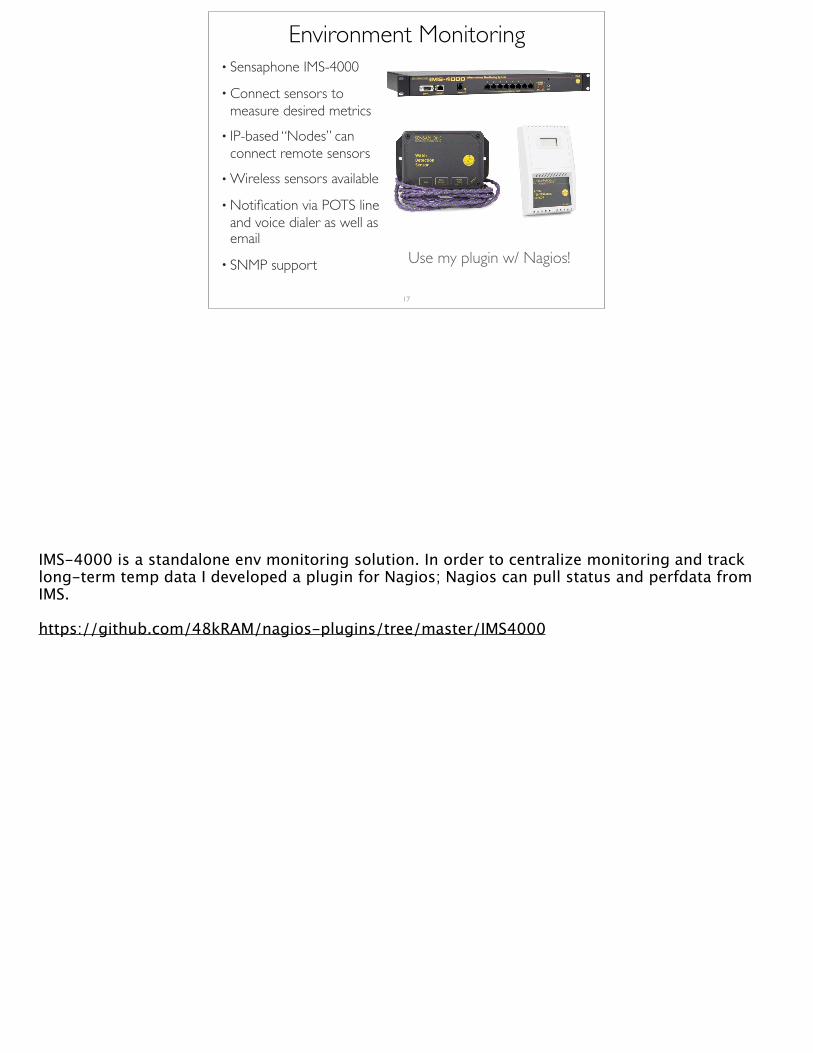
Environment Monitoring• Sensaphone IMS-4000
• Connect sensors to measure desired metrics
• IP-based “Nodes” can connect remote sensors
• Wireless sensors available
• Notification via POTS line and voice dialer as well as email
• SNMP support
17
Use my plugin w/ Nagios!
IMS-4000 is a standalone env monitoring solution. In order to centralize monitoring and track long-term temp data I developed a plugin for Nagios; Nagios can pull status and perfdata from IMS.
https://github.com/48kRAM/nagios-plugins/tree/master/IMS4000
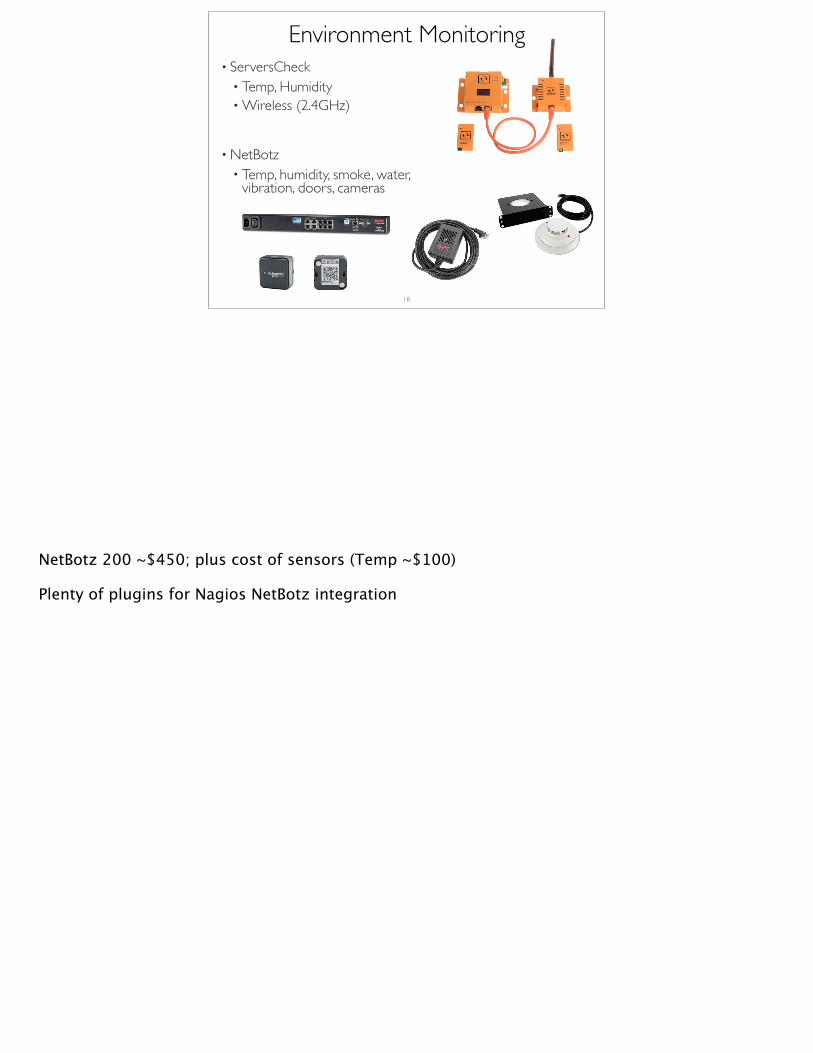
Environment Monitoring• ServersCheck
• Temp, Humidity• Wireless (2.4GHz)
• NetBotz• Temp, humidity, smoke, water,
vibration, doors, cameras
18
NetBotz 200 ~$450; plus cost of sensors (Temp ~$100)
Plenty of plugins for Nagios NetBotz integration

NAGIOS
19
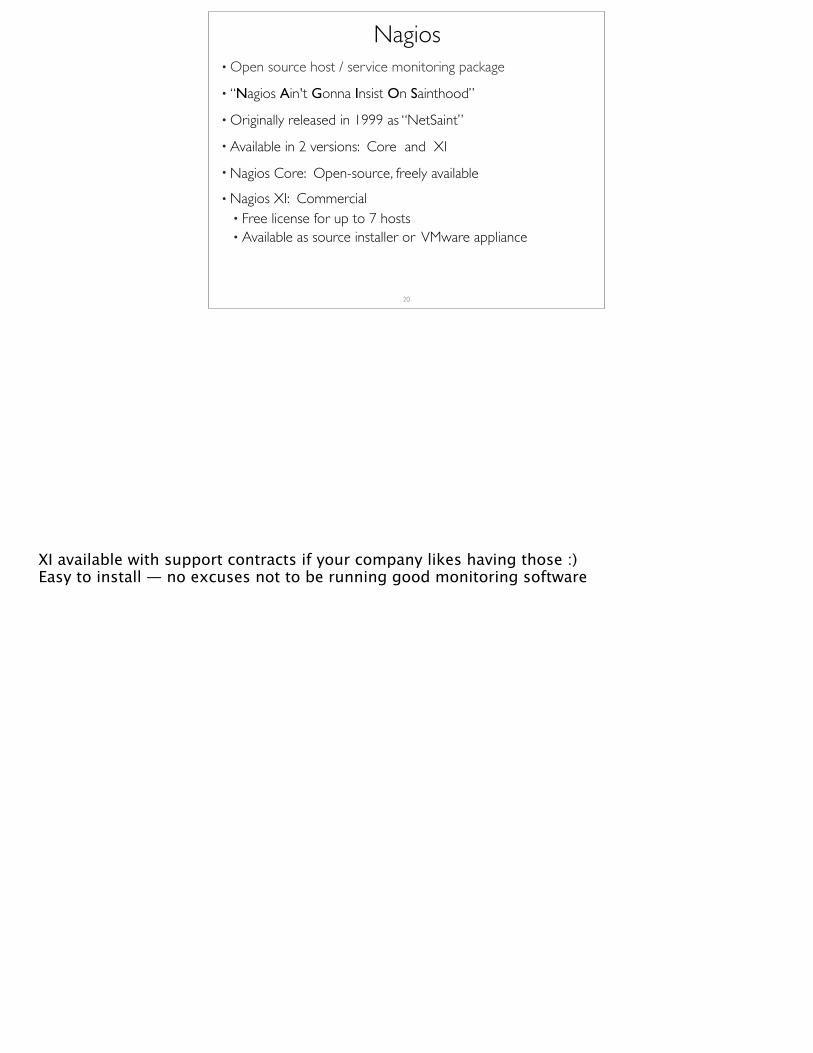
• Open source host / service monitoring package
• “Nagios Ain't Gonna Insist On Sainthood”
• Originally released in 1999 as “NetSaint”
• Available in 2 versions: Core and XI• Nagios Core: Open-source, freely available• Nagios XI: Commercial
• Free license for up to 7 hosts• Available as source installer or VMware appliance
20
Nagios
XI available with support contracts if your company likes having those :)Easy to install — no excuses not to be running good monitoring software
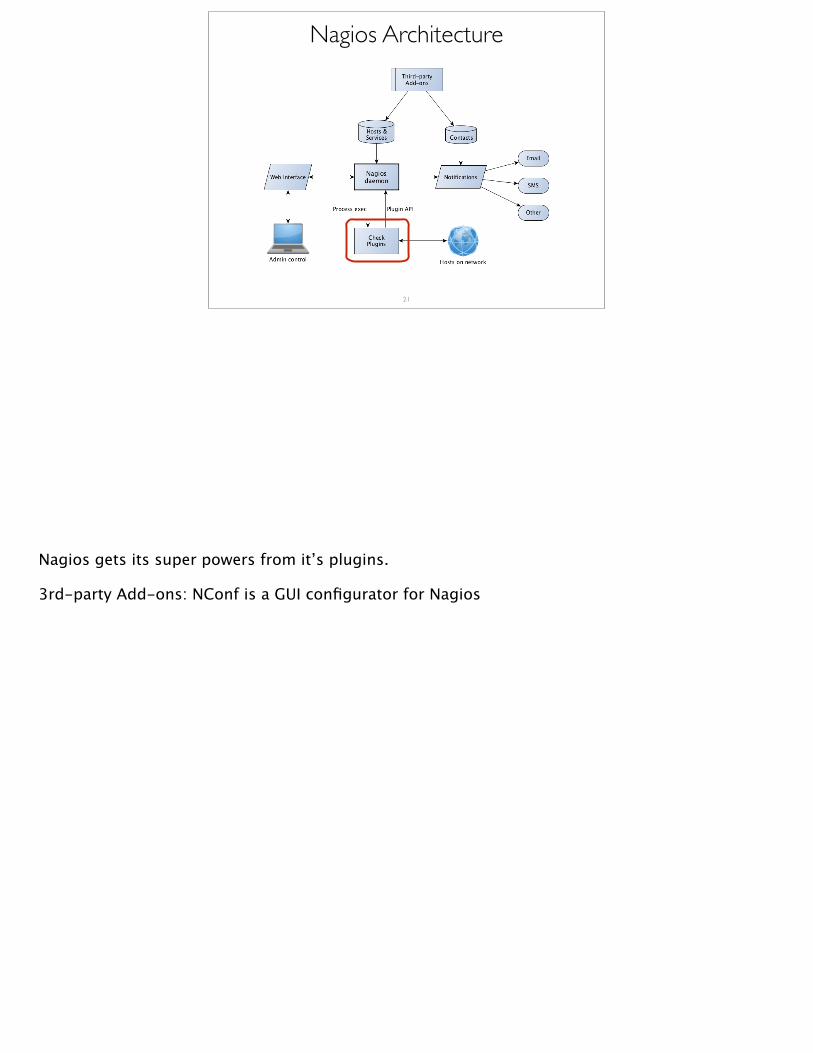
Nagios Architecture
21
Nagios gets its super powers from it’s plugins.
3rd-party Add-ons: NConf is a GUI configurator for Nagios
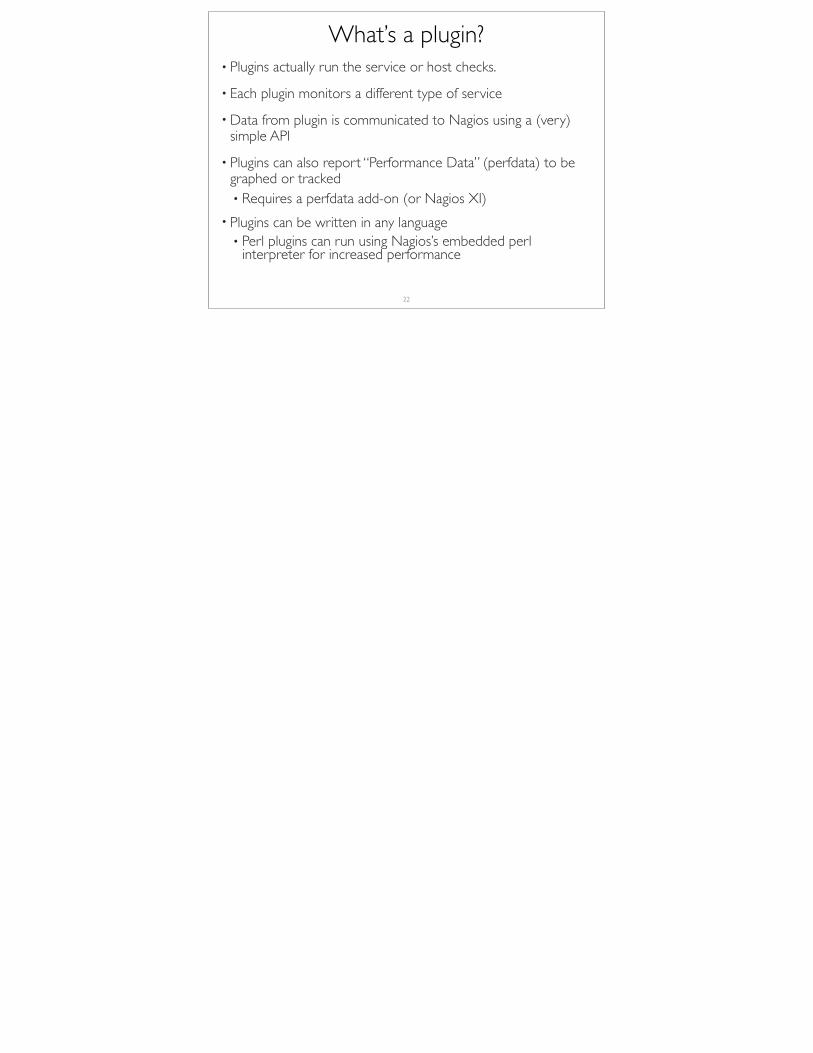
What’s a plugin?• Plugins actually run the service or host checks.
• Each plugin monitors a different type of service
• Data from plugin is communicated to Nagios using a (very) simple API
• Plugins can also report “Performance Data” (perfdata) to be graphed or tracked• Requires a perfdata add-on (or Nagios XI)
• Plugins can be written in any language• Perl plugins can run using Nagios’s embedded perl
interpreter for increased performance
22
Where to Monitor a Service?
Host ping
TCP port 443
SSL handshakeHTTP return code
Page load time
Page content
23
Is server host alive?
Is Apache listening?Is SSL functional?
Is the page found?
Does page load quickly?
Is it the right page?
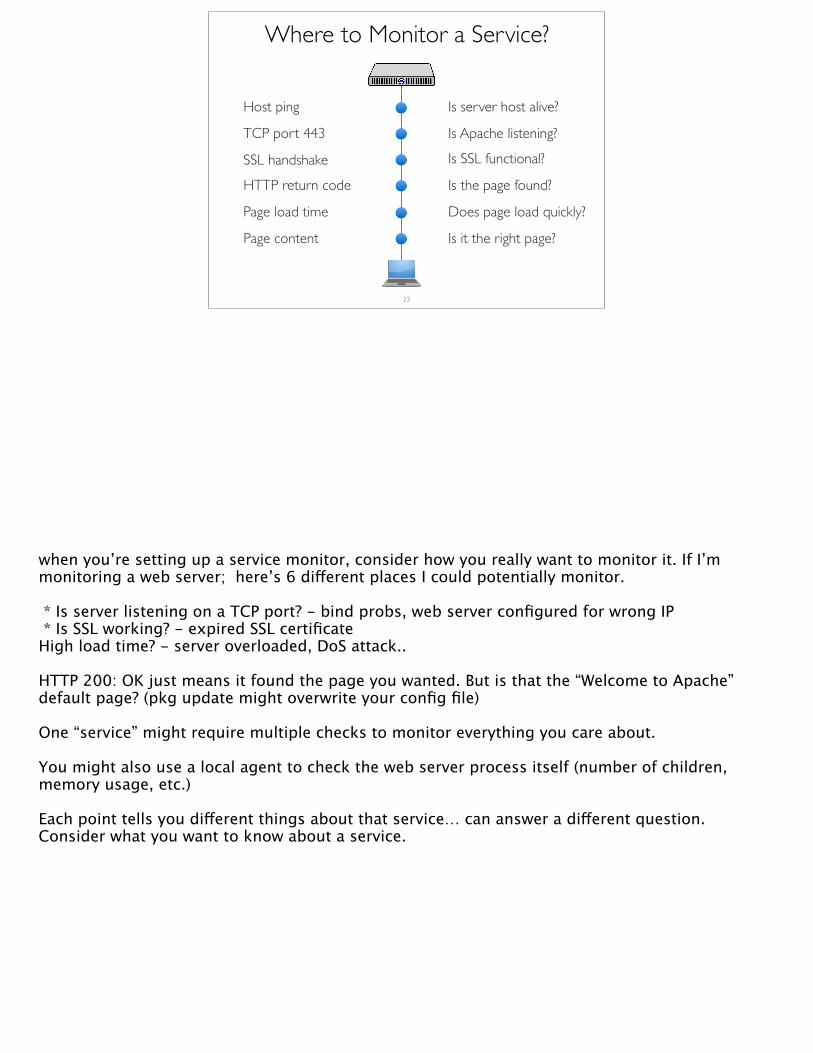
when you’re setting up a service monitor, consider how you really want to monitor it. If I’m monitoring a web server; here’s 6 different places I could potentially monitor.
* Is server listening on a TCP port? - bind probs, web server configured for wrong IP * Is SSL working? - expired SSL certificateHigh load time? - server overloaded, DoS attack..
HTTP 200: OK just means it found the page you wanted. But is that the “Welcome to Apache” default page? (pkg update might overwrite your config file)
One “service” might require multiple checks to monitor everything you care about.
You might also use a local agent to check the web server process itself (number of children, memory usage, etc.)
Each point tells you different things about that service… can answer a different question.Consider what you want to know about a service.
Custom Plugins
24
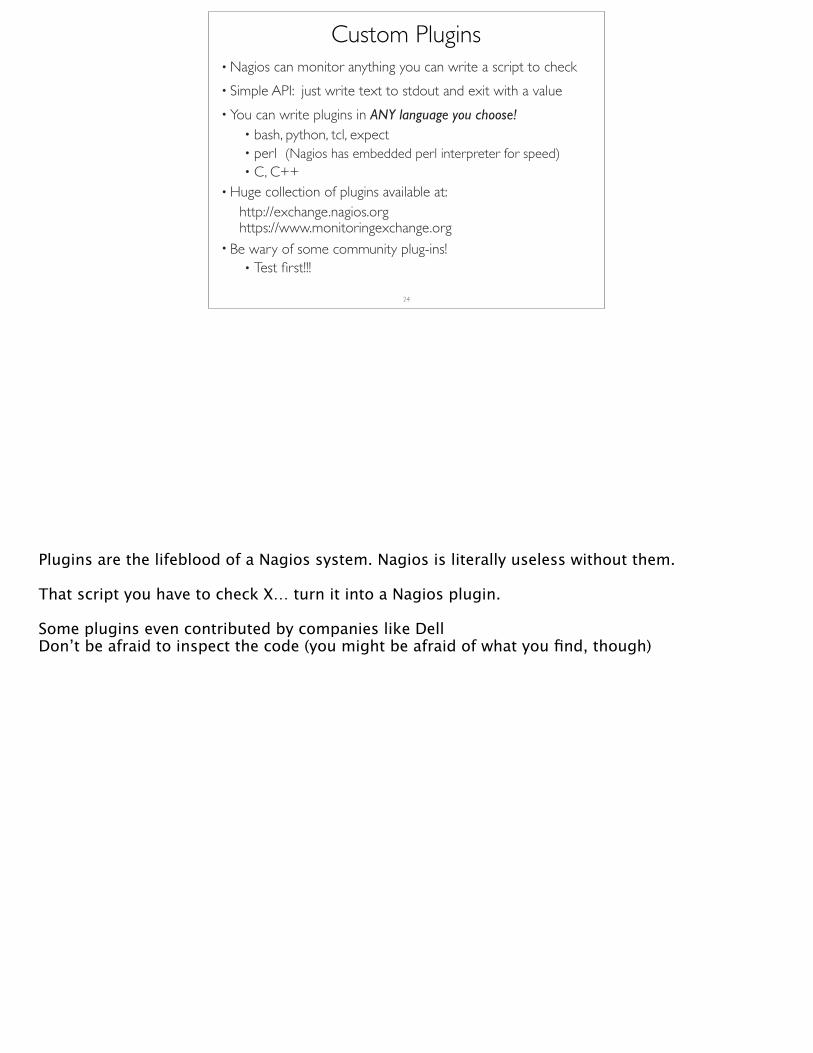
• Nagios can monitor anything you can write a script to check• Simple API: just write text to stdout and exit with a value• You can write plugins in ANY language you choose!
• bash, python, tcl, expect• perl (Nagios has embedded perl interpreter for speed)• C, C++
• Huge collection of plugins available at:http://exchange.nagios.orghttps://www.monitoringexchange.org
• Be wary of some community plug-ins!• Test first!!!
Plugins are the lifeblood of a Nagios system. Nagios is literally useless without them.
That script you have to check X… turn it into a Nagios plugin.
Some plugins even contributed by companies like DellDon’t be afraid to inspect the code (you might be afraid of what you find, though)
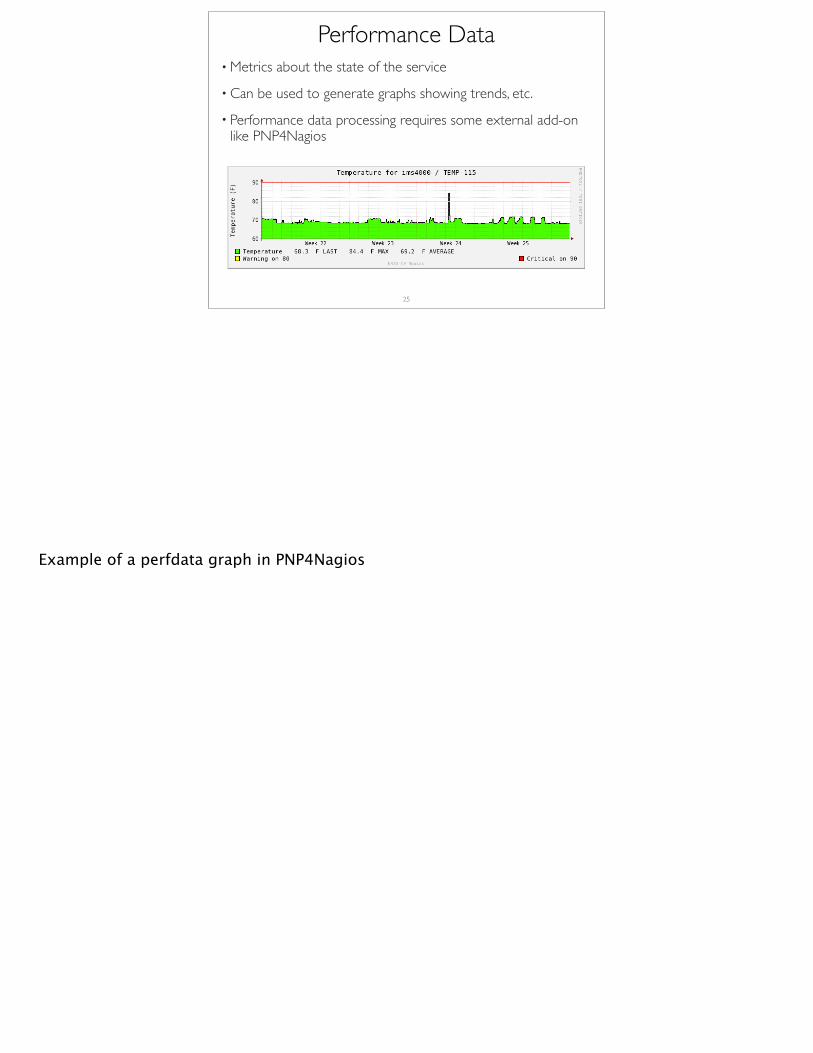
Performance Data• Metrics about the state of the service
• Can be used to generate graphs showing trends, etc.
• Performance data processing requires some external add-on like PNP4Nagios
25
Example of a perfdata graph in PNP4Nagios
My Plugins Framework• https://github.com/48kRAM/nagios-plugins
• Perl
• Net::SNMP
• Plugin for APC Smart-UPS,
26
Constantly evolving. Check regularly
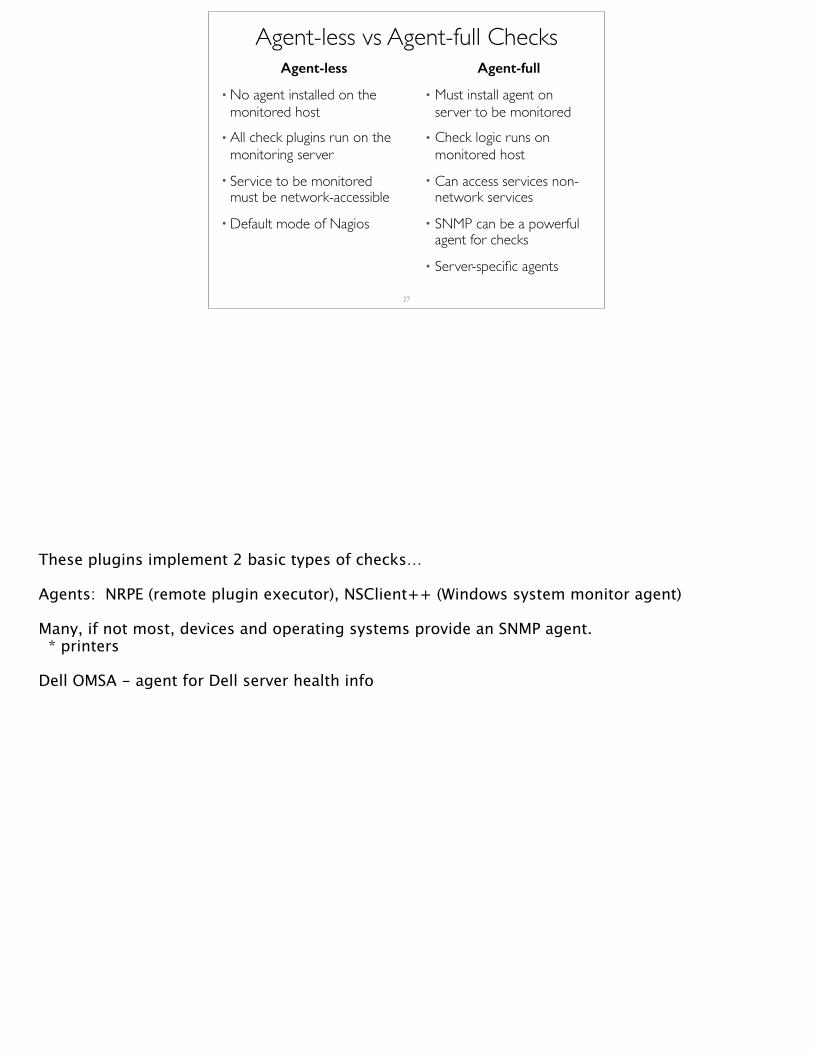
Agent-less vs Agent-full ChecksAgent-less
• No agent installed on the monitored host
• All check plugins run on the monitoring server
• Service to be monitored must be network-accessible
• Default mode of Nagios
Agent-full
• Must install agent on server to be monitored
• Check logic runs on monitored host
• Can access services non-network services
• SNMP can be a powerful agent for checks
• Server-specific agents
27
These plugins implement 2 basic types of checks…
Agents: NRPE (remote plugin executor), NSClient++ (Windows system monitor agent)
Many, if not most, devices and operating systems provide an SNMP agent. * printers
Dell OMSA - agent for Dell server health info

USING NAGIOS
28

About Nagios Replacements
29
When Nagios went commercial, the “open-source community” decided that it needed not one, not two, but three replacements for Nagios: Icinga and Naemon (forks of Nagios) and Shinken (a drop-in replacement). Most linux distros are now shipping one or more of these compatible replacements rather than the official Nagios Core. Not a single distro I checked is shipping Nagios 4.
Either Shinken, Naemon or Icinga should work the same as the material covered here, but I have only briefly tested Icinga and have not tested Shinken or Naemon at all.
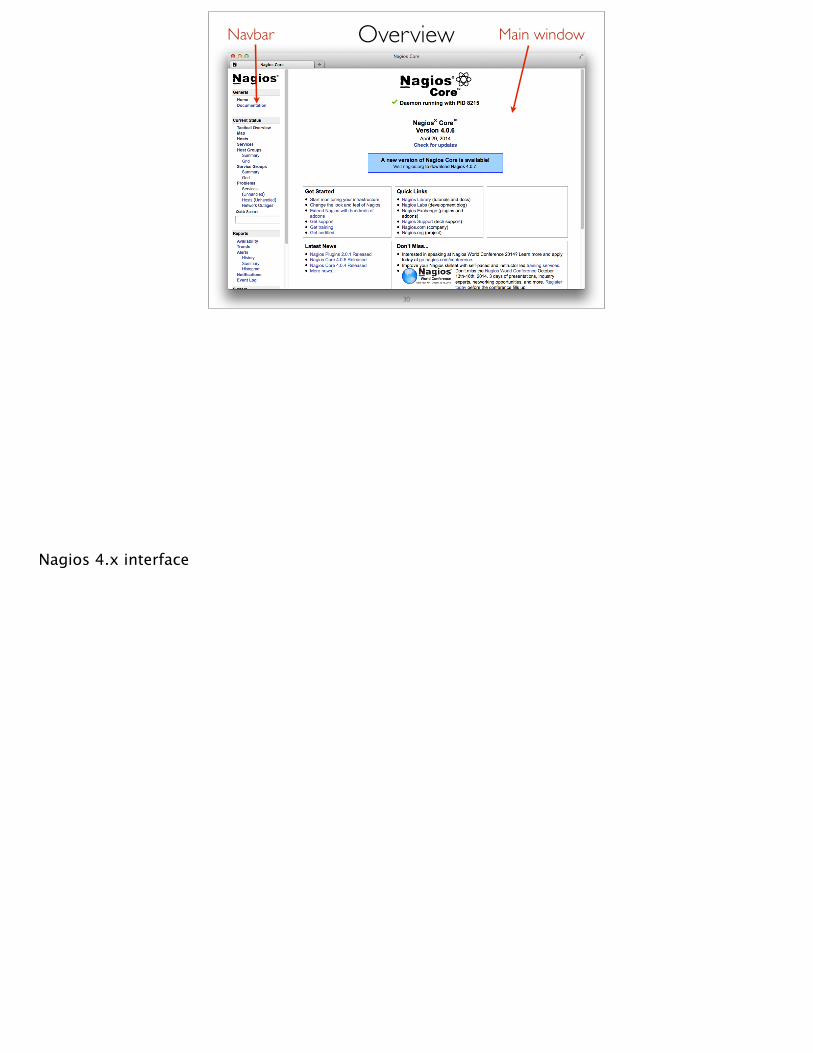
Overview
30
Navbar Main window
Nagios 4.x interface

The Tactical Overview• Displays overview of monitored services and hosts
• Shows if• Any services / hosts have notifications disabled• Any services / hosts are flapping• Active / passive checks enabled / disabled• Warning / Critical / Okay breakdown
31
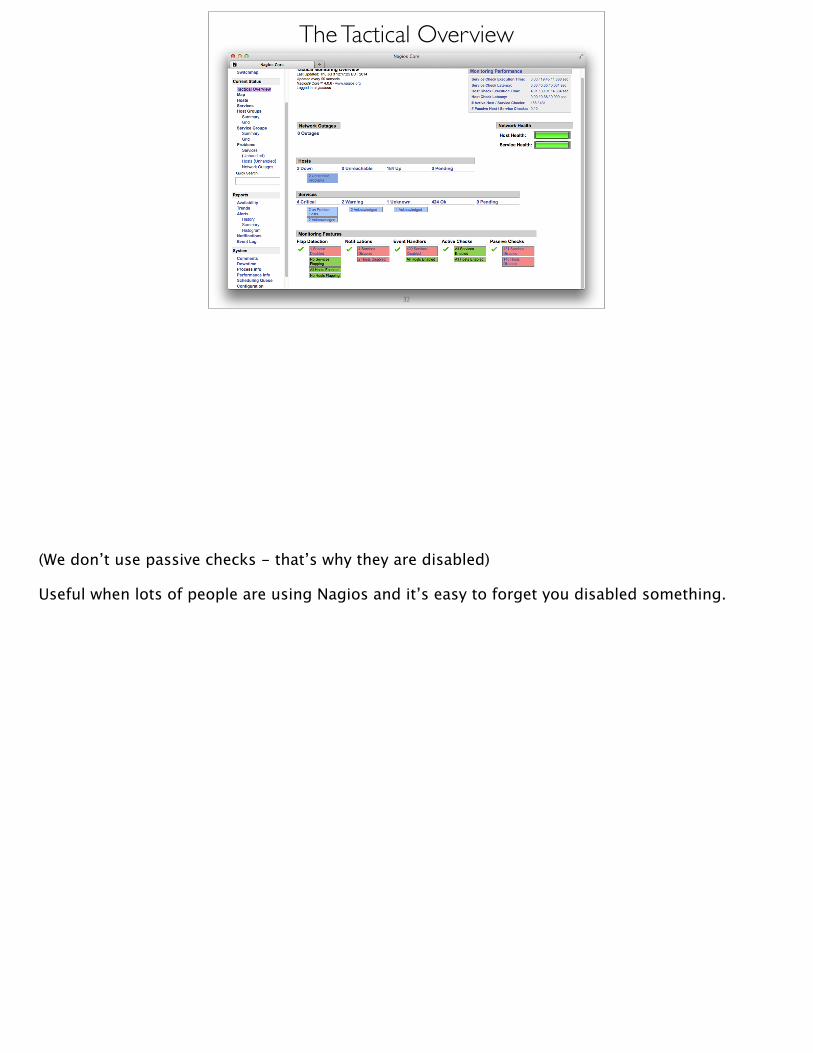
The Tactical Overview
32
(We don’t use passive checks - that’s why they are disabled)
Useful when lots of people are using Nagios and it’s easy to forget you disabled something.
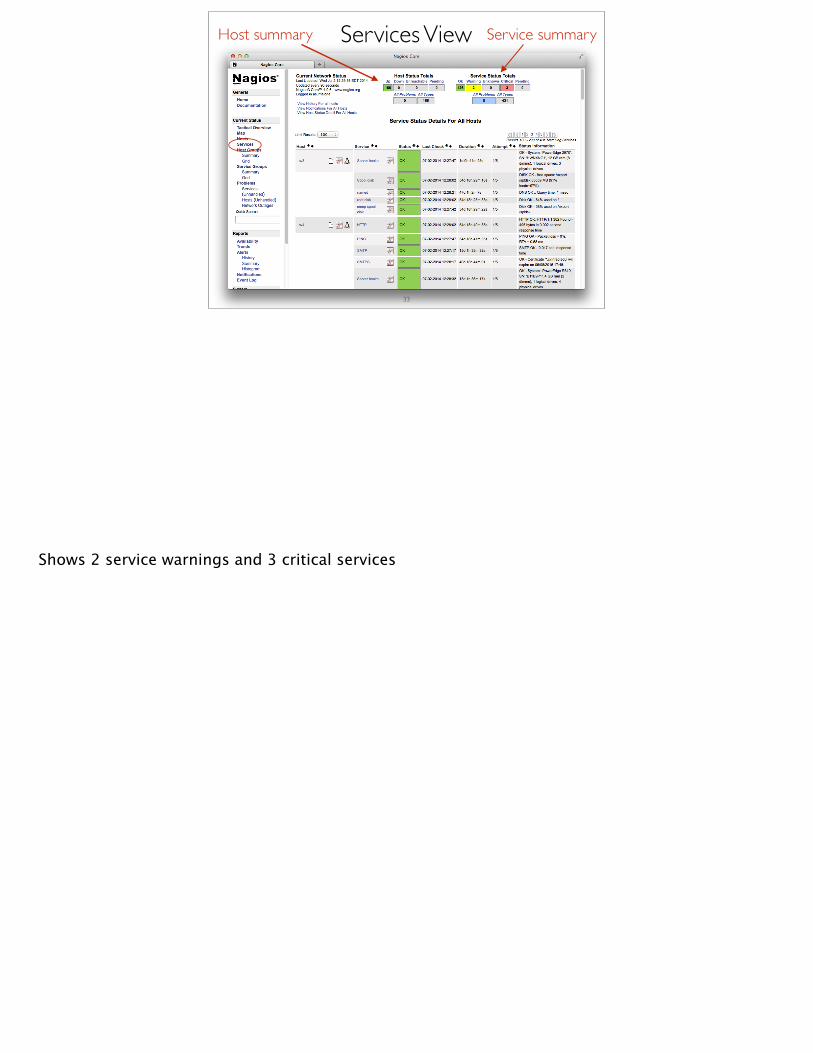
Services View
33
Host summary Service summary
Shows 2 service warnings and 3 critical services
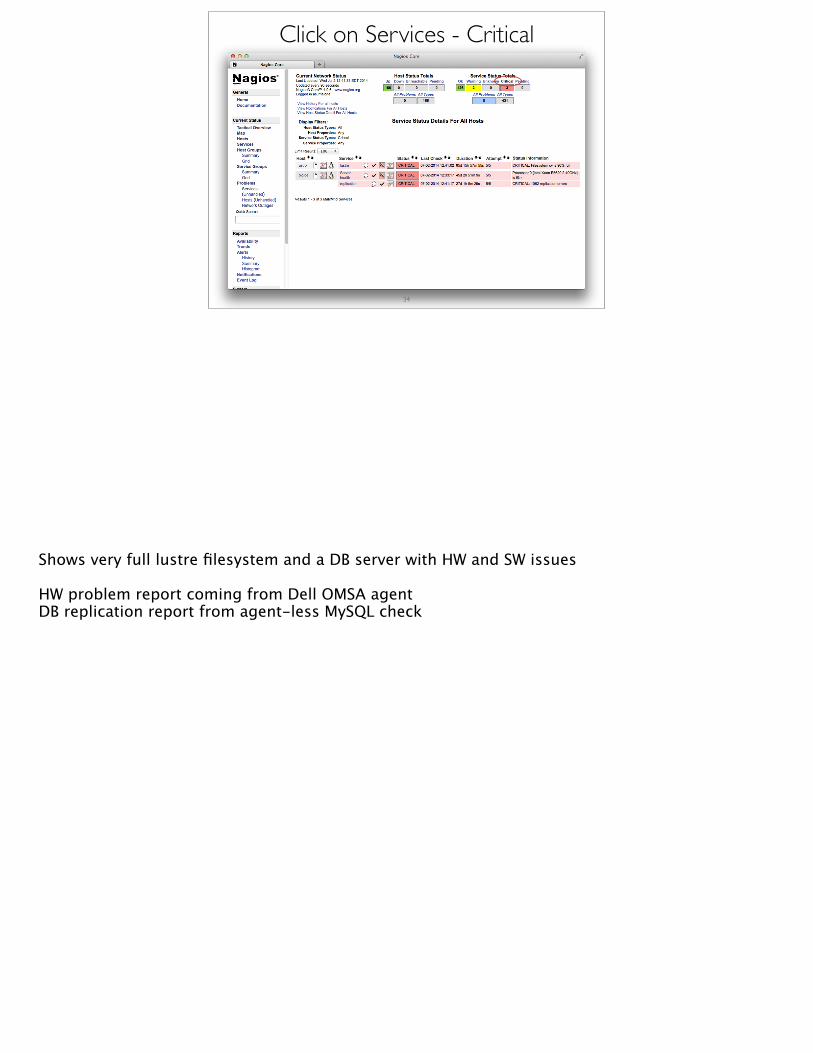
Click on Services - Critical
34
Shows very full lustre filesystem and a DB server with HW and SW issues
HW problem report coming from Dell OMSA agentDB replication report from agent-less MySQL check
Host and Service Groups• Organize services or hosts into groups by function, etc.
• Can disable alerts, schedule downtime, etc. on whole group
• Can show availability report for a whole group• Group services by desired reporting capability
• Groups get a unique URL so you can send a single link to check on a group of hosts• Great for PHBs!• Also great for delegated IT departments
35
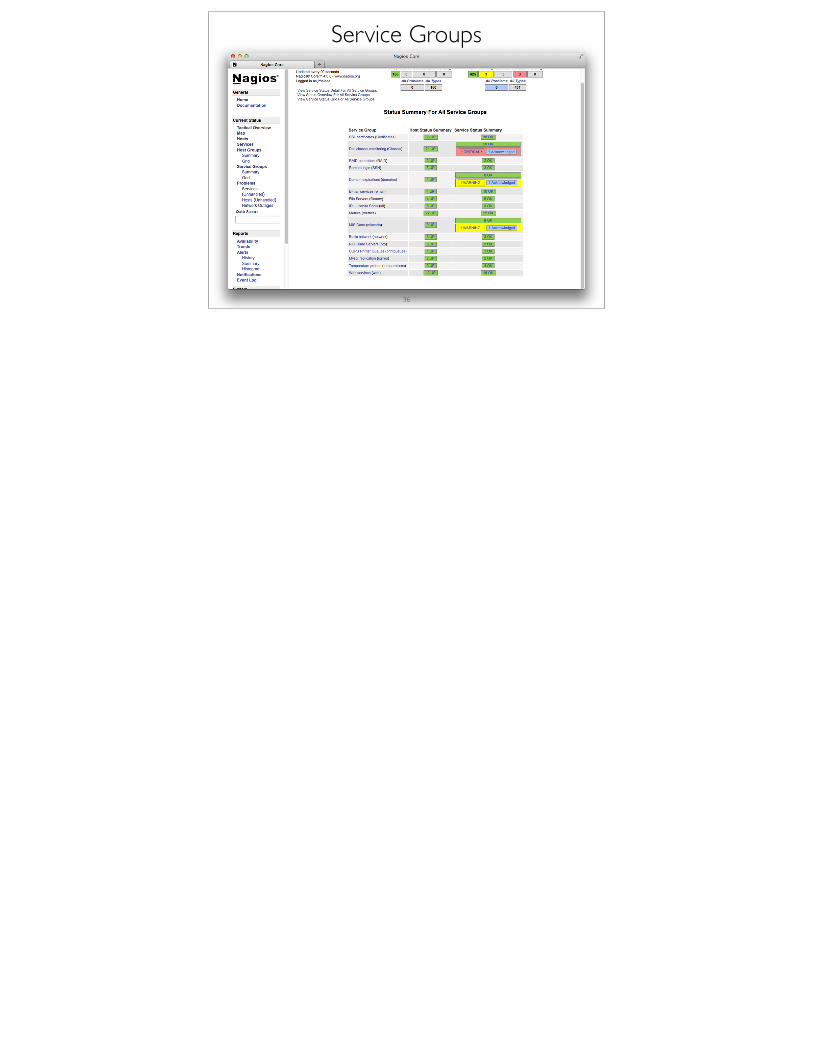
Service Groups
36

Acknowledging an Outage• Click on service name (or hostname) that has the problem
• Under “Service Commands”• Click “Acknowledge this service problem”
• You must enter a comment about why you are acknowledging the problem (i.e., “Bob is working on it”)• Click “Commit”
37

Acknowledging an Outage
38
Click Here
Here I’m going to acknowledge an SSL cert about to expire.
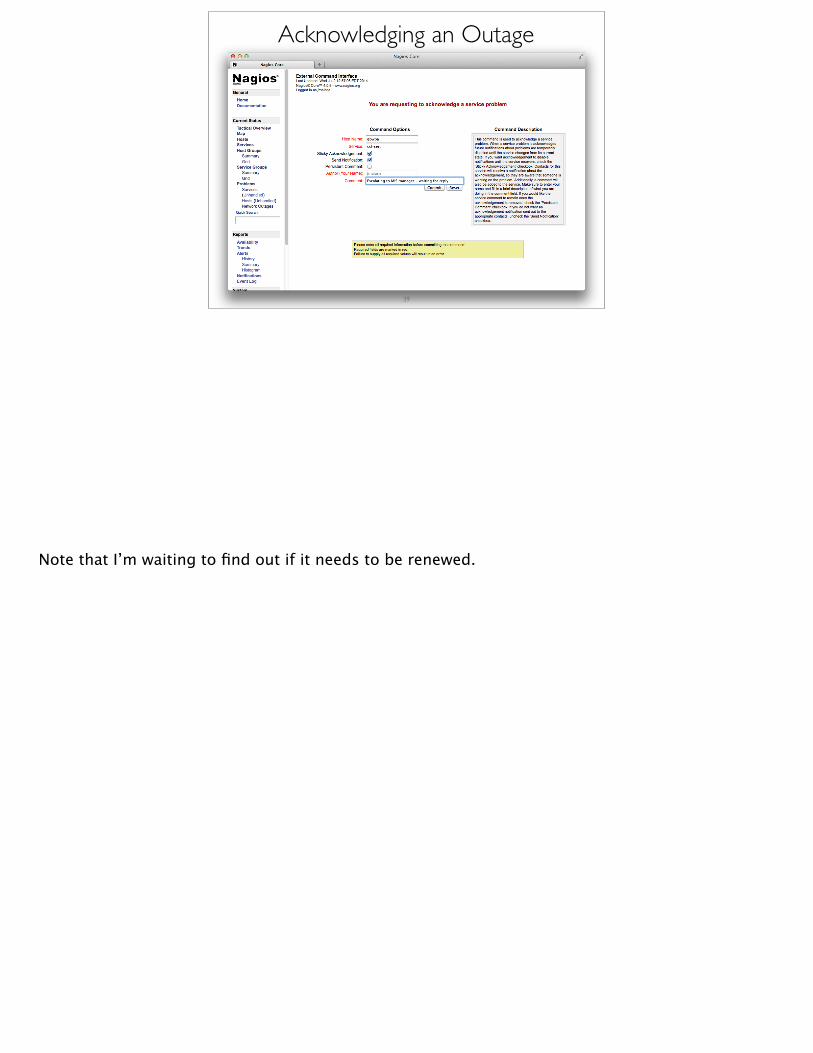
Acknowledging an Outage
39
Note that I’m waiting to find out if it needs to be renewed.
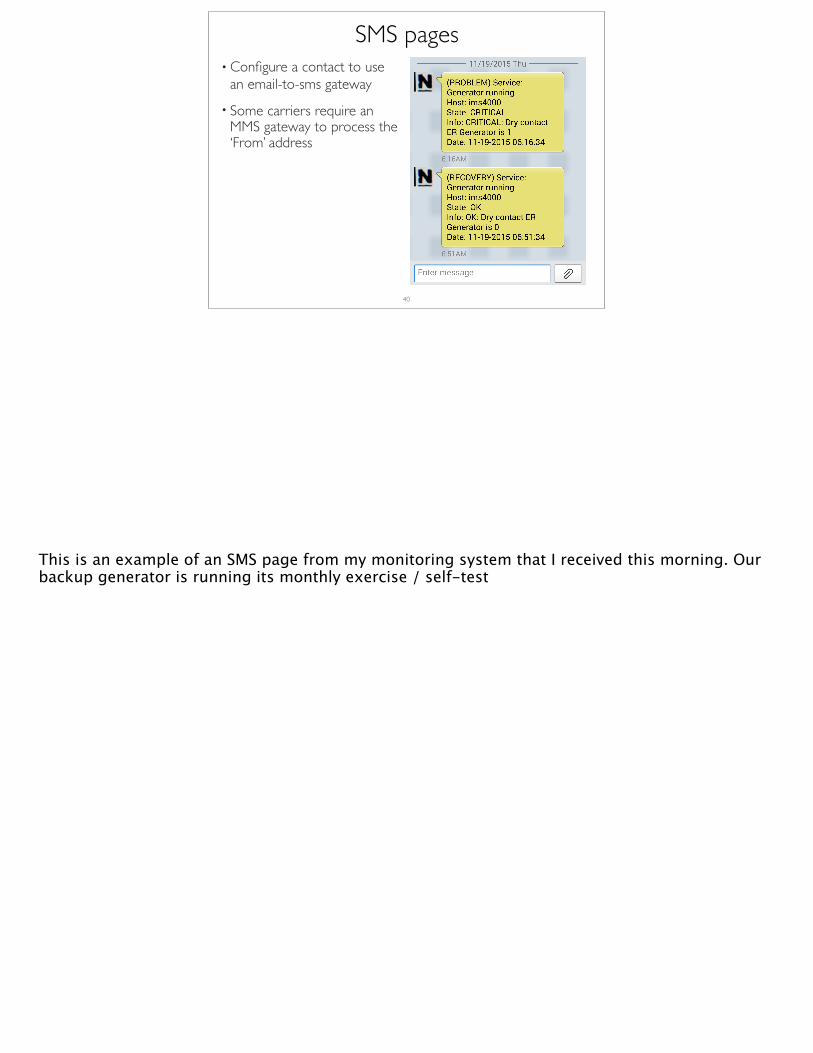
SMS pages• Configure a contact to use
an email-to-sms gateway• Some carriers require an
MMS gateway to process the ‘From’ address
40
This is an example of an SMS page from my monitoring system that I received this morning. Our backup generator is running its monthly exercise / self-test

Add-ons to Consider• PNP4Nagios - Performance data graphing
• NConf - Web-based configurator for Hosts, Services, etc.
• NagiosQL - Web-based admin tool for Nagios• NDOUtils - Export data from Nagios to MySQL
41

THANK YOU!
42
Previous talks available at:
https://blogs.nrao.edu/jmalone/talks/