Embed Size (px)
Citation preview

1
Automatic Calibration of Substitute Mechanical Loads
Using the Example of Joining Distortion
Patrick Ackert, Christian Schwarz
Fraunhofer Institut für Werkzeugmaschinen und Umformtechnik
Abstract
Due to the rising possibility of FEM for virtual tolerance prognoses, it is going to use more
and more in Car-Body-Production. Besides other it is used to simulate the distortion done by
the up to 6000 joining operations (Hu 2001) per car. Because calculating the joining related
deformations and integration detailed FE-models for joints in full car models including the
effect of joining in the deformation of the car parts would result in prohibitive simulation
times simplified model approaches for joins are necessary. The idea behind these simplified
approaches is to use mechanical loads to estimate the deformation brought about by joining
processes in the FEM. At present, adequate substitute loads for mapping joining distortion is
still often derived in a manual calibration process consuming a lot of time and effort.
One approach to automatically calibrating substitute mechanical loads is shown in this
publication where the optimizing program optiSLang (Dynardo GmbH) is used for calibration
of the mechanical loads for substitute mechanical models. This will not only demonstrate the
concept of automatic calibration and how suitable input and output parameters are derived,
but, in addition to (Ackert 2015), also the used tools, the generated target function and more
detailed the method of the optimization, developed using a real-life joining situation.
Keywords: Finite Element Method (FEM), joining process, distortion, simplified model,
parameter identification.
1 Introduction
The customer’s requirements made of the quality of the car’s impression mean that the gap
dimension is constantly being reduced while there is a constant reduction in tolerances
(Bohn 1998). At the same time, using more and more lightweight materials such as higher-
strength steel (Rohleder 2002) makes the manufacturing process for component parts and
assemblies increasingly complex. The automotive industry counters this trend by using more
2
and more simulation tools based upon the finite-element method (Gösling 2012) which makes
it possible to use simulation of production processes early on in the phase of developing the
tools and processes of car bodies such as the joining process.
The work of Neugebauer (2011), Eckert (2012), Neugebauer (2013), Eckert (2013) and
Schützle (2015) demonstrate the potential of FE based simulation in complex car body
engineering structure in the assembly process. In particular, these papers show how it is
possible to use a substitute mechanical model to numerically predict the impact of the joining
process on the deformation of parts in an assembly. The basic idea is to mimic the
geometrical deformations resulting from the joining process with locally induced mechanical
loads. These loads have to be calibrated experimentally beforehand using simplified
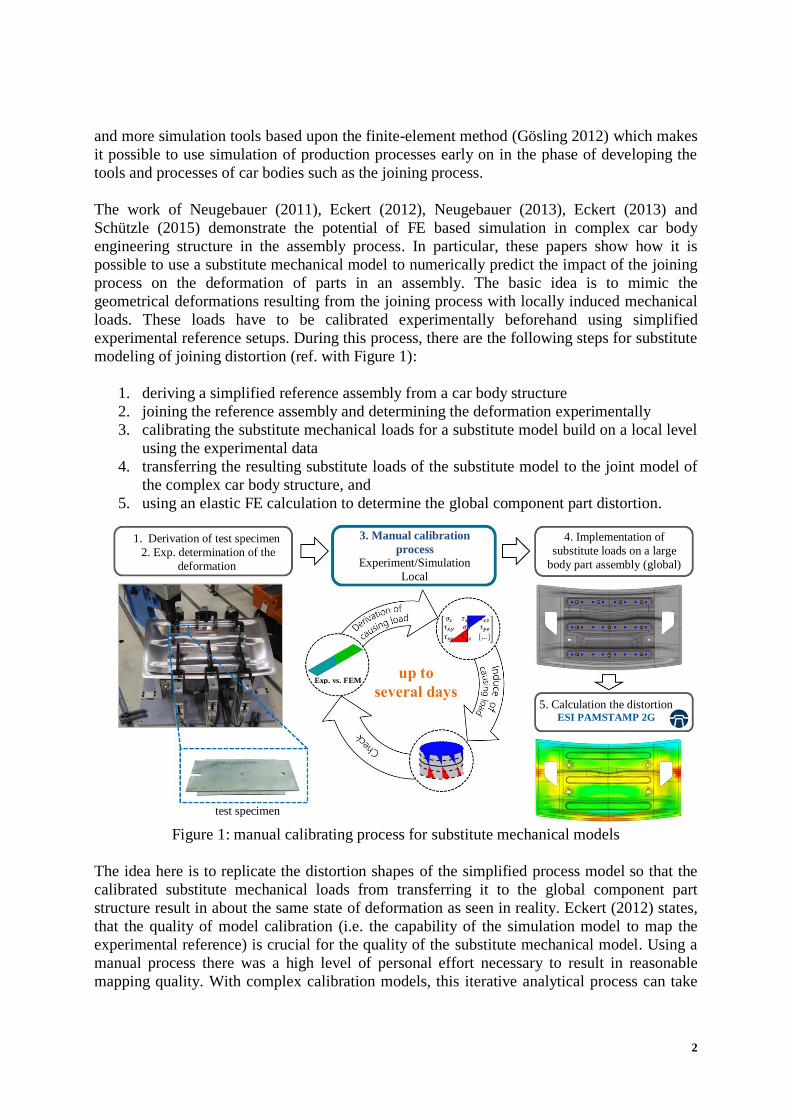
experimental reference setups. During this process, there are the following steps for substitute
modeling of joining distortion (ref. with Figure 1):
1. deriving a simplified reference assembly from a car body structure
2. joining the reference assembly and determining the deformation experimentally
3. calibrating the substitute mechanical loads for a substitute model build on a local level
using the experimental data
4. transferring the resulting substitute loads of the substitute model to the joint model of
the complex car body structure, and
5. using an elastic FE calculation to determine the global component part distortion.
Figure 1: manual calibrating process for substitute mechanical models
The idea here is to replicate the distortion shapes of the simplified process model so that the
calibrated substitute mechanical loads from transferring it to the global component part
structure result in about the same state of deformation as seen in reality. Eckert (2012) states,
that the quality of model calibration (i.e. the capability of the simulation model to map the
experimental reference) is crucial for the quality of the substitute mechanical model. Using a
manual process there was a high level of personal effort necessary to result in reasonable
mapping quality. With complex calibration models, this iterative analytical process can take
1. Derivation of test specimen
2. Exp. determination of the
deformation
3. Manual calibration
process Experiment/Simulation
Local
4. Implementation of
substitute loads on a large
body part assembly (global)
test specimen
5. Calculation the distortion ESI PAMSTAMP 2G
Exp. vs. FEM up to
several days

3
several days. Furthermore, the effectiveness of optimization processes for identifying
adequate process parameters has been documented in numerous simulative studies such by
Will (2006), Schüler (2006) and Most (2015). In the future the calibration process should be
supported by methods of CAE-based optimization to generate automated a high quality level
of responding substitute mechanical loads for mapping. As Figure 2 shows, the optimizer tool
optiSLang will be integrated into the calibration process with the objective of driving down
the time and effort needed for calibrating substitute mechanical models from several days to a
maximum of four hours.
Figure 2: Integrating optiSLang into the calibrating process
2 Simulation method
The FE program PAM-STAMP 2G (ESI group) is used for simulative mapping of the joining
process. As the schematic example of a spot welded joint shows in Figure 3, modeling the
joining process can be broken down into the simulation steps below:
1. positioning and clamping the specific components.
2. connecting the joining components with rigid girder elements at the position of the
electrodes
3. using mapping to implement substitute mechanical loads in the form of tensions
(stress) in the area of the joining point, and
4. calculating the balance from which a change in the geometry results on the component
part.
1. Derivation of test specimen
2. Exp. determination of the deformation
3. calibration process
Experiment/Simulation (local) 4. Implementation of
causing load on a large body part assembly (global)
test specimen
5. Calculation the distortion ESI PAMSTAMP 2G
optimization algorithm
Exp. = FEM
not longer than 4 hours

4
Figure 3: Simulation steps to compute the joining process
3 Parameter identification
3.1 Input parameters
2-D shell elements are used to make the assemblies to be joined in the FE model discrete in
conformity with Belytschko-Tsay element formulation. These shell elements are mostly used
in the sheet metal forming simulation and describing the behavior up to 5 integration levels
above the virtual sheet thickness. The specific integration levels of the shell elements are
mapped with the stress deposited in the mapping file during the mapping procedure described
in Figure 3 (ref. with Step 3) to reach the distortion measured in Point 2 in Figure 1. This
consciously enables the user to control the intensity of distortion of the simulation model.
Therefore, the fundamental idea is using optiSLang to access needed stress defined in the
mapping file and to use an optimizing algorithm to systematically modify them so that the
simulation model comes closest to the experimental reference during the calibration
processes.
Figure 4: Identifying the parameters on the 2-D shell element
Stress 1 Stress 2 Stress 3
Stress 4
Stress 5
Stress 6 Stress 7 Stress 8
Stress 9 Stress 10
parameter upper blank
parameter lower blank
connector element
upper blank
lower blank
connector element
2. Activate the spotweld connection
3. Implementation of substitude load 4. Calculation the Distortion
clamp surface (rigid)
1. Fixation the parts
parts
joining tools

5
No Parameters Lower
Bound
Upper
Bound No Parameters
Lower
Bound
Upper
Bound
1 Stress1_Oberblech -10 MPa 10 MPa 6 Stress1_Unterblech -10 MPa 10 MPa
2 Stress2_Oberblech -10 MPa 10 MPa 7 Stress2_Unterblech -10 MPa 10 MPa
3 Stress3_Oberblech -10 MPa 10 MPa 8 Stress3_Unterblech -10 MPa 10 MPa
4 Stress4_Oberblech -10 MPa 10 MPa 9 Stress4_Unterblech -10 MPa 10 MPa
5 Stress5_Oberblech -10 MPa 10 MPa 10 Stress5_Unterblech -10 MPa 10 MPa
Table 1: Selected parameters and their variation limits
The fact that both the upper and lower blanks are supposed to be mapped with substitute
mechanical loads independently produces a total of ten input parameters for optimization
(see Table 1). The input quantities derived that are supposed to describe the behavior of the
shell cross-section mathematically are shown in Figure 4. Furthermore, the parametrized
stress from the optimization algorithm can be continuously varied for the upper and lower
blank to search for the optimum design configuration where the pressure and tensile stresses
can assigned to the shell elements in the joining zone.
3.2 Objective criterion
Discrete measuring points are defined as targets on the entire surface of the assembly of the
calibrating model that give the space in the Z-direction of the simulation model (ACTUAL) to
the experimental reference (TARGET) at the end of a simulation run-through. Figure 5 shows
the definition of the targets on the calibration model.
Figure 5: Objective definition
To be able to take in the entirety of the measuring points, it is necessary to use a target
function to combine the effective interrelationships discovered into an optimization model.
The value of the target function is calculated from the total of the squared spaces between the
experiment and simulation at the specific measuring points. The objective of optimization is
minimizing this function value; in other words, minimizing the amount that the simulation
model and experimental reference differ from one another at all measuring points.
-0.20 -0.11
-0.06
-0.25
-0.24
-0.29
-0.38
-0.21
-0.33
-0.10
-0.05
-0.18
-0.01
0.32
-0.22
section A-A:
exp. reference (target)
simulation model
(actual) -0.20 -0.11
-0.24 -0.10
-0.01
measured
derivation
0,2 -0,5 0,1 0,0 -0,1 -0,2 -0,3 -0,4 [mm]
A A
Z
X
Y
X Y
Z
6
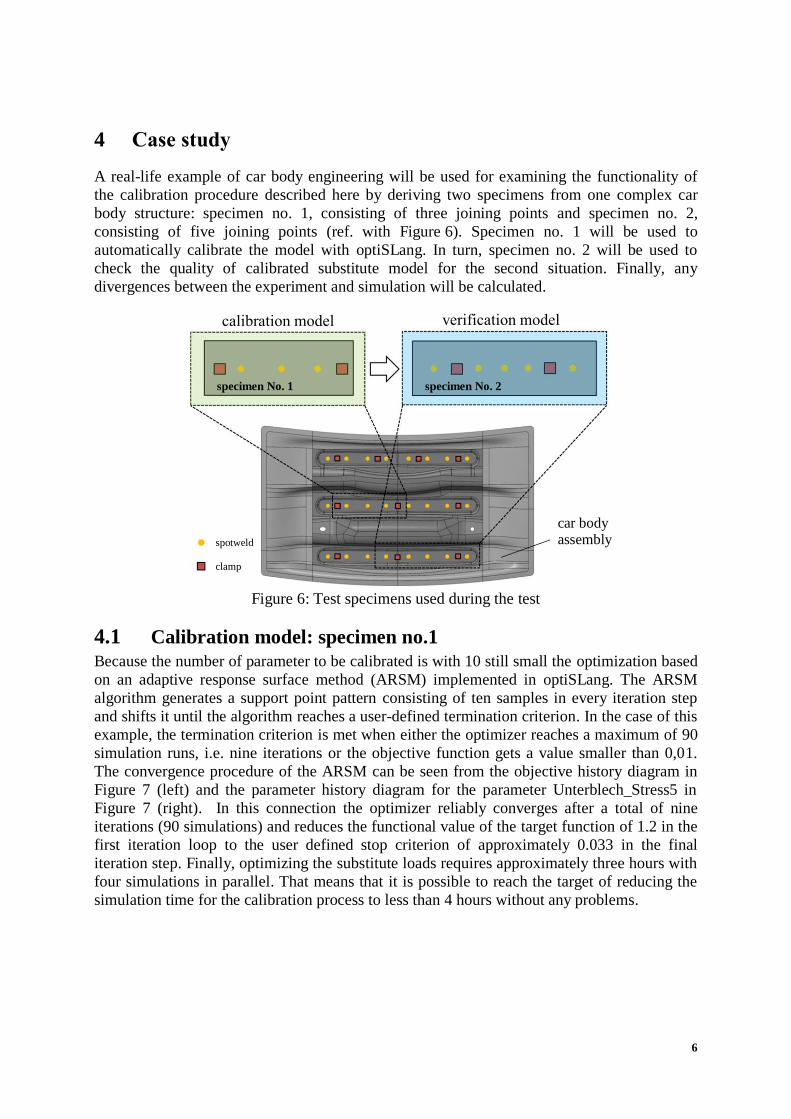
4 Case study
A real-life example of car body engineering will be used for examining the functionality of
the calibration procedure described here by deriving two specimens from one complex car
body structure: specimen no. 1, consisting of three joining points and specimen no. 2,
consisting of five joining points (ref. with Figure 6). Specimen no. 1 will be used to
automatically calibrate the model with optiSLang. In turn, specimen no. 2 will be used to
check the quality of calibrated substitute model for the second situation. Finally, any
divergences between the experiment and simulation will be calculated.
Figure 6: Test specimens used during the test
4.1 Calibration model: specimen no.1
Because the number of parameter to be calibrated is with 10 still small the optimization based
on an adaptive response surface method (ARSM) implemented in optiSLang. The ARSM
algorithm generates a support point pattern consisting of ten samples in every iteration step
and shifts it until the algorithm reaches a user-defined termination criterion. In the case of this
example, the termination criterion is met when either the optimizer reaches a maximum of 90
simulation runs, i.e. nine iterations or the objective function gets a value smaller than 0,01.
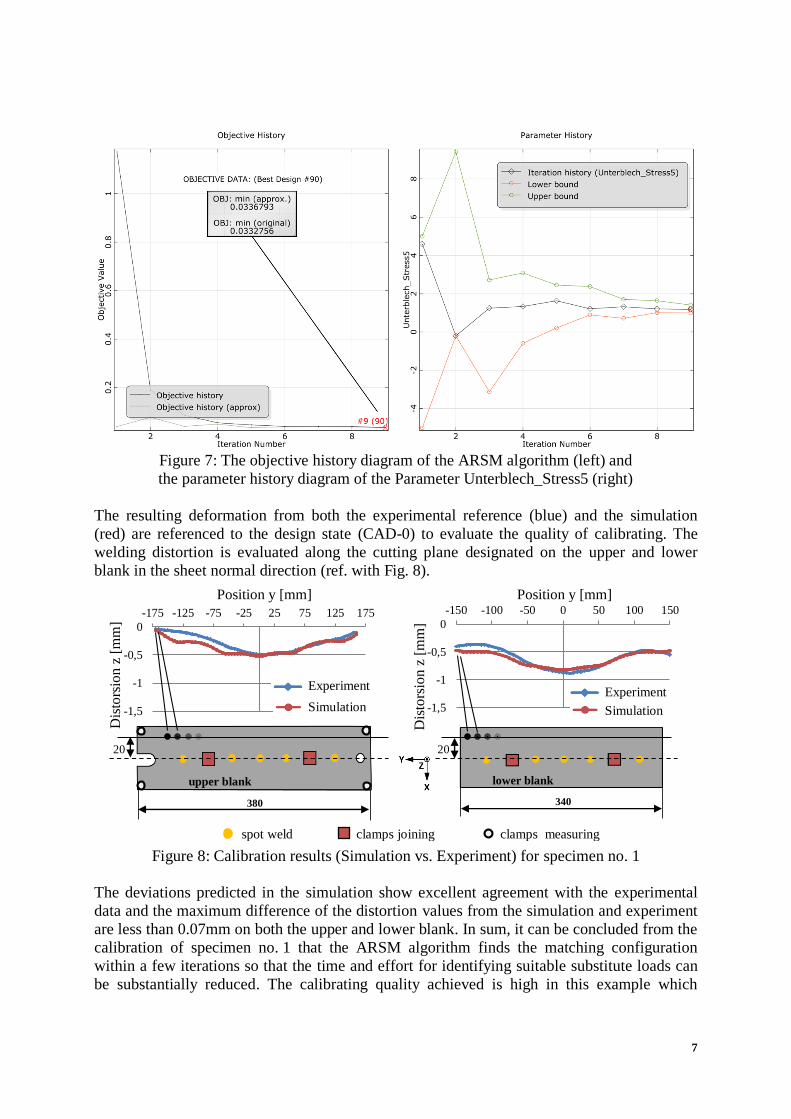
The convergence procedure of the ARSM can be seen from the objective history diagram in
Figure 7 (left) and the parameter history diagram for the parameter Unterblech_Stress5 in
Figure 7 (right). In this connection the optimizer reliably converges after a total of nine
iterations (90 simulations) and reduces the functional value of the target function of 1.2 in the
first iteration loop to the user defined stop criterion of approximately 0.033 in the final
iteration step. Finally, optimizing the substitute loads requires approximately three hours with
four simulations in parallel. That means that it is possible to reach the target of reducing the
simulation time for the calibration process to less than 4 hours without any problems.
specimen No. 1 specimen No. 2
car body assembly
verification model calibration model
clamp
spotweld
7
Figure 7: The objective history diagram of the ARSM algorithm (left) and
the parameter history diagram of the Parameter Unterblech_Stress5 (right)
The resulting deformation from both the experimental reference (blue) and the simulation
(red) are referenced to the design state (CAD-0) to evaluate the quality of calibrating. The
welding distortion is evaluated along the cutting plane designated on the upper and lower
blank in the sheet normal direction (ref. with Fig. 8).
Figure 8: Calibration results (Simulation vs. Experiment) for specimen no. 1
The deviations predicted in the simulation show excellent agreement with the experimental
data and the maximum difference of the distortion values from the simulation and experiment
are less than 0.07mm on both the upper and lower blank. In sum, it can be concluded from the
calibration of specimen no. 1 that the ARSM algorithm finds the matching configuration
within a few iterations so that the time and effort for identifying suitable substitute loads can
be substantially reduced. The calibrating quality achieved is high in this example which
-1,5
-1
-0,5
0
-175 -125 -75 -25 25 75 125 175
Experiment
Simulation -1,5
-1
-0,5
0
-150 -100 -50 0 50 100 150
Position y [mm]
380
Position y [mm]
340
clamps joining
spot weld
clamps measuring
20
Dis
tors
ion
z [
mm
]
Dis
tors
ion
z [
mm
]
Experiment Simulation
20
upper blank lower blank

8
makes it the prerequisite for achieving a high quality of results when transferring substitute
mechanical loads to more complex applications.
4.2 Verification model: specimen no.2
To verify the quality of results, the substitute loads calculated by the optimizer are transferred
to specimen no.2 (five joining points) without any change and Figure 9 shows appropriate
divergences between the experiment and simulation.
Figure 9: Comparison of measured and simulated distortions of specimen No. 2
(Calibration model: specimen No. 1)
The maximum deviation between the experiment and simulation is 0.05mm on the upper
blank and 0.1mm on the lower blank. These matches indicate that the high level of calibrating
quality of specimen no.1 makes the substitute mechanical model capable of predicting
reasonable distortions when it is transferred to more complex applications.
5 Conclusion
To date, substitute mechanical models were exclusively calibrated in an experienced-based
analytical process. So the substitute mechanical loads needed for matching the distortion had
to be calibrated by hand and based upon experience until the joining distortion from the
experiment and simulation agreed. This not only called for a high level of user expertise, but
especially time-consuming change loops. Therefore, this article demonstrated the potential of
optimization-based model calibration. The optimization algorithm used reduced the time and
effort for calibrating the substitute parameter to a couple of hours while maintaining a high
level of calibrating quality.
References
ACKERT, P.; SCHWARZ, C.; MAUERMANN, R.; LANDGREBE, D.: Tolerances and Measuring
Strategies in the Virtual Process Chain for Spot Welded Structures; Substitute Modeling
and Automating the Calibration Procedure. Applied Mechanics and Materials Vol. 974,
2015, pp. 3-10
Experiment
Simulation
Position y [mm]
256
Position y [mm]
225
clamps joining
spot weld clamps measuring
20
Dis
tors
ion
z [
mm
]
Dis
tors
ion
z [
mm
]
Experiment Simulation
20
upper blank lower blank

9
HU, M.; LIN, Z.; NI, J.: Simulation and analysis of assembly processes considering compliant,
non-ideal parts and tooling variations. International Journal for Machine tools &
Manufacture 41, 2001, p. 2233
BOHN, M.: Toleranzmanagement im Entwicklungsprozess: Reduzierung der Auswirkungen
von Toleranzen auf Zusammenbauten der Automobil-Karosserien. University Karlsruhe,
PhD thesis, 1998
ROHLEDER, M.: Simulation rückfederungsbedingter Formabweichungen im
Produktentstehungsprozess von Blechformteilen, University Dortmund, PhD thesis, 2001
GÖSLING, M.-J.: Metamodell unterstützte Simulation und Kompensation von Rückfederungen
in der Blechumformung, University Dortmund, PhD thesis, 2010
NEUGEBAUER, R., ET AL.: Predicting Dimensional Accuracy of Mechanically Joined Car Body
Assemblies. In: Key Engineering Materials 473 (2011), p. 973-980
NEUGEBAUER, R., ET AL.: Predicting Dimensional Accuracy of Laser Welded Aluminum Add-
On Body Parts. In: Key Engineering Materials 549 (2013), p. 463-470
ECKERT, A.: Prognose der Maßhaltigkeit punktförmig mechanisch gefügter
Karosseriebauteile, TU Chemnitz, PhD thesis, 2012.
ECKERT, A., ET AL.: Local–global approach using experimental and/or simulated data to
predict distortion caused by mechanical joining technologies In: Prod. Eng. Res. Devel. 7
(2013), p. 339–349
SCHÜTZLE, W.: Beitrag zur Prozesskettensimulation geschweißter Aluminium-
Karosserieanbauteile, TU Chemnitz, PhD thesis, 2014.
WILL, J.: The Calibration of Measurement and Simulation as Optimization Problem.
Presented at the NAFEMS Conference. Wiesbaden, Germany, May 2006 – URL http://www.dynardo.de/fileadmin/Material_Dynardo/bibliothek/Optimierung_Sensitiv
itaet/NAFEMS_will_2006_engl.pdf
SCHÜLER, H.; ET AL.: Einsatz von optiSLang zur Kalibrierung von numerischen Ofenmodellen
für die KTL-Tauchlackierung von Fahrzeugkarossen. Presented at the Weimar
Optimization and Stochastic Days 3.0. Weimar, Germany, November 2013 – URL http://www.dynardo.de/fileadmin/Material_Dynardo/bibliothek/WOST_3.0/WOST_3_Kali
brierungOfenmodell_De.pdf
MOST, T.; ET AL.: Calibration of Field Data and Simulation as an Optimization Task with
Signals. Presented at the NAFEMS World Congress. Salzburg, Austria, June 2013 – URL http://www.dynardo.de/fileadmin/Material_Dynardo/bibliothek/Parameteridentifikat
ion/Niemeier_ParameterID_NAFEMS_World_Congress_2013.pdf


![Guidelines on the Calibration of Automatic Catchweighing ... · control instrument or calibration of the test loads using the control instrument as a comparator are given in [2] and](https://img.pdfslide.net/doc/110x75/5f93b869471c273415392b42/guidelines-on-the-calibration-of-automatic-catchweighing-control-instrument.jpg)