Embed Size (px)
Citation preview
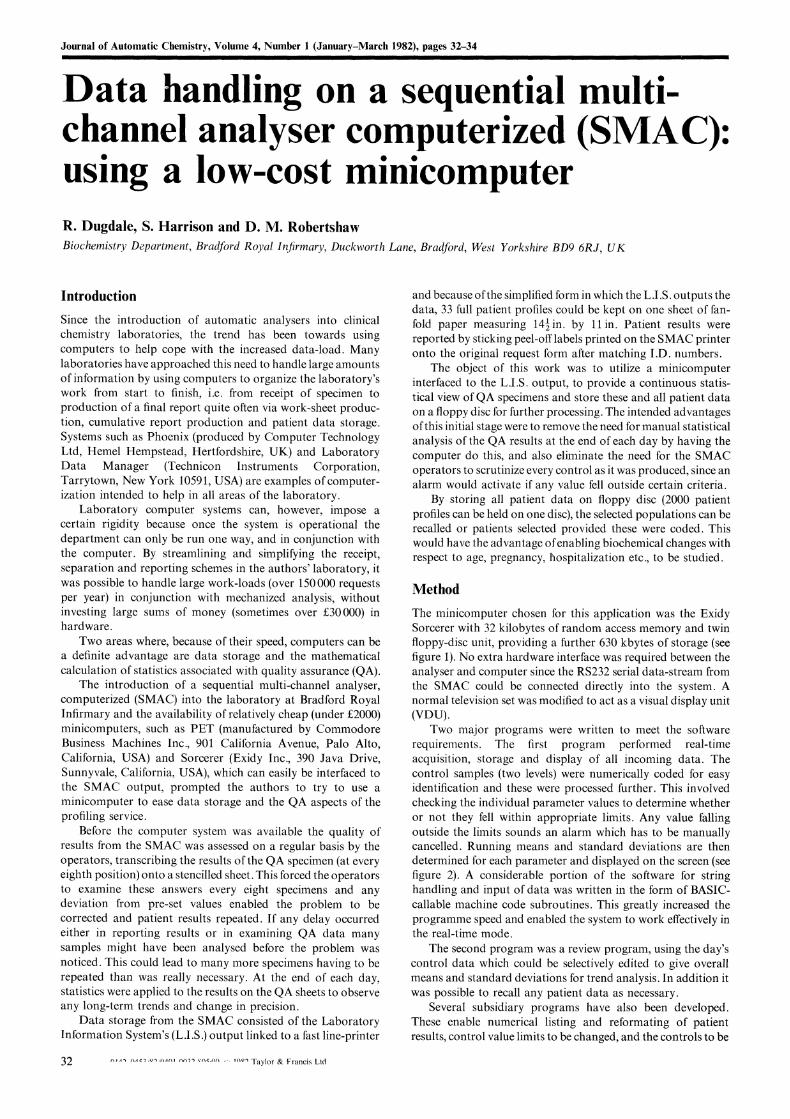
Journal of Automatic Chemistry, Volume 4, Number (January-March 1982), pages 32-34
Data handling on a sequential multi-channel analyser computerized (SMAC):using a low-cost minicomputerR. Dugdale, S. Harrison and D. M. RobertshawBiochemistry Department, Bradford Royal Infirmary, Duckworth Lane, Bradford, West Yorkshire BD9 6RJ, UK
Introduction
Since the introduction of automatic analysers into clinicalchemistry laboratories, the trend has been towards usingcomputers to help cope with the increased data-load. Manylaboratories have approached this need to handle large amountsof information by using computers to organize the laboratory’swork from start to finish, i.e. from receipt of specimen toproduction of a final report quite often via work-sheet produc-tion, cumulative report production and patient data storage.Systems such as Phoenix (produced by Computer TechnologyLtd, Hemel Hempstead, Hertfordshire, UK) and LaboratoryData Manager (Technicon Instruments Corporation,Tarrytown, New York 10591, USA) are examples of computer-ization intended to help in all areas of the laboratory.
Laboratory computer systems can, however, impose acertain rigidity because once the system is operational thedepartment can only be run one way, and in conjunction withthe computer. By streamlining and simplifying the receipt,separation and reporting schemes in the authors’ laboratory, itwas possible to handle large work-loads (over 150000 requestsper year) in conjunction with mechanized analysis, withoutinvesting large sums of money (sometimes over 30000) inhardware.
Two areas where, because of their speed, computers can bea definite advantage are data storage and the mathematicalcalculation of statistics associated with quality assurance (QA).
The introduction of a sequential multi-channel analyser,computerized (SMAC) into the laboratory at Bradford RoyalInfirmary and the availability of relatively cheap (under 2000)minicomputers, such as PET (manufactured by CommodoreBusiness Machines Inc., 901 California Avenue, Palo Alto,California, USA) and Sorcerer (Exidy Inc., 390 Java Drive,Sunnyvale, California, USA), which can easily be interfaced tothe SMAC output, prompted the authors to try to use aminicomputer to ease data storage and the QA aspects of theprofiling service.
Before the computer system was available the quality ofresults from the SMAC was assessed on a regular basis by theoperators, transcribing the results of the QA specimen (at everyeighth position) onto a stencilled sheet. This forced the operatorsto examine these answers every eight specimens and anydeviation from pre-set values enabled the problem to becorrected and patient results repeated. If any delay occurredeither in reporting results or in examining QA data manysamples might have been analysed before the problem wasnoticed. This could lead to many more specimens having to berepeated than was really necessary. At the end of each day,statistics were applied to the results on the QA sheets to observeany long-term trends and change in precision.
Data storage from the SMAC consisted of the LaboratoryInformation System’s (L.I.S.)output linked to a fast line-printer
32 Taylor & Francis Lid
and because ofthe simplified form in which the L.I.S. outputs thedata, 33 full patient profiles could be kept on one sheet of fan-fold paper measuring 141/2in. by 11 in. Patient results werereported by sticking peel-offlabels printed on the SMAC printeronto the original request form after matching I.D. numbers.
The object of this work was to utilize a minicomputerinterfaced to the L.I.S. output, to provide a continuous statis-tical view of QA specimens and store these and all patient dataon a floppy disc for further processing. The intended advantagesofthis initial stage were to remove the need for manual statisticalanalysis of the QA results at the end of each day by having thecomputer do this, and also eliminate the need for the SMACoperators to scrutinize every control as it was produced, since analarm would activate if any value fell outside certain criteria.
By storing all patient data on floppy disc (2000 patientprofiles can be held on one disc), the selected populations can berecalled or patients selected provided these were coded. Thiswould have the advantage ofenabling biochemical changes withrespect to age, pregnancy, hospitalization etc., to be studied.
Method
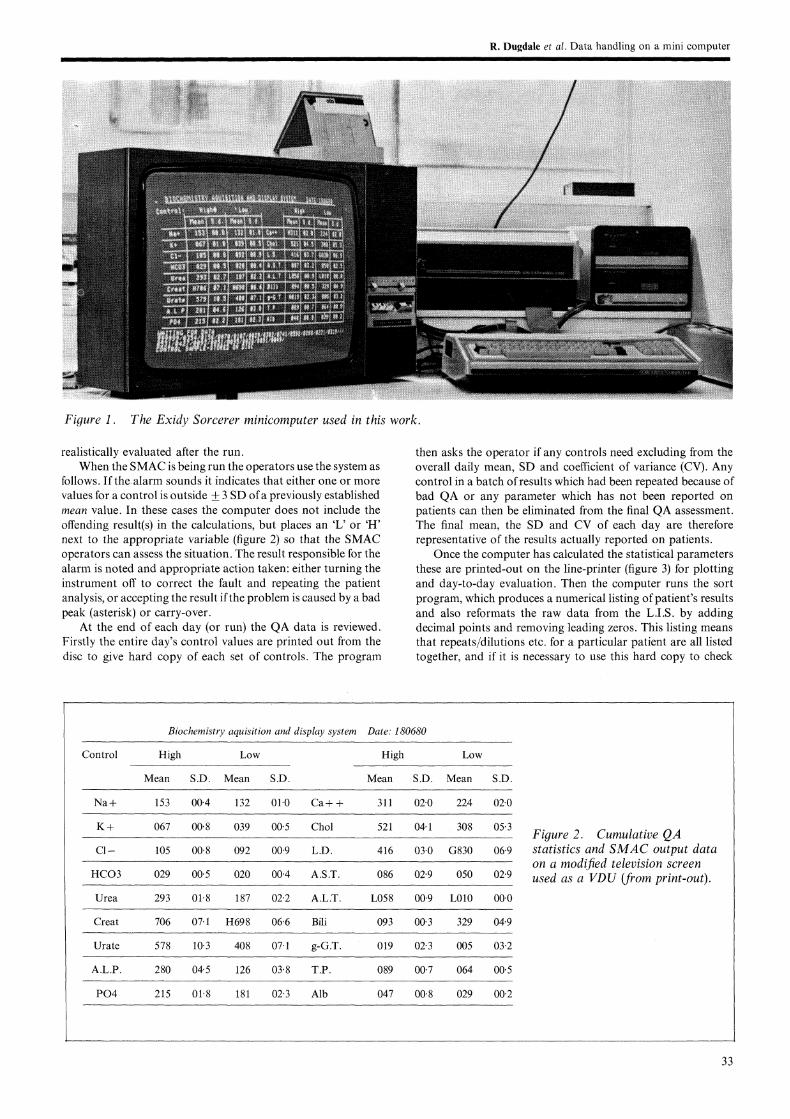
The minicomputer chosen for this application was the ExidySorcerer with 32 kilobytes of random access memory and twinfloppy-disc unit, providing a further 630 kbytes of storage (seefigure 1). No extra hardware interface was required between theanalyser and computer since the RS232 serial data-stream fromthe SMAC could be connected directly into the system. Anormal television set was modified to act as a visual display unit(VDU).
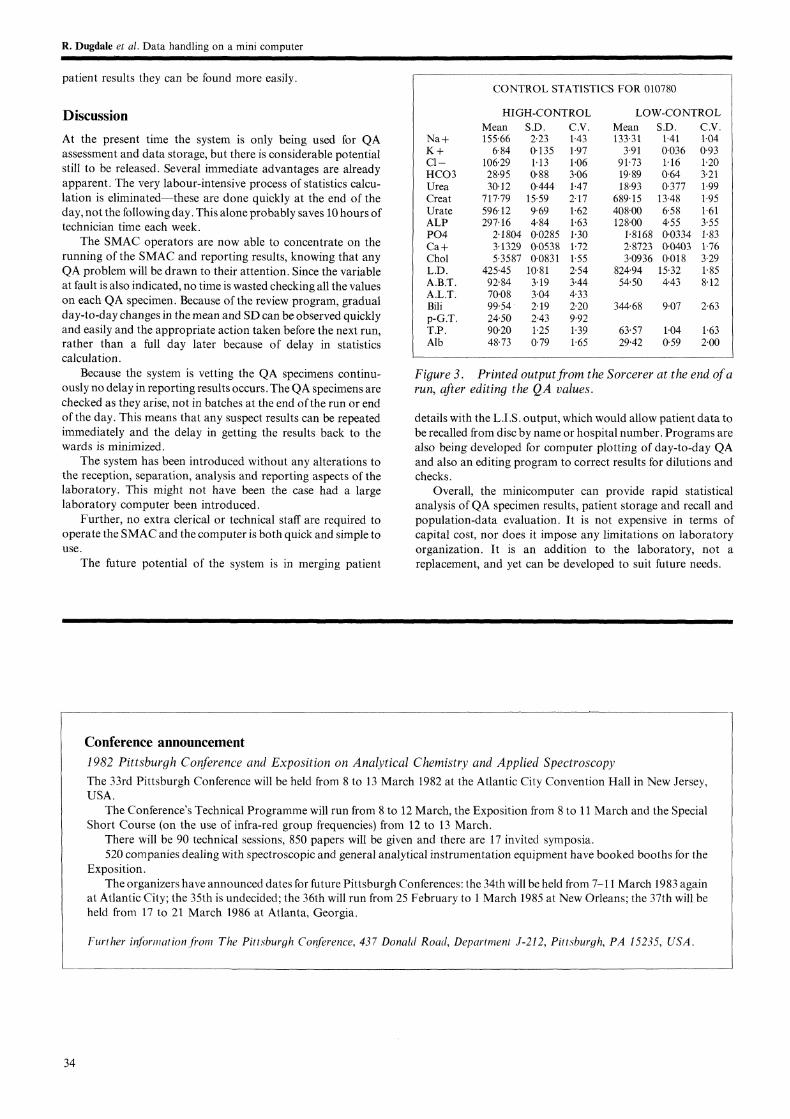
Two major programs were written to meet the softwarerequirements. The first program performed real-timeacquisition, storage and display of all incoming data. Thecontrol samples (two levels) were numerically coded for easyidentification and these were processed further. This involvedchecking the individual parameter values to determine whetheror not they fell within appropriate limits. Any value fallingoutside the limits sounds an alarm which has to be manuallycancelled. Running means and standard deviations are thendetermined for each parameter and displayed on the screen (seefigure 2). A considerable portion of the software for stringhandling and input of data was written in the form of BASIC-callable machine code subroutines. This greatly increased theprogramme speed and enabled the system to work effectively inthe real-time mode.
The second program was a review program, using the day’scontrol data which could be selectively edited to give overallmeans and standard deviations for trend analysis. In addition itwas possible to recall any patient data as necessary.
Several subsidiary programs have also been developed.These enable numerical listing and reformating of patientresults, control value limits to be changed, and the controls to be
R. Dugdale et al. Data handling on a mini computer
Figure 1. The Exidy Sorcerer minicomputer used in this work.
realistically evaluated after the run.When the SMAC is being run the operators use the system as
follows. If thealarm sounds it indicates that either one or morevalues for a control is outside +_ 3 SD ofa previously establishedmean value. In these cases the computer does not include theoffending result(s) in the calculations, but places an ’L’ or ’H’next to the appropriate variable (figure 2) so that the SMACoperators can assess the situation. The result responsible for thealarm is noted and appropriate action taken: either turning theinstrument off to correct the fault and repeating the patientanalysis, or accepting the result ifthe problem is caused by a badpeak (asterisk) or carry-over.
At the end of each day (or run) the QA data is reviewed.Firstly the entire day’s control values are printed out from thedisc to give hard copy of each set of controls. The program
then asks the operator if any controls need excluding from theoverall daily mean, SD and coefficient of variance (CV). Anycontrol in a batch ofresults which had been repeated because ofbad QA or any parameter which has not been reported onpatients can then be eliminated from the final QA assessment.The final mean, the SD and CV of each day are thereforerepresentative of the results actually reported on patients.
Once the computer has calculated the statistical parametersthese are printed-out on the line-printer (figure 3) for plottingand day-to-day evaluation. Then the computer runs the sortprogram, which produces a numerical listing of patient’s resultsand also reformats the raw data from the L.I.S. by addingdecimal points and removing leading zeros. This listing meansthat repeats/dilutions etc. for a particular patient are all listedtogether, and if it is necessary to use this hard copy to check
Biochemistry aquisition and display system Date." 180680
Control High Low High Low
Mean S.D. Mean S.D. Mean S.D. Mean S.D.
Na+ 153 00.4 132 01.0 Ca+ + 311 02.0 224 02.0
K + 067 00.8 039 00.5 Chol 521 04.1 308 05.3
C1- 105 00.8 092 00.9 L.D. 416 03.0 G830 06.9
HCO3 029 00.5 020 00.4 A.S.T. 086 02.9 050 02:9
Urea 293 01.8 187 02.2 A.L.T. L058 00.9 L010 00.0
Creat 706 07.1 H698 06.6 Bili 093 00.3 329 04.9
Urate 578 10.3 408 07.1 g-G.T. 019 02.3 005 03.2
A.L.P. 280 04.5 126 03.8 T.P. 089 00.7 064 00.5
PO4 215 01.8 181 02.3 Alb 047 00.8 029 00.2
Figure 2. Cumulative QAstatistics and SMAC output dataon a modified television screenused as a VDU rom print-out).
33
R. Dugdale et al. Data handling on a mini computer
patient results they can be found more easily.
Discussion
At the present time the system is only being used for QAassessment and data storage, but there is considerable potentialstill to be released. Several immediate advantages are alreadyapparent. The very labour-intensive process of statistics calcu-lation is eliminatedthese are done quickly at the end of theday, not the following day. This alone probably saves 10 hours oftechnician time each week.
The SMAC operators are now able to concentrate on therunning of the SMAC and reporting results, knowing that anyQA problem will be drawn to their attention. Since the variableat fault is also indicated, no time is wasted checking all the valueson each QA specimen. Because of the review program, gradualday-to-day changes in the mean and SD can be observed quicklyand easily and the appropriate action taken before the next run,rather than a full day later because of delay in statisticscalculation.
Because the system is vetting the QA specimens continu-ously no delay in reporting results occurs. The QA specimens arechecked as they arise, not in batches at the end ofthe run or endof the day. This means that any suspect results can be repeatedimmediately and the delay in getting the results back to thewards is minimized.
The system has been introduced without any alterations tothe reception, separation, analysis and reporting aspects of thelaboratory. This might not have been the case had a largelaboratory computer been introduced.
Further, no extra clerical or technical staff are required tooperate the SMAC and the computer is both quick and simple touse.
The future potential of the system is in merging patient
Na+K+C1-HCO3UreaCreatUrateALPPO4Ca+CholL.D.A.B.T.A.L.T.Bilip-G.T.T.P.Alb
CONTROL STATISTICS FOR 010780
HIGH-CONTROL LOW-CONTROLMean S.D. C.V. Mean S.D. C.V.155.66 2.23 1.43 133.31 1.41 1.04
6.84 0.135 1.97 3.91 0’036 0.93106.29 1.13 1.06 91.73 1.16 1.2028.95 0.88 3’06 19.89 0.64 3.2130.12 0.444 1.47 18’93 0.377 1.99
717.79 15.59 2.17 689’15 13.48 1.95596.12 9.69 1.62 408-00 6.58 1.61297.16 4.84 1.63 128.00 4.55 3.55
2.1804 0.0285 1.30 1.8168 0.0334 1.833-1329 0.0538 1.72 2.8723 0.0403 1.765.3587 0.0831 1.55 3"0936 0.018 3.29
425.45 10.81 2.54 824.94 15.32 1.8592.84 3.19 3.44 54"50 4.43 8.1270.08 3-04 4.3399.54 2.19 2.20 344.68 9.07 2.6324.50 2.43 9.9290.20 1.25 1"39 63"57 1.04 1.6348.73 0.79 1.65 29.42 0’59 2.00
Figure 3. Printed outputfrom the Sorcerer at the end ofarun, after editing the QA values.
details with the L.I.S. output, which would allow patient data tobe recalled from disc by name or hospital number. Programs arealso being developed for computer plotting of day-to-day QAand also an editing program to correct results for dilutions andchecks.
Overall, the minicomputer can provide rapid statisticalanalysis of QA specimen results, patient storage and recall andpopulation-data evaluation. It is not expensive in terms ofcapital cost, nor does it impose any limitations on laboratoryorganization. It is an addition to the laboratory, not areplacement, and yet can be developed to suit future needs.
Conference announcement1982 Pittsburgh Conference and Exposition on Analytical Chemistry and Applied SpectroscopyThe 33rd Pittsburgh Conference will be held from 8 to 13 March 1982 at the Atlantic City Convention Hall in New Jersey,USA.
The Conference’s Technical Programme will run from 8 to 12 March, the Exposition from 8 to 11 March and the SpecialShort Course (on the use of infra-red group frequencies) from 12 to 13 March.
There will be 90 technical sessions, 850 papers will be given and there are 17 invited symposia.520 companies dealing with spectroscopic and general analytical instrumentation equipment have booked booths for the
Exposition.The organizers have announced dates for future Pittsburgh Conferences: the 34th will be held from 7-11 March 1983 again
at Atlantic City; the 35th is undecided; the 36th will run from 25 February to March 1985 at New Orleans; the 37th will beheld from 17 to 21 March 1986 at Atlanta, Georgia.
Further infortlation.from The Pittsburgh Conference, 437 Donahi Road, Department J-212, Pittsburgh, PA I5235, USA.
34

Submit your manuscripts athttp://www.hindawi.com
Hindawi Publishing Corporationhttp://www.hindawi.com Volume 2014
Inorganic ChemistryInternational Journal of
Hindawi Publishing Corporation http://www.hindawi.com Volume 2014
International Journal ofPhotoenergy
Hindawi Publishing Corporationhttp://www.hindawi.com Volume 2014
Carbohydrate Chemistry
International Journal of
Hindawi Publishing Corporationhttp://www.hindawi.com Volume 2014
Journal of
Chemistry
Hindawi Publishing Corporationhttp://www.hindawi.com Volume 2014
Advances in
Physical Chemistry
Hindawi Publishing Corporationhttp://www.hindawi.com
Analytical Methods in Chemistry
Journal of
Volume 2014
Bioinorganic Chemistry and ApplicationsHindawi Publishing Corporationhttp://www.hindawi.com Volume 2014
SpectroscopyInternational Journal of
Hindawi Publishing Corporationhttp://www.hindawi.com Volume 2014
The Scientific World JournalHindawi Publishing Corporation http://www.hindawi.com Volume 2014
Medicinal ChemistryInternational Journal of
Hindawi Publishing Corporationhttp://www.hindawi.com Volume 2014
Chromatography Research International
Hindawi Publishing Corporationhttp://www.hindawi.com Volume 2014
Applied ChemistryJournal of
Hindawi Publishing Corporationhttp://www.hindawi.com Volume 2014
Hindawi Publishing Corporationhttp://www.hindawi.com Volume 2014
Theoretical ChemistryJournal of
Hindawi Publishing Corporationhttp://www.hindawi.com Volume 2014
Journal of
Spectroscopy
Analytical ChemistryInternational Journal of
Hindawi Publishing Corporationhttp://www.hindawi.com Volume 2014
Journal of
Hindawi Publishing Corporationhttp://www.hindawi.com Volume 2014
Quantum Chemistry
Hindawi Publishing Corporationhttp://www.hindawi.com Volume 2014
Organic Chemistry International
ElectrochemistryInternational Journal of
Hindawi Publishing Corporation http://www.hindawi.com Volume 2014
Hindawi Publishing Corporationhttp://www.hindawi.com Volume 2014
CatalystsJournal of