Embed Size (px)
Citation preview
Automatic Detection of Performance Deviations in
the Load Testing of Large Scale SystemsHaroon Malik
1, Hadi Hemmati
2, Ahmed E. Hassan
1
1 Software Analysis and Intelligence Lab (SAIL)
School of Computing, Queen’s University, Kingston, Canada
{malik, ahmed}@cs.queensu.ca 2 David R. Cheriton School of Computer Science
University of Waterloo, Waterloo, Canada
Abstract—Load testing is one of the means for evaluating the
performance of Large Scale Systems (LSS). At the end of a
load test, performance analysts must analyze thousands of
performance counters from hundreds of machines under test.
These performance counters are measures of run-time system
properties such as CPU utilization, Disk I/O, memory
consumption, and network traffic. Analysts observe counters to
find out if the system is meeting its Service Level Agreements
(SLAs). In this paper, we present and evaluate one supervised
and three unsupervised approaches to help performance
analysts to 1) more effectively compare load tests in order to
detect performance deviations which may lead to SLA
violations, and 2) to provide them with a smaller and
manageable set of important performance counters to assist in
root-cause analysis of the detected deviations. Our case study is
based on load test data obtained from both a large scale
industrial system and an open source benchmark application.
The case study shows, that our wrapper-based supervised
approach, which uses a search-based technique to find the best
subset of performance counters and a logistic regression model
for deviation prediction, can provide up to 89% reduction in
the set of performance counters while detecting performance
deviations with few false positives (i.e., 95% average precision).
The study also shows that the supervised approach is more
stable and effective than the unsupervised approaches but it
has more overhead due to its semi-automated training phase.
Index Terms—Performance, Signature, Machine Learning.
I. INTRODUCTION
Large scale systems such as Amazon, Ebay, Google and
many modern web services are composed of thousands of
machines running complex applications. These systems
generate revenue by providing services, supporting a large
user base. Therefore, any performance degradations in their
systems can result in large monetary losses. For instance, an
hour-long PayPal outage may have prevented up to $7.2
million in customers transactions [1].
To detect early performance problems in a system before
they become critical field problems, performance analysts
use load testing. Load testing, in general, refers to the
practice of assessing a system’s behavior under heavy load.
Unfortunately, current load test analysis practices are
laborious, time consuming and error prone. Existing research
on load testing focuses primarily on the automatic generation
of load test suites [2]. However, there is limited research on
how to effectively analyze the load tests of LSS which
generate terabytes of performance related data.
During a load test, which may span over many days,
usually one or more load generators simulate thousands of
concurrent transactions [3].The application under test is
closely monitored and a very large volume of performance
counter data is logged. These performance counters capture
the performance properties of the system, e.g. CPU
utilization, disk I/O, queues and network traffic, at run-time.
Such information is of vital interest to performance analysts.
The information helps them observe the system’s behavior
under load by comparing against already documented
behavior from past similar tests. In cases where such
documented behavior does not exist, e.g., for a new
component, product or a major release under test,
performance analysts use their domain knowledge and
experience to decide about the expected behavior.
In our previous work [4], we introduced an unsupervised
approach to automate the load test analysis. In this paper, we
propose two additional unsupervised approaches, as
comparison baselines, along with a new supervised approach
for the same type of analysis. All four approaches use
performance counter data obtained from a load test to
construct performance signatures. These signatures are
minimal sets of performance counters that describe the
essential characteristics of a System Under Test (SUT) for a
given load test. Analyzing the load data of signatures rather
than the entire data helps to 1) effectively compare a load test
with baseline tests in order to detect performance deviations,
and 2) provide the analyst with a manageable set of
performance counters for root-cause analysis. We identify
the main contributions of this paper as:
We provide accurate and novel approaches for
automatically detecting performance deviations in a load
test, with minimum domain knowledge.
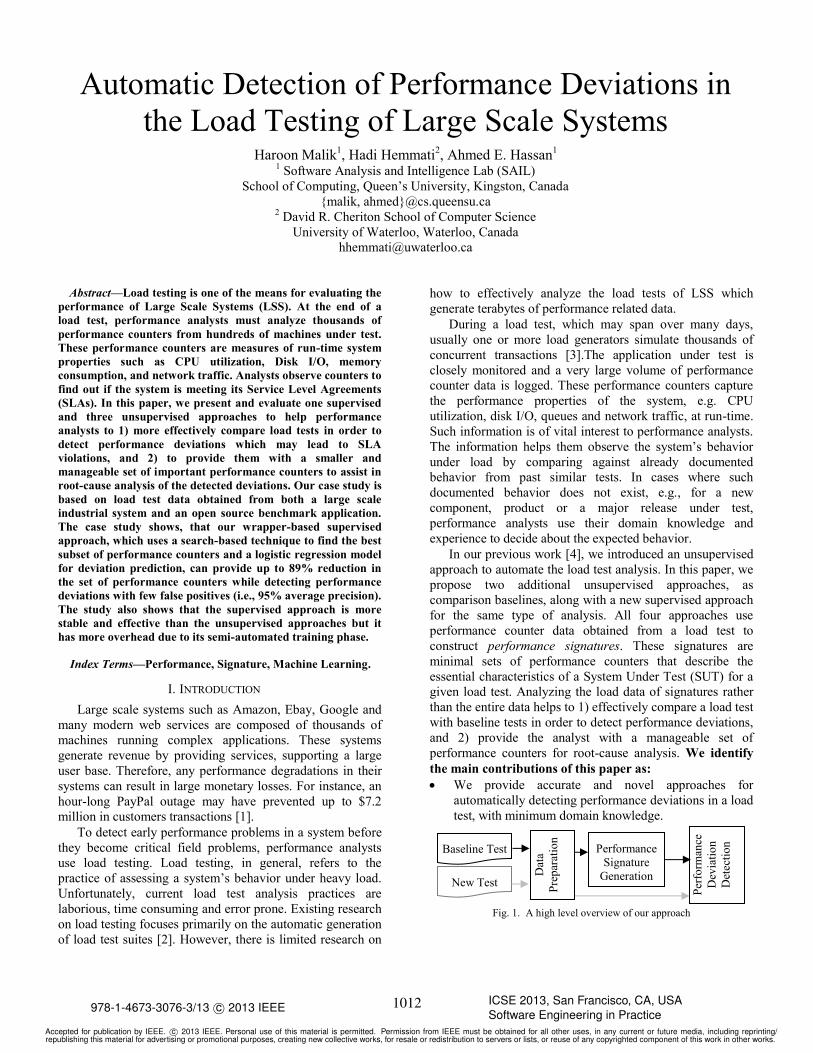
Fig. 1. A high level overview of our approach
Baseline Test
New Test
Per
form
ance
Dev
iati
on
Det
ecti
on
Performance
Signature
Generation
Dat
a
Pre
par
atio
n
978-1-4673-3076-3/13 c© 2013 IEEE ICSE 2013, San Francisco, CA, USASoftware Engineering in Practice
Accepted for publication by IEEE. c© 2013 IEEE. Personal use of this material is permitted. Permission from IEEE must be obtained for all other uses, in any current or future media, including reprinting/republishing this material for advertising or promotional purposes, creating new collective works, for resale or redistribution to servers or lists, or reuse of any copyrighted component of this work in other works.
1012

In both industrial and open-source settings, we
empirically evaluate and compare the effectiveness of
our approaches and show that we can achieve up to 95%
average precision and 94% average recall.
II. AUTOMATED ANALYSIS OF LOAD TESTS
A typical load test consists of a) test environment setup,
b) load generation, c) load test execution, and d) load test
analysis, which is the focus of this paper. In practice,
analysts use personal judgment together with the opinion of
experts and senior analysts, to decide whether the results of a
load test show any deviation from a baseline or not.
However, extensive knowledge of the subsystems and their
related counters is required for thoroughly analyzing the
performance counter data and to timely isolate performance
problems [5] [4]. Therefore, in this paper, we propose and
compare automated approaches for performance deviation
detection. These approaches help analysts analyze load test
results more effectively, and provide them with a smaller and
manageable set of important performance counters to assist
in the root-cause analysis of the deviations.
Our high-level approach, shown in Fig.1, is based on
reducing the size of the performance counter data to a small
signature and comparing the signature of a load test with the
signature of its baseline test. As discussed, the signature-
based approach is chosen to assist the analyst in further root-
cause analysis. It is much easier to inspect a few performance
counters than to inspect the entire (hundreds or thousands)
set of counters that are recorded during a test.
The deviation detection process starts with preparing
performance data of the load test and the baseline test. One
of the main reasons for data preparation is to deal with the
‘missing data’. Due to the distributed nature of large scale
systems, performance counter data may miss some data or
contain empty counter variables. A performance counter data
is missing when performance monitors fail to record some
observations of a performance counter variable (e.g. % CPU
Utilization) due to reasons such as bandwidth congestion,
system freeze, or overflow of I/O buffers. A counter variable
is entirely empty when a resource under monitoring cannot
start the service for collecting counter values. We sanitize the
performance counter data by removing empty counter
variables. The missing performance counter data is handled
through the use of list-wise deletion, i.e. excluding the entire
record if any single performance counter value is missing in
the record [6].
To shrink the data to the important counters, a
performance counter signature is generated from the list of
performance counters of the baseline test, which can be seen
as a dimension reduction problem. Next, a similar set of
counters is extracted from the new load test run. In case, a
performance counter that is part of the baseline load test
signature cannot be extracted from the new load test run, the
respective performance counter is eliminated from the
baseline signature. The signature cannot be extracted from
the new load test due to numerous reasons such as:
TABLE I. OUR SIGNATURE AND DEVIATION DETECTION APPROACHES
Type Signature generation Deviation detection
Un-
supervised
Random sampling Control Chart
Clustering (K-Means)
PCA PCA Weights (loadings)
Supervised WRAPPER Logistic regression
a) the removal of counter data during data preparation, b) the
failure of logging as performance counter resources may
become unavailable during the course of a test (unreachable
due to bandwidth saturation or network problem), and c) the
inability of the monitoring agent to start a thread at a
monitoring station to sample a resource. Finally, the values
of the signature (selected performance counters) of the
current load test are compared with the baseline test data.
The deviations are reported as anomalies and the signature is
sent for investigation a part of the root-cause analysis.
TABLE I summarizes our approaches. We use two basic
dimension reduction algorithms, random and clustering,
mostly as baseline of comparison for signature generation.
We also introduce two more advanced approaches, one
supervised (WRAPPER) and one unsupervised (PCA), to
explore the possibility of improving the baselines. We keep
the baseline deviation detection approaches as simple as
possible by using the simple and yet effective control chart
[7]. We could have used control charts for the advanced
deviation detection approaches as well; however, we decided
to use customized deviation detection techniques per
approach to maximize their effectiveness. We use PCA
weights for the PCA approach and logistic regression for the
WRAPPER approach. These techniques make use of the
readily available information per approach. In the rest of this
section, we explain these approaches in more detail.
Note that all these approaches require the data
preparation step. In addition, the supervised approach needs
the normal and abnormal performance counter values to be
labeled in some baseline tests. However, the unsupervised
approaches do not need any such extra knowledge.
A. Random Sampling Approach
Motivation: This approach uses a random sampling
algorithm for signature generation and a control chart for
performance deviation detection. The motivation behind this
approach is to use the most basic baseline for comparing the
performance against our other proposed anomaly detection
approaches.
Signature Generation: The simplest approach to reduce
the performance counters and make a small signature is to
randomly select some counters from the pool of all
performance counters recorded during a load test. The only
question left to answer for random sampling is the number of
counters to select. We use 20 performance counters to
construct a signature. This comes from our experience with
practitioners (performance analysts of our industrial partner)
and their “preferred” maximum manageable signature size.
Note that, generally, this maximum size depends on the
testers’ preferences and the systems size. We also look into
1013
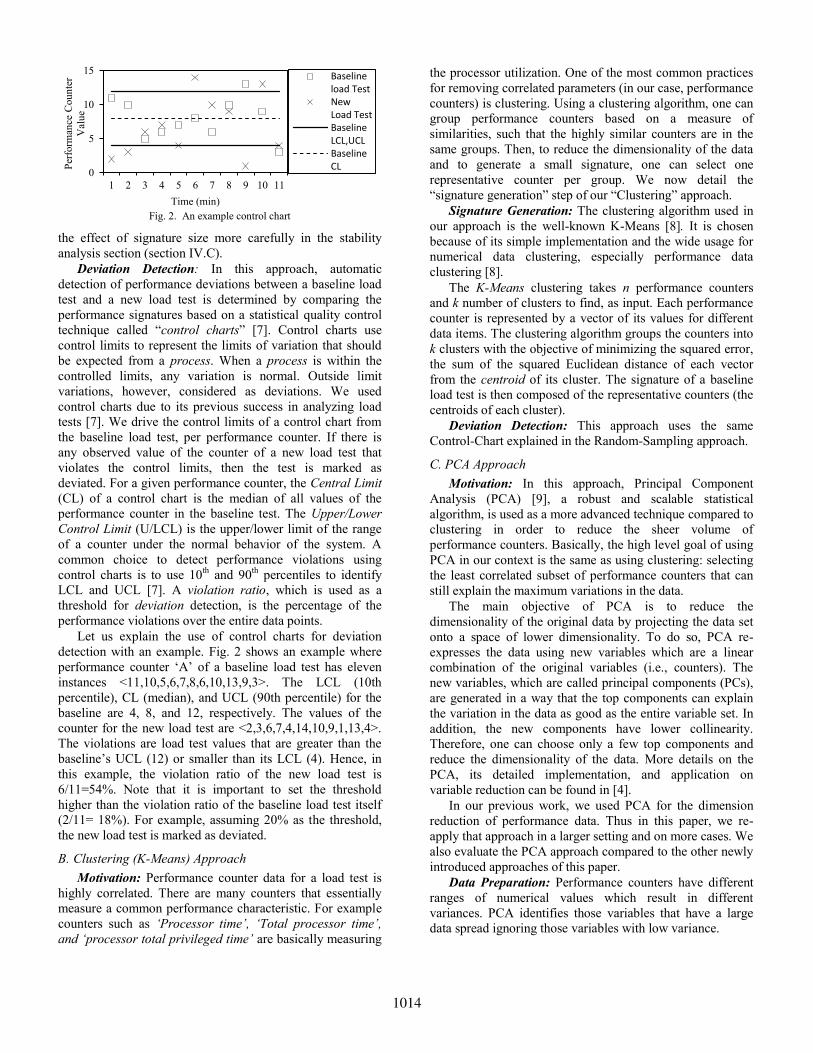
Fig. 2. An example control chart
the effect of signature size more carefully in the stability
analysis section (section IV.C).
Deviation Detection: In this approach, automatic
detection of performance deviations between a baseline load
test and a new load test is determined by comparing the
performance signatures based on a statistical quality control
technique called “control charts” [7]. Control charts use
control limits to represent the limits of variation that should
be expected from a process. When a process is within the
controlled limits, any variation is normal. Outside limit
variations, however, considered as deviations. We used
control charts due to its previous success in analyzing load
tests [7]. We drive the control limits of a control chart from
the baseline load test, per performance counter. If there is
any observed value of the counter of a new load test that
violates the control limits, then the test is marked as
deviated. For a given performance counter, the Central Limit
(CL) of a control chart is the median of all values of the
performance counter in the baseline test. The Upper/Lower
Control Limit (U/LCL) is the upper/lower limit of the range
of a counter under the normal behavior of the system. A
common choice to detect performance violations using
control charts is to use 10th and 90
th percentiles to identify
LCL and UCL [7]. A violation ratio, which is used as a
threshold for deviation detection, is the percentage of the
performance violations over the entire data points.
Let us explain the use of control charts for deviation
detection with an example. Fig. 2 shows an example where
performance counter ‘A’ of a baseline load test has eleven
instances <11,10,5,6,7,8,6,10,13,9,3>. The LCL (10th
percentile), CL (median), and UCL (90th percentile) for the
baseline are 4, 8, and 12, respectively. The values of the
counter for the new load test are <2,3,6,7,4,14,10,9,1,13,4>.
The violations are load test values that are greater than the
baseline’s UCL (12) or smaller than its LCL (4). Hence, in
this example, the violation ratio of the new load test is
6/11=54%. Note that it is important to set the threshold
higher than the violation ratio of the baseline load test itself
(2/11= 18%). For example, assuming 20% as the threshold,
the new load test is marked as deviated.
B. Clustering (K-Means) Approach
Motivation: Performance counter data for a load test is
highly correlated. There are many counters that essentially
measure a common performance characteristic. For example
counters such as ‘Processor time’, ‘Total processor time’,
and ‘processor total privileged time’ are basically measuring
the processor utilization. One of the most common practices
for removing correlated parameters (in our case, performance
counters) is clustering. Using a clustering algorithm, one can
group performance counters based on a measure of
similarities, such that the highly similar counters are in the
same groups. Then, to reduce the dimensionality of the data
and to generate a small signature, one can select one
representative counter per group. We now detail the
“signature generation” step of our “Clustering” approach.
Signature Generation: The clustering algorithm used in
our approach is the well-known K-Means [8]. It is chosen
because of its simple implementation and the wide usage for
numerical data clustering, especially performance data
clustering [8].
The K-Means clustering takes n performance counters
and k number of clusters to find, as input. Each performance
counter is represented by a vector of its values for different
data items. The clustering algorithm groups the counters into
k clusters with the objective of minimizing the squared error,
the sum of the squared Euclidean distance of each vector
from the centroid of its cluster. The signature of a baseline
load test is then composed of the representative counters (the
centroids of each cluster).
Deviation Detection: This approach uses the same
Control-Chart explained in the Random-Sampling approach.
C. PCA Approach
Motivation: In this approach, Principal Component
Analysis (PCA) [9], a robust and scalable statistical
algorithm, is used as a more advanced technique compared to
clustering in order to reduce the sheer volume of
performance counters. Basically, the high level goal of using
PCA in our context is the same as using clustering: selecting
the least correlated subset of performance counters that can
still explain the maximum variations in the data.
The main objective of PCA is to reduce the
dimensionality of the original data by projecting the data set
onto a space of lower dimensionality. To do so, PCA re-
expresses the data using new variables which are a linear
combination of the original variables (i.e., counters). The
new variables, which are called principal components (PCs),
are generated in a way that the top components can explain
the variation in the data as good as the entire variable set. In
addition, the new components have lower collinearity.
Therefore, one can choose only a few top components and
reduce the dimensionality of the data. More details on the
PCA, its detailed implementation, and application on
variable reduction can be found in [4].
In our previous work, we used PCA for the dimension
reduction of performance data. Thus in this paper, we re-
apply that approach in a larger setting and on more cases. We
also evaluate the PCA approach compared to the other newly
introduced approaches of this paper.
Data Preparation: Performance counters have different
ranges of numerical values which result in different
variances. PCA identifies those variables that have a large
data spread ignoring those variables with low variance.
0
5
10
15
1 2 3 4 5 6 7 8 9 10 11
Per
form
ance
Cou
nte
r
Val
ue
Time (min)
Baselineload TestNewLoad TestBaselineLCL,UCLBaselineCL
1014

TABLE II. PRINCIPAL
COMPONENT ANALYSIS TABLE III. PERFORMANCE
SIGNATURE
Eigen
Value
Variability
PC (%) Cumulative
PC1 11.4 63.5 63.5
PC2 2.4 15.2 78.7
PC3 1.7 9.5 88.3
PC4 0.9 5.1 93.4
⁞ ⁞
⁞ ⁞
⁞ ⁞
⁞ ⁞
PC12 0.1 0.0 100.0
Rank PC Counter Variable Weight
1 PC1 % CPU Time 0.974
2 PC1 % Disk Time 0.872
3 PC1 Disk Write/sec 0.866
4 PC1 Available Bytes 0.746
5 PC1 Pages/sec 0.644
6 PC1 Database Cache
Request/Sec 0.433
7 PC2 Network Interface
Bytes Total/sec 0.212
To eliminate PCA bias towards those variables with a
larger variance, we standardized the performance counter via
Unit Variance Scaling, i.e. dividing the observation of each
counter variable by the variable’s standard deviation [6].
Thus, after standardizing, the variance of each performance
counter variable is equal to 1.0.
Signature Generation: Let us explain the signature
generation phase with an example. Assume we have 18
performance counters and we want to generate a signature
(with a reduced size) out of these counters. TABLE II shows
the partial results of applying PCA to our example
performance counter data. PCA projects the 18 counters into
12 PCs. The eigenvalue measures how much of the variation
in the dataset is explained by each PC. For example, PC1
accounts for 11.431/18*100=63.60% of the variability of the
entire performance counter dataset. To reduce the number of
variables, we need to decide on the minimum number of
components (top x) among the 12 PCs that capture sufficient
variability of our performance counter data. Deciding on the
top x PCs is a challenging problem. In this paper, we use “%
Cumulative Variability” for selecting the top x [9]. Based on
[6], using a 90% Cumulative Variability is adequate to
explain most of the data with minimal loss in information.
Thus we extract the first four PCs shown in TABLE II, as the
top x component to represent our performance counter data.
Now, the load test data can be represented by relatively few
PCs (4 PCs in this example rather than the original 12 PCs or
18 original counters). After reducing the dimensions of the
performance counter dataset, we decompose the top x PCs,
i.e. PC1 to PC4 in the above example, using the eigenvector
decomposition technique [6]. We decompose the PCs to map
them back to the performance counters. Mapping is required
because performance analysts are interested in performance
counters not principal components. Each performance
counter is given a weight between 0 and 1, in accordance to
its association with a component. Association of a
performance counter with a PC reflects the amount of
variance that the counter adds to the PC, (i.e. the larger the
weight of a performance counter the more it contributes to a
PC). We use these weights to construct a performance
signature by selecting the important performance counters
from the top x components.
To select the important counters from the top x
components, we kept the ‘weights’ as a tuneable parameter.
Lowering the value of the ‘weight’ parameter leads to more
performance counters being selected from PCs, hence a large
signature is created. In this example, we set a low ‘weight’
parameter=0.2 that yield top 7 counters. Tuning the
parameter to 0.4 and 0.6 results in 6 and 5 counters TABLE
III shows seven performance counters out of 18 that are
selected and ranked according to their weights. These seven
counters capture the most important characteristics of the
respective load test and act as its performance signature.
Deviation Detection: After automatically creating the
performance signatures from performance counter data of a
baseline load test, our approach extracts the same set of
performance counters from the ‘new tests’. Next, the
approach compares both sets of signatures. The comparison
is based on the performance counter weights. If the
performance counter weights of the baseline signature are
different from the ‘new load test’, this mismatch in weights
implies that the actual distribution(s) of the performance
counters values in the two load tests are different. Hence, the
approach marks the new load test as deviated.
Our previous study [10] showed that PCA, as a variance-
based algorithm, requires at least 40 observations of
performance counter values to create a performance
signature. Therefore, the effectiveness of our PCA approach
depends on the sampling intervals, set by the performance
analyst. For example, by collecting performance counter
samples (observations) per minute, our approach is able to
detect performance deviations (if any occurs) after 40
minutes. However, if the sampling interval is set to every 5
seconds, the performance deviations are detected within 3.5
minutes time frame.
D. WRAPPER Approach
Motivation: Random, clustering, and PCA approaches
are all unsupervised approaches. To have a more thorough
empirical study, we introduce our WRAPPER approach. It
requires the intervention of the performance analyst in the
data preparation phase and thereby is supervised and may be
considered as a semi-automated approach.
Data Preparation: Similar to the unsupervised
approaches, the performance counter data of the supervised
approach needs to be sanitized from missing and empty
performance counter variables. Moreover, specifically for the
supervised approach, the performance counter data of the
baseline load test needs to be labeled as passed or failed for
each normal and anomalous observation respectively. The
data is expected to be labeled once by the load
testers/performance analyst, based on their experience and
previous load test results. Thus, labeling is done once and it
is used several times later on. Note that both the baseline test
and the new test should be sanitized in the data preparation
phase. However, only the baseline test needs to be labeled
once manually.
Signature Generation: In this approach, we use a
wrapper-based attribute selection technique [11] for
signature generation (WRAPPER). Wrapper-based attribute
selection has shown promising results in the software
engineering literature [11]. However it is concluded in [12],
1015

TABLE IV. IDENTIFYING IMPORTANT PERFORMANCE COUNTERS
No Performance Counter Variables 10-Fold
Selection
Count=
5
%
Freq>20
1 % CPU Time 10
2 % Disk Time 10
3 Disk sec/Write 1
4 Available Bytes 2
5 Pages/sec 5
6 Database Cache Request/Sec 4
7 Network Interface Bytes
Total/sec
5
8 % CPU Idle Time 6
9 Datagram Rec/sec 1
⁞ ⁞ ⁞ ⁞ ⁞
18 Avg. Disk Read Queue Length 0
that there is no “one best attribute selection” approach that
works for any type of data. Our WRAPPER approach is the
first attempt for applying an attribute selection on
performance counters of large scale systems, which can be
studied more in the future. Due to the lack of space,
interested readers are advised to find the complete
description of a wrapper-based attribute selection approach
in [11]. In a nutshell, in this technique, a search algorithm
(e.g., a greedy or genetic search algorithm) is usually used to
optimize the selection of the subset of the attributes, with
respect to the accuracy of their prediction. The accuracy of a
subset is measured by a prediction model, e.g., OneR,
decision tree, or regression model.
In this paper, we use a very basic wrapper-based attribute
selection (OneR - genetic search), which can potentially be
improved in future experimentations. OneR is chosen as the
most basic prediction model. We use a genetic search
implemented in Weka to maximize the prediction accuracy
of the subset. Basically, the fitness function of the Genetic
search is the accuracy of the OneR model made by the
selected attributes. To keep our WRAPPER approach as the
most basic supervised approach, we did not tune the
parameters for the Genetic search. We simply reused Weka’s
recommended values (crossover probability=0.6 and
mutation probability=0.033, maximum generation=20, and
population size=20). The attribute selection is validated by a
standard 10-fold cross validation process, which starts by
partitioning the input performance counter data to 10 folds.
The wrapper selection algorithm takes one partition (fold) at
a time as the test set and trains on the remaining nine
partitions. The output of applying the wrapper-based
attribute selection on each fold is a set of performance
counters. These counters are the best performance deviation
predictors recommended by the WRAPPER approach.
We then select the top k performance counters, which are
selected most in the 10 folds. These top k counters form the
performance signature for the corresponding load test. The
frequency for each performance counter variable is
calculated based on the number of times it appears in the
folds divided by the total number of folds. Selecting the top k
is based on one of the two heuristics: “% Frequency”, i.e.,
the minimum percentage of times that the performance
counter is selected in the 10 folds, or “Count”, i.e., the exact
number of counters desired. TABLE IV shows the results of
our supervised signature generation for the same example of
performance counter data used in section II.C. In TABLE
IV, we show two signatures which are generated by: a)
specifying Count=5, which results in a signature consisting
of performance counters 1, 2, 5, 7 and 8, and b) specifying
frequency as %Frequency>20, which results in the
performance counters that appear in at least three folds, out
of 10 folds, i.e. performance counters 1, 2, 5, 6, 7 and 8. We
choose %Frequency>20 to be consistent with the 80% of top
k performance counter selection by setting weight parameter
to 0.2 in the PCA approach.
Deviation Detection: In this phase, the observations for
the performance counters of the signature are extracted from
the baseline load test. Then the extracted data is given to a
logistic regression [13], as a training set, to build a
classification model for performance anomaly detection.
Finally, the signature’s observations from the new load test
are classified into passed or failed using the regression
model. The logistic regression is chosen as a basic and state
of practice technique in the classification and prediction
literature in software engineering [13] and can be switched
with any other classification technique that shows better
results in future experimentations.
III. CASE STUDY
The main goal of this case study is to investigate and
compare the effectiveness of our approaches for analyzing
the load test result of large scale systems. So we shape our
goal as this research question:
RQ. How effective are our signature-based approaches in
detecting performance deviations in load tests?
Motivation: An approach with low recall won’t be
adopted in practice since it fails to detect many of existing
deviations. An approach that produces results with high
recall and low precision is not useful either since it floods the
performance analysts with too many false positives. An ideal
approach should predict a minimal and correct set of
performance deviations. We evaluate the performance of our
approaches using precision, recall and F-measure.
A. Subjects of Study and Environment Setup
TABLE V lists the systems studied in this paper. In this
section, we describe the environment setup for these systems.
The Industrial System: We used a subsystem of an ultra
large industrial software system in the domain of telecom
that supports millions of concurrent users.
TABLE V. THE SUBJECTS OF THE STUDY
No System Domain Type of Data
1 Industrial
System Telecom
Production data
Data from our experiments on
the company’s testing platform
2 Open Source E-
commerce
Data from our experiments
with an open source
benchmark application
1016

TABLE VI. FAULTS INJECTED IN OUR LOAD TEST EXPERIMENTS
Category Failure Trigger Faults Exp. Id
Software
Failures
Resource
Exhaustion
1. CPU Stress 1
2. Memory Stress 2
System Overload 3. Abnormal Workload 3
Operator
Errors
Configuration
Errors
4. Misconfigured Load
Generator 4
Procedural Errors
5. Interfering Workload 5
6. Unscheduled
Replication 6
TABLE VII. LOAD TEST CONFIGURATION FOR DELL DVD STORE (DS2)
Parameter Value
Testing duration 1 hour
Number of driver (load generator) threads 50
Startup request rate (load ramp-up rate) 5
Think time (time to complete an order) 30 sec
Database size 100MB
Percentage of new customers 15%
Average number of searches per order 3
Average number of items returned in each search 5
Average number of items per order 5
We obtained two sets of load test counter data for their
subsystems.
a) Production data: obtained from the performance
repository of the industrial system under study. The load
testing is performed by the company experts.
b) Testbed data: obtained during a load test conducted by
us using the company’s testbed.
The Open Source System: The second system under
study is Dell DVD Store (DS2) application, which is an open
source prototype of an online e-commerce website. It is
designed for benchmarking Dell hardware. It includes basic
e-commerce functionalities such as user registrations, user
login, product search and purchase. DS2 consists of a back-
end database component, a web application component, and
a driver program (load generator). DS2 has multiple
distributions to support different languages such as PHP,
JSP, and ASP and databases such as MySQL, Microsoft SQL
server, and Oracle. In this case study, we use the JSP
distribution and a MySQL database(s). The JSP code runs in
a Tomcat container. Our load consists of a mix of
transactions, including user registration, product search and
purchases. The configuration of our DS2 load generator for
the baseline load test in our experiments is listed in Table
VII, to enable the replication of our experiments.
B. Fault Injection
To study our approaches on realistic situations, we must
evaluate them in the presence of representative faults. To do
so, we first need to choose the category of faults, e.g.
software failures, hardware failures and operator/human
errors. Secondly we need to decide on the failure triggers for
each category, e.g. software failures could be triggered by
resource exhaustion, logical errors or system overload. Pretet
[14] performed a detailed study on failure occurrences in an
enterprise web service system and concluded that 80% of the
failures are due to software failures and human errors.
Therefore, in this paper, we use these categories for our
experiments. Pretet have also listed the seven most common
triggers for software failures and human error failures.
Among them, we used four failure triggers that fit into our
load test experiments, which are listed in Table VI. Below,
we explain why we choose the failure triggers listed in Table
VI and their relation to load testing.
Resource Exhaustion: Large enterprises report resource
exhaustion as one of the fundamental field problems [15].
Researchers, also, have identified that post deployment
problems are rarely due to functionality errors, rather, they
are often due to resource saturation problems causing
applications not to respond fast enough, crash, or hang under
a heavy load.
System Overload: Performance analysts often have to run
numerous tests for every release or build of an application
for specific workloads under particular hardware and
software conditions [3]. They have to carefully analyze the
test to ensure that the system is not overloaded and is
meeting its desired SLA, e.g., response time or latency.
Configuration Errors: One of the most common reasons
of load test failures is the misconfiguration of an application
under test or its execution environment. For example,
databases, web servers or load generators may be
misconfigured due to time pressure or complex
configuration.
Procedural Errors: Procedural errors are the second
major source of failures in the operator error category [14].
Load test procedural errors happen when the analyst/tester
does not follow guidelines and processes for conducting a
load test. For example, the tester forgets to restart a web
service or to initialize database tables before the start of a
load test. Similarly one of the most common causes of
triggering procedural errors in large scale systems is when a
tester forgets to suppress/change the schedule of background
interfering loads, e.g. the start of the antivirus or a database
replication during the course of a load test [16].
C. Experiment Design
We designed seven experiments to answer our research
questions. We used the framework of Thakkar [15] to
automate the load tests and to ensure that the environment
remains constant throughout the experiments. We used
Thakkar framework due to its simplicity and previous
success in practical performance testing [15].
Except for experiment 7, which consists of production
data obtained from the industrial partner, all other load test
experiments are repeated 10 times to ensure the consistency
among our findings. The ramp-up and ramp-down (warm up
and cool down) periods were excluded from the load test
analysis, as the system usually is not stable at these periods.
We used windows tool to collect the performance data
periodically after every 10 seconds (sampling interval). This
means that each industrial experiment conducted on the
testbed has 2,880 observations as these tests lasted for 8
hours. However, all the experiments conducted on the DS2
benchmark application are one-hour tests and contain 360
1017

observations per performance counter. We now detail the
settings of each experiment for the faults listed in TABLE
VI.
Experiment 1 (CPU Stress): Experiment 1 investigates
the software failure category by triggering resource
exhaustion. For experiment 1, we ran a load test with a
baseline workload. Then we slowed down the CPU of the
web server using a CPU stress tool, known as winThrottle
[17]. We choose winThrottle over other CPU stress tools
because it is an open source tool and can use features in
system hardware that directly modify the CPU clock speed,
rather than using software “delay loops” or “HLT
instructions” to slow down the machine.
Experiment 2 (Memory Stress): For experiment 2, we
conducted a load test with the same workload as the baseline
load test, but injected a memory bug into the webserver using
a customized open-source memory stress tool called EatMem
[18]. The tool allocates a random amount of available
memory at recurring intervals to mimic a memory leak.
Experiment 3 (Abnormal Workload): This experiment is
conducted using the DS2 system. We trigger a system
overload, the second common failure trigger identified by
Pretet [14]. This experiment keeps the workload-mix
constant and increases the execution rate of our workload to
4X, i.e. four times as the baseline configuration.
Experiment 4 (Misconfigured Load Generator): This
experiment uses the testing platform to mimic the problems
resulting from misconfiguration of the load generator.
Therefore, we configure the load generator to push a
different workload-mix than the baseline workload.
Experiment 5 (Interfering Workload): This experiment
aims to trigger a procedural error for a load test. We created
an interfering background workload fault, where the tester
forgets to reschedule an antivirus scan that conflicts with the
timing of the load test. We scanned one of the web server
machines with an antivirus every 10 minutes for 3 minutes
over the course of one hour to perturb the main workload.
Experiment 6 (Unscheduled Replication): This
experiment also aims to trigger a procedural error for a load
test. We mimic the scenario where the tester forgets to
reschedule the database replication over the course of a load
test. We set the replication time to coincide with the start and
stop time of the load test.
Experiment 7 (Production Data): This experiment was
conducted on the production data. Performance analysts gave
us two sets of performance counter data: a baseline and a
deviated load test, without revealing the type of faults.
D. Measuring the Effectiveness of Our Proposed
Approaches
To evaluate the effectiveness of our approaches, we use
the following measures: Precision, Recall and F-Measure.
Precision is the ratio between correctly detected performance
deviations and predicted performance deviations between the
two load tests. Recall is defined as the ratio between the
number of correctly detected performance deviations and the
number of actual performance deviations for a load test. F-
Fig. 3. Illustration of our effectiveness measures
measure is defined as a harmonic means of precision and
recall. F-Measure = ( . The value of alpha ( ) ranges between
0 and infinity to give varying weights for recall and
precision. For example, in this paper, to indicate that recall is
as important as precision, alpha has a value of 1.0. These
definitions are directly applied to the output of the control
chart (random and clustering- approaches) and logistic-
regression (WRAPPER approach), where the classifications
are done per observation (i.e., for each observation, one can
define whether the prediction is true or false positive).
However, the PCA approach cannot predict performance
deviations for one single observation. Since as noted earlier,
PCA requires a certain minimum number of observations to
construct a performance signature [16].
Therefore, throughout our load test analysis with the
PCA approach, we divide the load test into time intervals.
Fig. 3 shows a performance counter data of two load tests.
The performance counter data for each load test is divided
into equal time intervals from t1 to t10. For load test-2, a
failure is injected during time intervals t3, t4 and t5.We use
Fig. 3 as an example to explain how we can measure the
precision and recall of the PCA approach. An ideal approach
should only report the intervals at which the deviations
occurred O={t3, t4, t5}. Assume we take Test-1 as a baseline
and apply the PCA deviation detection approach on Test-2
and detect performance deviations between two tests at time
intervals P={t1, t2, t3, t4}. Based on these definitions we
define: Recall = |P∩O|/|O| and Precision = |P∩O|/|P|.
Therefore, in the above example, Recall=2/3=0.67,
Precision=2/4=0.5, and F-Measure=0.57.
E. Case Study Results
We report our findings regarding our research question:
RQ1. How effective are our signature-based approaches in
detecting the performance deviations in load tests?
The results of the four approaches (Random:R,
Clustering:C, PCA:P, and WRAPPER:W) for all seven
experiments are reported in TABLE VIII in terms of
precision, recall and F-measure (for the first six experiments
the values are the average of the 10 runs per experiment).
The “Total Counter” column in TABLE VIII shows the total
number of performance counters collected for the
corresponding experiment. The “Sig. Size” column represents
the number of performance counters in the signature for each
approach. The choice of Sig. Size is based on two factors.
The main constraint on the size comes from practicality. As
1018

TABLE VIII. THE EFFECTIVENESS OF SUPERVISED AND UNSUPERVISED DEVIATION DETECTION APPROACHES FOR LOAD TESTING WITH SMALL FINGERPRINT
Exp. Precision Recall F- Measure Sig. Size Total Counter
W P R C W P R C W P R C
1 0.99 0.88 0.2 0.69 1 0.8 0.77 0.79 0.99 0.84 0.32 0.74 20 220
2 0.88 0.81 0.2 0.7 0.87 0.9 0.69 0.8 0.87 0.85 0.31 0.75 20 220
3 0.94 0.66 0.27 0.69 0.91 0.8 0.79 0.75 0.92 0.72 0.40 0.72 20 220
4 0.98 0.5 0.22 0.32 0.92 0.8 0.74 0.75 0.95 0.62 0.34 0.45 5 18
5 0.95 1 0.29 0.7 0.92 0.8 0.76 0.82 0.93 0.89 0.42 0.76 15 110
6 0.92 0.9 0.18 0.7 0.95 0.9 0.69 0.82 0.93 0.90 0.29 0.76 20 110
7 1 0.9 0.2 0.79 1 0.9 0.72 0.8 1 0.90 0.31 0.79 9 92
Avg. 0.95 0.81 0.22 0.65 0.94 0.84 0.73 0.79 0.94 0.82 0.34 0.71 16 141
Fig. 4. Effectiveness of supervised (WRAPPER) and unsupervised (PCA)
approaches over signature size for representative examples
discussed, performance analysts of our industrial partner
advised us that they consider 20 performance counters as a
maximum manageable size in the analysis of load tests. Any
increase in the number of performance counters beyond 20
negatively affects the human capability to effectively
conduct root-cause analysis in limited time. Based on their
input, we limited the signature size to maximum of 20
performance counters. The other factor that affects the size
of signatures is the method that our PCA approach uses for
signature generation, the“% Cumulative Variability”. As
discussed in II.C, we set the PCA threshold for selecting
counters from PCs as 0.2 to extract 80% of cumulative
variation in the counters.
We apply the same threshold for the WRAPPER
signature generation to get the counters represented in the
80% of the folds. Finally, we set the common signature size
for all approaches per experiment as the minimum of <20,
the PCA’s signature size using 0.2 threshold, the Wrapper’s
signature size using 80% threshold>. TABLE VIII shows
that “Sig. Size” ranges from 5-20 in the seven experiments.
Regardless of the signature size per experiment, we want to
evaluate the effectiveness of our approaches on deviation
detection. The results show, as expected, Random deviation
detection has the lowest effectiveness (precision, recall, and
the F-measure). Among the clustering and PCA approaches,
the PCA approach almost always performs significantly
better. Comparing the supervised approach (WRAPPER)
and the best unsupervised approach (PCA) we can see that
the supervised approach dominates the unsupervised
approach in terms of precision, recall, and the F-measure.
The next observation from the results is the excellent balance
of high precision and recall of both the WRAPPER and PCA
approaches (on average 0.95, 0.94 and 0.81, 0.84
respectively). However, the supervised approach (WRAPP-
ER) is still more effective than the best unsupervised
approach (PCA).
IV. DISCUSSION
We now discuss the practical differences between our
best unsupervised (PCA) and supervised (WRAPPER)
approaches.
A. Manual Overhead
The WRAPPER approach outperforms the PCA
approach in terms of precision/recall. However, WRAPPER
requires all observations of the baseline performance counter
data to be labeled as passed/failed. Such labeling is required
for the training of this supervised approach. In practice,
however, this is an overhead for analysts that rarely have
time to manually mark each observation of the performance
counter data. Therefore, tool support is needed to help
analysts partially automate the labeling, whereas, the PCA
approach does not require any such human intervention.
B. Real Time Analysis
We refer “real-time analysis” as the ability of an
approach to process the performance counter data as it
arrives, in order to detect performance deviations. The
WRAPPER approach is more real-time than the PCA
approach. The WRAPPER approach detects the load test
performance deviations on a per-observation basis. Whereas,
the PCA approach requires a certain amount of observations
(wait time) before it can detect any performance deviations
for a load test [10].
C. Stability
We refer to “stability” as the ability of an approach to
remain effective while its signature size is reduced. We find
that the WRAPPER approach is more stable than the PCA
approach. This means that a slight increase/decrease of its
signature size smoothly increase/decrease the effectiveness
of the approach. To investigate the stability of the
approaches, we plotted (only for Exp-1 and Exp-2 for the
sake of space limitations) the F-measure over signature size,
from size 1 to the size selected by each approach, covering
80% of the variation (0.2 for the PCA variation threshold and
80% for the WRAPPER frequency threshold). As shown in
Fig. 4, the WRAPPER approach exhibits a very smooth
decrease (stable), when reducing the signature size, for most
of the experiments. However, the PCA approach has
0.7
0.75
0.8
0.85
0.9
0.95
1
79 70 60 50 40 30 20 10 4 2
F-M
easu
re
Signature Size
Exp-1
-----PCA Wrapper
0.6
0.65
0.7
0.75
0.8
0.85
0.9
0.95
1
1.05
60 50 40 30 20 10 4 2
F-M
easu
re
Signature Size
Exp-2
-----PCA Wrapper
1019

drastically sharp drops in effectiveness as the signature size
is reduced. In addition, unlike the WRAPPER approach, in
many cases (circles in Fig.4), decreasing the signature size(s)
results in an increase of its effectiveness, followed by a
sudden drop (unpredictable trend). Instability of the PCA
approach with respect to reducing the signature size affects
its practicality. As a first step to explore the stability
differences between the proposed approaches, we looked into
the selected performance counters of the signatures provided
by the WRAPPER and PCA approaches. We compared the
signatures of the WRAPPER and PCA approaches for all
seven experiments (with signature sizes generated by the 0.2
and 80% thresholds for the PCA and WRAPPER approaches
respectively). On average (for our seven experiments), the
performance signatures of both approaches share 80%
common performance counters. On a closer look, we found
that 20% of the performance counters were different because
each approach picked up the important performance counters
at different granularities within the same category. We
illustrate what granularity and category means by a real
example from the case study. In experiment 1, where we
stressed the CPU of the database servers, the WRAPPER
approach picked one of the performance counters that
exactly captures the processor time for the MySQL server of
the database machine. Whereas, the PCA approach picked up
a performance counter at a coarser granularity, i.e., the total
processor time for the database machine. Both of these
performance counters are essentially measuring the same
category, i.e. CPU, but at different granularity. Therefore, the
difference between the granularities of the performance
counters in the two signatures might be a possible reason for
the differences in their effectiveness.
In addition, we found that the order of the 80% common
performance counters is different in the PCA and
WRAPPER signatures. In the PCA signature, the
performance counters are ranked based on their weights in
the PCs. Whereas, the WRAPPER approach ranks the
performance counters based on which performance counters
are selected the most in the 10 folds during the prediction
step. Since the regression technique used by our WRAPPER
approach is sensitive to the ordering of the variables, this
difference in the ordering might be another possible cause for
the differences between the effectiveness of these two
approaches, which again requires further studies.
V. LIMITATIONS AND THREATS TO THE VALIDITY
Hardwar Differences: In practice, large scale systems
have many testing labs (testbeds) to run multiple load tests
simultaneously to speed up the testing. Labs may have
different hardware. Therefore, if the baseline load test was
conducted in one lab, and another similar load test, without
any performance deviation, is conducted at different lab, our
approaches may interpret them as deviated from each other.
Recent work by Foo [5] proposes several techniques to
overcome this problem.
Sensitivity: We can tune the sensitivity of our approaches
to uncover small fluctuations. For example, in the
WRAPPER approach, the labeling phase by the analyst
decides how big the deviation should be to be flagged. In the
PCA approach, the threshold that decides whether two
performance counter weights in the signatures are the same
or not is the tuner. Finally, in the control chart, the LCL and
UCL values define the deviations. Though lowering
sensitivity reduces false alarms, it may overlook some
important outliers. However, this is a general problem and an
automated technique, generally, cannot decide whether a
given outlier is a noise or an important deviation, only based
on performance counter data.
Construct Validity: Since our approaches are evaluated,
in six out of seven experiments, based on injected faults, we
tried to reduce the construct validity threat by being
systematic with the fault injection process. Despite our
careful fault injection mechanism, the types of the injected
faults may not be fully representative of real faults.
Internal Validity: This study required various sets of
configurations (test environment settings), implementations
(supervised and unsupervised signature generations), and
data analysis (data handling and statistical analysis).
Therefore, to reduce the internal validity threat we used
existing frameworks (e.g., Thakkar framework for
automating the load test executions), tools (e.g., Weka for
implementing the WRAPPER approach) and packages (e.g.,
R statistics packages for PCA implementation study).
Conclusion Validity: Experiments 1-6 are executed 10
times each and the average of the results is taken for
comparison among different approaches. However, the
differences among the approaches might be by chance due to
random nature of the experiments. We plan to extend the
study with more runs per experiment so that statistical
significant test can be meaningfully applicable.
External Validity: We used one large industrial and one
open source benchmark application to reduce the threat. But,
our approaches cannot be generalized to any other systems
especially in other domains without its replication.
VI. RELATED WORK
How to automate performance monitoring and analysis of
an enterprise system is not a new problem. However, there is
little work done in pre-diagnosis (load, stress and
performance regression testing) of performance problems in
large scale systems. Most of the work in the literature is post-
deployment centric, focusing on automatic field problem
diagnosis and monitoring techniques. Our work is pre-
deployment centric and aims to uncover performance
problems in a load test.
The closest work to us, i.e., load test analysis, is the work
done by Jiang [3] and Foo. [5] to automate the analysis of
load test results. Unlike our work, Jiang relies on execution
logs [3]. The execution logs capture detailed information.
However, such logs are vendor and application specific. This
means, that different subsystems in a large scale system (e.g.
web servers, databases, and mail servers) produce a variety
of execution logs, each with different levels of information
and formats. Whereas, the performance counters data,
1020

provide a greater level of unification across subsystems and
systems. Similar to our work, Foo et al. used performance
counters to find deviations between load tests [5]. Their
approach requires discretization of performance metrics into
levels (e.g. high/medium/low). Such level-based
discretization of metrics fails to capture fine-grained
performance deviations in a load test.
There exists some work, though not directly targeted at
load test analysis that can be potentially used in the testing
domain to assist practitioners in load test analysis. Among
them, the work that inspired our PCA approach is the work
by Sandeep et al. [16]. They used principal feature analysis
(PFA) to achieve data reduction and random forests to
characterize workloads. The main difference between their
PFA approach and our PCA approach is that, their work is
partially automated and requires continuous training to
produce accurate results. With the same objective, Huck and
Malony [8] proposed a performance data mining framework
for large-scale parallel computing. The framework tries to
manage data complexity by using techniques such as
clustering and dimensionality reduction. This data mining
framework uses random linear projections and PCA to
reduce performance data. Unlike our PCA approach, the
framework does not transform the PCs back to individual
performance counters making it harder for performance
analysts to act on its findings. In our previous work [6], we
introduced our unsupervised approach based on PCA. In this
paper, we extended that work by exploring new deviation
detection approaches (more basic unsupervised approaches
as baselines and a supervised approach for comparison) and
empirically compared them with our PCA approach. We also
conducted a more extensive case study and carefully studied
the results with respect to signatures size and practicality.
VII. CONCLUSION AND FUTURE WORK
Manually analyzing the load testing results for large scale
systems is error-prone and inefficient due to the large volume
of performance data and time pressure. Furthermore, limited
knowledge of an analyst about such large systems under test
may increase the difficulty of the analysis. In this paper, we
proposed one supervised and three unsupervised approaches
to automate the analysis of load test in large scale systems.
Our approaches select a subset (called signature) of
performance counters for a load test. The signature acts as a
unique fingerprint for the load test and compares it with
signatures from baseline load tests. A large case study on a
real world industrial software system as well as a benchmark
open source system provides empirical evidence of the
ability of our approaches to uncover the performance
deviation in load tests. As future work, we plan to do a larger
study where we look at different combinations of possible
approaches for signature generation (dimension reduction)
and deviation detection to understand the importance of each
step and maximize the effectiveness of the overall approach.
ACKNOWLEDGEMENT
We are grateful to Research In Motion (RIM) for providing
access to the enterprise application used in our case study.
The findings and opinions expressed in this paper are those
of the authors and do not necessarily represent or reflect
those of RIM and/or its subsidiaries and affiliates. Moreover,
our results do not in any way reflect the quality of RIM’s
software products. We are thankful to Parminder Flora from
RIM for his guidance to understand enterprise application,
conduct load tests and his useful feedback on this paper.
REFERENCES
[1] L. H. Lin, A. Tanyavutti and S. Jindrapacha, "Analyzing eBay platform
strategies: An application of meyer's product platform strategy model,"
in Management of Engineering and Technology, Portland International Center for, pp. 125-142.
[2] Z. M. Jiang, A. E. Hassan, G. Hamann and P. Flora, "Automated
performance analysis of load tests," in IEEE International Conference
on in Software Maintenance, ICSM 2009, pp. 125-134.
[3] Z. M. Jiang, "Automated analysis of load testing results," in
Proceedings of the 19th International Symposium on Software Testing and Analysis, Trento, Italy, 2010, pp. 143-146.
[4] H. Malik, Z. M. Jiang, B. Adams, A. E. Hassan, P. Flora and G.
Hamann, "Automatic comparison of load tests to support the performance analysis of large enterprise systems," in 14th European
Conference on Software Maintenance and Reengineering, Madraid,
Spain, 2010, pp. 222-231. [5] K. C. D. Foo. Automated discovery of performance regressions in
enterprise applications. 2011. Available:
http://sail.cs.queensu.ca/publications/pubs/masterthesis2011_foo.pdf. [6] H. Malik, B. Adams, A. E. Hassan, P. Flora and G. Hamann, "Using
load tests to automatically compare the subsystems of a large enterprise
system," in IEEE Computer Software and Applications Conference, Seoul, Korea, 2010, pp. 117-126.
[7] T. H. D. Nguyen, B. Adams, Z. M. Jiang and A. E. Hassan, "Automatic
Load Test Verification Using Control Charts" In Proceedings of
the 18th Asia Pacific Software Engineering Conference, 2011.
[8] K. A. Huck and A. D. Malony, "PerfExplorer: A performance data
mining framework for large-scale parallel computing," in Proceedings of the ACM/IEEE SC Supercomputing Conference, 2005, pp. 41-41.
[9] I. Jolliffe, Principal Component Analysis. Springer verlag, 2002.
[10] H. Malik, B. Adams and A. E. Hassan, "Pinpointing the subsystems responsible for the performance deviations in a load test," in IEEE
21st International Symposium on Software Reliability Engineering
(ISSRE), San Jose, California, USA, 2010, pp. 201-210. [11] J. Leng, C. Valli and L. Armstrong, "A Wrapper-Based Feature
Selection for Analysis of Large Data Sets," ECU Publications, 2010.
[12] M. A. Hall and G. Holmes, "Benchmarking attribute selection techniques for discrete class data mining," IEEE Transactions on
Knowledge and Data Engineering, 2003, vol. 15, pp. 1437-1447, [13] A. Podgurski, D. Leon, P. Francis, W. Masri, M. Minch, J. Sun and B.
Wang, "Automated support for classifying software failure reports," in
Proceeding of 25th International Conference on Software Engineering,
2003, PP. 465-475. [14] S. Pertet and P. Narasimhan, "Causes of failure in web applications,"
Parallel Data Laboratory, Carnegie Mellon University, CMU-PDL-05-
109. [15] D. Thakkar, A. E. Hassan, G. Hamann and P. Flora, "A framework for
measurement based performance modeling," in Proceedings of the 7th
International Workshop on Software and Performance, Princeton, NJ, USA, 2008, pp. 55-66.
[16] S. R. Sandeep, M. Swapna, T. Niranjan, S. Susarla and S. Nandi,
"CLUEBOX: A Performance Log Analyzer for Automated Troubleshooting," 18-2008.
[17] M. Leyda and R. Geiss "WinThrottle," 2010.
[18] J. McCaffrey, [online]. 2013(Mar 25th), Available: http://msdn.microsoft.com/en-us/magazine/cc163613.aspx.
1021