Embed Size (px)
Citation preview
1
Decision 411: Class 12Decision 411: Class 12
Automatic forecasting softwareAutomatic forecasting software
Political & ethical issues in forecastingPolitical & ethical issues in forecasting
Automatic forecasting softwareAutomatic forecasting softwareMost major statistical & database packages Most major statistical & database packages include “wizards” for automatic forecasting:include “wizards” for automatic forecasting:
SAS (Time Series Forecasting System)SAS (Time Series Forecasting System)SPSS (Decision Time*)SPSS (Decision Time*)Oracle (Sales Analyzer)Oracle (Sales Analyzer)
They generally conduct tournaments among They generally conduct tournaments among the most basic time series models (RW, LT, the most basic time series models (RW, LT, SMA, SES, LES, Winters) to pick a “winner”SMA, SES, LES, Winters) to pick a “winner”
*The “Advanced Forecasting Wizard” in Decision Time also considers ARIMA models.
2
Automatic forecasting in Automatic forecasting in StatgraphicsStatgraphics
StatgraphicsStatgraphics also includes an Automatic also includes an Automatic Forecasting procedure*Forecasting procedure*
This is a tournamentThis is a tournament--based procedure based procedure that includes all the basic models, plus that includes all the basic models, plus ARIMA modelsARIMA models
* Actually, there are two automatic forecasting procedures: one on the Time Series menu and one on the Snapstatsmenu. Use the Time Series version to get more detailed output, including a model comparison report.
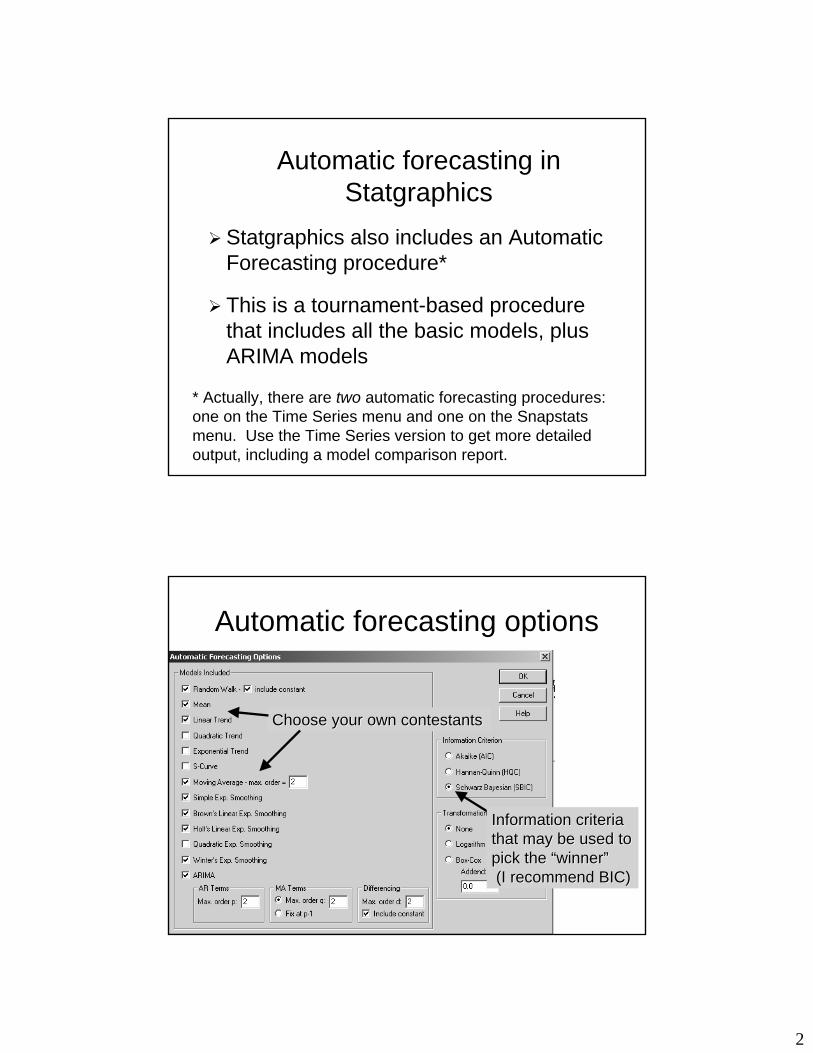
Automatic forecasting optionsAutomatic forecasting options
Information criteria Information criteria that may be used to that may be used to pick the “winner”pick the “winner”(I recommend BIC)(I recommend BIC)
Choose your own contestantsChoose your own contestants
3
““Information criteria”Information criteria”The The AkaikeAkaike Information Criterion (AIC), Information Criterion (AIC), HannanHannan--Quinn Criterion (HQC) and Quinn Criterion (HQC) and Schwarz Bayesian Information Criterion Schwarz Bayesian Information Criterion (BIC) are often used to rank forecasting (BIC) are often used to rank forecasting models in automated selection procedures.models in automated selection procedures.
These criteria impose a heavier penalty for These criteria impose a heavier penalty for model complexity than MSE (i.e., squared model complexity than MSE (i.e., squared error adjusted for # coefficients, which is error adjusted for # coefficients, which is used to compute adjusted Rused to compute adjusted R--squared).squared).
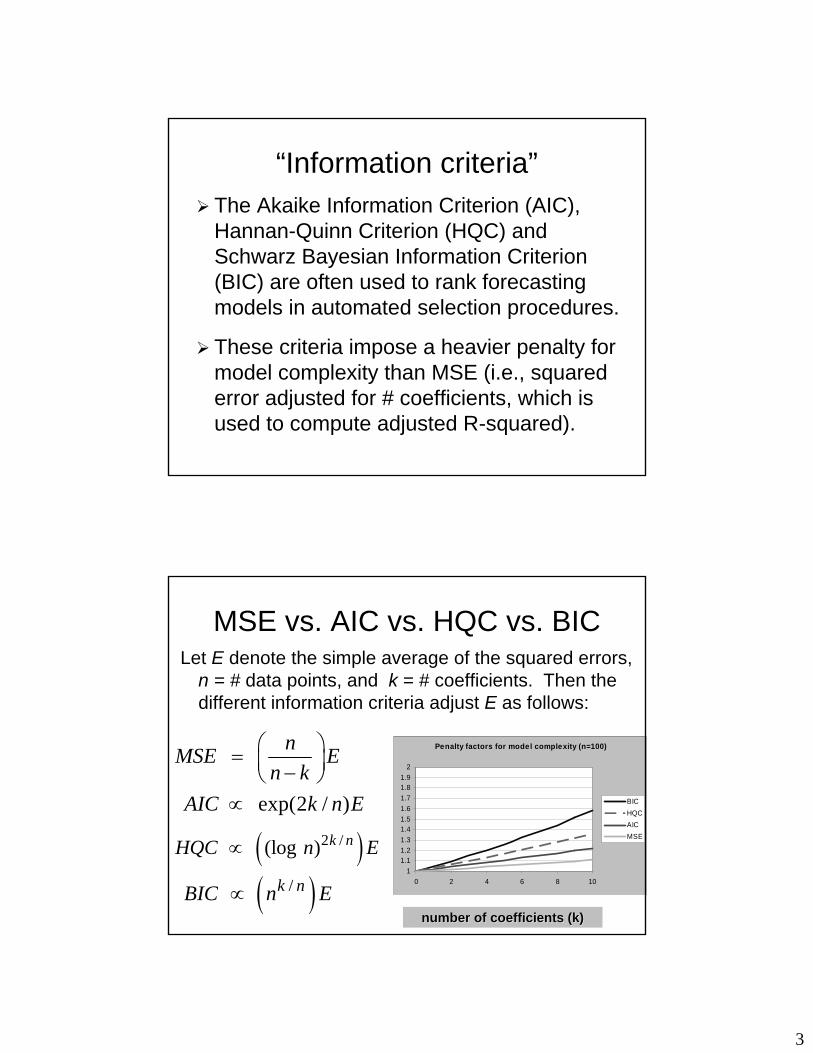
MSE vs. AIC vs. HQC vs. BICMSE vs. AIC vs. HQC vs. BICLet Let EE denote the simple average of the squared errors, denote the simple average of the squared errors,
n = # n = # data points, and data points, and k k = # coefficients. Then the = # coefficients. Then the different information criteria adjust different information criteria adjust EE as follows:as follows:
( )2 / (log ) k nHQC n E∝
nMSE En k
⎛ ⎞= ⎜ ⎟−⎝ ⎠ exp(2 / )AIC k n E∝
( )/ k nBIC n E∝number of coefficients (k)number of coefficients (k)
Penalty factors for model complexity (n=100)
11.11.21.31.41.51.61.71.81.9
2
0 2 4 6 8 10
BICHQCAICMSE
4
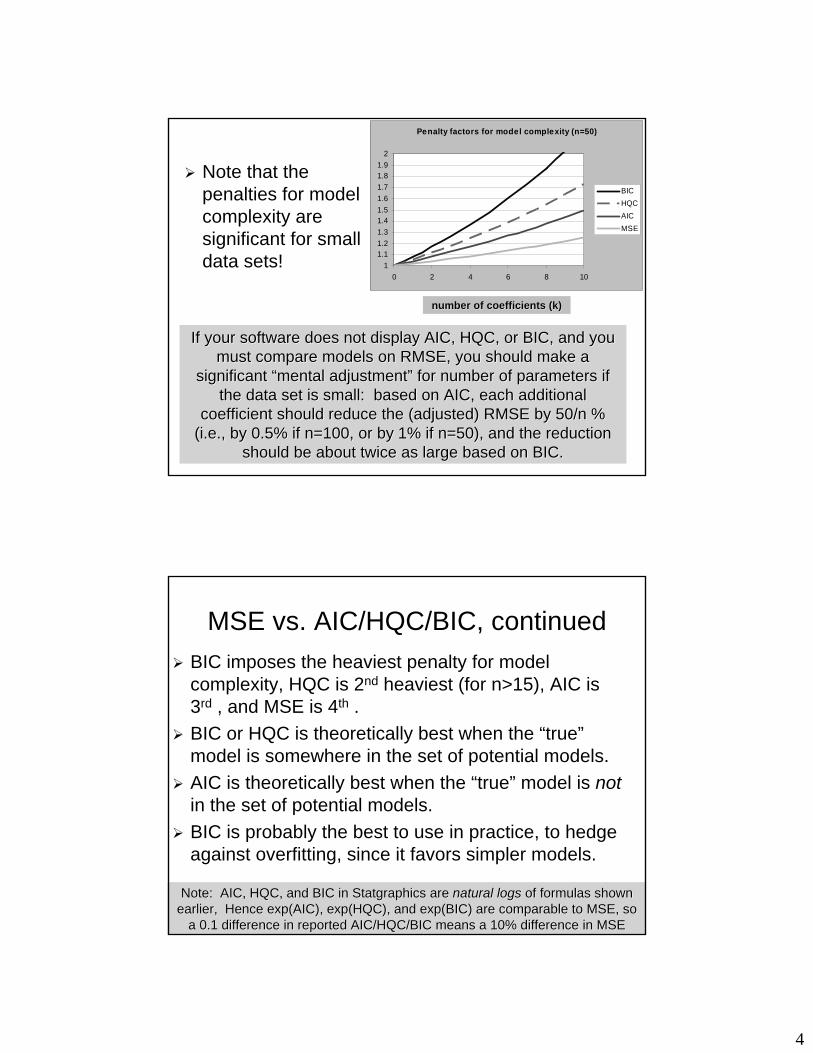
Note that the Note that the penalties for model penalties for model complexity are complexity are significant for small significant for small data sets!data sets!
Penalty factors for model complexity (n=50)
11.11.21.31.41.51.61.71.81.9
2
0 2 4 6 8 10
BICHQCAICMSE
number of coefficients (k)number of coefficients (k)
If your software does not display AIC, HQC, or BIC, and you If your software does not display AIC, HQC, or BIC, and you must compare models on RMSE, you should make a must compare models on RMSE, you should make a
significant “mental adjustment” for number of parameters if significant “mental adjustment” for number of parameters if the data set is small: based on AIC, each additional the data set is small: based on AIC, each additional
coefficient should reduce the (adjusted) RMSE by 50/n % coefficient should reduce the (adjusted) RMSE by 50/n % (i.e., by 0.5% if n=100, or by 1% if n=50), and the reduction (i.e., by 0.5% if n=100, or by 1% if n=50), and the reduction
should be about twice as large based on BIC.should be about twice as large based on BIC.
MSE vs. AIC/HQC/BIC, continuedMSE vs. AIC/HQC/BIC, continuedBIC imposes the heaviest penalty for model BIC imposes the heaviest penalty for model complexity, HQC is 2complexity, HQC is 2ndnd heaviest (for n>15), AIC is heaviest (for n>15), AIC is 33rdrd , and MSE is 4, and MSE is 4thth . . BIC or HQC is theoretically best when the “true” BIC or HQC is theoretically best when the “true” model is somewhere in the set of potential models.model is somewhere in the set of potential models.AIC is theoretically best when the “true” model is AIC is theoretically best when the “true” model is notnotin the set of potential models.in the set of potential models.BIC is probably the best to use in practice, to hedge BIC is probably the best to use in practice, to hedge against against overfittingoverfitting, since it favors simpler models., since it favors simpler models.
Note: AIC, HQC, and BIC in Note: AIC, HQC, and BIC in StatgraphicsStatgraphics are are natural logsnatural logs of formulas shown of formulas shown earlier, Hence earlier, Hence exp(AICexp(AIC), ), exp(HQCexp(HQC), and ), and exp(BICexp(BIC) are comparable to MSE, so ) are comparable to MSE, so
a 0.1 difference in reported AIC/HQC/BIC means a 10% difference a 0.1 difference in reported AIC/HQC/BIC means a 10% difference in MSEin MSE
5
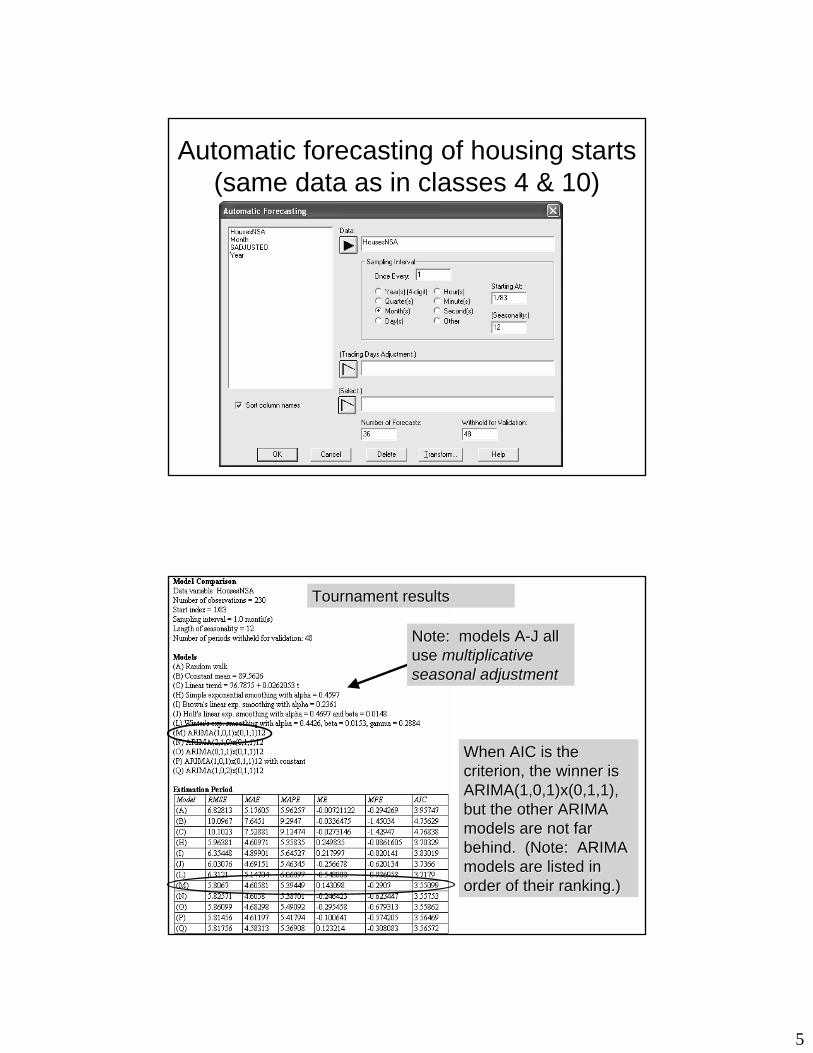
Automatic forecasting of housing starts Automatic forecasting of housing starts (same data as in classes 4 & 10)(same data as in classes 4 & 10)
When AIC is the When AIC is the criterion, the winner is criterion, the winner is ARIMA(1,0,1)x(0,1,1), ARIMA(1,0,1)x(0,1,1), but the other ARIMA but the other ARIMA models are not far models are not far behind. (Note: ARIMA behind. (Note: ARIMA models are listed in models are listed in order of their ranking.)order of their ranking.)
Note: models ANote: models A--J all J all use use multiplicative multiplicative seasonal adjustmentseasonal adjustment
Tournament resultsTournament results
6
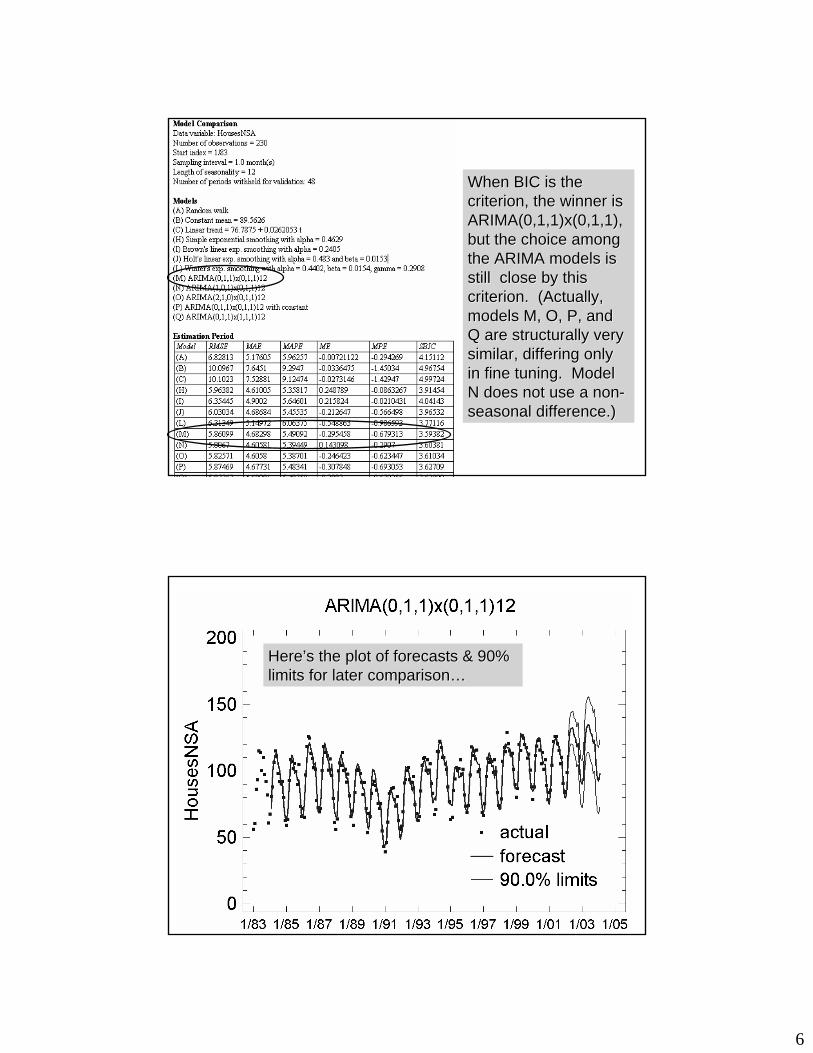
When BIC is the When BIC is the criterion, the winner is criterion, the winner is ARIMA(0,1,1)x(0,1,1), ARIMA(0,1,1)x(0,1,1), but the choice among but the choice among the ARIMA models is the ARIMA models is still close by this still close by this criterion. (Actually, criterion. (Actually, models M, O, P, and models M, O, P, and Q are structurally very Q are structurally very similar, differing only similar, differing only in fine tuning. Model in fine tuning. Model N does not use a nonN does not use a non--seasonal difference.)seasonal difference.)
Here’s the plot of forecasts & 90% Here’s the plot of forecasts & 90% limits for later comparison…limits for later comparison…
7
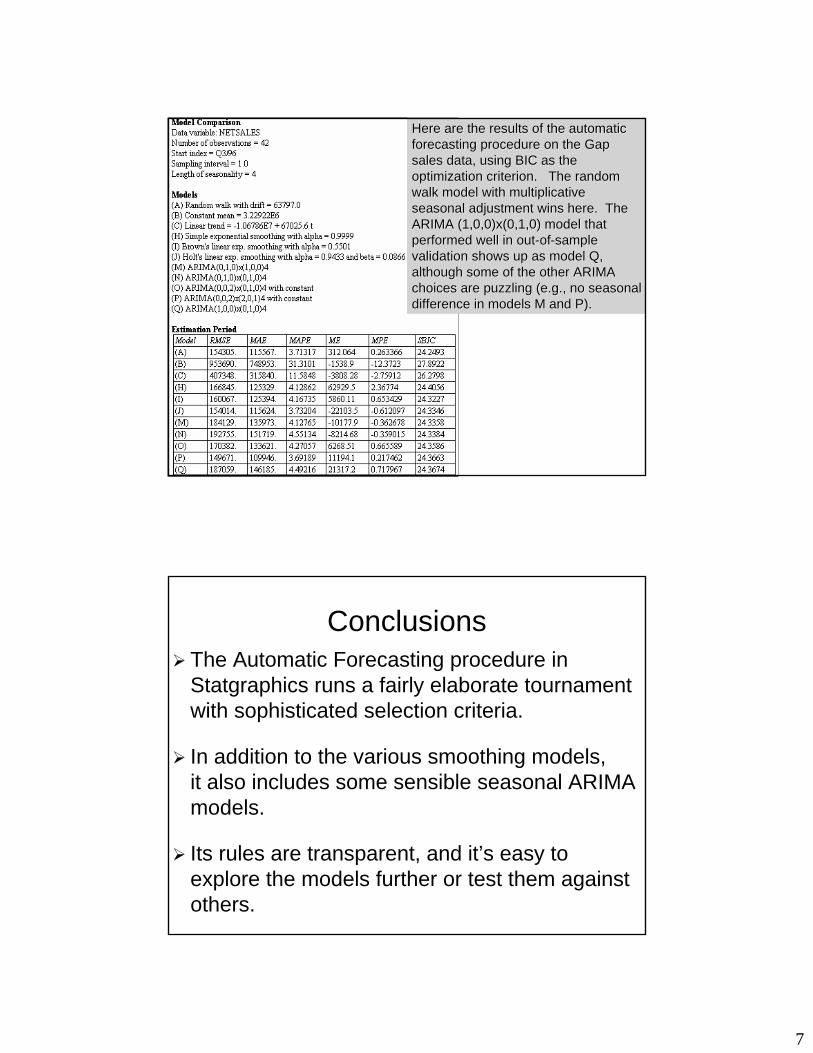
Here are the results of the automatic Here are the results of the automatic forecasting procedure on the Gap forecasting procedure on the Gap sales data, using BIC as the sales data, using BIC as the optimization criterion. The random optimization criterion. The random walk model with multiplicative walk model with multiplicative seasonal adjustment wins here. The seasonal adjustment wins here. The ARIMA (1,0,0)x(0,1,0) model that ARIMA (1,0,0)x(0,1,0) model that performed well in outperformed well in out--ofof--sample sample validation shows up as model Q, validation shows up as model Q, although some of the other ARIMA although some of the other ARIMA choices are puzzling (e.g., no seasonal choices are puzzling (e.g., no seasonal difference in models M and P).difference in models M and P).
ConclusionsConclusionsThe Automatic Forecasting procedure in The Automatic Forecasting procedure in StatgraphicsStatgraphics runs a fairly elaborate tournament runs a fairly elaborate tournament with sophisticated selection criteria.with sophisticated selection criteria.
In addition to the various smoothing models, In addition to the various smoothing models, it also includes some sensible seasonal ARIMA it also includes some sensible seasonal ARIMA models.models.
Its rules are transparent, and it’s easy to Its rules are transparent, and it’s easy to explore the models further or test them against explore the models further or test them against others. others.
8
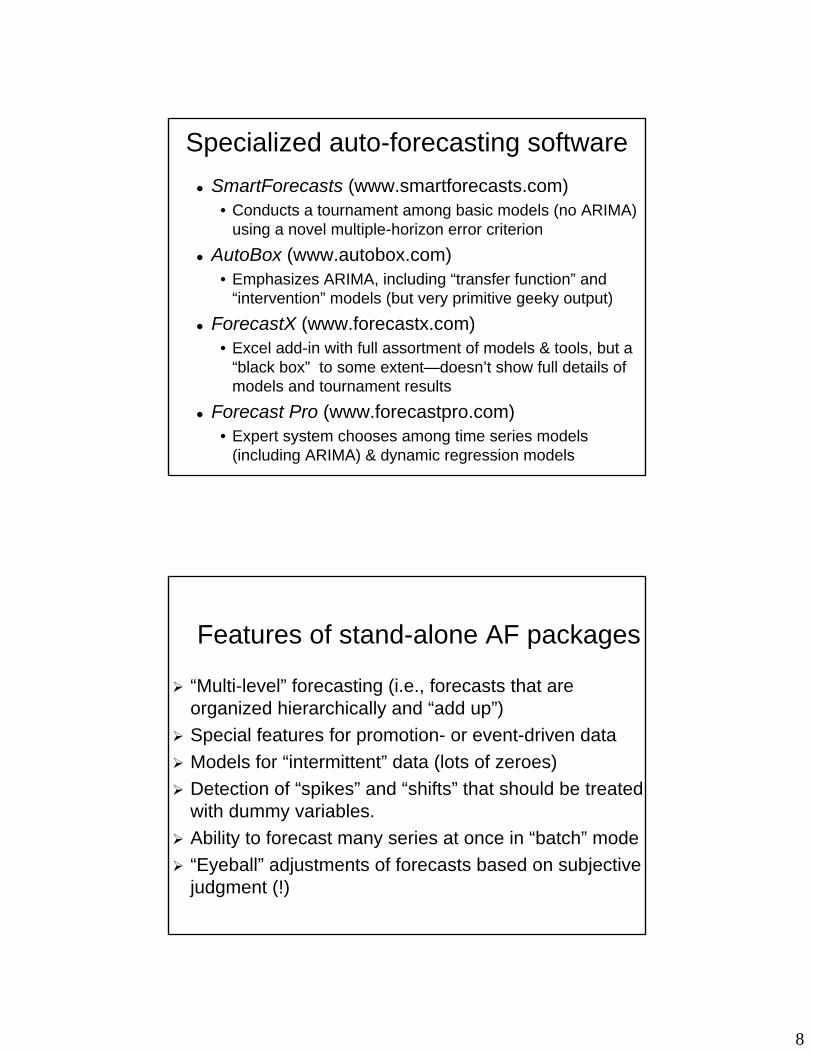
Specialized autoSpecialized auto--forecasting softwareforecasting softwareSmartForecastsSmartForecasts ((www.smartforecasts.comwww.smartforecasts.com))•• Conducts a tournament among basic models (no ARIMA) Conducts a tournament among basic models (no ARIMA)
using a novel multipleusing a novel multiple--horizon error criterionhorizon error criterion
AutoBoxAutoBox ((www.autobox.comwww.autobox.com))•• Emphasizes ARIMA, including “transfer function” and Emphasizes ARIMA, including “transfer function” and
“intervention” models (but very primitive geeky output)“intervention” models (but very primitive geeky output)
ForecastXForecastX ((www.forecastx.comwww.forecastx.com))•• Excel addExcel add--in with full assortment of models & tools, but a in with full assortment of models & tools, but a
“black box” to some extent“black box” to some extent——doesn’t show full details of doesn’t show full details of models and tournament resultsmodels and tournament results
Forecast ProForecast Pro ((www.forecastpro.comwww.forecastpro.com))•• Expert system chooses among time series models Expert system chooses among time series models
(including ARIMA) & dynamic regression models(including ARIMA) & dynamic regression models
Features of standFeatures of stand--alone AF packagesalone AF packages
““MultiMulti--level” forecasting (i.e., forecasts that are level” forecasting (i.e., forecasts that are organized hierarchically and “add up”)organized hierarchically and “add up”)Special features for promotionSpecial features for promotion-- or eventor event--driven datadriven dataModels for “intermittent” data (lots of zeroes)Models for “intermittent” data (lots of zeroes)Detection of “spikes” and “shifts” that should be treated Detection of “spikes” and “shifts” that should be treated with dummy variables.with dummy variables.Ability to forecast many series at once in “batch” modeAbility to forecast many series at once in “batch” mode“Eyeball” adjustments of forecasts based on subjective “Eyeball” adjustments of forecasts based on subjective judgment (!)judgment (!)
9
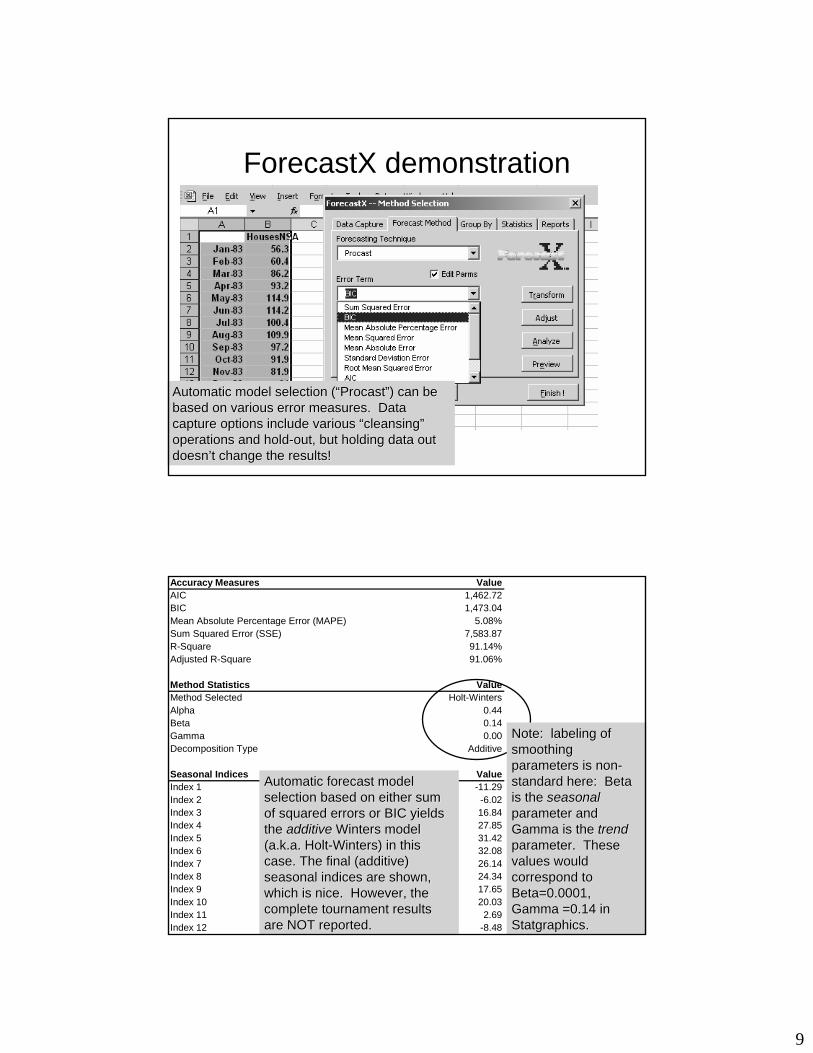
ForecastXForecastX demonstrationdemonstration
Automatic model selection (“Automatic model selection (“ProcastProcast”) can be ”) can be based on various error measures. Data based on various error measures. Data capture options include various “cleansing” capture options include various “cleansing” operations and holdoperations and hold--out, but holding data out out, but holding data out doesn’t change the results!doesn’t change the results!
Accuracy Measures ValueAIC 1,462.72BIC 1,473.04Mean Absolute Percentage Error (MAPE) 5.08%Sum Squared Error (SSE) 7,583.87R-Square 91.14%Adjusted R-Square 91.06%
Method Statistics ValueMethod Selected Holt-WintersAlpha 0.44Beta 0.14Gamma 0.00Decomposition Type Additive
Seasonal Indices ValueIndex 1 -11.29Index 2 -6.02Index 3 16.84Index 4 27.85Index 5 31.42Index 6 32.08Index 7 26.14Index 8 24.34Index 9 17.65Index 10 20.03Index 11 2.69Index 12 -8.48
Automatic forecast model Automatic forecast model selection based on either sum selection based on either sum of squared errors or BIC yields of squared errors or BIC yields the the additive additive Winters model Winters model (a.k.a. Holt(a.k.a. Holt--Winters) in this Winters) in this case. The final (additive) case. The final (additive) seasonal indices are shown, seasonal indices are shown, which is nice. However, the which is nice. However, the complete tournament results complete tournament results are NOT reported.are NOT reported.
Note: labeling of Note: labeling of smoothing smoothing parameters is nonparameters is non--standard here: Beta standard here: Beta is the is the seasonalseasonalparameter and parameter and Gamma is the Gamma is the trend trend parameter. These parameter. These values would values would correspond to correspond to Beta=0.0001, Beta=0.0001, Gamma =0.14 in Gamma =0.14 in StatgraphicsStatgraphics..
10
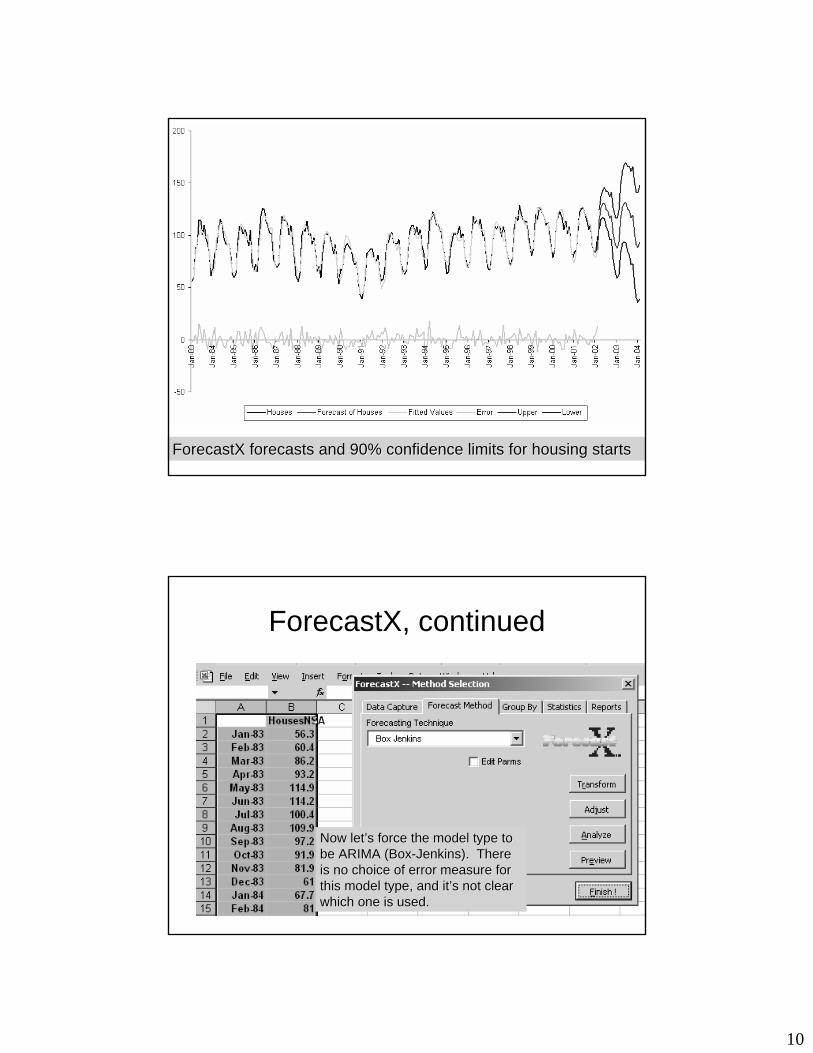
ForecastXForecastX forecasts and 90% confidence limits for housing startsforecasts and 90% confidence limits for housing starts
ForecastXForecastX, continued, continued
Now let’s force the model type to Now let’s force the model type to be ARIMA (Boxbe ARIMA (Box--Jenkins). There Jenkins). There is no choice of error measure for is no choice of error measure for this model type, and it’s not clear this model type, and it’s not clear which one is used.which one is used.
11
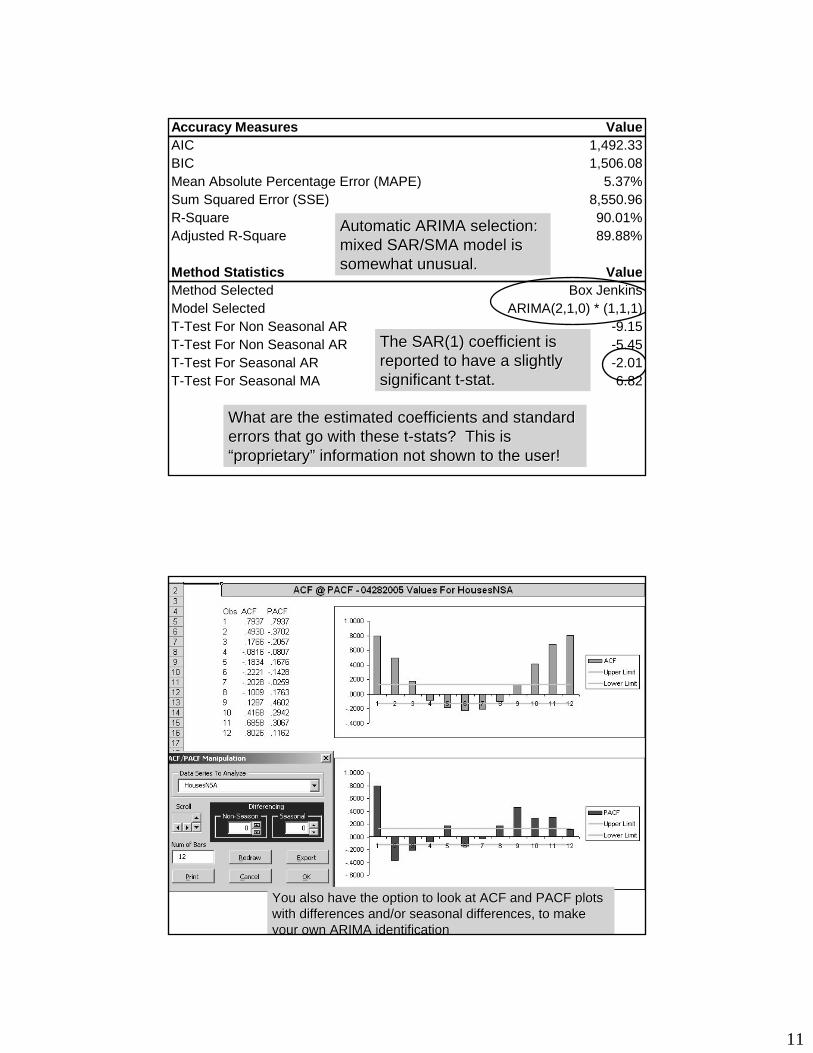
Accuracy Measures ValueAIC 1,492.33BIC 1,506.08Mean Absolute Percentage Error (MAPE) 5.37%Sum Squared Error (SSE) 8,550.96R-Square 90.01%Adjusted R-Square 89.88%
Method Statistics ValueMethod Selected Box JenkinsModel Selected ARIMA(2,1,0) * (1,1,1)T-Test For Non Seasonal AR -9.15T-Test For Non Seasonal AR -5.45T-Test For Seasonal AR -2.01T-Test For Seasonal MA 6.82
Automatic ARIMA selection: Automatic ARIMA selection: mixed SAR/SMA model is mixed SAR/SMA model is somewhat unusual. somewhat unusual.
What are the estimated coefficients and standard What are the estimated coefficients and standard errors that go with these terrors that go with these t--stats? This is stats? This is “proprietary” information not shown to the user! “proprietary” information not shown to the user!
The SAR(1) coefficient is The SAR(1) coefficient is reported to have a slightly reported to have a slightly significant tsignificant t--stat. stat.
You also have the option to look at ACF and PACF plots You also have the option to look at ACF and PACF plots with differences and/or seasonal differences, to make with differences and/or seasonal differences, to make your own ARIMA identificationyour own ARIMA identification
12
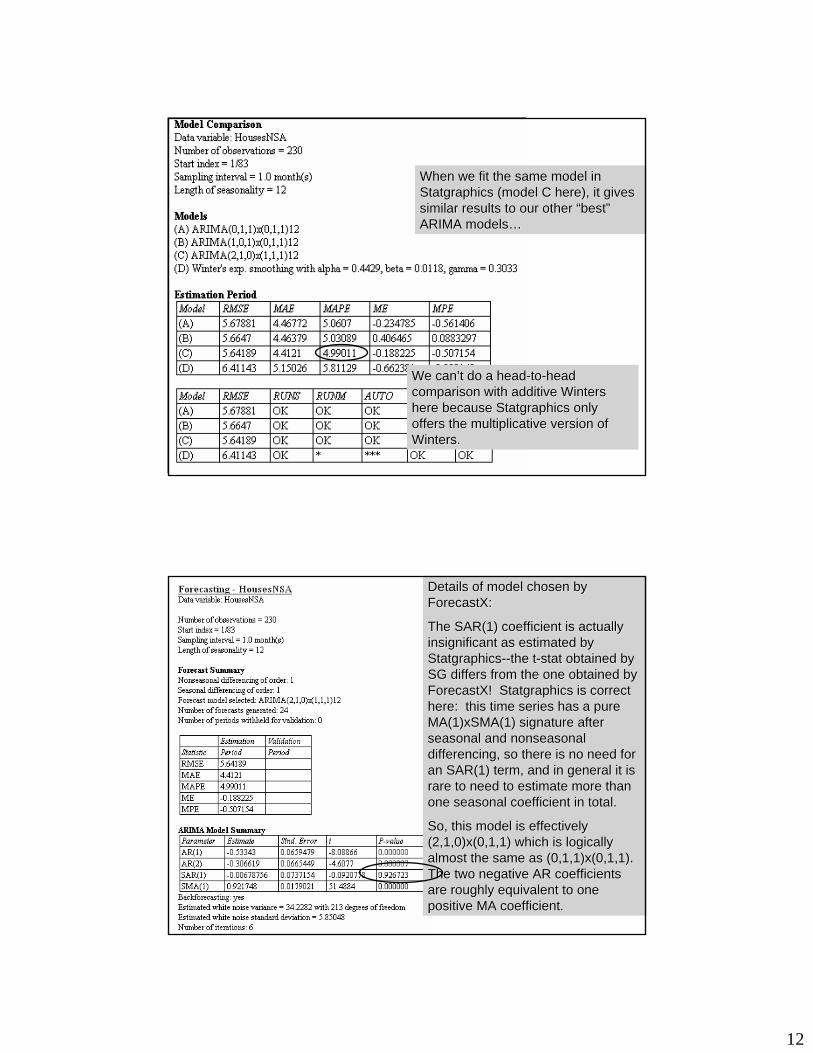
When we fit the same model in When we fit the same model in StatgraphicsStatgraphics (model C here), it gives (model C here), it gives similar results to our other “best” similar results to our other “best” ARIMA models… ARIMA models…
We can’t do a headWe can’t do a head--toto--head head comparison with additive Winters comparison with additive Winters here because here because StatgraphicsStatgraphics only only offers the multiplicative version of offers the multiplicative version of Winters.Winters.
Details of model chosen by Details of model chosen by ForecastXForecastX::
The SAR(1) coefficient is actually The SAR(1) coefficient is actually insignificant as estimated by insignificant as estimated by StatgraphicsStatgraphics----the tthe t--stat obtained by stat obtained by SG differs from the one obtained by SG differs from the one obtained by ForecastXForecastX! ! StatgraphicsStatgraphics is correct is correct here: this time series has a pure here: this time series has a pure MA(1)xSMA(1) signature after MA(1)xSMA(1) signature after seasonal and seasonal and nonseasonalnonseasonaldifferencing, so there is no need for differencing, so there is no need for an SAR(1) term, and in general it is an SAR(1) term, and in general it is rare to need to estimate more than rare to need to estimate more than one seasonal coefficient in total.one seasonal coefficient in total.
So, this model is effectively So, this model is effectively (2,1,0)x(0,1,1) which is logically (2,1,0)x(0,1,1) which is logically almost the same as (0,1,1)x(0,1,1). almost the same as (0,1,1)x(0,1,1). The two negative AR coefficients The two negative AR coefficients are roughly equivalent to one are roughly equivalent to one positive MA coefficient. positive MA coefficient.
13
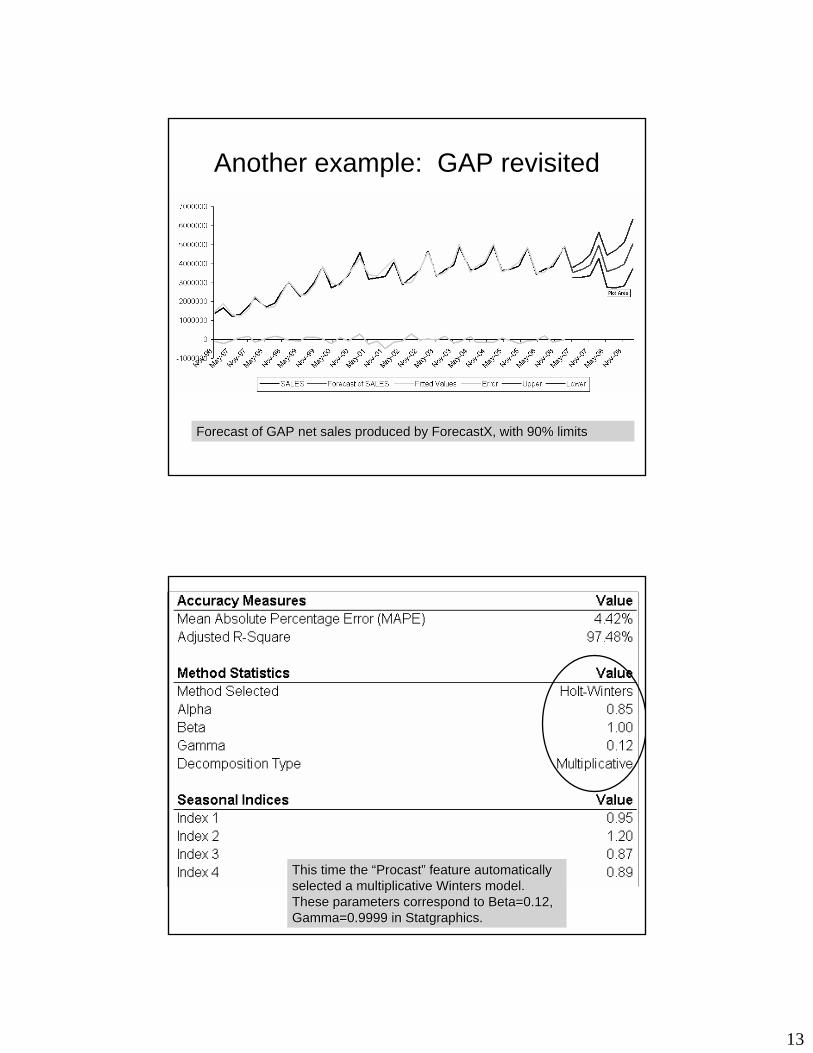
Another example: GAP revisitedAnother example: GAP revisited
Forecast of GAP net sales produced by Forecast of GAP net sales produced by ForecastXForecastX, with 90% limits, with 90% limits
This time the “This time the “ProcastProcast” feature automatically ” feature automatically selected a multiplicative Winters model. selected a multiplicative Winters model. These parameters correspond to Beta=0.12, These parameters correspond to Beta=0.12, Gamma=0.9999 in Gamma=0.9999 in StatgraphicsStatgraphics..
14
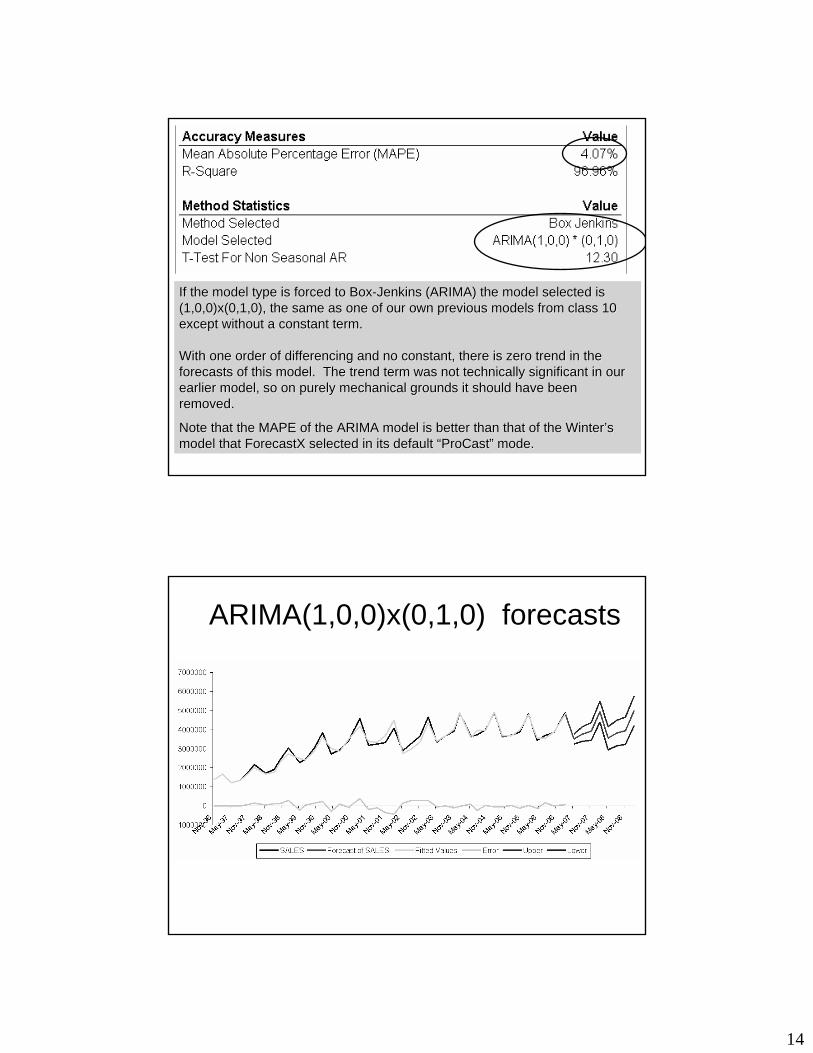
If the model type is forced to BoxIf the model type is forced to Box--Jenkins (ARIMA) the model selected is Jenkins (ARIMA) the model selected is (1,0,0)x(0,1,0), the same as one of our own previous models from(1,0,0)x(0,1,0), the same as one of our own previous models from class 10 class 10 except without a constant term. except without a constant term.
With one order of differencing and no constant, there is zero trWith one order of differencing and no constant, there is zero trend in the end in the forecasts of this model. The trend term was not technically sigforecasts of this model. The trend term was not technically significant in our nificant in our earlier model, so on purely mechanical grounds it should have beearlier model, so on purely mechanical grounds it should have been en removed. removed.
Note that the MAPE of the ARIMA model is better than that of theNote that the MAPE of the ARIMA model is better than that of the Winter’s Winter’s model that model that ForecastXForecastX selected in its default “selected in its default “ProCastProCast” mode.” mode.
ARIMA(1,0,0)x(0,1,0) forecastsARIMA(1,0,0)x(0,1,0) forecasts
15
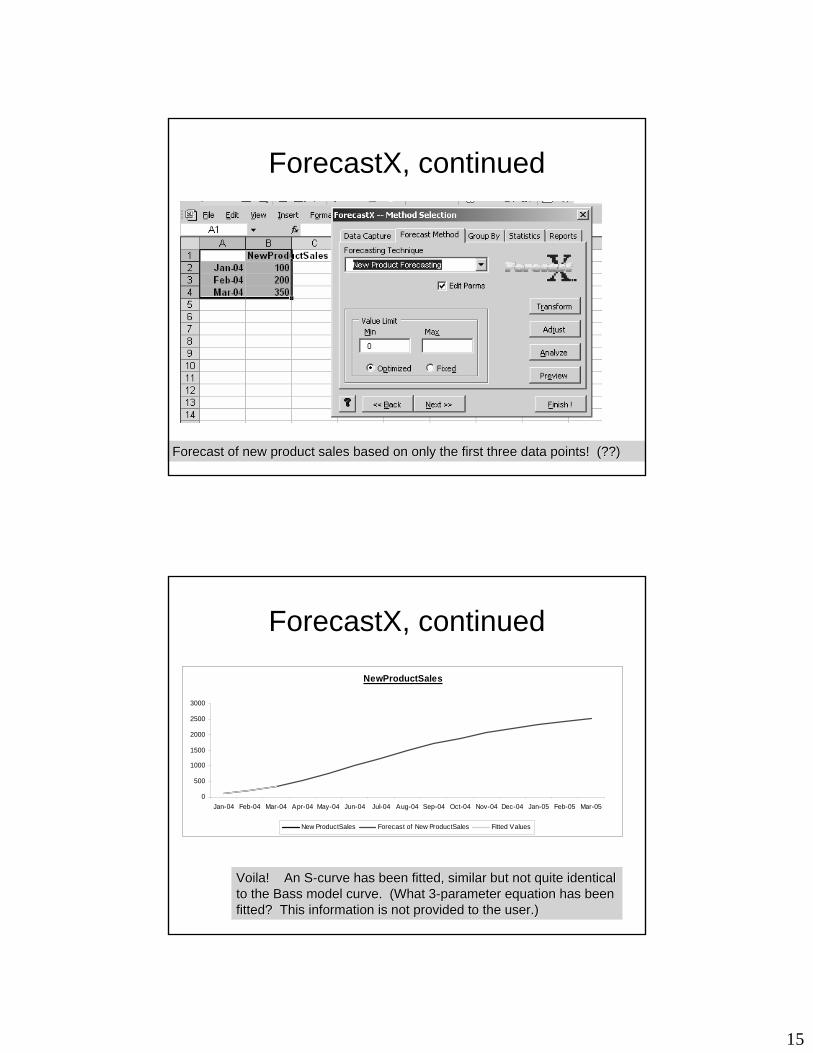
ForecastXForecastX, continued, continued
Forecast of new product sales based on only the first three dataForecast of new product sales based on only the first three data points! (??)points! (??)
ForecastXForecastX, continued, continued
NewProductSales
0
500
1000
1500
2000
2500
3000
Jan-04 Feb-04 Mar-04 Apr-04 May-04 Jun-04 Jul-04 Aug-04 Sep-04 Oct-04 Nov-04 Dec-04 Jan-05 Feb-05 Mar-05
New ProductSales Forecast of New ProductSales Fitted Values
Voila! An SVoila! An S--curve has been fitted, similar but not quite identical curve has been fitted, similar but not quite identical to the Bass model curve. (What 3to the Bass model curve. (What 3--parameter equation has been parameter equation has been fitted? This information is not provided to the user.)fitted? This information is not provided to the user.)
16
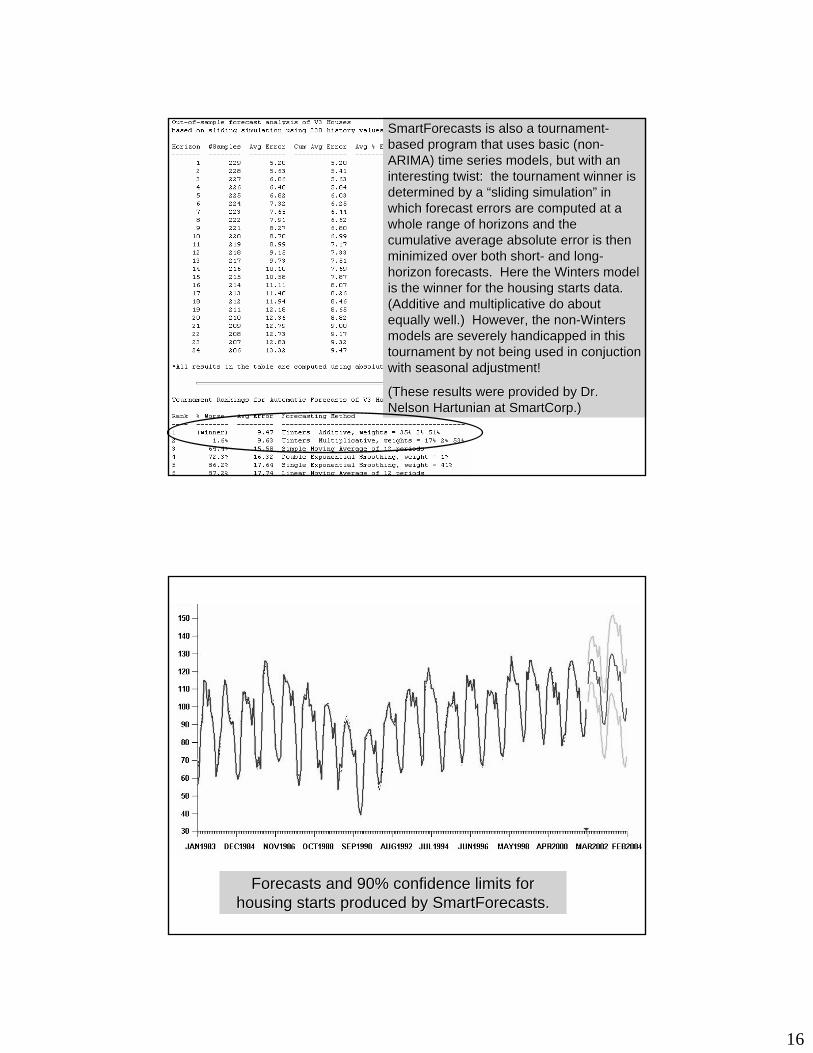
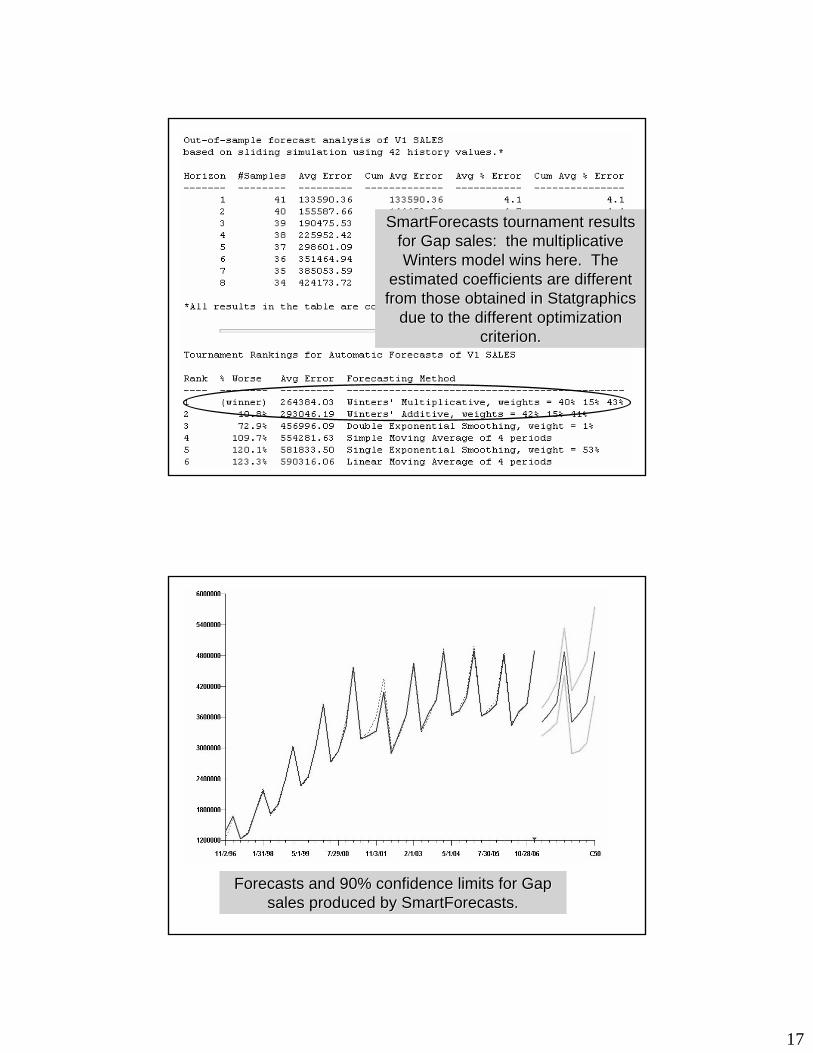
SmartForecastsSmartForecasts is also a tournamentis also a tournament--based program that uses basic (nonbased program that uses basic (non--ARIMA) time series models, but with an ARIMA) time series models, but with an interesting twist: the tournament winner is interesting twist: the tournament winner is determined by a “sliding simulation” in determined by a “sliding simulation” in which forecast errors are computed at a which forecast errors are computed at a whole range of horizons and the whole range of horizons and the cumulative average absolute error is then cumulative average absolute error is then minimized over both shortminimized over both short-- and longand long--horizon forecasts. Here the Winters model horizon forecasts. Here the Winters model is the winner for the housing starts data. is the winner for the housing starts data. (Additive and multiplicative do about (Additive and multiplicative do about equally well.) However, the nonequally well.) However, the non--Winters Winters models are severely handicapped in this models are severely handicapped in this tournament by not being used in tournament by not being used in conjuctionconjuctionwith seasonal adjustment!with seasonal adjustment!
(These results were provided by Dr. (These results were provided by Dr. Nelson Nelson HartunianHartunian at at SmartCorpSmartCorp.).)
Forecasts and 90% confidence limits for Forecasts and 90% confidence limits for housing starts produced by housing starts produced by SmartForecastsSmartForecasts..
17
SmartForecastsSmartForecasts tournament results tournament results for Gap sales: the multiplicative for Gap sales: the multiplicative Winters model wins here. The Winters model wins here. The
estimated coefficients are different estimated coefficients are different from those obtained in from those obtained in StatgraphicsStatgraphics
due to the different optimization due to the different optimization criterion.criterion.
Forecasts and 90% confidence limits for Gap Forecasts and 90% confidence limits for Gap sales produced by sales produced by SmartForecastsSmartForecasts..
18
Limitations of AF softwareLimitations of AF softwareExpert system or tournament committee Expert system or tournament committee isn’t always right, and doesn’t understand isn’t always right, and doesn’t understand YOUR dataYOUR data——sometimes needs to be sometimes needs to be overriddenoverridden
Works on only what you give itWorks on only what you give it——doesn’t doesn’t consider all possibilities for transformations consider all possibilities for transformations or additional variablesor additional variables
At the end of the day, YOU (not the At the end of the day, YOU (not the computer) are responsible for the resultscomputer) are responsible for the results
ConclusionsConclusionsAutomatic forecasting software provides a Automatic forecasting software provides a potentially useful “power tool” for forecastingpotentially useful “power tool” for forecasting
To use it wisely, you need to thoroughly To use it wisely, you need to thoroughly understand how the models work and how understand how the models work and how they they oughtought to be selected via data analysisto be selected via data analysis
By virtue of having completed this course, By virtue of having completed this course, you are now qualified to use automatic you are now qualified to use automatic forecasting softwareforecasting software
19
Scenario 1.Scenario 1. In preparation for an upcoming meeting to discuss In preparation for an upcoming meeting to discuss your corporation's strategic plan, you have been asked to your corporation's strategic plan, you have been asked to prepare a forecast for the sales growth in certain product linesprepare a forecast for the sales growth in certain product lines. . You undertake elaborate statistical data analysis, fitting time You undertake elaborate statistical data analysis, fitting time series models and regression models to examine the effects of series models and regression models to examine the effects of industry trends, product life cycles, market share, industry trends, product life cycles, market share, demographics, promotional activities, etc. Finally you come up demographics, promotional activities, etc. Finally you come up with a model you feel you can trust, which shows that sales with a model you feel you can trust, which shows that sales should increase by 10 percent next year. The 50% confidence should increase by 10 percent next year. The 50% confidence interval ranges from 6 percent to 14 percent.interval ranges from 6 percent to 14 percent.
Two days before the meeting, you learn that the Vice President Two days before the meeting, you learn that the Vice President for Sales has conducted her own field study, in which individualfor Sales has conducted her own field study, in which individualsales representatives were asked to give their own best sales representatives were asked to give their own best estimates of sales in the coming year. Aggregation of these estimates of sales in the coming year. Aggregation of these results has led to a prediction that sales will be up by only abresults has led to a prediction that sales will be up by only about out 5 percent next year. She has just gotten wind of your study and 5 percent next year. She has just gotten wind of your study and calls you in to complain that your forecasts may be used by calls you in to complain that your forecasts may be used by management to set unrealistic quotas for the sales force...management to set unrealistic quotas for the sales force...
Scenario 2.Scenario 2. You are a risk manager for a large casualty You are a risk manager for a large casualty insurance company which handles workers' compensation and insurance company which handles workers' compensation and liability insurance for numerous Fortune 100 corporations. Such liability insurance for numerous Fortune 100 corporations. Such corporations, by virtue of their size, do not need to pool theircorporations, by virtue of their size, do not need to pool theirinsurance risks with other organizations…. Hence, they are insurance risks with other organizations…. Hence, they are covered by "retrospectively rated" insurance plans which are covered by "retrospectively rated" insurance plans which are tantamount to selftantamount to self--insurance but offer significant tax insurance but offer significant tax advantages. Under such a plan, the insured corporation pays advantages. Under such a plan, the insured corporation pays the insurance company for its actual losses, with a markup for the insurance company for its actual losses, with a markup for the insurance company's claimsthe insurance company's claims--handling costs and profit.handling costs and profit.
These plans are complicated by the fact that casualty losses These plans are complicated by the fact that casualty losses "develop" over time. For example, the corporation's actual "develop" over time. For example, the corporation's actual losses for the 1998 calendar year will not be precisely known losses for the 1998 calendar year will not be precisely known for many years: months may elapse between the time an for many years: months may elapse between the time an accident occurs and the time a claim is filed, and years may accident occurs and the time a claim is filed, and years may pass before the final amount of loss is determined. pass before the final amount of loss is determined.
20
At the end of a given year, the insurance company prepares a At the end of a given year, the insurance company prepares a forecast of the total amount of losses which will eventually havforecast of the total amount of losses which will eventually have e to be paid for accidents which occurred during that year.to be paid for accidents which occurred during that year.The insured corporation must at this point pay the The insured corporation must at this point pay the forecastedforecastedlosses, plus markup. The forecast will be readjusted every year losses, plus markup. The forecast will be readjusted every year thereafter as more data accumulates, and the insured thereafter as more data accumulates, and the insured corporation will then pay more money in or get some moneycorporation will then pay more money in or get some moneyback depending on whether the forecast is revised up or down.back depending on whether the forecast is revised up or down.
Suppose that you prepare a revised forecast in midSuppose that you prepare a revised forecast in mid--2006 for the 2006 for the losses which one of your major clients incurred during the yearslosses which one of your major clients incurred during the years19991999--2004. Your revised forecast (which takes into account 2004. Your revised forecast (which takes into account some recent and unfavorable legal precedents pertaining to some recent and unfavorable legal precedents pertaining to outstanding liability claims) shows that those losses were outstanding liability claims) shows that those losses were underestimated by 20 million dollars. In other words, based on underestimated by 20 million dollars. In other words, based on your forecastyour forecast, the client must immediately hand over an , the client must immediately hand over an additional 20 million dollars (plus markup). The accountadditional 20 million dollars (plus markup). The accountexecutive is furious: "We can't tell them that! They'll cancel executive is furious: "We can't tell them that! They'll cancel the the
account…. Why don't we just go ahead and stick with the account…. Why don't we just go ahead and stick with the industryindustry--average loss development factors we used last year?" average loss development factors we used last year?"
Scenario 3A.Scenario 3A. You recently supervised a project to build a sales You recently supervised a project to build a sales forecasting model for one of your consulting firm's major clientforecasting model for one of your consulting firm's major clients. s. The model is hierarchical in structure, and produces forecasts The model is hierarchical in structure, and produces forecasts at the corporate level, the division level, the regional level, at the corporate level, the division level, the regional level, and and the store level: it uses seasonal adjustment and exponential the store level: it uses seasonal adjustment and exponential smoothing, with adjustment and smoothing factors estimated smoothing, with adjustment and smoothing factors estimated separately for different regions. It was developed using a separately for different regions. It was developed using a statistical modeling language and it is linked to a large statistical modeling language and it is linked to a large database of sales data supplied by the client. Last week you database of sales data supplied by the client. Last week you flew to the client's headquarters and presented the model to an flew to the client's headquarters and presented the model to an assembly of regional vice presidents and managers. Many of assembly of regional vice presidents and managers. Many of them were upset with your results, which disagree with their them were upset with your results, which disagree with their own private estimates and are likely to affect their budgets own private estimates and are likely to affect their budgets adversely. The client's top management insisted that they adversely. The client's top management insisted that they would back you up. However…would back you up. However…
21
……this morning when you arrive at work you find a crowd of this morning when you arrive at work you find a crowd of people outside your office. They are a team of auditors people outside your office. They are a team of auditors hired by the client to audit your forecasting model. They hired by the client to audit your forecasting model. They tell you they'd like a conference room with a connection tell you they'd like a conference room with a connection to your computer network that they can use for a few to your computer network that they can use for a few days, and they'd like to see your notes documenting your days, and they'd like to see your notes documenting your modelmodel--selection process, printouts of your statistical selection process, printouts of your statistical reports, the computer files containing your modeling reports, the computer files containing your modeling code, and the files containing the raw data. code, and the files containing the raw data.
Scenario 3B:Scenario 3B: You are an auditor working You are an auditor working for an accounting firm that has just been for an accounting firm that has just been asked to review a forecasting model used asked to review a forecasting model used by one of your clients...by one of your clients...
22
Scenario 4.Scenario 4. The advertising agency for which you The advertising agency for which you work is trying to renew its contract with an important work is trying to renew its contract with an important client. The client has been balking, claiming that your client. The client has been balking, claiming that your ad campaigns have been less successful than ad campaigns have been less successful than promised, and that sales growth has been promised, and that sales growth has been disappointing. Your boss says “run me some numbers disappointing. Your boss says “run me some numbers to show these guys that our ads are really working.” to show these guys that our ads are really working.”
You analyze the data and discover that the effect of You analyze the data and discover that the effect of your ads on sales has on the whole been insignificant. your ads on sales has on the whole been insignificant. However, there is one market in which sales showed a However, there is one market in which sales showed a huge upward spike shortly after your ad campaign huge upward spike shortly after your ad campaign began there. Privately, you believe this was due to the began there. Privately, you believe this was due to the Super Bowl which happened to be held there at the Super Bowl which happened to be held there at the same time. However, if this market is simply same time. However, if this market is simply aggregated with all the others.... aggregated with all the others....
Scenario 5. Scenario 5. You are a professor who teaches You are a professor who teaches forecasting at a leading business school. One forecasting at a leading business school. One day you receive a phone call from a former day you receive a phone call from a former student saying "my boss has asked me to run student saying "my boss has asked me to run some numbers that show our ad campaign is some numbers that show our ad campaign is working, but I‘m having trouble finding a working, but I‘m having trouble finding a statistically significant relationship. What do I statistically significant relationship. What do I need to do to get the Pneed to do to get the P--value below 0.05.....?" value below 0.05.....?"
23
What can you do to avoid trouble?What can you do to avoid trouble?Follow good modeling practices (sensible models, Follow good modeling practices (sensible models, residual diagnostics, outresidual diagnostics, out--ofof--sample validation, etc.)sample validation, etc.)Leave a paper or computer trailLeave a paper or computer trail——i.e., keep welli.e., keep well--annotated records of your modelannotated records of your model--fitting efforts. fitting efforts. Someone else (who may be a sharpSomeone else (who may be a sharp--penciled penciled auditorauditor——or perhaps only yourself 12 months hence) or perhaps only yourself 12 months hence) may have to figure out what you did, and why.may have to figure out what you did, and why.Often the greatest benefit of a forecasting effort is to Often the greatest benefit of a forecasting effort is to identify needs and opportunities to identify needs and opportunities to improve data improve data collection and data integration collection and data integration within the within the organizationorganization——i.e., to develop data as a corporate i.e., to develop data as a corporate asset. Forecasting is easier, more accurate, and asset. Forecasting is easier, more accurate, and less controversial if you have plenty of clean data.less controversial if you have plenty of clean data.
Remember to K.I.S.S. (Keep It Simple… and Remember to K.I.S.S. (Keep It Simple… and intuitively reasonable if at all possible). intuitively reasonable if at all possible).
Neither overstate nor understate the accuracy of Neither overstate nor understate the accuracy of your forecasts. Always report confidence intervals.your forecasts. Always report confidence intervals.
If different forecasting approaches lead to different If different forecasting approaches lead to different results, call attention to their underlying results, call attention to their underlying assumptions, their data sources, their possible assumptions, their data sources, their possible sources of bias, and their respective margins for sources of bias, and their respective margins for error.error.
If YOU believe your model, stand by it! Integrity and If YOU believe your model, stand by it! Integrity and commitment earn respect in the organization. commitment earn respect in the organization. (If you (If you don'tdon't believe your model, go back to the believe your model, go back to the drawing board.)drawing board.)
Thank you!