Embed Size (px)
Citation preview
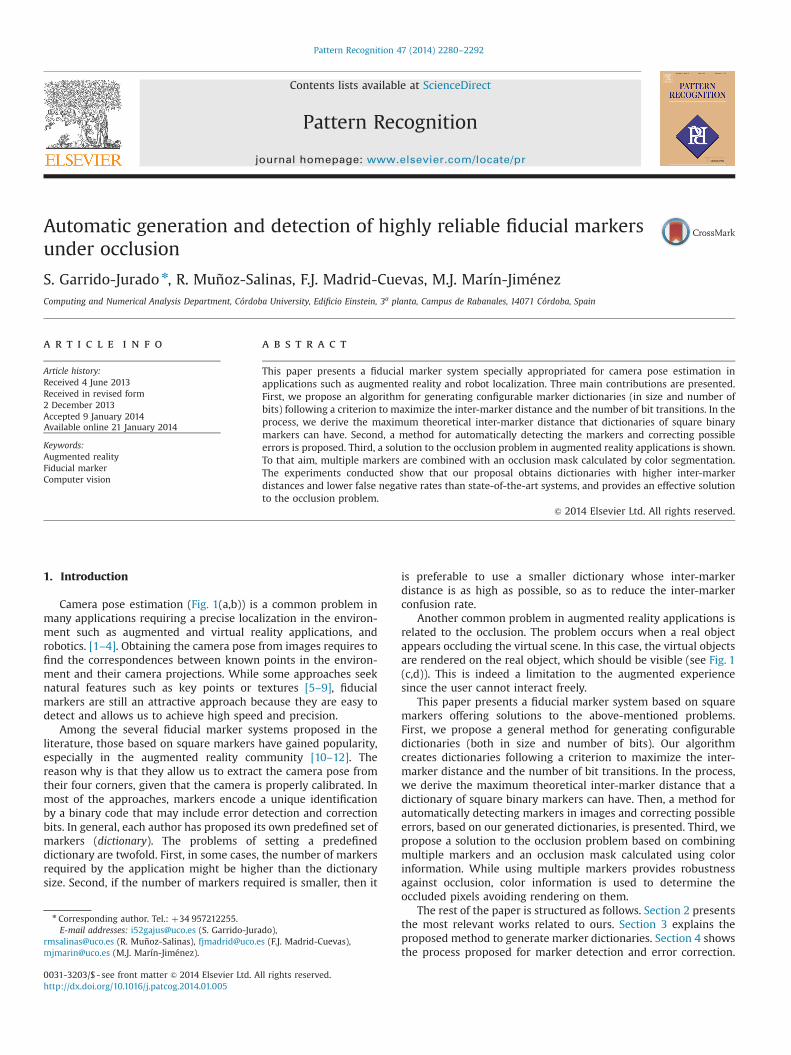
Automatic generation and detection of highly reliable fiducial markersunder occlusion
S. Garrido-Jurado n, R. Muñoz-Salinas, F.J. Madrid-Cuevas, M.J. Marín-JiménezComputing and Numerical Analysis Department, Córdoba University, Edificio Einstein, 3a planta, Campus de Rabanales, 14071 Córdoba, Spain
a r t i c l e i n f o
Article history:Received 4 June 2013Received in revised form2 December 2013Accepted 9 January 2014Available online 21 January 2014
Keywords:Augmented realityFiducial markerComputer vision
a b s t r a c t
This paper presents a fiducial marker system specially appropriated for camera pose estimation inapplications such as augmented reality and robot localization. Three main contributions are presented.First, we propose an algorithm for generating configurable marker dictionaries (in size and number ofbits) following a criterion to maximize the inter-marker distance and the number of bit transitions. In theprocess, we derive the maximum theoretical inter-marker distance that dictionaries of square binarymarkers can have. Second, a method for automatically detecting the markers and correcting possibleerrors is proposed. Third, a solution to the occlusion problem in augmented reality applications is shown.To that aim, multiple markers are combined with an occlusion mask calculated by color segmentation.The experiments conducted show that our proposal obtains dictionaries with higher inter-markerdistances and lower false negative rates than state-of-the-art systems, and provides an effective solutionto the occlusion problem.
& 2014 Elsevier Ltd. All rights reserved.
1. Introduction
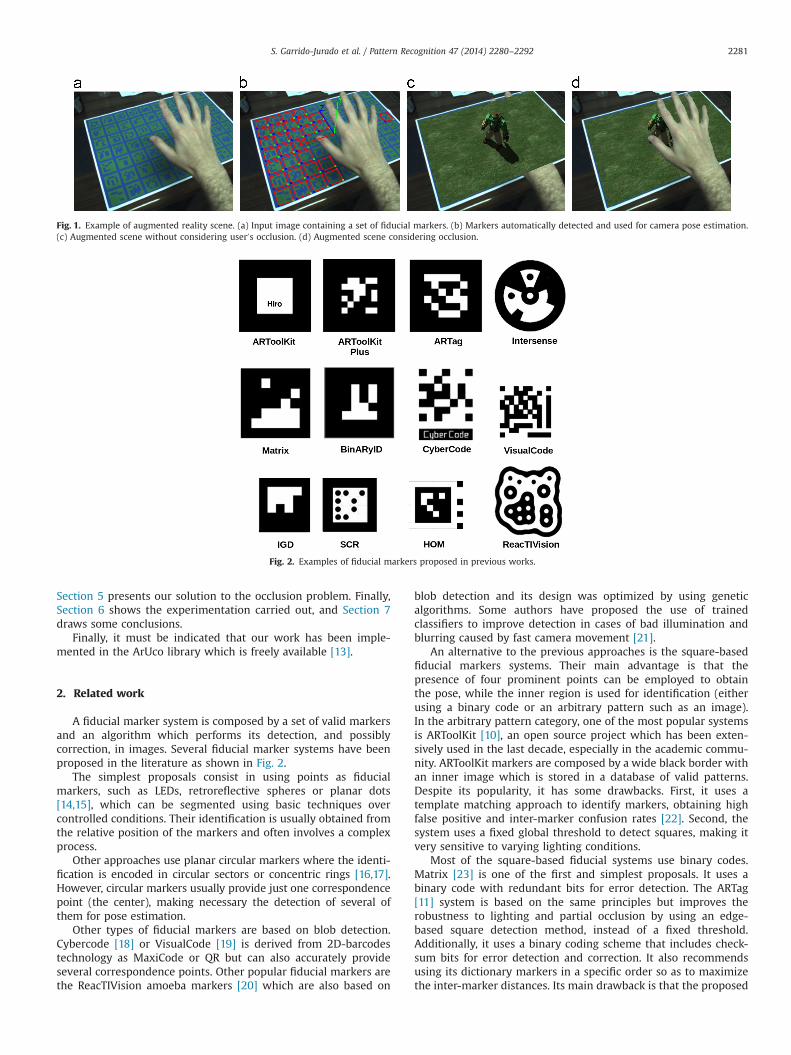
Camera pose estimation (Fig. 1(a,b)) is a common problem inmany applications requiring a precise localization in the environ-ment such as augmented and virtual reality applications, androbotics. [1–4]. Obtaining the camera pose from images requires tofind the correspondences between known points in the environ-ment and their camera projections. While some approaches seeknatural features such as key points or textures [5–9], fiducialmarkers are still an attractive approach because they are easy todetect and allows us to achieve high speed and precision.
Among the several fiducial marker systems proposed in theliterature, those based on square markers have gained popularity,especially in the augmented reality community [10–12]. Thereason why is that they allow us to extract the camera pose fromtheir four corners, given that the camera is properly calibrated. Inmost of the approaches, markers encode a unique identificationby a binary code that may include error detection and correctionbits. In general, each author has proposed its own predefined set ofmarkers (dictionary). The problems of setting a predefineddictionary are twofold. First, in some cases, the number of markersrequired by the application might be higher than the dictionarysize. Second, if the number of markers required is smaller, then it
is preferable to use a smaller dictionary whose inter-markerdistance is as high as possible, so as to reduce the inter-markerconfusion rate.
Another common problem in augmented reality applications isrelated to the occlusion. The problem occurs when a real objectappears occluding the virtual scene. In this case, the virtual objectsare rendered on the real object, which should be visible (see Fig. 1(c,d)). This is indeed a limitation to the augmented experiencesince the user cannot interact freely.
This paper presents a fiducial marker system based on squaremarkers offering solutions to the above-mentioned problems.First, we propose a general method for generating configurabledictionaries (both in size and number of bits). Our algorithmcreates dictionaries following a criterion to maximize the inter-marker distance and the number of bit transitions. In the process,we derive the maximum theoretical inter-marker distance that adictionary of square binary markers can have. Then, a method forautomatically detecting markers in images and correcting possibleerrors, based on our generated dictionaries, is presented. Third, wepropose a solution to the occlusion problem based on combiningmultiple markers and an occlusion mask calculated using colorinformation. While using multiple markers provides robustnessagainst occlusion, color information is used to determine theoccluded pixels avoiding rendering on them.
The rest of the paper is structured as follows. Section 2 presentsthe most relevant works related to ours. Section 3 explains theproposed method to generate marker dictionaries. Section 4 showsthe process proposed for marker detection and error correction.
Contents lists available at ScienceDirect
journal homepage: www.elsevier.com/locate/pr
Pattern Recognition
0031-3203/$ - see front matter & 2014 Elsevier Ltd. All rights reserved.http://dx.doi.org/10.1016/j.patcog.2014.01.005
n Corresponding author. Tel.: þ34 957212255.E-mail addresses: [email protected] (S. Garrido-Jurado),
[email protected] (R. Muñoz-Salinas), [email protected] (F.J. Madrid-Cuevas),[email protected] (M.J. Marín-Jiménez).
Pattern Recognition 47 (2014) 2280–2292
Section 5 presents our solution to the occlusion problem. Finally,Section 6 shows the experimentation carried out, and Section 7draws some conclusions.
Finally, it must be indicated that our work has been imple-mented in the ArUco library which is freely available [13].
2. Related work
A fiducial marker system is composed by a set of valid markersand an algorithm which performs its detection, and possiblycorrection, in images. Several fiducial marker systems have beenproposed in the literature as shown in Fig. 2.
The simplest proposals consist in using points as fiducialmarkers, such as LEDs, retroreflective spheres or planar dots[14,15], which can be segmented using basic techniques overcontrolled conditions. Their identification is usually obtained fromthe relative position of the markers and often involves a complexprocess.
Other approaches use planar circular markers where the identi-fication is encoded in circular sectors or concentric rings [16,17].However, circular markers usually provide just one correspondencepoint (the center), making necessary the detection of several ofthem for pose estimation.
Other types of fiducial markers are based on blob detection.Cybercode [18] or VisualCode [19] is derived from 2D-barcodestechnology as MaxiCode or QR but can also accurately provideseveral correspondence points. Other popular fiducial markers arethe ReacTIVision amoeba markers [20] which are also based on
blob detection and its design was optimized by using geneticalgorithms. Some authors have proposed the use of trainedclassifiers to improve detection in cases of bad illumination andblurring caused by fast camera movement [21].
An alternative to the previous approaches is the square-basedfiducial markers systems. Their main advantage is that thepresence of four prominent points can be employed to obtainthe pose, while the inner region is used for identification (eitherusing a binary code or an arbitrary pattern such as an image).In the arbitrary pattern category, one of the most popular systemsis ARToolKit [10], an open source project which has been exten-sively used in the last decade, especially in the academic commu-nity. ARToolKit markers are composed by a wide black border withan inner image which is stored in a database of valid patterns.Despite its popularity, it has some drawbacks. First, it uses atemplate matching approach to identify markers, obtaining highfalse positive and inter-marker confusion rates [22]. Second, thesystem uses a fixed global threshold to detect squares, making itvery sensitive to varying lighting conditions.
Most of the square-based fiducial systems use binary codes.Matrix [23] is one of the first and simplest proposals. It uses abinary code with redundant bits for error detection. The ARTag[11] system is based on the same principles but improves therobustness to lighting and partial occlusion by using an edge-based square detection method, instead of a fixed threshold.Additionally, it uses a binary coding scheme that includes check-sum bits for error detection and correction. It also recommendsusing its dictionary markers in a specific order so as to maximizethe inter-marker distances. Its main drawback is that the proposed
Fig. 1. Example of augmented reality scene. (a) Input image containing a set of fiducial markers. (b) Markers automatically detected and used for camera pose estimation.(c) Augmented scene without considering user0s occlusion. (d) Augmented scene considering occlusion.
Fig. 2. Examples of fiducial markers proposed in previous works.
S. Garrido-Jurado et al. / Pattern Recognition 47 (2014) 2280–2292 2281
marker dictionary is fixed to 36 bits and the maximum number oferroneous bits that can be corrected is two, independent of theinter-marker distances of the subset of markers used.
ARToolKit Plus [24] improves some of the features of ARToolKit.First, it includes a method to automatically update the globalthreshold value depending on pixel values from previouslydetected markers. Second, it employs binary codes including errordetection and correction, thus achieving higher robustness than itspredecessor. The last known version of ARToolKitPlus employs abinary BCH [25] code for 36 bits markers which presents aminimum Hamming distance of two. As a consequence, ARToolK-itPlus BCH markers can detect a maximum error of one bit andcannot perform error correction. ARToolKitPlus project was haltedand followed by the Studierstube Tracker [12] project which is notpublicly available.
BinARyID [26] proposes a method to generate binary codedmarkers focused on avoiding rotation ambiguities, however it onlyachieves Hamming distance of one between two markers and doesnot present any error correction process. There are also someclosed-source systems which employ square markers such as theSCR, HOM and IGD [27] marker systems used by the ARVIKAproject [28].
This paper proposes a square-based fiducial marker systemwith binary codes. However, instead of using a predefined set ofmarkers, we propose a method for generating configurable markerdictionaries (with arbitrary size and number of markers), contain-ing only the number of markers required. Our algorithm producesmarkers using a criterion to maximize the inter-marker distanceand the number of bit transitions. Additionally, a method fordetecting and correcting errors, based on the dictionary obtained,is proposed. This method allows error correction of a greaternumber of erroneous bits compared to the current state of the artsystems.
Our last contribution is related to the occlusion problem inaugmented reality applications. When designing an augmentedreality application, interactivity is a key aspect to consider. So, onemay expect users to occlude the markers. ARTag handles theproblem in two ways. First, the marker detection method allowssmall breaks in the square sides. Second, they employ severalmarkers simultaneously, thus, the occlusion of some of them doesnot affect the global pose estimation. Despite being robust toocclusion, ARTag still has a main drawback: it cannot detectocclusion precisely. As a consequence, if an object moves betweenthe camera and the augmented scene (e.g. user0s hands), thevirtual objects will be rendered on the hands, hiding it (seeFig. 1(c,d)).
Proposals to detect the occluded regions usually fall into threemain categories: depth-based, model-based, and color-basedapproaches. Depth-based approaches try to calculate the depthof the image pixels to detect occlusions. However, theseapproaches require depth-based sensors, such as stereo, time offlight or structured light cameras [29–31]. When a single camera isused, some authors have adopted model-based approaches[32,33]. The idea is to provide geometric models of the objectswhich can occlude the scene, and detect their pose. This solution isnot practical in many applications where the occluding objects arenot known in advance, and imposes very strong performancelimitations. Finally, color-based approaches [34] can be employed.The idea is to create a color model of the scene (background)which is then compared to the foreground objects.
In this work, we propose the use of multiple markers to handleocclusion (as in ARTag). However, we also propose the use of acolor map for precisely detecting the visible pixels, so that thevirtual scene is only rendered on them. In order to improvesegmentation, we employ blue and green markers, instead ofclassical black-and-white ones. As we experimentally show, our
proposal is an effective method for improving current augmentedreality applications such as in gaming or film industry, althoughnot limited to that.
3. Automatic dictionary generation
The most relevant aspects to consider when designing a markerdictionary are the false positive and negative rates, the inter-marker confusion rate, and the number of valid markers [11]. Thefirst two are often tackled in the literature using error detectionand correction bits, which, on the other hand, reduces the numberof valid markers. The third one depends only on the distancebetween the markers employed. If they are too close, a fewerroneous bits can lead to another valid marker of the dictionary,and the error could not be even detected.
Another desirable property of markers is having a high numberof bit transitions, so that they are less likely to be confused withenvironment objects. For instance, the binary codes with onlyzeros or ones will be printed as completely black or white markers,respectively, which would be easily confused with environmentobjects.
While previous works impose fixed dictionaries, we propose anautomatic method for generating them with the desired numberof markers and with the desired number of bits. Our problem isthen to select m markers, from the space of all markers with n�nbits, D , so that they are as far as possible from each other and withas many bit transitions as possible. In general, the problem is tofind the dictionary Dn that maximizes the desired criterion τ̂ðDÞ:Dn ¼ argmax
DAD
fτ̂ðDÞg ð1Þ
Since a complete evaluation of the search space is not feasibleeven for a small n, a stochastic algorithm that finds suboptimalsolutions is proposed.
3.1. Algorithm overview
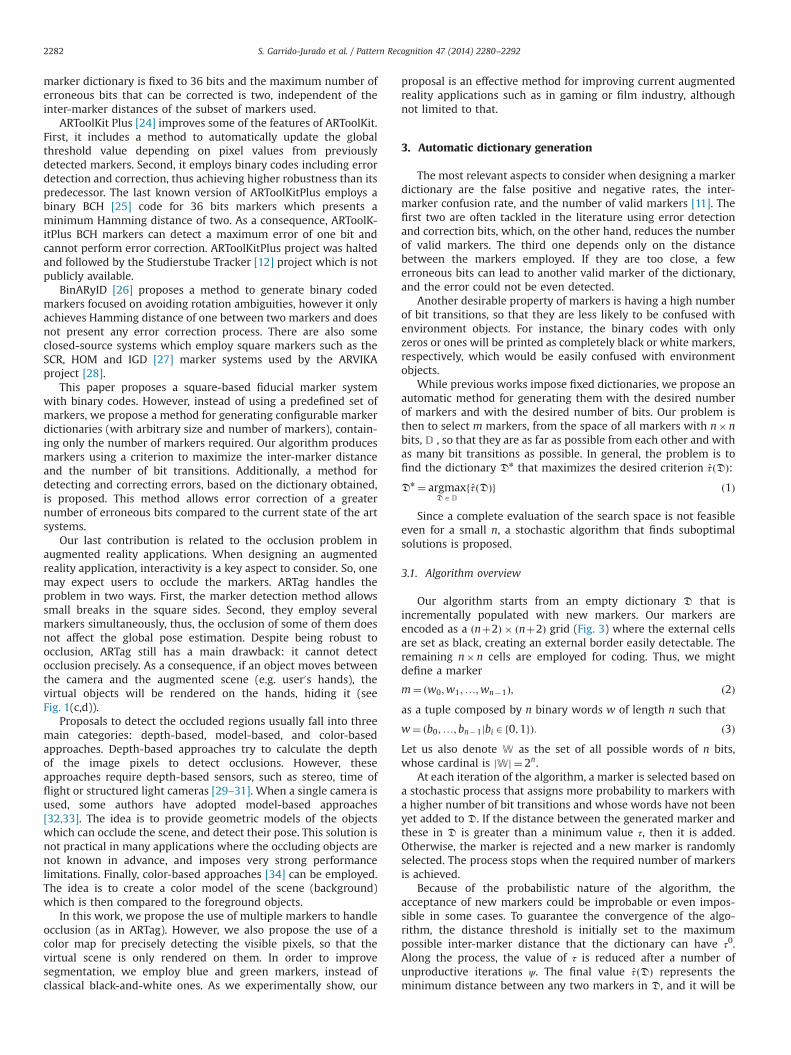
Our algorithm starts from an empty dictionary D that isincrementally populated with new markers. Our markers areencoded as a ðnþ2Þ � ðnþ2Þ grid (Fig. 3) where the external cellsare set as black, creating an external border easily detectable. Theremaining n�n cells are employed for coding. Thus, we mightdefine a marker
m¼ ðw0;w1;…;wn�1Þ; ð2Þas a tuple composed by n binary words w of length n such that
w¼ ðb0;…; bn�1jbiAf0;1gÞ: ð3ÞLet us also denote W as the set of all possible words of n bits,whose cardinal is jWj ¼ 2n.
At each iteration of the algorithm, a marker is selected based ona stochastic process that assigns more probability to markers witha higher number of bit transitions and whose words have not beenyet added to D. If the distance between the generated marker andthese in D is greater than a minimum value τ, then it is added.Otherwise, the marker is rejected and a new marker is randomlyselected. The process stops when the required number of markersis achieved.
Because of the probabilistic nature of the algorithm, theacceptance of new markers could be improbable or even impos-sible in some cases. To guarantee the convergence of the algo-rithm, the distance threshold is initially set to the maximumpossible inter-marker distance that the dictionary can have τ0.Along the process, the value of τ is reduced after a number ofunproductive iterations ψ. The final value τ̂ðDÞ represents theminimum distance between any two markers in D, and it will be
S. Garrido-Jurado et al. / Pattern Recognition 47 (2014) 2280–22922282
used as the base for error detection and correction (explained inSection 4). The proposed algorithm is summarized in Algorithm 1.
Algorithm 1. Dictionary generation process.
D’∅ # Reset dictionaryτ’τ0 # Initialize target distance, see Section 3.4ϱ’0 # Reset unproductive iteration counterwhile D has not desired size do
Generate a new marker m # Section 3.2if distance of m to elements in D is Zτ thenD’D [ m # Add to dictionaryϱ’0
elseϱ’ϱþ1 # It was unproductive# maximum unproductive iteration reached?if ϱ¼ ψ thenτ’τ�1 # Decrease target distanceϱ’0
end ifend if
end while
3.2. Marker generation
As previously pointed out, markers are selected using a randomprocess led by a probability distribution that assigns a higherprobability to these markers with a high number of transitions andwhose words are not yet present in D. The proposed process forgenerating a marker consists in selecting n words from W withreplacement. To do so, each word wiAW has a probability of beingselected at each iteration that is defined as
P w¼wif g ¼ TðwiÞOðwi;DÞ∑wj AWTðwjÞOðwj;DÞ: ð4Þ
Eq. (4) defines the probability of selecting a word as the combina-tion of two functions. The first one, TðwiÞA ½0;1�, is related to thenumber of bit transitions of the word. It is defined as
TðwiÞ ¼ 1�∑n�2
j ¼ 0δðwjþ1i ;wj
iÞn�1
; ð5Þ
being wij the j-bit of the word wi, and δ is 1 if both elements are
equal and 0 otherwise. So, TðwiÞ tends to 1 as the number oftransitions between consecutive bits increases and to 0 as thenumber of transitions decreases. For instance, the words 010110and 000011 present values of T ¼ 4=5 and T ¼ 1=5, respectively,which are proportional to the number of bit transitions.
On the other hand, the function Oðwi;DÞ accounts for thenumber of times the word wi appears among the markers in D.The idea is to reduce the probability of choosing words that havealready been selected many times. It is defined in the interval ½0;1�
as
Oðwi;DÞ ¼ 1�∑mi AD∑wj Amiδðwj;wiÞnjDj if jDja0
1 otherwise:
8<: ð6Þ
The double sum counts the appearances of w among the markersin D, while the denominator counts the total number of words inD. Thus, Oðwi;DÞ is 1 if wi is not in D, and tends to 0 as it appears ahigher number of times. Finally, in the first iteration (jDj ¼ 0), thefunction is defined as 1 so that all words have the same probabilityof being selected.
3.3. Distance calculation
As previously indicated, a marker is added to the dictionary ifits distance to the markers in the dictionary is below τ. Theconcept of distance between markers must be defined consideringthat they are printed as binary grids of n�n bits that can beobserved under rotation. Then, let us define the distance betweentwo markers as
Dðmi;mjÞ ¼ minkA f0;1;2;3g
fHðmi;RkðmjÞÞg: ð7Þ
The function H is the Hamming distance between two markers,which is defined as the sum of Hamming distances between eachpair of marker words. The function Rk is an operator that rotatesthe marker grid k� 901 in the clockwise direction. The function Dis then the rotation-invariant Hamming distance between themarkers.
Let us also define the distance of a marker to a dictionary
Dðmi;DÞ ¼ minmj AD
fDðmi;mjÞg; ð8Þ
as the distance of the marker to the nearest one in the dictionary.Finally, it is not only important to distinguish markers from
each other, but also to correctly identify the marker orientation.Otherwise, pose estimation would fail. So, a valid marker must alsoguarantee that the minimum distance to its own rotations is aboveτ. Thus, we define the marker self-distance as
SðmiÞ ¼ minkA f1;2;3g
fHðmi;RkðmiÞÞg: ð9Þ
In summary, we only add a marker to the dictionary if bothSðmiÞ and Dðmi;DÞ are greater than or equal to τ. Otherwise, themarker is rejected and a new one generated. After a number ofunproductive iterations ψ, the value of τ is decreased by one so asto allow new markers to be added.
In the end, the markers of the generated dictionary have aminimum distance between them and to themselves, τ̂ , that is thelast τ employed. This value can be calculated for any markerdictionary (manually or automatically generated) as
τ̂ðDÞ ¼min minmi AD
fSðmiÞg; minmi amj AD
fDðmi;mjÞg� �
: ð10Þ
Fig. 3. Examples of markers of different sizes, n, generated with the proposed method. From left to right: n¼5, n¼6 and n¼8.
S. Garrido-Jurado et al. / Pattern Recognition 47 (2014) 2280–2292 2283
3.4. Maximum inter-marker distance: τ0
The proposed algorithm requires an initial value for the para-meter τ0. If one analyzes the first iteration (when the dictionary isempty), it is clear that the only distance to consider is the self-distance (Eq. (9)), since the distance to other markers is notapplicable. So, the maximum self-distance for markers of sizen�n (let us denote it by Sn
n) is the maximum distance that adictionary can have for these types of markers. This sectionexplains how to determine Sn
n, which is equivalent to find themarker of size n�n with highest self-distance.
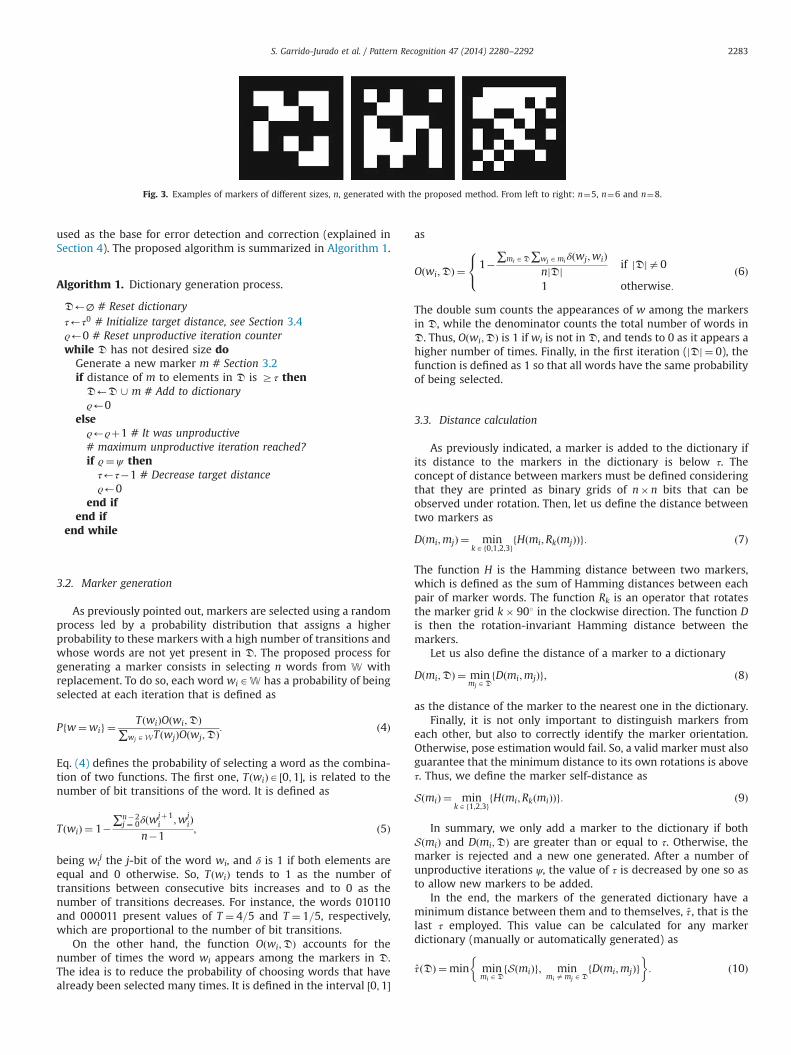
If we analyze the path of the bits when applying 901 rotationsto a marker, it is clear that any bit (x,y) changes its position toanother three locations until it returns to its original position (seeFig. 4). It can be understood that the Hamming distance providedby a marker bit to Eq. (9) is only influenced by these other threebits. So, let us define a quartet as the set composed by thesepositions: fðx; yÞ; ðn�y�1; xÞ; ðn�x�1;n�y�1Þ; ðy;n�x�1Þg.
In general, a marker of size n�n, has a total of C quartets thatcan be calculated as
C ¼ n2
4
� �; ð11Þ
where ⌊�c represents the floor function. If n is odd, the central bitof the marker constitutes a quartet by itself which does notprovide extra distance to S.
If a quartet is expressed as a bit string, a 901 rotation canbe obtained as a circular bit shift operation. For instance, thequartet 1100 becomes ð0110-0011-1001Þ in successive rota-tions. In fact, for the purpose of calculating Sn
n, these four quartetsare equivalent, and we will refer to them as a quartet group Qi. Itcan be seen from Eq. (9) that the contribution of any quartet isgiven by the distance of its successive rotations to the originalquartet. For instance, quartet 1100 contributes to Eq. (9) withdistances ð2;4;2Þ as it rotates:
Hð1100;0110Þ ¼ 2; Hð1100;0011Þ ¼ 4; Hð1100;1001Þ ¼ 2:
But also, if we start from quartet 0110 and rotate it successively, weobtain the quartets ð0011-1001-1100Þ that again provide thedistances ð2;4;2Þ:Hð0110;0011Þ ¼ 2; Hð0110;1001Þ ¼ 4; Hð0110;1100Þ ¼ 2:
In fact, there are only 6 quartet groups (shown in Table 1), thusreducing the problem considerably.
As previously indicated, calculating Sn
n is the problem ofobtaining the marker with highest self-distance, and we haveturned this problem into assigning quartets groups to the Cquartets of a maker. It can be seen that it is in fact a multi-objective optimization, where each quartet group Qi is a possiblesolution and the objectives to maximize are the distances for each
rotation. If the Pareto front is obtained, it can be observed that thegroups Q3 and Q4 dominate the rest of the solutions. Thus, theproblem is simplified, again, to assign Q3 and Q4 to the C quartetsof a marker.
From a brief analysis, it can be deduced that Sn
n is obtained byassigning the groups fQ3;Q3;Q4g (in this order) repeatedly untilcompleting the C quartets. For instance, the simplest marker is a2�2 marker (C¼1), Sn
n ¼ 2 and is obtained by assigning Q3. For a3�3 marker (C¼2), Sn
n ¼ 4 which is obtained by assigning Q3
twice. For a 4�4 marker (C¼4), Sn
n ¼ 10 obtained by assigning thegroups fQ3;Q3;Q4;Q3g. This last case is shown in detail in Table 2.
Therefore, for a generic marker with C quartets, the value Sn
nfollows the rule
Sn
n ¼ 24C3
� �ð12Þ
Then, we employ the value
τ0 ¼ Sn
n; ð13Þ
as a starting point for our algorithm.
Fig. 4. Examples of quartets for a 2�2 and 3�3 marker. Each arrow indicates the destination of a bit after a 901 clockwise rotation.
Table 1Quartet groups and quartet Hamming distances for each rotation.
Group Quartets Hamming distances
901 1801 2701
Q1 0000 0 0 0Q2 1000-0100-0010-0001 2 2 2Q3 1100-0110-0011-1001 2 4 2Q4 0101-1010 4 0 4Q5 1110-0111-1011-1101 2 2 2Q6 1111 0 0 0
Table 2Quartet assignment for a 4�4 marker (C¼4) to obtain Sn
n . It can be observed as thesequence fQ3 ;Q3 ;Q4g is repeated until filling all the quartets in the marker.
Group Quartets Hamming distances
901 1801 2701
1 Q3 2 4 22 Q3 2 4 23 Q4 4 0 44 Q3 2 4 2
Total distances 10 12 10Vn
s minð10;12;10Þ ¼ 10
S. Garrido-Jurado et al. / Pattern Recognition 47 (2014) 2280–22922284
4. Marker detection and error correction
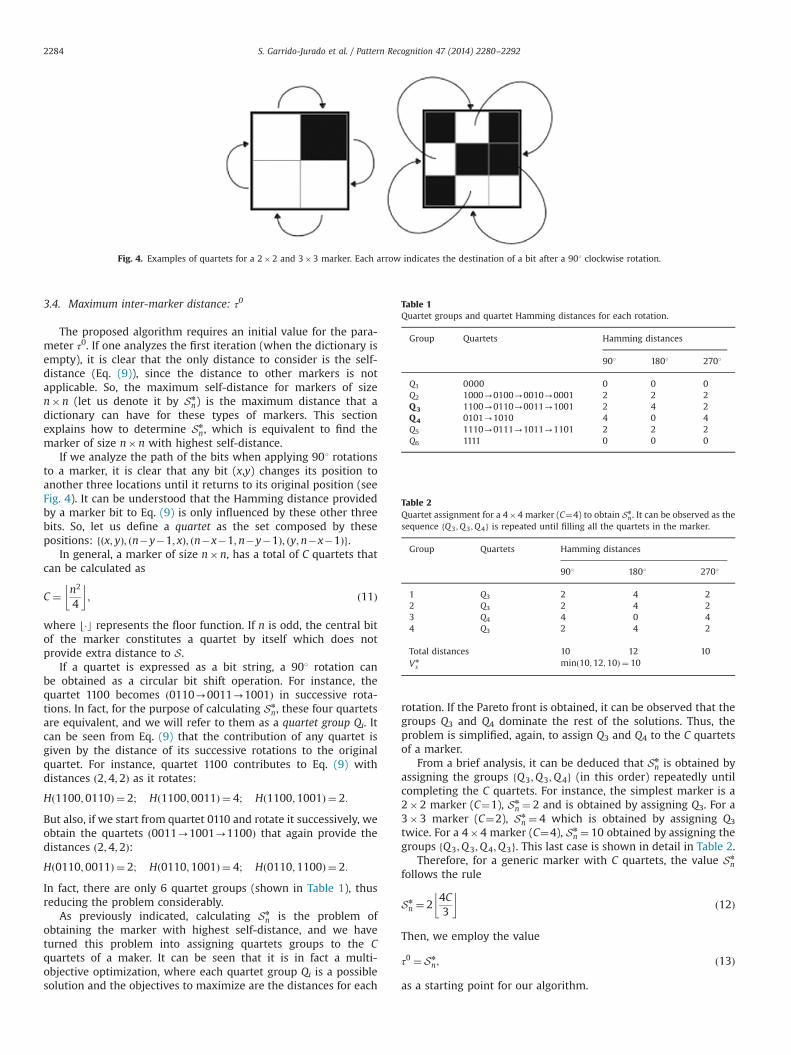
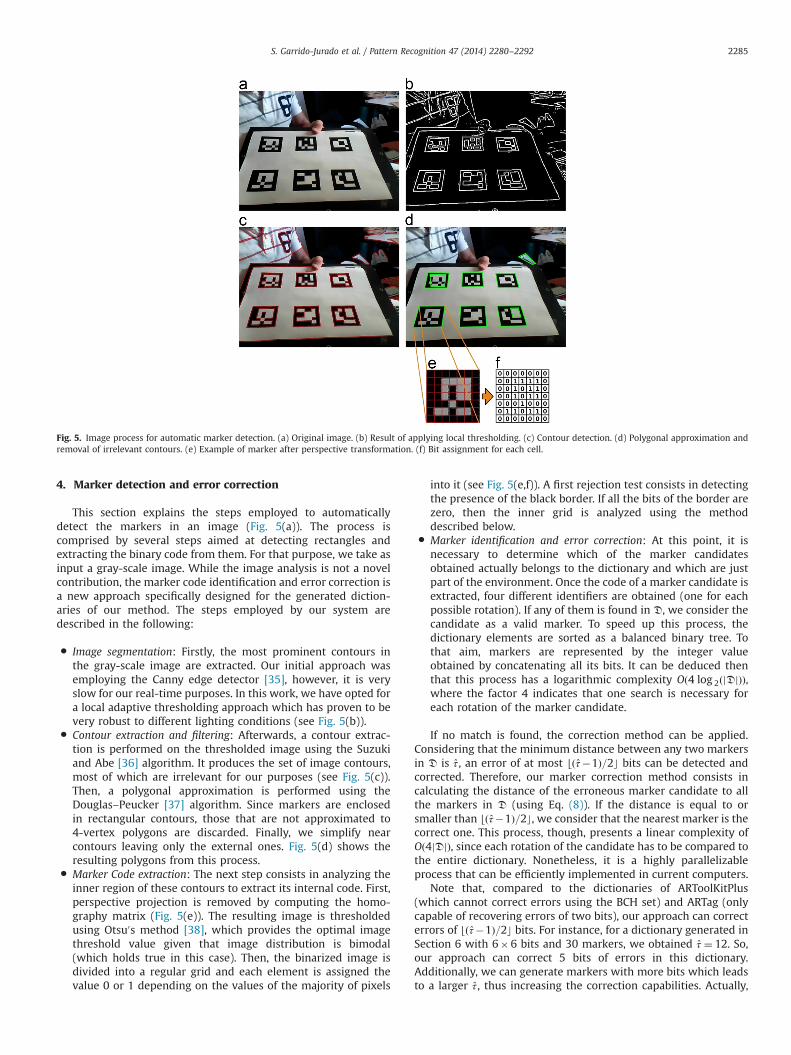
This section explains the steps employed to automaticallydetect the markers in an image (Fig. 5(a)). The process iscomprised by several steps aimed at detecting rectangles andextracting the binary code from them. For that purpose, we take asinput a gray-scale image. While the image analysis is not a novelcontribution, the marker code identification and error correction isa new approach specifically designed for the generated diction-aries of our method. The steps employed by our system aredescribed in the following:
� Image segmentation: Firstly, the most prominent contours inthe gray-scale image are extracted. Our initial approach wasemploying the Canny edge detector [35], however, it is veryslow for our real-time purposes. In this work, we have opted fora local adaptive thresholding approach which has proven to bevery robust to different lighting conditions (see Fig. 5(b)).
� Contour extraction and filtering: Afterwards, a contour extrac-tion is performed on the thresholded image using the Suzukiand Abe [36] algorithm. It produces the set of image contours,most of which are irrelevant for our purposes (see Fig. 5(c)).Then, a polygonal approximation is performed using theDouglas–Peucker [37] algorithm. Since markers are enclosedin rectangular contours, those that are not approximated to4-vertex polygons are discarded. Finally, we simplify nearcontours leaving only the external ones. Fig. 5(d) shows theresulting polygons from this process.
� Marker Code extraction: The next step consists in analyzing theinner region of these contours to extract its internal code. First,perspective projection is removed by computing the homo-graphy matrix (Fig. 5(e)). The resulting image is thresholdedusing Otsu0s method [38], which provides the optimal imagethreshold value given that image distribution is bimodal(which holds true in this case). Then, the binarized image isdivided into a regular grid and each element is assigned thevalue 0 or 1 depending on the values of the majority of pixels
into it (see Fig. 5(e,f)). A first rejection test consists in detectingthe presence of the black border. If all the bits of the border arezero, then the inner grid is analyzed using the methoddescribed below.
� Marker identification and error correction: At this point, it isnecessary to determine which of the marker candidatesobtained actually belongs to the dictionary and which are justpart of the environment. Once the code of a marker candidate isextracted, four different identifiers are obtained (one for eachpossible rotation). If any of them is found in D, we consider thecandidate as a valid marker. To speed up this process, thedictionary elements are sorted as a balanced binary tree. Tothat aim, markers are represented by the integer valueobtained by concatenating all its bits. It can be deduced thenthat this process has a logarithmic complexity Oð4 log 2ðjDjÞÞ,where the factor 4 indicates that one search is necessary foreach rotation of the marker candidate.
If no match is found, the correction method can be applied.Considering that the minimum distance between any two markersin D is τ̂ , an error of at most ⌊ðτ̂�1Þ=2c bits can be detected andcorrected. Therefore, our marker correction method consists incalculating the distance of the erroneous marker candidate to allthe markers in D (using Eq. (8)). If the distance is equal to orsmaller than ⌊ðτ̂�1Þ=2c, we consider that the nearest marker is thecorrect one. This process, though, presents a linear complexity ofOð4jDjÞ, since each rotation of the candidate has to be compared tothe entire dictionary. Nonetheless, it is a highly parallelizableprocess that can be efficiently implemented in current computers.
Note that, compared to the dictionaries of ARToolKitPlus(which cannot correct errors using the BCH set) and ARTag (onlycapable of recovering errors of two bits), our approach can correcterrors of ⌊ðτ̂�1Þ=2c bits. For instance, for a dictionary generated inSection 6 with 6�6 bits and 30 markers, we obtained τ̂ ¼ 12. So,our approach can correct 5 bits of errors in this dictionary.Additionally, we can generate markers with more bits which leadsto a larger τ̂ , thus increasing the correction capabilities. Actually,
Fig. 5. Image process for automatic marker detection. (a) Original image. (b) Result of applying local thresholding. (c) Contour detection. (d) Polygonal approximation andremoval of irrelevant contours. (e) Example of marker after perspective transformation. (f) Bit assignment for each cell.
S. Garrido-Jurado et al. / Pattern Recognition 47 (2014) 2280–2292 2285
our detection and correction method is a general framework thatcan be used with any dictionary (including ARToolKitPlus andARTag dictionaries). In fact, if our method is employed with theARTag dictionary of 30 markers, for instance, we could recoverfrom errors of 5 bits, instead of the 2 bits they can recover from.
� Corner refinement and pose estimation: Once a marker has beendetected, it is possible to estimate its pose with respect to thecamera by iteratively minimizing the reprojection error of thecorners (using for instance the Levenberg–Marquardt algo-rithm [39,40]). While, many approaches have been proposedfor corner detection [41–43], we have opted for doing a linearregression of the marker side pixels to calculate their intersec-tions. This approach was also employed in ARTag [11],ARToolKit [10] and ARToolKitPlus [24].
5. Occlusion detection
Detecting a single marker might fail for different reasons suchas poor lighting conditions, fast camera movement, and occlu-sions. A common approach to improve the robustness of a markersystem is the use of marker boards. A marker board is a patterncomposed by multiple markers whose corner locations arereferred to a common reference system. Boards present two mainadvantages. First, since there are more than one marker, it is lesslikely to lose all of them at the same time. Second, the moremarkers are detected, the more corner points are available forcomputing the camera pose, thus, the pose obtained is lessinfluenced by noise. Fig. 1(a) shows the robustness of a markerboard against partial occlusion.
Based on the marker board idea, a method to overcome theocclusion problem in augmented reality applications (i.e., virtualobjects rendered on real objects as shown in Fig. 1(c,d)) isproposed. Our approach consists in defining a color map of theboard that is employed to compute an occlusion mask by colorsegmentation.
Although the proposed method is general enough to work withany combinations of colors, we have opted in our tests to replaceblack and white markers by others with higher chromatic contrastso as to improve color segmentation. In our case, blue and greenhave been selected. Additionally we have opted for using only thehue component of the HSV color model, since we have observedthat it provides the highest robustness to lighting changes andshadows.
Let us define the color map M as a nc �mc grid, where eachcell c represents the color distribution of the pixels of a boardregion. If the board pose is properly estimated, it is possible tocompute the homography Hm that maps the board image pixels pinto the map space
pm ¼Hmp:
Then, the corresponding cell pc is obtained by discretizing theresult to its nearest value pc ¼ ½pm�. Let us denote by I c the set ofimage board pixels that maps onto cell c.
If the grid size of M is relatively small compared to the size ofthe board in the images, I c will contain pixels of the two mainboard colors. It is assumed then that the distribution of the colorsin each cell can be modeled by a mixture of two Gaussians [44],using the Expectation–Maximization algorithm [45] to obtain itsparameters. Therefore, the pdf of the color u in a cell c can beapproximated by the expression
Pðu; cÞ ¼ ∑k ¼ 1;2
πkN ckðujμck;Σc
kÞ; ð14Þ
where N ckðujμck;Σc
kÞ is the k-th Gaussian distribution and πkc is the
mixing coefficient, being
∑k ¼ 1;2
πck ¼ 1:
In an initial step, the map must be created from a view of theboard without occlusion. In subsequent frames, color segmenta-tion is done analyzing if the probability of a pixel is below a certainthreshold θc. However, to avoid the hard partitioning imposed bythe discretization, the probability of each pixel is computed as theweighted average of the probabilities obtained by the neighborcells in the map
PðpÞ ¼∑cAHðpcÞwðpm; cÞPðpu; cÞ∑cAHðpcÞwðpm; cÞ
; ð15Þ
where pu is the color of the pixel, HðpcÞ �M are the nearestneighbor cells of pc, and
wðpm; cÞ ¼ ð2�jpm�cj1Þ2 ð16Þis a weighting factor based on the L1-norm between the mappedvalue pm and the center of the cell c. The value 2 represents themaximum possible L1 distance between neighbors. As a conse-quence, the proposed weighting value is very fast to compute andprovides good results in practice.
Considering that the dimension of the observed board in theimage is much bigger than the number of cells in the color map,neighbor pixels in the image are likely to have similar probabil-ities. Thus, we can speed up computation by downsampling theimage pixels employed for calculating the mask and assigning thesame value to its neighbors.
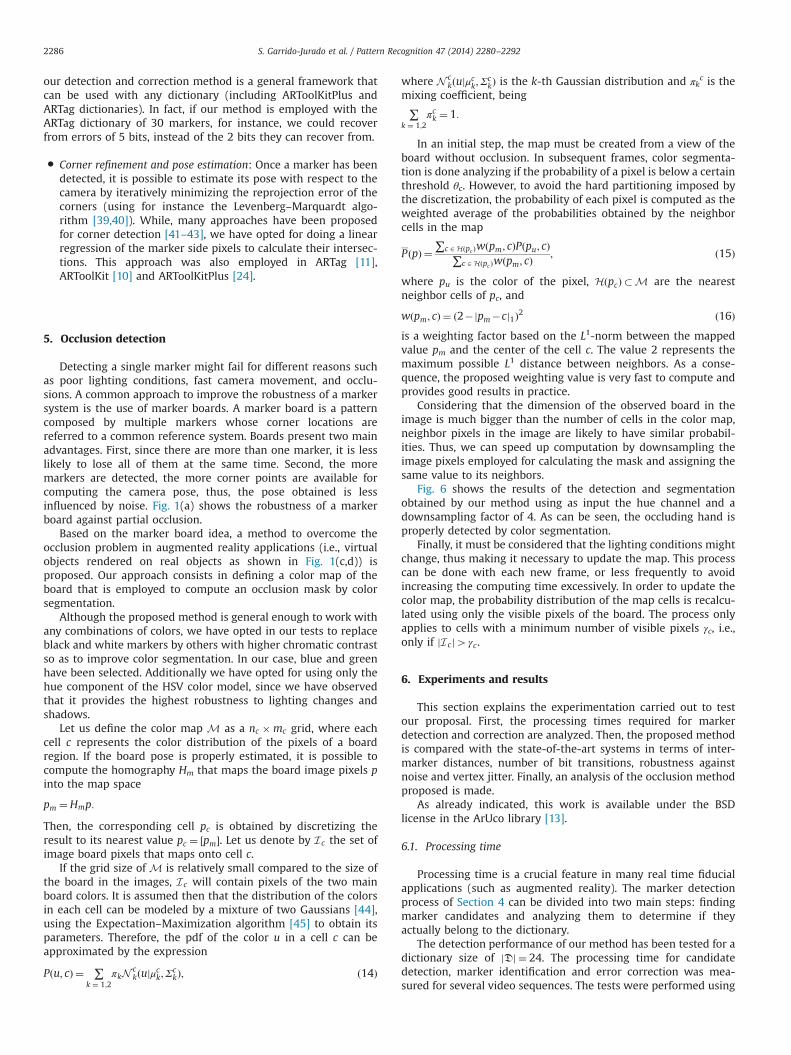
Fig. 6 shows the results of the detection and segmentationobtained by our method using as input the hue channel and adownsampling factor of 4. As can be seen, the occluding hand isproperly detected by color segmentation.
Finally, it must be considered that the lighting conditions mightchange, thus making it necessary to update the map. This processcan be done with each new frame, or less frequently to avoidincreasing the computing time excessively. In order to update thecolor map, the probability distribution of the map cells is recalcu-lated using only the visible pixels of the board. The process onlyapplies to cells with a minimum number of visible pixels γc, i.e.,only if jI cj4γc .
6. Experiments and results
This section explains the experimentation carried out to testour proposal. First, the processing times required for markerdetection and correction are analyzed. Then, the proposed methodis compared with the state-of-the-art systems in terms of inter-marker distances, number of bit transitions, robustness againstnoise and vertex jitter. Finally, an analysis of the occlusion methodproposed is made.
As already indicated, this work is available under the BSDlicense in the ArUco library [13].
6.1. Processing time
Processing time is a crucial feature in many real time fiducialapplications (such as augmented reality). The marker detectionprocess of Section 4 can be divided into two main steps: findingmarker candidates and analyzing them to determine if theyactually belong to the dictionary.
The detection performance of our method has been tested for adictionary size of jDj ¼ 24. The processing time for candidatedetection, marker identification and error correction was mea-sured for several video sequences. The tests were performed using
S. Garrido-Jurado et al. / Pattern Recognition 47 (2014) 2280–22922286
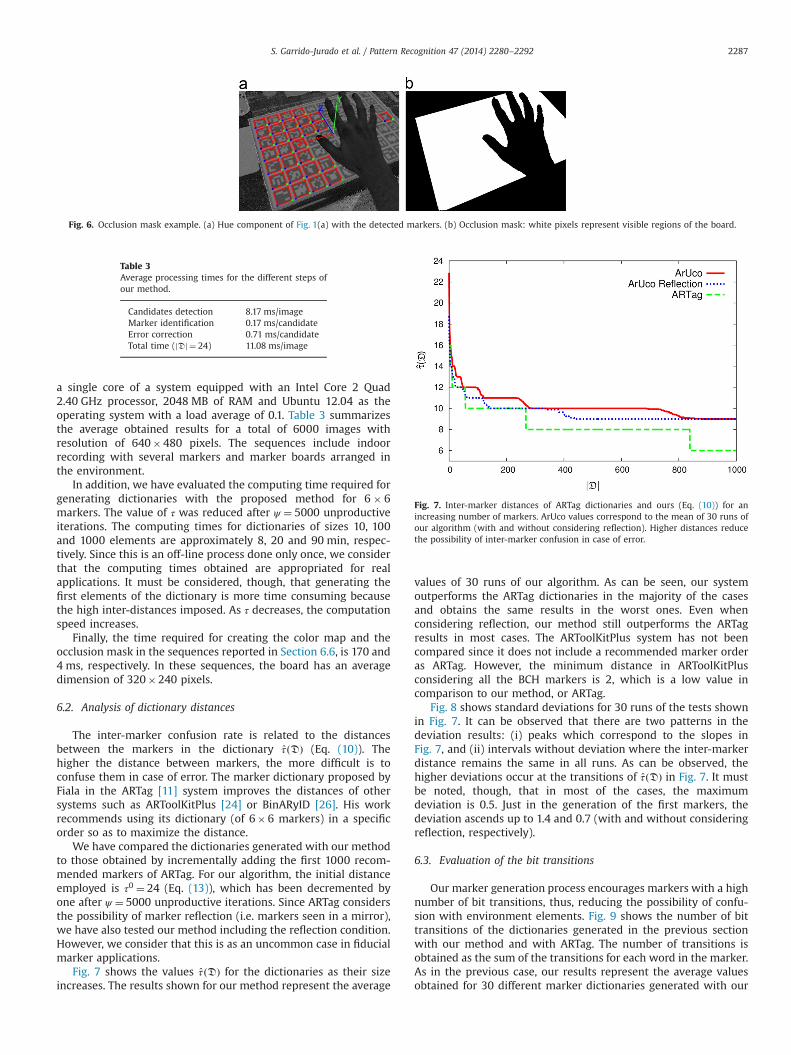
a single core of a system equipped with an Intel Core 2 Quad2.40 GHz processor, 2048 MB of RAM and Ubuntu 12.04 as theoperating system with a load average of 0.1. Table 3 summarizesthe average obtained results for a total of 6000 images withresolution of 640�480 pixels. The sequences include indoorrecording with several markers and marker boards arranged inthe environment.
In addition, we have evaluated the computing time required forgenerating dictionaries with the proposed method for 6� 6markers. The value of τ was reduced after ψ ¼ 5000 unproductiveiterations. The computing times for dictionaries of sizes 10, 100and 1000 elements are approximately 8, 20 and 90 min, respec-tively. Since this is an off-line process done only once, we considerthat the computing times obtained are appropriated for realapplications. It must be considered, though, that generating thefirst elements of the dictionary is more time consuming becausethe high inter-distances imposed. As τ decreases, the computationspeed increases.
Finally, the time required for creating the color map and theocclusion mask in the sequences reported in Section 6.6, is 170 and4 ms, respectively. In these sequences, the board has an averagedimension of 320�240 pixels.
6.2. Analysis of dictionary distances
The inter-marker confusion rate is related to the distancesbetween the markers in the dictionary τ̂ðDÞ (Eq. (10)). Thehigher the distance between markers, the more difficult is toconfuse them in case of error. The marker dictionary proposed byFiala in the ARTag [11] system improves the distances of othersystems such as ARToolKitPlus [24] or BinARyID [26]. His workrecommends using its dictionary (of 6�6 markers) in a specificorder so as to maximize the distance.
We have compared the dictionaries generated with our methodto those obtained by incrementally adding the first 1000 recom-mended markers of ARTag. For our algorithm, the initial distanceemployed is τ0 ¼ 24 (Eq. (13)), which has been decremented byone after ψ ¼ 5000 unproductive iterations. Since ARTag considersthe possibility of marker reflection (i.e. markers seen in a mirror),we have also tested our method including the reflection condition.However, we consider that this is as an uncommon case in fiducialmarker applications.
Fig. 7 shows the values τ̂ðDÞ for the dictionaries as their sizeincreases. The results shown for our method represent the average
values of 30 runs of our algorithm. As can be seen, our systemoutperforms the ARTag dictionaries in the majority of the casesand obtains the same results in the worst ones. Even whenconsidering reflection, our method still outperforms the ARTagresults in most cases. The ARToolKitPlus system has not beencompared since it does not include a recommended marker orderas ARTag. However, the minimum distance in ARToolKitPlusconsidering all the BCH markers is 2, which is a low value incomparison to our method, or ARTag.
Fig. 8 shows standard deviations for 30 runs of the tests shownin Fig. 7. It can be observed that there are two patterns in thedeviation results: (i) peaks which correspond to the slopes inFig. 7, and (ii) intervals without deviation where the inter-markerdistance remains the same in all runs. As can be observed, thehigher deviations occur at the transitions of τ̂ðDÞ in Fig. 7. It mustbe noted, though, that in most of the cases, the maximumdeviation is 0.5. Just in the generation of the first markers, thedeviation ascends up to 1.4 and 0.7 (with and without consideringreflection, respectively).
6.3. Evaluation of the bit transitions
Our marker generation process encourages markers with a highnumber of bit transitions, thus, reducing the possibility of confu-sion with environment elements. Fig. 9 shows the number of bittransitions of the dictionaries generated in the previous sectionwith our method and with ARTag. The number of transitions isobtained as the sum of the transitions for each word in the marker.As in the previous case, our results represent the average valuesobtained for 30 different marker dictionaries generated with our
Fig. 6. Occlusion mask example. (a) Hue component of Fig. 1(a) with the detected markers. (b) Occlusion mask: white pixels represent visible regions of the board.
Table 3Average processing times for the different steps ofour method.
Candidates detection 8.17 ms/imageMarker identification 0.17 ms/candidateError correction 0.71 ms/candidateTotal time (jDj ¼ 24) 11.08 ms/image
Fig. 7. Inter-marker distances of ARTag dictionaries and ours (Eq. (10)) for anincreasing number of markers. ArUco values correspond to the mean of 30 runs ofour algorithm (with and without considering reflection). Higher distances reducethe possibility of inter-marker confusion in case of error.
S. Garrido-Jurado et al. / Pattern Recognition 47 (2014) 2280–2292 2287
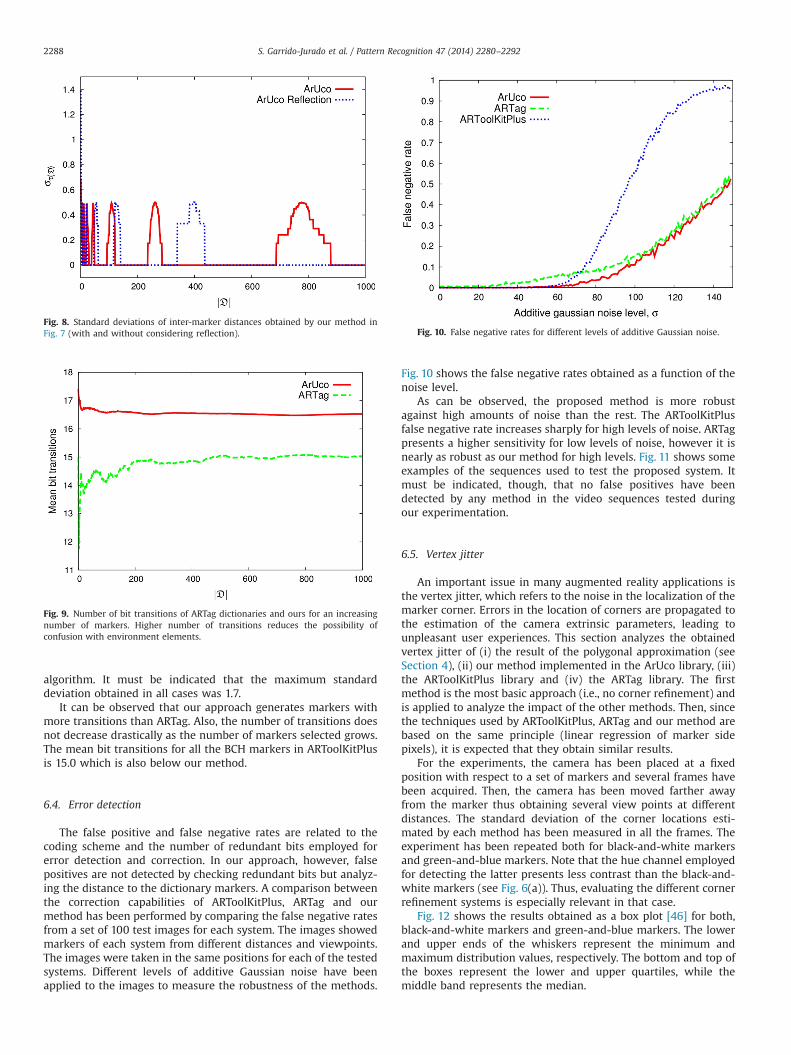
algorithm. It must be indicated that the maximum standarddeviation obtained in all cases was 1.7.
It can be observed that our approach generates markers withmore transitions than ARTag. Also, the number of transitions doesnot decrease drastically as the number of markers selected grows.The mean bit transitions for all the BCH markers in ARToolKitPlusis 15.0 which is also below our method.
6.4. Error detection
The false positive and false negative rates are related to thecoding scheme and the number of redundant bits employed forerror detection and correction. In our approach, however, falsepositives are not detected by checking redundant bits but analyz-ing the distance to the dictionary markers. A comparison betweenthe correction capabilities of ARToolKitPlus, ARTag and ourmethod has been performed by comparing the false negative ratesfrom a set of 100 test images for each system. The images showedmarkers of each system from different distances and viewpoints.The images were taken in the same positions for each of the testedsystems. Different levels of additive Gaussian noise have beenapplied to the images to measure the robustness of the methods.
Fig. 10 shows the false negative rates obtained as a function of thenoise level.
As can be observed, the proposed method is more robustagainst high amounts of noise than the rest. The ARToolKitPlusfalse negative rate increases sharply for high levels of noise. ARTagpresents a higher sensitivity for low levels of noise, however it isnearly as robust as our method for high levels. Fig. 11 shows someexamples of the sequences used to test the proposed system. Itmust be indicated, though, that no false positives have beendetected by any method in the video sequences tested duringour experimentation.
6.5. Vertex jitter
An important issue in many augmented reality applications isthe vertex jitter, which refers to the noise in the localization of themarker corner. Errors in the location of corners are propagated tothe estimation of the camera extrinsic parameters, leading tounpleasant user experiences. This section analyzes the obtainedvertex jitter of (i) the result of the polygonal approximation (seeSection 4), (ii) our method implemented in the ArUco library, (iii)the ARToolKitPlus library and (iv) the ARTag library. The firstmethod is the most basic approach (i.e., no corner refinement) andis applied to analyze the impact of the other methods. Then, sincethe techniques used by ARToolKitPlus, ARTag and our method arebased on the same principle (linear regression of marker sidepixels), it is expected that they obtain similar results.
For the experiments, the camera has been placed at a fixedposition with respect to a set of markers and several frames havebeen acquired. Then, the camera has been moved farther awayfrom the marker thus obtaining several view points at differentdistances. The standard deviation of the corner locations esti-mated by each method has been measured in all the frames. Theexperiment has been repeated both for black-and-white markersand green-and-blue markers. Note that the hue channel employedfor detecting the latter presents less contrast than the black-and-white markers (see Fig. 6(a)). Thus, evaluating the different cornerrefinement systems is especially relevant in that case.
Fig. 12 shows the results obtained as a box plot [46] for both,black-and-white markers and green-and-blue markers. The lowerand upper ends of the whiskers represent the minimum andmaximum distribution values, respectively. The bottom and top ofthe boxes represent the lower and upper quartiles, while themiddle band represents the median.
Fig. 8. Standard deviations of inter-marker distances obtained by our method inFig. 7 (with and without considering reflection).
Fig. 9. Number of bit transitions of ARTag dictionaries and ours for an increasingnumber of markers. Higher number of transitions reduces the possibility ofconfusion with environment elements.
Fig. 10. False negative rates for different levels of additive Gaussian noise.
S. Garrido-Jurado et al. / Pattern Recognition 47 (2014) 2280–22922288
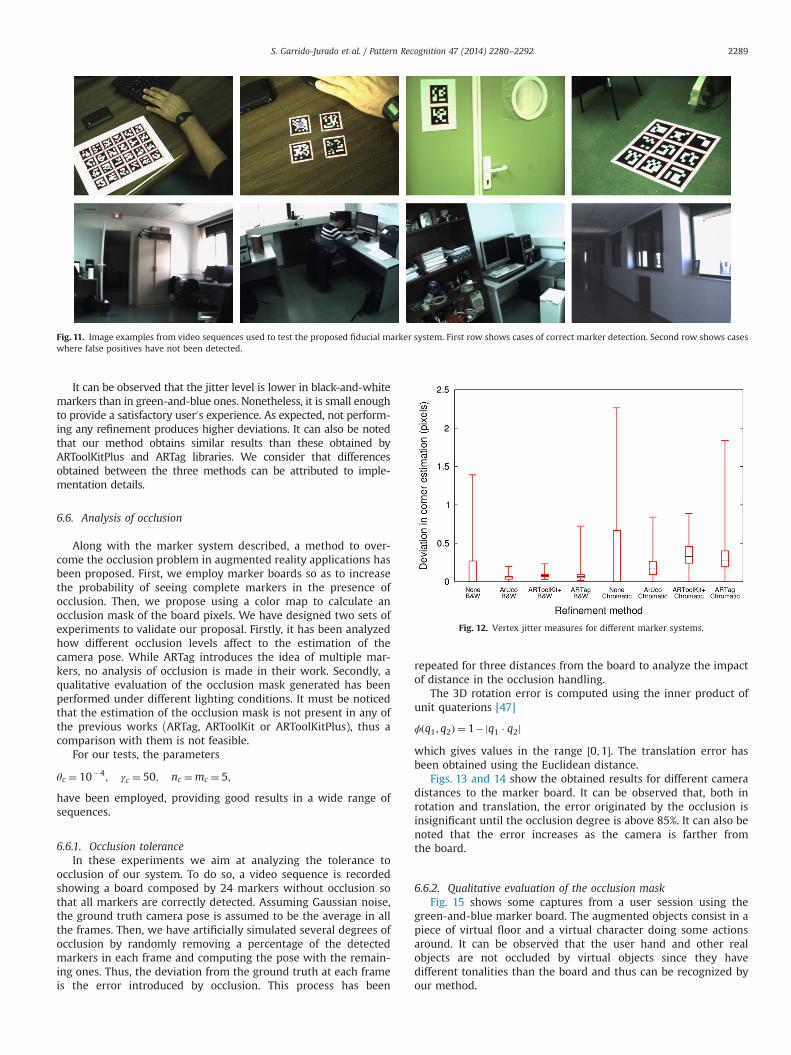
It can be observed that the jitter level is lower in black-and-whitemarkers than in green-and-blue ones. Nonetheless, it is small enoughto provide a satisfactory user0s experience. As expected, not perform-ing any refinement produces higher deviations. It can also be notedthat our method obtains similar results than these obtained byARToolKitPlus and ARTag libraries. We consider that differencesobtained between the three methods can be attributed to imple-mentation details.
6.6. Analysis of occlusion
Along with the marker system described, a method to over-come the occlusion problem in augmented reality applications hasbeen proposed. First, we employ marker boards so as to increasethe probability of seeing complete markers in the presence ofocclusion. Then, we propose using a color map to calculate anocclusion mask of the board pixels. We have designed two sets ofexperiments to validate our proposal. Firstly, it has been analyzedhow different occlusion levels affect to the estimation of thecamera pose. While ARTag introduces the idea of multiple mar-kers, no analysis of occlusion is made in their work. Secondly, aqualitative evaluation of the occlusion mask generated has beenperformed under different lighting conditions. It must be noticedthat the estimation of the occlusion mask is not present in any ofthe previous works (ARTag, ARToolKit or ARToolKitPlus), thus acomparison with them is not feasible.
For our tests, the parameters
θc ¼ 10�4; γc ¼ 50; nc ¼mc ¼ 5;
have been employed, providing good results in a wide range ofsequences.
6.6.1. Occlusion toleranceIn these experiments we aim at analyzing the tolerance to
occlusion of our system. To do so, a video sequence is recordedshowing a board composed by 24 markers without occlusion sothat all markers are correctly detected. Assuming Gaussian noise,the ground truth camera pose is assumed to be the average in allthe frames. Then, we have artificially simulated several degrees ofocclusion by randomly removing a percentage of the detectedmarkers in each frame and computing the pose with the remain-ing ones. Thus, the deviation from the ground truth at each frameis the error introduced by occlusion. This process has been
repeated for three distances from the board to analyze the impactof distance in the occlusion handling.
The 3D rotation error is computed using the inner product ofunit quaterions [47]
ϕðq1; q2Þ ¼ 1�jq1 � q2j
which gives values in the range ½0;1�. The translation error hasbeen obtained using the Euclidean distance.
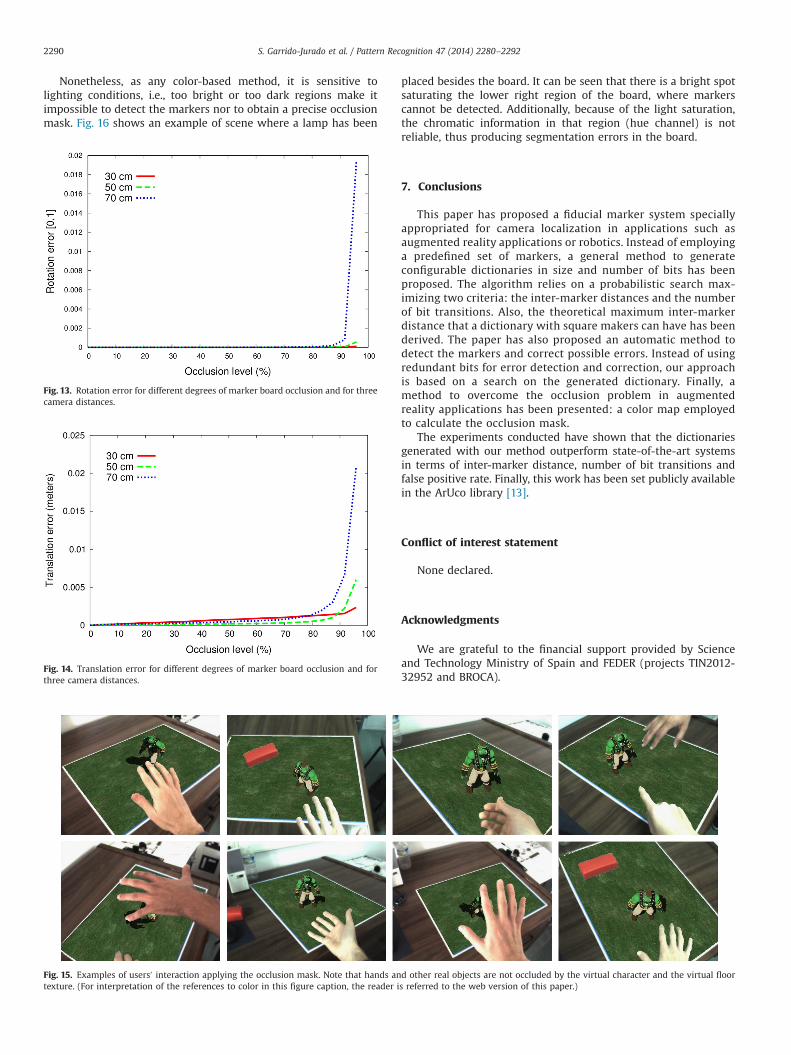
Figs. 13 and 14 show the obtained results for different cameradistances to the marker board. It can be observed that, both inrotation and translation, the error originated by the occlusion isinsignificant until the occlusion degree is above 85%. It can also benoted that the error increases as the camera is farther fromthe board.
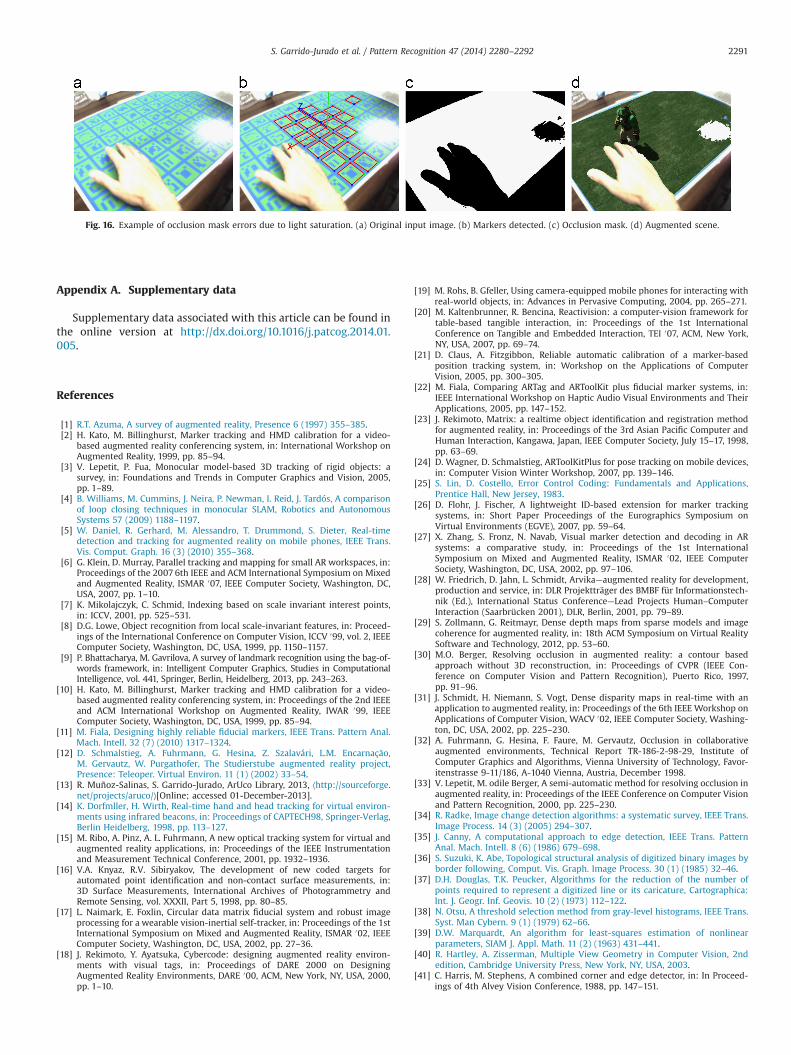
6.6.2. Qualitative evaluation of the occlusion maskFig. 15 shows some captures from a user session using the
green-and-blue marker board. The augmented objects consist in apiece of virtual floor and a virtual character doing some actionsaround. It can be observed that the user hand and other realobjects are not occluded by virtual objects since they havedifferent tonalities than the board and thus can be recognized byour method.
Fig. 11. Image examples from video sequences used to test the proposed fiducial marker system. First row shows cases of correct marker detection. Second row shows caseswhere false positives have not been detected.
Fig. 12. Vertex jitter measures for different marker systems.
S. Garrido-Jurado et al. / Pattern Recognition 47 (2014) 2280–2292 2289
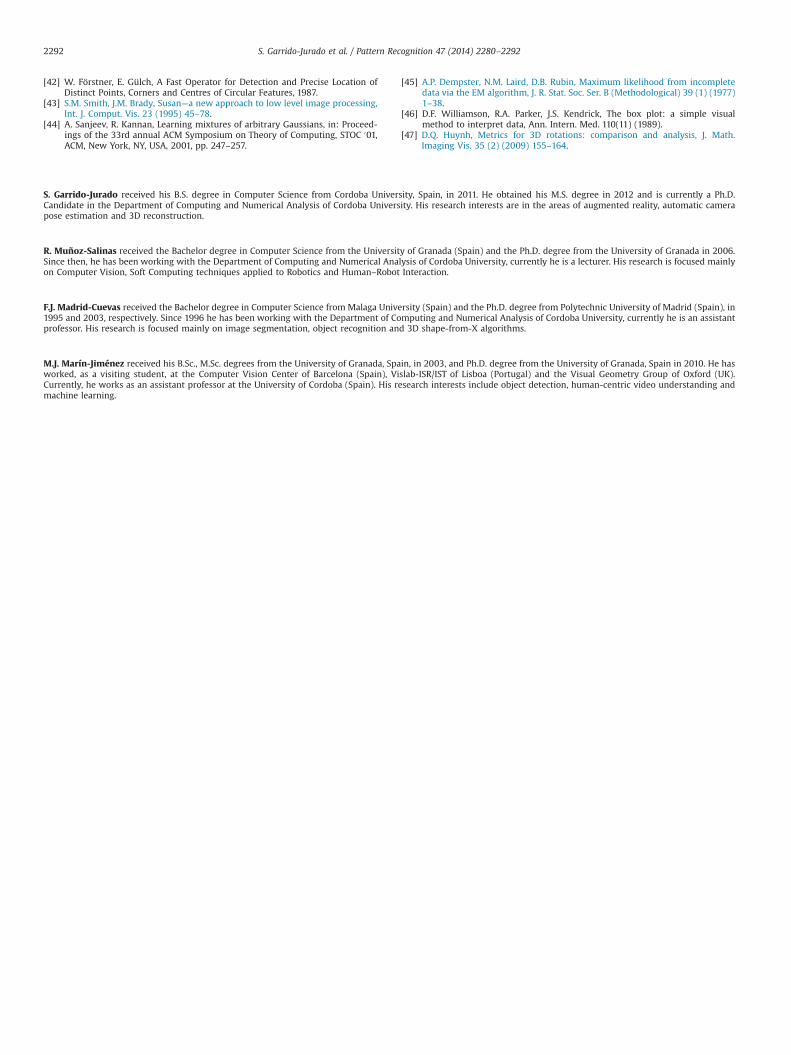
Nonetheless, as any color-based method, it is sensitive tolighting conditions, i.e., too bright or too dark regions make itimpossible to detect the markers nor to obtain a precise occlusionmask. Fig. 16 shows an example of scene where a lamp has been
placed besides the board. It can be seen that there is a bright spotsaturating the lower right region of the board, where markerscannot be detected. Additionally, because of the light saturation,the chromatic information in that region (hue channel) is notreliable, thus producing segmentation errors in the board.
7. Conclusions
This paper has proposed a fiducial marker system speciallyappropriated for camera localization in applications such asaugmented reality applications or robotics. Instead of employinga predefined set of markers, a general method to generateconfigurable dictionaries in size and number of bits has beenproposed. The algorithm relies on a probabilistic search max-imizing two criteria: the inter-marker distances and the numberof bit transitions. Also, the theoretical maximum inter-markerdistance that a dictionary with square makers can have has beenderived. The paper has also proposed an automatic method todetect the markers and correct possible errors. Instead of usingredundant bits for error detection and correction, our approachis based on a search on the generated dictionary. Finally, amethod to overcome the occlusion problem in augmentedreality applications has been presented: a color map employedto calculate the occlusion mask.
The experiments conducted have shown that the dictionariesgenerated with our method outperform state-of-the-art systemsin terms of inter-marker distance, number of bit transitions andfalse positive rate. Finally, this work has been set publicly availablein the ArUco library [13].
Conflict of interest statement
None declared.
Acknowledgments
We are grateful to the financial support provided by Scienceand Technology Ministry of Spain and FEDER (projects TIN2012-32952 and BROCA).
Fig. 13. Rotation error for different degrees of marker board occlusion and for threecamera distances.
Fig. 14. Translation error for different degrees of marker board occlusion and forthree camera distances.
Fig. 15. Examples of users0 interaction applying the occlusion mask. Note that hands and other real objects are not occluded by the virtual character and the virtual floortexture. (For interpretation of the references to color in this figure caption, the reader is referred to the web version of this paper.)
S. Garrido-Jurado et al. / Pattern Recognition 47 (2014) 2280–22922290
Appendix A. Supplementary data
Supplementary data associated with this article can be found inthe online version at http://dx.doi.org/10.1016/j.patcog.2014.01.005.
References
[1] R.T. Azuma, A survey of augmented reality, Presence 6 (1997) 355–385.[2] H. Kato, M. Billinghurst, Marker tracking and HMD calibration for a video-
based augmented reality conferencing system, in: International Workshop onAugmented Reality, 1999, pp. 85–94.
[3] V. Lepetit, P. Fua, Monocular model-based 3D tracking of rigid objects: asurvey, in: Foundations and Trends in Computer Graphics and Vision, 2005,pp. 1–89.
[4] B. Williams, M. Cummins, J. Neira, P. Newman, I. Reid, J. Tardós, A comparisonof loop closing techniques in monocular SLAM, Robotics and AutonomousSystems 57 (2009) 1188–1197.
[5] W. Daniel, R. Gerhard, M. Alessandro, T. Drummond, S. Dieter, Real-timedetection and tracking for augmented reality on mobile phones, IEEE Trans.Vis. Comput. Graph. 16 (3) (2010) 355–368.
[6] G. Klein, D. Murray, Parallel tracking and mapping for small AR workspaces, in:Proceedings of the 2007 6th IEEE and ACM International Symposium on Mixedand Augmented Reality, ISMAR 007, IEEE Computer Society, Washington, DC,USA, 2007, pp. 1–10.
[7] K. Mikolajczyk, C. Schmid, Indexing based on scale invariant interest points,in: ICCV, 2001, pp. 525–531.
[8] D.G. Lowe, Object recognition from local scale-invariant features, in: Proceed-ings of the International Conference on Computer Vision, ICCV 099, vol. 2, IEEEComputer Society, Washington, DC, USA, 1999, pp. 1150–1157.
[9] P. Bhattacharya, M. Gavrilova, A survey of landmark recognition using the bag-of-words framework, in: Intelligent Computer Graphics, Studies in ComputationalIntelligence, vol. 441, Springer, Berlin, Heidelberg, 2013, pp. 243–263.
[10] H. Kato, M. Billinghurst, Marker tracking and HMD calibration for a video-based augmented reality conferencing system, in: Proceedings of the 2nd IEEEand ACM International Workshop on Augmented Reality, IWAR 099, IEEEComputer Society, Washington, DC, USA, 1999, pp. 85–94.
[11] M. Fiala, Designing highly reliable fiducial markers, IEEE Trans. Pattern Anal.Mach. Intell. 32 (7) (2010) 1317–1324.
[12] D. Schmalstieg, A. Fuhrmann, G. Hesina, Z. Szalavári, L.M. Encarnaçäo,M. Gervautz, W. Purgathofer, The Studierstube augmented reality project,Presence: Teleoper. Virtual Environ. 11 (1) (2002) 33–54.
[13] R. Muñoz-Salinas, S. Garrido-Jurado, ArUco Library, 2013, ⟨http://sourceforge.net/projects/aruco/⟩[Online; accessed 01-December-2013].
[14] K. Dorfmller, H. Wirth, Real-time hand and head tracking for virtual environ-ments using infrared beacons, in: Proceedings of CAPTECH98, Springer-Verlag,Berlin Heidelberg, 1998, pp. 113–127.
[15] M. Ribo, A. Pinz, A. L. Fuhrmann, A new optical tracking system for virtual andaugmented reality applications, in: Proceedings of the IEEE Instrumentationand Measurement Technical Conference, 2001, pp. 1932–1936.
[16] V.A. Knyaz, R.V. Sibiryakov, The development of new coded targets forautomated point identification and non-contact surface measurements, in:3D Surface Measurements, International Archives of Photogrammetry andRemote Sensing, vol. XXXII, Part 5, 1998, pp. 80–85.
[17] L. Naimark, E. Foxlin, Circular data matrix fiducial system and robust imageprocessing for a wearable vision-inertial self-tracker, in: Proceedings of the 1stInternational Symposium on Mixed and Augmented Reality, ISMAR 002, IEEEComputer Society, Washington, DC, USA, 2002, pp. 27–36.
[18] J. Rekimoto, Y. Ayatsuka, Cybercode: designing augmented reality environ-ments with visual tags, in: Proceedings of DARE 2000 on DesigningAugmented Reality Environments, DARE 000, ACM, New York, NY, USA, 2000,pp. 1–10.
[19] M. Rohs, B. Gfeller, Using camera-equipped mobile phones for interacting withreal-world objects, in: Advances in Pervasive Computing, 2004, pp. 265–271.
[20] M. Kaltenbrunner, R. Bencina, Reactivision: a computer-vision framework fortable-based tangible interaction, in: Proceedings of the 1st InternationalConference on Tangible and Embedded Interaction, TEI 007, ACM, New York,NY, USA, 2007, pp. 69–74.
[21] D. Claus, A. Fitzgibbon, Reliable automatic calibration of a marker-basedposition tracking system, in: Workshop on the Applications of ComputerVision, 2005, pp. 300–305.
[22] M. Fiala, Comparing ARTag and ARToolKit plus fiducial marker systems, in:IEEE International Workshop on Haptic Audio Visual Environments and TheirApplications, 2005, pp. 147–152.
[23] J. Rekimoto, Matrix: a realtime object identification and registration methodfor augmented reality, in: Proceedings of the 3rd Asian Pacific Computer andHuman Interaction, Kangawa, Japan, IEEE Computer Society, July 15–17, 1998,pp. 63–69.
[24] D. Wagner, D. Schmalstieg, ARToolKitPlus for pose tracking on mobile devices,in: Computer Vision Winter Workshop, 2007, pp. 139–146.
[25] S. Lin, D. Costello, Error Control Coding: Fundamentals and Applications,Prentice Hall, New Jersey, 1983.
[26] D. Flohr, J. Fischer, A lightweight ID-based extension for marker trackingsystems, in: Short Paper Proceedings of the Eurographics Symposium onVirtual Environments (EGVE), 2007, pp. 59–64.
[27] X. Zhang, S. Fronz, N. Navab, Visual marker detection and decoding in ARsystems: a comparative study, in: Proceedings of the 1st InternationalSymposium on Mixed and Augmented Reality, ISMAR 002, IEEE ComputerSociety, Washington, DC, USA, 2002, pp. 97–106.
[28] W. Friedrich, D. Jahn, L. Schmidt, Arvika—augmented reality for development,production and service, in: DLR Projektträger des BMBF für Informationstech-nik (Ed.), International Status Conference—Lead Projects Human–ComputerInteraction (Saarbrücken 2001), DLR, Berlin, 2001, pp. 79–89.
[29] S. Zollmann, G. Reitmayr, Dense depth maps from sparse models and imagecoherence for augmented reality, in: 18th ACM Symposium on Virtual RealitySoftware and Technology, 2012, pp. 53–60.
[30] M.O. Berger, Resolving occlusion in augmented reality: a contour basedapproach without 3D reconstruction, in: Proceedings of CVPR (IEEE Con-ference on Computer Vision and Pattern Recognition), Puerto Rico, 1997,pp. 91–96.
[31] J. Schmidt, H. Niemann, S. Vogt, Dense disparity maps in real-time with anapplication to augmented reality, in: Proceedings of the 6th IEEE Workshop onApplications of Computer Vision, WACV 002, IEEE Computer Society, Washing-ton, DC, USA, 2002, pp. 225–230.
[32] A. Fuhrmann, G. Hesina, F. Faure, M. Gervautz, Occlusion in collaborativeaugmented environments, Technical Report TR-186-2-98-29, Institute ofComputer Graphics and Algorithms, Vienna University of Technology, Favor-itenstrasse 9-11/186, A-1040 Vienna, Austria, December 1998.
[33] V. Lepetit, M. odile Berger, A semi-automatic method for resolving occlusion inaugmented reality, in: Proceedings of the IEEE Conference on Computer Visionand Pattern Recognition, 2000, pp. 225–230.
[34] R. Radke, Image change detection algorithms: a systematic survey, IEEE Trans.Image Process. 14 (3) (2005) 294–307.
[35] J. Canny, A computational approach to edge detection, IEEE Trans. PatternAnal. Mach. Intell. 8 (6) (1986) 679–698.
[36] S. Suzuki, K. Abe, Topological structural analysis of digitized binary images byborder following, Comput. Vis. Graph. Image Process. 30 (1) (1985) 32–46.
[37] D.H. Douglas, T.K. Peucker, Algorithms for the reduction of the number ofpoints required to represent a digitized line or its caricature, Cartographica:Int. J. Geogr. Inf. Geovis. 10 (2) (1973) 112–122.
[38] N. Otsu, A threshold selection method from gray-level histograms, IEEE Trans.Syst. Man Cybern. 9 (1) (1979) 62–66.
[39] D.W. Marquardt, An algorithm for least-squares estimation of nonlinearparameters, SIAM J. Appl. Math. 11 (2) (1963) 431–441.
[40] R. Hartley, A. Zisserman, Multiple View Geometry in Computer Vision, 2ndedition, Cambridge University Press, New York, NY, USA, 2003.
[41] C. Harris, M. Stephens, A combined corner and edge detector, in: In Proceed-ings of 4th Alvey Vision Conference, 1988, pp. 147–151.
Fig. 16. Example of occlusion mask errors due to light saturation. (a) Original input image. (b) Markers detected. (c) Occlusion mask. (d) Augmented scene.
S. Garrido-Jurado et al. / Pattern Recognition 47 (2014) 2280–2292 2291
[42] W. Förstner, E. Gülch, A Fast Operator for Detection and Precise Location ofDistinct Points, Corners and Centres of Circular Features, 1987.
[43] S.M. Smith, J.M. Brady, Susan—a new approach to low level image processing,Int. J. Comput. Vis. 23 (1995) 45–78.
[44] A. Sanjeev, R. Kannan, Learning mixtures of arbitrary Gaussians, in: Proceed-ings of the 33rd annual ACM Symposium on Theory of Computing, STOC 001,ACM, New York, NY, USA, 2001, pp. 247–257.
[45] A.P. Dempster, N.M. Laird, D.B. Rubin, Maximum likelihood from incompletedata via the EM algorithm, J. R. Stat. Soc. Ser. B (Methodological) 39 (1) (1977)1–38.
[46] D.F. Williamson, R.A. Parker, J.S. Kendrick, The box plot: a simple visualmethod to interpret data, Ann. Intern. Med. 110(11) (1989).
[47] D.Q. Huynh, Metrics for 3D rotations: comparison and analysis, J. Math.Imaging Vis. 35 (2) (2009) 155–164.
S. Garrido-Jurado received his B.S. degree in Computer Science from Cordoba University, Spain, in 2011. He obtained his M.S. degree in 2012 and is currently a Ph.D.Candidate in the Department of Computing and Numerical Analysis of Cordoba University. His research interests are in the areas of augmented reality, automatic camerapose estimation and 3D reconstruction.
R. Muñoz-Salinas received the Bachelor degree in Computer Science from the University of Granada (Spain) and the Ph.D. degree from the University of Granada in 2006.Since then, he has been working with the Department of Computing and Numerical Analysis of Cordoba University, currently he is a lecturer. His research is focused mainlyon Computer Vision, Soft Computing techniques applied to Robotics and Human–Robot Interaction.
F.J. Madrid-Cuevas received the Bachelor degree in Computer Science from Malaga University (Spain) and the Ph.D. degree from Polytechnic University of Madrid (Spain), in1995 and 2003, respectively. Since 1996 he has been working with the Department of Computing and Numerical Analysis of Cordoba University, currently he is an assistantprofessor. His research is focused mainly on image segmentation, object recognition and 3D shape-from-X algorithms.
M.J. Marín-Jiménez received his B.Sc., M.Sc. degrees from the University of Granada, Spain, in 2003, and Ph.D. degree from the University of Granada, Spain in 2010. He hasworked, as a visiting student, at the Computer Vision Center of Barcelona (Spain), Vislab-ISR/IST of Lisboa (Portugal) and the Visual Geometry Group of Oxford (UK).Currently, he works as an assistant professor at the University of Cordoba (Spain). His research interests include object detection, human-centric video understanding andmachine learning.
S. Garrido-Jurado et al. / Pattern Recognition 47 (2014) 2280–22922292