Embed Size (px)
Citation preview
AUTHOR COPY
AI Communications 28 (2015) 87–101 87DOI 10.3233/AIC-140617IOS Press
Automatic non-verbal communication skillsanalysis: A quantitative evaluation
Álvaro Cepero a,∗, Albert Clapés a,b and Sergio Escalera a,b
a Departament Matemàtica Aplicada i Anàlisi, Universitat de Barcelona, Gran Via de les Corts Catalanes,Barcelona, SpainE-mails: [email protected], [email protected], [email protected] Computer Vision Center, Campus UAB, Bellaterra, Barcelona, Spain
Abstract. The oral communication competence is defined on the top of the most relevant skills for one’s professional and personallife. Because of the importance of communication in our activities of daily living, it is crucial to study methods to evaluate andprovide the necessary feedback that can be used in order to improve these communication capabilities and, therefore, learn howto express ourselves better. In this work, we propose a system capable of evaluating quantitatively the quality of oral presentationsin an automatic fashion. The system is based on a multi-modal RGB, depth, and audio data description and a fusion approach inorder to recognize behavioral cues and train classifiers able to eventually predict communication quality levels. The performanceof the proposed system is tested on a novel dataset containing Bachelor thesis’ real defenses, presentations from an 8th semesterBachelor courses, and Master courses’ presentations at Universitat de Barcelona. Using as groundtruth the marks assigned byactual instructors, our system achieves high performance categorizing and ranking presentations by their quality, and also makingreal-valued mark predictions.
Keywords: Social signal processing, human behavior analysis, multi-modal data description, multi-modal data fusion, non-verbalcommunication analysis, e-Learning
1. Introduction and related work
Nowadays, the society is demanding new kinds ofcompetences to its citizens and especially its profes-sionals. With the implementation of the Bachelor de-gree in the European Higher Education Area, the con-cept of competences became even more important inthe educational field. One of the main goals of thisplan is to provide specific skills and competences tothe student. Oral expression and communication areamong the most relevant competences in everyone’slife. A nationwide survey conducted in 1988 by theAmerican Society of Training and Development andthe Department of Labor found that oral communica-tion skills were within the top five skills required inpotential hires. Nonetheless, an article in the Septem-ber 2005 issue of the Hiragana Times states that “thegeneration raised by the one-way information providedon TV is poor in communication”. Given the impor-
*Corresponding author: Alvaro Cepero, Departament MatemàticaAplicada i Anàlisi, Universitat de Barcelona, Gran Via de lesCorts Catalanes 585, 08007, Barcelona, Spain. E-mail: [email protected].
tance of communication in our daily life and the dif-ficulty on the current society to train this competence,it is crucial to study methods to evaluate and providethe necessary feedback that can be used in order toimprove these communication capabilities and, there-fore, learn how to express ourselves better. However,we first should define the criteria and methods neededto measure our verbal and non-verbal communicationand provide us the necessary feedback. In this sense,we propose an automatic system capable of providingboth evaluation and feedback on communication skillswithin the e-Learning scope.
e-Learning (from Electronic Learning) is a verybroad term. Typically, it refers to the usage of allkinds of information and communication technolo-gies (ICT) in learning processes or, more particu-larly, in the educational field. In the literature, we finda fine-grained categorization of different e-Learningparadigms: Computer-based Instruction (CBI),Computer-based Training (CBT), Computer-assistedInstruction (CAI), Computer-assisted Training (CAT),and Internet-based Instruction (IBI) or Web-based In-struction (WBI) as extensions of CBI.
0921-7126/15/$27.50 © 2015 – IOS Press and the authors. All rights reserved
AUTHOR COPY
88 Á. Cepero et al. / Automatic non-verbal communication skills analysis: A quantitative evaluation
CBI and CBT have been studied for decades [45].From both past studies [11,24,33] and more recentones [10,18] researchers found that the application ofthese learning paradigms produces a positive effect interms of attitude towards the learning processes andcomputers, and reduces the amount of instruction time.In the state-of-the-art, we find a wide range of appli-cation of these paradigms. For instance, in [36], CBItechniques are applied in order to improve generalproblems solving skills, whereas in [29,39], a morespecific kind of instruction is provided: the training re-quired by the medical staff dealing with patients af-fected by autism or terminal illnesses. Now, in the eraof Internet, in which great amounts of information andknowledge can be instantly available, CBI is evolv-ing to the more general IBI (or WBI) paradigm. To-day, there are higher education courses completely on-line, accessible for everyone via multimedia formatssuch as videolectures; some of them are offered by uni-versities (MitOpenCourseware or Coursera) and oth-ers not (KhanAcademy or Udacity). In fact, these on-line materials do not necessarily have to replace theface-to-face instruction. Many schools, high schools,and universities are making use of virtual educationplatforms, involving in them instructors and students.This emerged combination of face-to-face and onlinelearning is known as blended learning [3].
Computer-assisted paradigms, unlike computer-based ones, give the initiative to the learner and thepresence of the computer tends to be more unobtrusive,which in some cases turns out to be more convenientfor the instruction goals’ accomplishment. CAI/CATcan be used to train everyday life-related competences,for instance, in the beginning readers training [2] orin the prosody training in new language learners [21].Also the instruction or training of professional compe-tences can be assisted by a computer, like the surgeryskills teaching [19]. People affected by particular con-ditions (elderly or illness) can also benefit from e-Learning. In [20], the authors intended to improve thelife of elder people improving their cognitive perfor-mance, while in [44] the authors focused in the assis-tance of physically conditioned patients to train theirwheelchair’s moving ability.
Our proposed tool fits in the Computer-assistedTraining e-Learning paradigm. The training of the non-verbal communicative competence could be aided pro-viding auditory and/or visual feedback both duringthe non-verbal communication act and/or posteriorly.In this context, we found previous studies evaluatingthe non-verbal communication quality. In [22] medicalstudents’ are evaluated in terms of non-verbal commu-
nication during their clinical examinations exercisesor patients’ interviews. In fact, the indicators the au-thors of the study defined are quite similar to the onesdefined and analyzed automatically in our proposal.However, in the work of [22] the evaluation of the non-verbal communication is not performed automatically,but by human observers.
Whereas the verbal communication can be evaluatedas successful or not given some quite clear criteria –such as amount of knowledge transmission, richness ofthe language expression, discourse coherence and co-hesion, and so forth – the non-verbal communicationinstead is often quite explicit to a human observer. Thenon-verbal signals are implicit in the human behaviorand relatively subtle, despite the huge amount of infor-mation they provide about the communication and thecommunicating subject. Besides, the non-verbal sig-nals are not always easily separable, so as to be clearlyidentified and evaluated individually, but they emergeas a whole and complex behavior. There is a vast lit-erature in psychology studying the non-verbal compo-nent in communication act and its impact to the people.For instance, the study of [1] discussed the teacher’snon-verbal behavior and its effects on higher educationstudents.
In this context, and from the point of view of Ar-tificial Intelligence (AI), we are at the beginning ofa long way to go. While the verbal communicationstarted to be automatically analyzed many years agoby the Natural Language Processing AI’s subfield, thestudy of the non-verbal communication from the AI’spoint of view is relatively recent. In the past decade,one can find works in the field of social robotics build-ing physical embodied agents capable of both emu-lating the humans’ non-verbal behavior and perceiv-ing information from the humans’ non-verbal cue [5].In [4], a social robot’s head was emulating not onlythe infants’ non-verbal behavior but also their percep-tion abilities, the ones necessary to interpret the humannon-verbal communication signals from visual and au-ditory cues. So much effort has been put in trying toprovide to physical or virtual embodied agents the abil-ity to emit meaningful and effective non-verbal com-municative signals [8], since it has been shown thischanges how the people interact with them [2]. On theother hand, we also need to know how to provide to themachines the ability to receive and interpret non-verbalcommunication signals emitted by a human beings.
In order to build machines capable of socially be-have as we do and to be able to interact with us natu-rally – as we do with other people – we need in firstplace to better understand how the humans communi-cate to each other and develop methods for the auto-
AUTHOR COPY
Á. Cepero et al. / Automatic non-verbal communication skills analysis: A quantitative evaluation 89
matic interpretation of these social signals. The SocialSignal Processing field is the one that focuses on theautomatic analysis of interactions among subjects ex-changing communication signals (roles, signs of dom-inance, attitude towards the other subjects, and so on)by means of different sensors, such as microphonesor cameras, applying some kind of pattern recognitionstrategies. Those tasks include the automatic analysisof non-verbal behavioral cues, that psychologists havegrouped into five major classes [42], though most re-cent approaches are based on three of them: gesturesand postures (considered as the most reliable featureabout people’s attitude towards others), face and eyebehavior, and vocal behavior.
Several works have been recently published in theSocial Signal Processing field in which the non-verbalcommunication of subjects group interactions are ana-lyzed [41]. Most of these works focus on audio analy-sis, and main goals are based on detecting/identifyingdominance, influence, and leadership. In the workof [30], the authors present the implementation of aplatform for measuring and analyzing human behav-ior in organizational face-to-face settings using wear-able electronic badges. The authors of [26] presentthe recognition of group actions in meetings with ap-proaches based on Hidden Markov Models model-ing audiovisual-featured observations. Other recent ap-proaches for dominance analysis in group interroga-tions have been also proposed [14]. The work of [31]presents a Bayesian framework that models dominanceskills based on audio input sources. In [35], the authorsmodel a multi-modal audio-video system to recognizeleadership in group interactions. The system is definedbased on simple multi-modal features under controlledface-to-face interaction environments. In a similar sce-nario, the proposal of [25] defines multi-modal cues forthe analysis of communication skills in an upper bodysetup. A more general purpose approach is presentedin [28], where prosodic features are computed to de-fine a set of relevant traits of subjects in oral commu-nication settings. In our case, the main objective of theanalysis is to be able, not to detect or segment socialevents, but to quantitatively evaluate the level of qual-ity of the non-verbal communication and to, later, havethe possibility to embed it in an e-Learning tool to as-sist in the training of this competence. Very few workshave been reported on the analysis of non-verbal com-munication as a competence skill in e-Learning scenar-ios. The authors of [38] present a system based on au-dio analysis from mobile devices to analyze the com-municative skills and provide relevant feedback to sub-jects that may suffer from communication problemsand some degree of autism. Therefore, to the best of
our knowledge, it does not exist a tool capable of mea-suring automatically the level of quality of the non-verbal communicative act, similar to the one proposedin this paper.
In this work, we present a multi-modal RGB-Depth-Audio system for non-verbal communication analy-sis. The system, firstly, extracts low-level per-framefeatures on each of the modalities. In RGB anddepth modalities, face detection and skeleton joints aretracked, whereas in the audio modality voice activ-ity is detected. From the low-level features, a set ofhigh-level behavioral indicators per-sequence are com-puted and used to describe each presentation. Onceeach sequence has been globally described, a quantify-ing evaluation of the quality level of the presentationsis performed using different state-of-the-art statisticallearning algorithms (binary classification, multi-classclassification, ranking, and regression). In addition, astudy of the most relevant features in order to evaluatethe quality level is also presented. Quantitative resultson a novel multi-modal dataset of university students’presentations show accurate measurements of the pro-posed system and its reliability to be used in the train-ing routine of the non-verbal communication compe-tence.
The rest of the paper is organized as follows. Sec-tion 2 presents the multi-modal RGB-Depth-Audiosystem for communication competence analysis. InSection 3, the proposed methodology is evaluated ona novel dataset of student presentations. Finally, Sec-tions 4 and 5 conclude the paper and discusses futurelines of research, respectively.
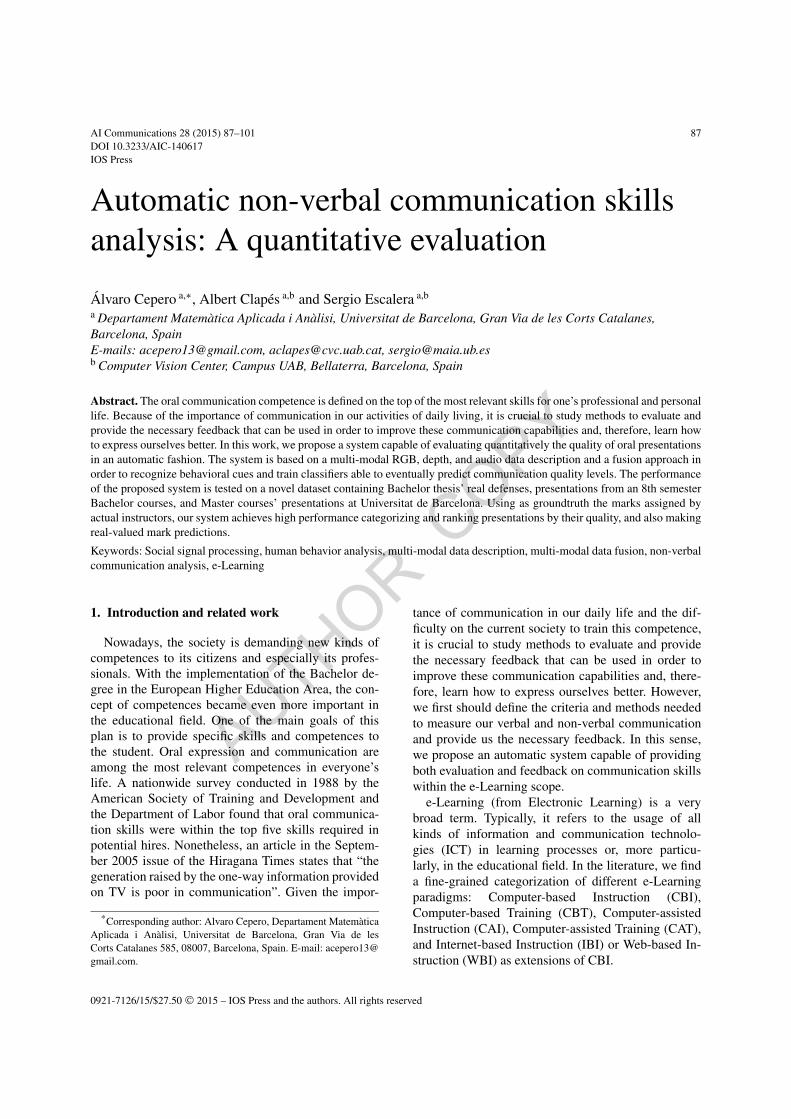
2. The multi-modal RGB-Depth-Audio system forcommunication competence analysis
Our non-verbal communication framework for com-petence analysis is focused on the feature extractionand data fusion of different modalities, including RGB,depth, and audio, in order to recognize gestures, pos-tures and audio behavior-based cues. For this task, weseparate the process in two different parts: first, theextraction of low-level features from the RGB-Depth-Audio data which defines the input audio source, facetracking system and the skeletal body joints model, andsecond, the processing of these low-level features intohigh-level features to build the features that codify theuser’s behavior. These indicators are then used to trainrobust statistical classifiers able to predict the qualityof the presentations given a groundtruth defined by ex-perts. The different modules of our system are shownin Fig. 1 and described next.
AUTHOR COPY
90 Á. Cepero et al. / Automatic non-verbal communication skills analysis: A quantitative evaluation
Fig. 1. System modules for non-verbal communication analysis.(Colors are visible in the online version of the article; http://dx.doi.org/10.3233/AIC-140617.))
2.1. Low-level features
In order to analyze the communicative behavior ofthe user towards the audience we defined a set oflow and high-level features. The low-level features arethose characteristics that are extracted directly from theMicrosoft® Kinect™ SDK, that is the RGB data, depthand the raw audio. The way Kinect™ provides multi-modal data relies on three hardware components work-ing together:
• Color VGA video camera. It is used on the facedetection process and face tracking algorithm.This component acts as a regular camera and itcaptures images around 30 frames per second, andprojects at a 640 × 480 pixels resolution.
• Near-infrared light sensor and emitter. TheKinect™ near-infrared light emitter projects astructured/codified matrix of points through theenvironment. Then, each depth pixel is computedby sampling the derivative of the higher resolu-tion infrared image taken in the infrared sensor.This value is inversely proportional to the radiusof each projected infrared dot, which is linearlyproportional to the actual depth.
• Microphone array. The Kinect™ presents a mi-crophone array that consists of four separate mi-crophones spread out linearly at the bottom of thedevice, with each channel processing 16-bit au-dio at a sampling rate of 16 kHz. By comparingwhen each microphone captures the same audiosignal, the microphone array can be used to deter-mine the direction from which the signal is com-ing. In addition, speech can be recognized in a
large room where the speaker’s lips are more thana few meters from the microphone array. In oursystem, the distance between the speaker and thedevice is less than 3.5 meters.
2.1.1. RGB-depth featuresWe use the color or RGB data to perform face de-
tection using the well-known Viola and Jones meth-od [43]. This method exhaustively searches for faces inan image using an incremental sliding window to coverall the different regions of different sizes. In each re-gion, a set of Haar-like features1 particularly selectedfor the task of face detection is very efficiently com-puted using integral images2 and used to build a fea-ture vector characterizing the region. Then, the featurevector extracted for that particular region is classifiedusing the adaptive boosting classifier (AdaBoost) [16]to determine whether the region contains a face or not.AdaBoost is a meta-algorithm which builds a strongclassifier from a cascade of weak classifiers; in otherwords, a set of simpler classifiers applied sequentiallyto each candidate face region. The first stages of thecascade separate the easier examples, and those moredifficult are propagated as false positives to be dealtwith in posterior and more constraining weak classi-fiers. In addition, the color is used together with thedepth information in the face tracking algorithm thatlocalizes 121 facial 3D landmarks based on the ActiveAppearance Models [12] from which we later computethe head pose.
On the other hand, we use the depth informationto perform human body segmentation and skeletonjoints detection and tracking. This skeletal model willyield the world coordinates of the user in real time.The Microsoft® Kinect™ SDK defines 20 keypoints tomodel a human skeleton. In our system, the coordi-nates of hands, wrists, arms, elbow hip, shoulders andhead are the only ones considered. We use RandomForest of [37] to segment the human body and computethe skeletal model. The body part classification at pixellevel is performed first by describing each depth pixel
1A Haar-like feature characterizes an image region by defining adisposition of rectangles within the region and calculating the differ-ence of the sums of intensities in the rectangular subregions [32].
2The integral image can be used to compute Haar-like featuresin constant time [43]. Each pixel in the integral image is the ac-cumulation of the intensities of all the upper-left pixels. In such away, the sum of the intensities in a region can be calculated as:I(A)−I(B)−I(C)+I(D), being I(·) the intensity of a pixel in theintegral image, and A, B, C and D the bottom-right, bottom-left,upper-right, and upper-left pixels respectively.
AUTHOR COPY
Á. Cepero et al. / Automatic non-verbal communication skills analysis: A quantitative evaluation 91
x (in a dense depth image D) as follows:
fθ(D, x) = D(x+u/Dx) − D(x+v/Dx), (1)
where θ = (u, v), and u, v ∈ R2 are two random off-
sets, depth invariant. Thus, each θ determines two newpixels relative to x, the depth difference of which ac-counts for the value of fθ(D, x). Using this set of ran-dom depth features, a random forest of randomized de-cision trees is trained, where each tree consists of splitand leaf nodes (the root is also a split node). From theclassification of a pixel in each of the τ trees, a discreteprobability distribution of body parts memberships isobtained. Finally, the discrete probability distributionsare averaged as follows:
P (li|D, x) =1τ
τ∑j=1
Pj(li|D, x), (2)
where li is a certain body part, Pj(li|D, x) is the dis-tribution of body parts of the pixels class stored at theleaf, reached by the pixel for classification (D, x) andtraced through the tree j, j ∈ τ . Once this procedurehas been applied, a mean shift is used to estimate hu-man joints and represent the body in skeletal form.
2.1.2. Audio featuresFrom the raw audio obtained from the Kinect™
we compute three types of low-level features perframe [27]. The first feature is the widely used Short-term Energy. Energy is the most common feature forspeech/silence detection. The second feature is theSpectral Flatness measure, which is a measure of thenoisiness of spectrum. The third feature is the MostDominant Frequency Component of the speech framespectrum, which can be very useful in discriminatingbetween voice and non-voice frames. These low-levelfeatures will be used later to compute the ‘speaking’high-level behavioral indicator.
2.2. High-level features
The high-level features or meta-characteristics arecomputed globally for each sequence from the low-level features described in the previous section in orderto define the speaker’s communication indicators. Fur-ther we present the set of psychology-based behavioralindicators, which we consider in our framework. Thevalues for the different parameters involved in the com-putation of the indicators are specified in Section 3.2.
(1) Frontal-facing. The average number of frames inwhich the subject is facing the audience placedbehind the acquisition device. Face detection andface tracking are performed in order to ana-lyze whether the user is looking at the audi-ence. If a frontal view of a face is detected, theface tracking algorithm computes the facial land-marks from which the nose’s vector is computed.We consider the subject is looking at the audienceif the nose’s vector falls in a cone of sight (with acertain amplitude) directed to the audience. Thefollowing formula expresses this feature compu-tation:
f1 =1T
T∑t=1
1
{arccos
(ntnose
−z
)� α
}, (3)
where T is the total number of frames in the pre-sentation, 1{·} is the indicator function, whichtakes the value 1 if the condition contained isfulfilled or 0 otherwise, ntnose is a unit vectorexpressing the face toward-looking direction attime t, and z is the unitary vector representingthe Kinect’s viewpoint direction. Hence, we con-sider the user is looking at the public if the angleformed by the two vectors, arccos(ntnose/− z), islower or equal than a certain angular distance α.
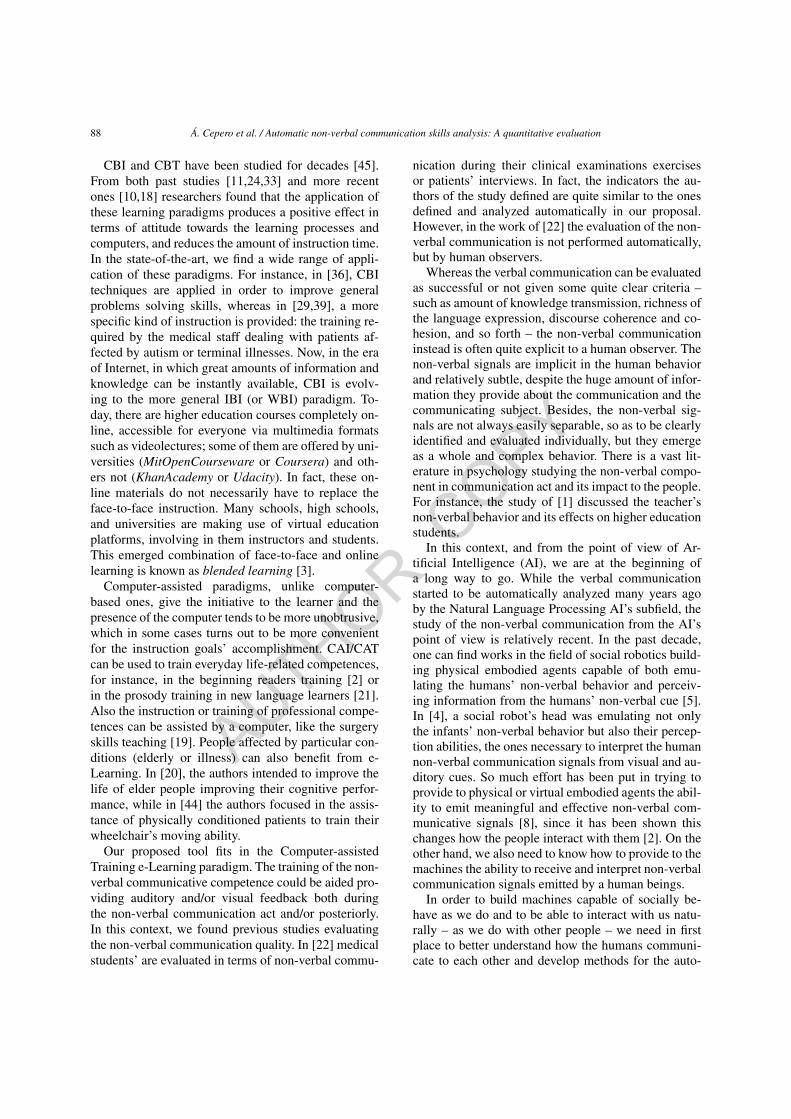
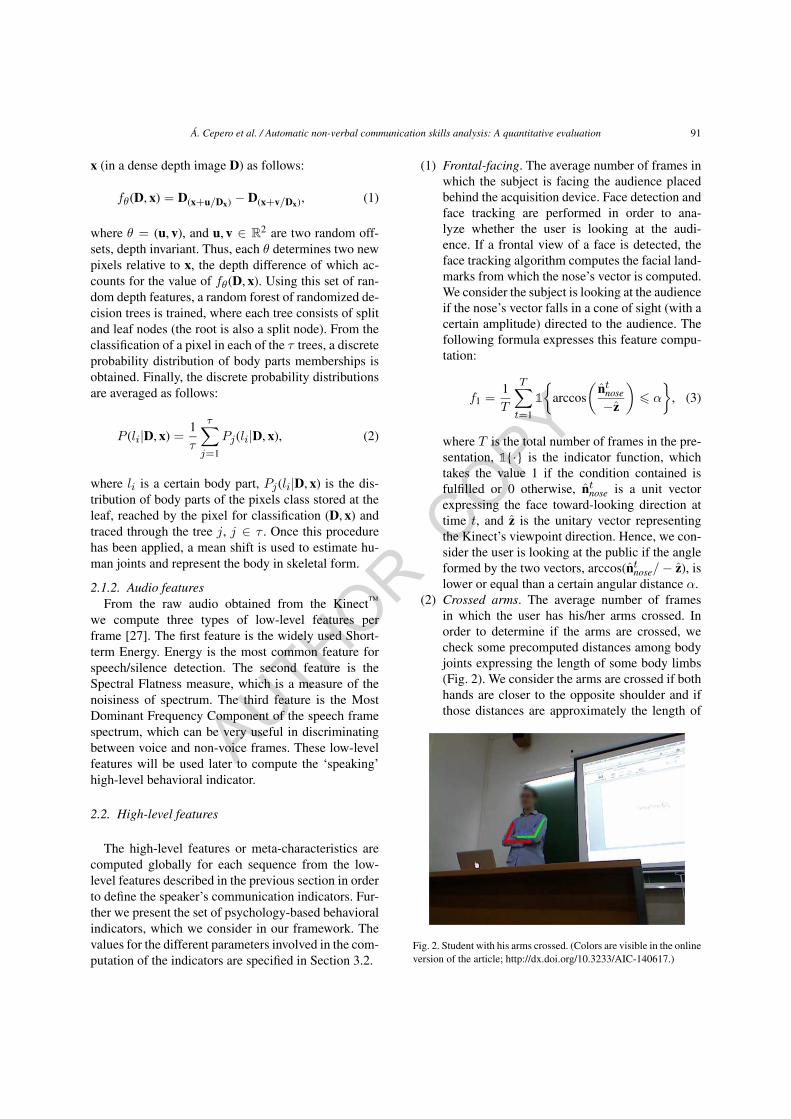
(2) Crossed arms. The average number of framesin which the user has his/her arms crossed. Inorder to determine if the arms are crossed, wecheck some precomputed distances among bodyjoints expressing the length of some body limbs(Fig. 2). We consider the arms are crossed if bothhands are closer to the opposite shoulder and ifthose distances are approximately the length of
Fig. 2. Student with his arms crossed. (Colors are visible in the onlineversion of the article; http://dx.doi.org/10.3233/AIC-140617.)
AUTHOR COPY
92 Á. Cepero et al. / Automatic non-verbal communication skills analysis: A quantitative evaluation
the half upper arms:
f2 =1T
T∑t=1
1{(
dthandL,shoulderR
< dthandL,shoulderL
)∧(dthandR,shoulderL
< dthandR,shoulderR
)∧(dthandL,shoulderR
< harmR
)∧(dthandR,shoulderL
< harmL
)}, (4)
where dtA,B = ‖ptA − ptB‖2, is the Euclideandistance between two three-dimensional pointscorresponding to the joints A and B at timet, whereas h measures the constant length of alimb (indeed, a distance written in a more com-pact way), as in this case the length of the rightupper half arm, harmR = dshoulderR,elbowR , andthe length of the left upper half arm, harmL =dshoulderL,elbowL .
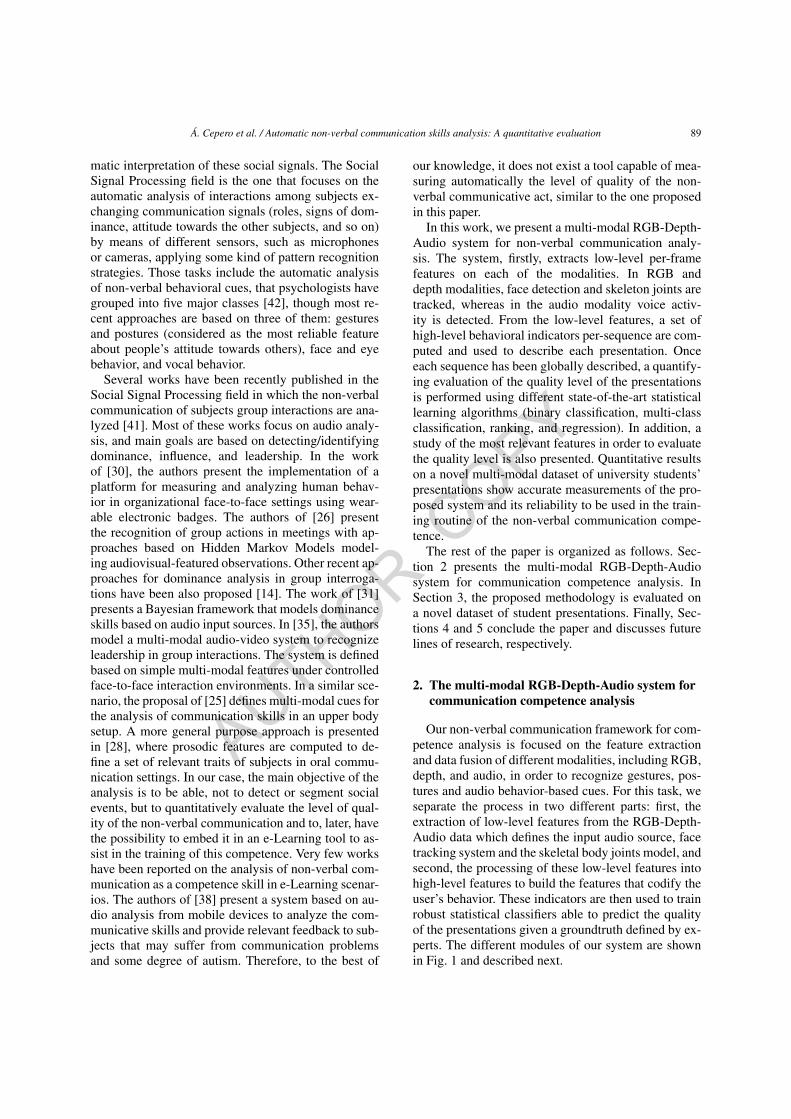
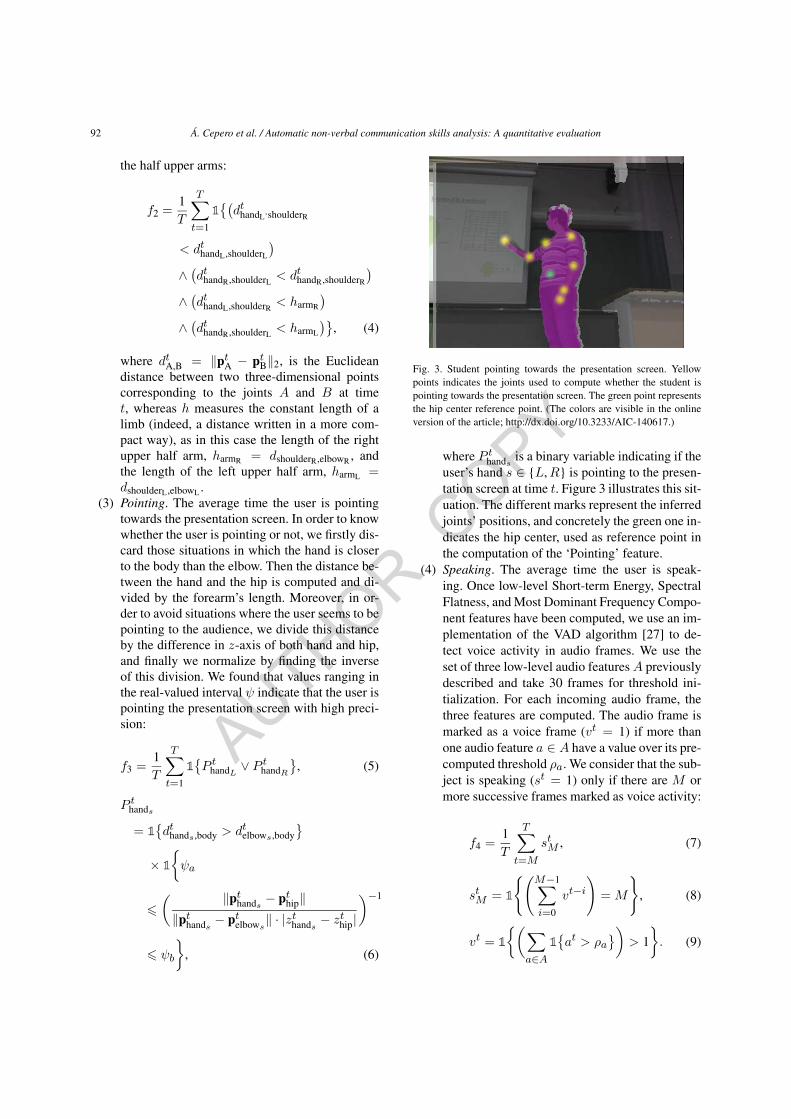
(3) Pointing. The average time the user is pointingtowards the presentation screen. In order to knowwhether the user is pointing or not, we firstly dis-card those situations in which the hand is closerto the body than the elbow. Then the distance be-tween the hand and the hip is computed and di-vided by the forearm’s length. Moreover, in or-der to avoid situations where the user seems to bepointing to the audience, we divide this distanceby the difference in z-axis of both hand and hip,and finally we normalize by finding the inverseof this division. We found that values ranging inthe real-valued interval ψ indicate that the user ispointing the presentation screen with high preci-sion:
f3 =1T
T∑t=1
1{P t
handL ∨ P thandR
}, (5)
P thands
= 1{dthands,body > dtelbows,body
}× 1
{ψa
�( ‖pthands − pthip‖‖pthands
− ptelbows‖ · |zthands
− zthip|
)−1
� ψb
}, (6)
Fig. 3. Student pointing towards the presentation screen. Yellowpoints indicates the joints used to compute whether the student ispointing towards the presentation screen. The green point representsthe hip center reference point. (The colors are visible in the onlineversion of the article; http://dx.doi.org/10.3233/AIC-140617.)
where P thands is a binary variable indicating if the
user’s hand s ∈ {L,R} is pointing to the presen-tation screen at time t. Figure 3 illustrates this sit-uation. The different marks represent the inferredjoints’ positions, and concretely the green one in-dicates the hip center, used as reference point inthe computation of the ‘Pointing’ feature.
(4) Speaking. The average time the user is speak-ing. Once low-level Short-term Energy, SpectralFlatness, and Most Dominant Frequency Compo-nent features have been computed, we use an im-plementation of the VAD algorithm [27] to de-tect voice activity in audio frames. We use theset of three low-level audio features A previouslydescribed and take 30 frames for threshold ini-tialization. For each incoming audio frame, thethree features are computed. The audio frame ismarked as a voice frame (vt = 1) if more thanone audio feature a ∈ A have a value over its pre-computed threshold ρa. We consider that the sub-ject is speaking (st = 1) only if there are M ormore successive frames marked as voice activity:
f4 =1T
T∑t=M
stM , (7)
stM = 1
{(M−1∑i=0
vt−i
)= M
}, (8)
vt = 1
{(∑a∈A
1{at > ρa
})> 1
}. (9)
AUTHOR COPY
Á. Cepero et al. / Automatic non-verbal communication skills analysis: A quantitative evaluation 93
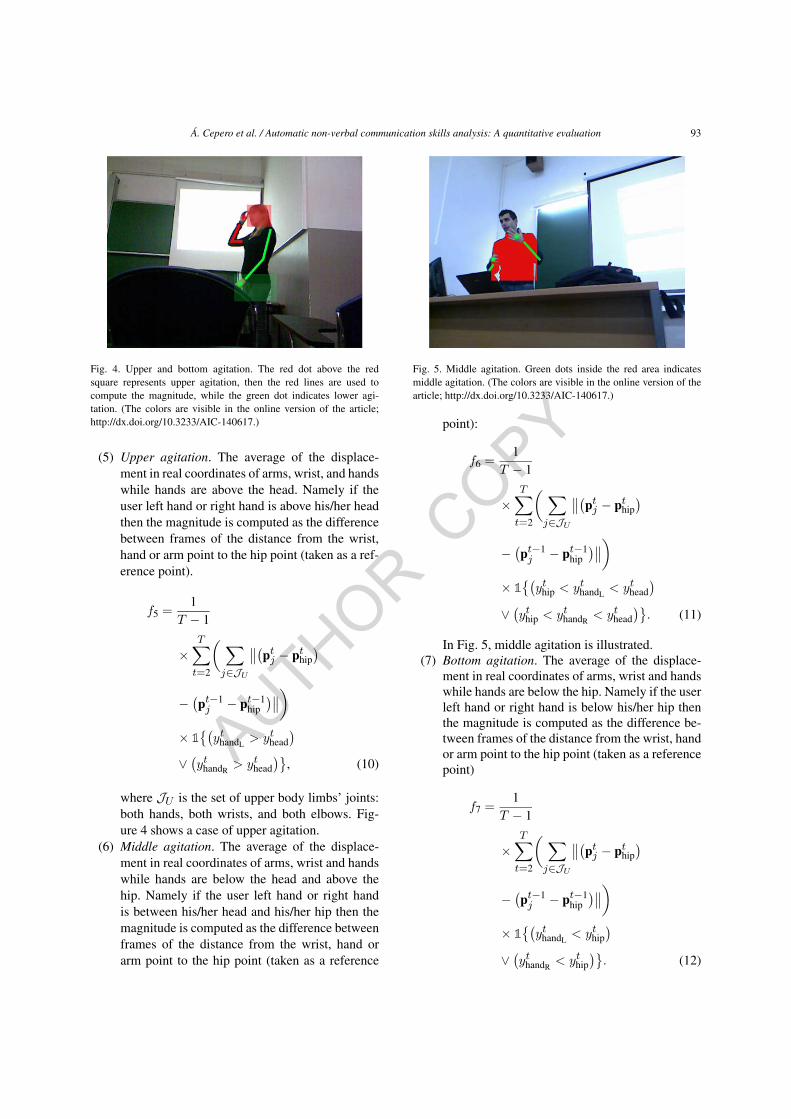
Fig. 4. Upper and bottom agitation. The red dot above the redsquare represents upper agitation, then the red lines are used tocompute the magnitude, while the green dot indicates lower agi-tation. (The colors are visible in the online version of the article;http://dx.doi.org/10.3233/AIC-140617.)
(5) Upper agitation. The average of the displace-ment in real coordinates of arms, wrist, and handswhile hands are above the head. Namely if theuser left hand or right hand is above his/her headthen the magnitude is computed as the differencebetween frames of the distance from the wrist,hand or arm point to the hip point (taken as a ref-erence point).
f5 =1
T − 1
×T∑t=2
( ∑j∈JU
∥∥(ptj − pthip
)
−(pt−1j − pt−1
hip
)∥∥)
× 1{(
ythandL> ythead
)∨(ythandR
> ythead
)}, (10)
where JU is the set of upper body limbs’ joints:both hands, both wrists, and both elbows. Fig-ure 4 shows a case of upper agitation.
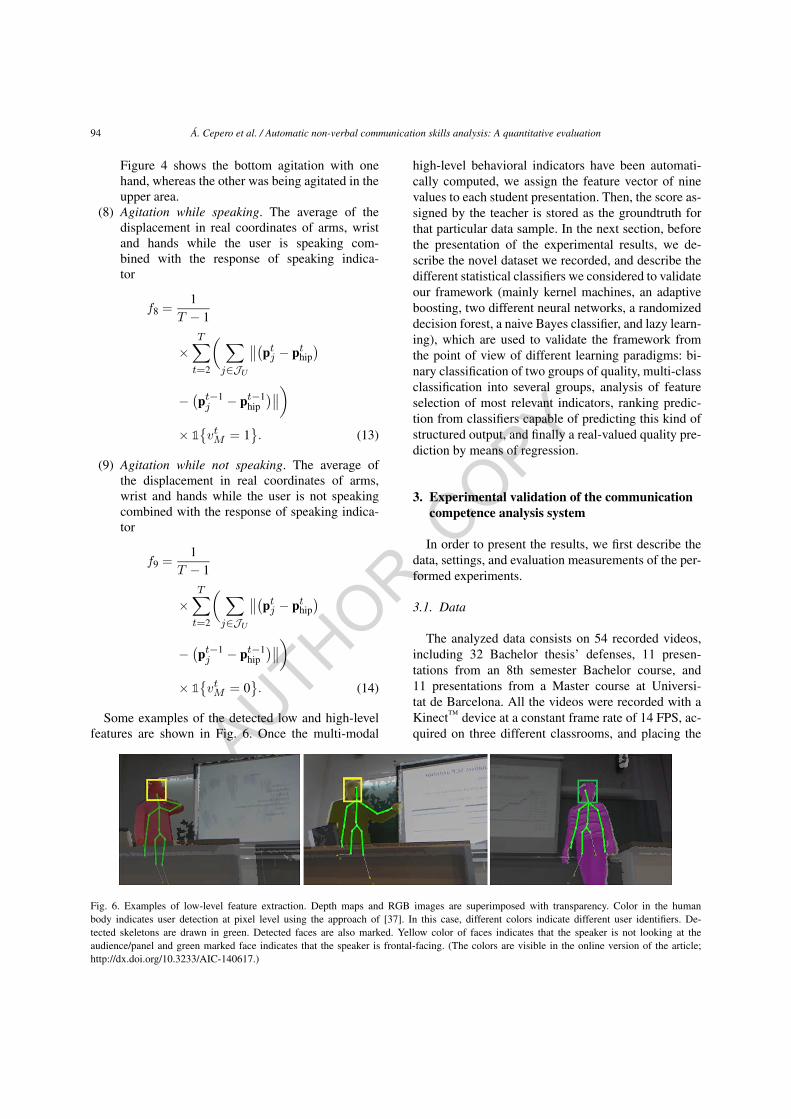
(6) Middle agitation. The average of the displace-ment in real coordinates of arms, wrist and handswhile hands are below the head and above thehip. Namely if the user left hand or right handis between his/her head and his/her hip then themagnitude is computed as the difference betweenframes of the distance from the wrist, hand orarm point to the hip point (taken as a reference
Fig. 5. Middle agitation. Green dots inside the red area indicatesmiddle agitation. (The colors are visible in the online version of thearticle; http://dx.doi.org/10.3233/AIC-140617.)
point):
f6 =1
T − 1
×T∑t=2
( ∑j∈JU
∥∥(ptj − pthip
)
−(pt−1j − pt−1
hip
)∥∥)
× 1{(
ythip < ythandL< ythead
)∨(ythip < ythandR
< ythead
)}. (11)
In Fig. 5, middle agitation is illustrated.(7) Bottom agitation. The average of the displace-
ment in real coordinates of arms, wrist and handswhile hands are below the hip. Namely if the userleft hand or right hand is below his/her hip thenthe magnitude is computed as the difference be-tween frames of the distance from the wrist, handor arm point to the hip point (taken as a referencepoint)
f7 =1
T − 1
×T∑t=2
( ∑j∈JU
∥∥(ptj − pthip
)
−(pt−1j − pt−1
hip
)∥∥)
× 1{(
ythandL< ythip
)∨(ythandR
< ythip
)}. (12)
AUTHOR COPY
94 Á. Cepero et al. / Automatic non-verbal communication skills analysis: A quantitative evaluation
Figure 4 shows the bottom agitation with onehand, whereas the other was being agitated in theupper area.
(8) Agitation while speaking. The average of thedisplacement in real coordinates of arms, wristand hands while the user is speaking com-bined with the response of speaking indica-tor
f8 =1
T − 1
×T∑t=2
( ∑j∈JU
∥∥(ptj − pthip
)
−(pt−1j − pt−1
hip
)∥∥)
× 1{vtM = 1
}. (13)
(9) Agitation while not speaking. The average ofthe displacement in real coordinates of arms,wrist and hands while the user is not speakingcombined with the response of speaking indica-tor
f9 =1
T − 1
×T∑t=2
( ∑j∈JU
∥∥(ptj − pthip
)
−(pt−1j − pt−1
hip
)∥∥)
× 1{vtM = 0
}. (14)
Some examples of the detected low and high-levelfeatures are shown in Fig. 6. Once the multi-modal
high-level behavioral indicators have been automati-cally computed, we assign the feature vector of ninevalues to each student presentation. Then, the score as-signed by the teacher is stored as the groundtruth forthat particular data sample. In the next section, beforethe presentation of the experimental results, we de-scribe the novel dataset we recorded, and describe thedifferent statistical classifiers we considered to validateour framework (mainly kernel machines, an adaptiveboosting, two different neural networks, a randomizeddecision forest, a naive Bayes classifier, and lazy learn-ing), which are used to validate the framework fromthe point of view of different learning paradigms: bi-nary classification of two groups of quality, multi-classclassification into several groups, analysis of featureselection of most relevant indicators, ranking predic-tion from classifiers capable of predicting this kind ofstructured output, and finally a real-valued quality pre-diction by means of regression.
3. Experimental validation of the communicationcompetence analysis system
In order to present the results, we first describe thedata, settings, and evaluation measurements of the per-formed experiments.
3.1. Data
The analyzed data consists on 54 recorded videos,including 32 Bachelor thesis’ defenses, 11 presen-tations from an 8th semester Bachelor course, and11 presentations from a Master course at Universi-tat de Barcelona. All the videos were recorded with aKinect™ device at a constant frame rate of 14 FPS, ac-quired on three different classrooms, and placing the
Fig. 6. Examples of low-level feature extraction. Depth maps and RGB images are superimposed with transparency. Color in the humanbody indicates user detection at pixel level using the approach of [37]. In this case, different colors indicate different user identifiers. De-tected skeletons are drawn in green. Detected faces are also marked. Yellow color of faces indicates that the speaker is not looking at theaudience/panel and green marked face indicates that the speaker is frontal-facing. (The colors are visible in the online version of the article;http://dx.doi.org/10.3233/AIC-140617.)
AUTHOR COPY
Á. Cepero et al. / Automatic non-verbal communication skills analysis: A quantitative evaluation 95
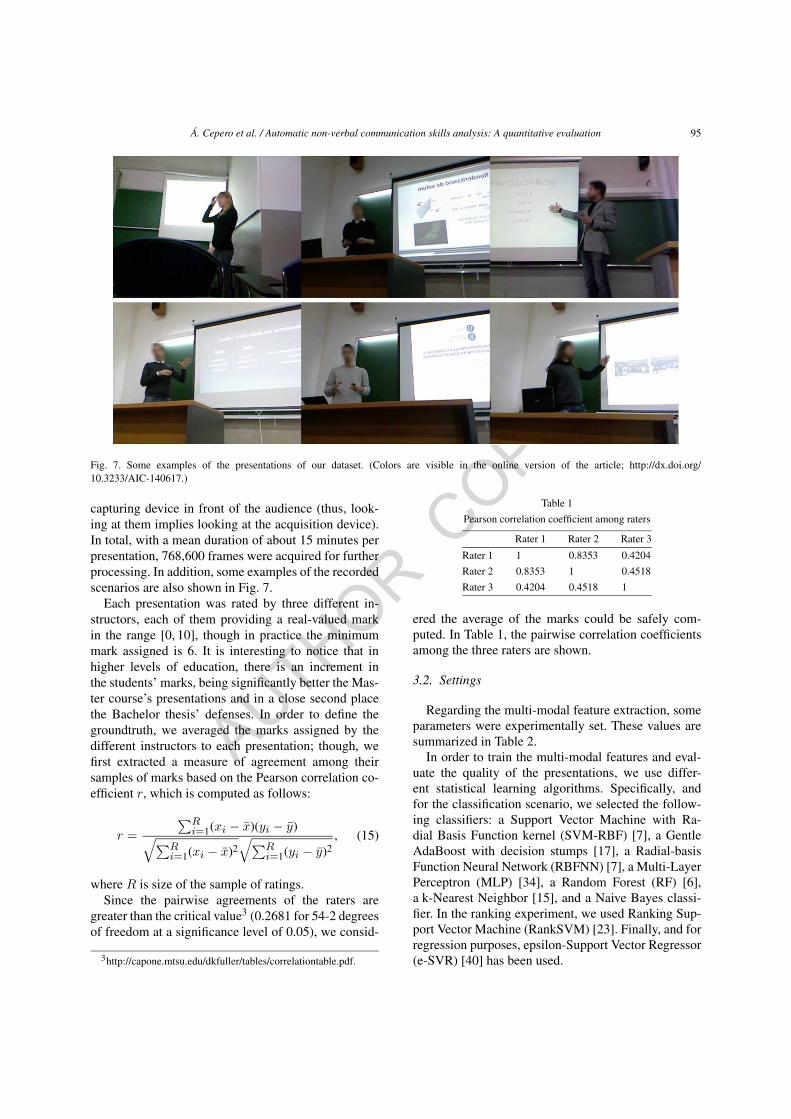
Fig. 7. Some examples of the presentations of our dataset. (Colors are visible in the online version of the article; http://dx.doi.org/10.3233/AIC-140617.)
capturing device in front of the audience (thus, look-ing at them implies looking at the acquisition device).In total, with a mean duration of about 15 minutes perpresentation, 768,600 frames were acquired for furtherprocessing. In addition, some examples of the recordedscenarios are also shown in Fig. 7.
Each presentation was rated by three different in-structors, each of them providing a real-valued markin the range [0, 10], though in practice the minimummark assigned is 6. It is interesting to notice that inhigher levels of education, there is an increment inthe students’ marks, being significantly better the Mas-ter course’s presentations and in a close second placethe Bachelor thesis’ defenses. In order to define thegroundtruth, we averaged the marks assigned by thedifferent instructors to each presentation; though, wefirst extracted a measure of agreement among theirsamples of marks based on the Pearson correlation co-efficient r, which is computed as follows:
r =
∑Ri=1(xi − x)(yi − y)√∑R
i=1(xi − x)2√∑R
i=1(yi − y)2, (15)
where R is size of the sample of ratings.Since the pairwise agreements of the raters are
greater than the critical value3 (0.2681 for 54-2 degreesof freedom at a significance level of 0.05), we consid-
3http://capone.mtsu.edu/dkfuller/tables/correlationtable.pdf.
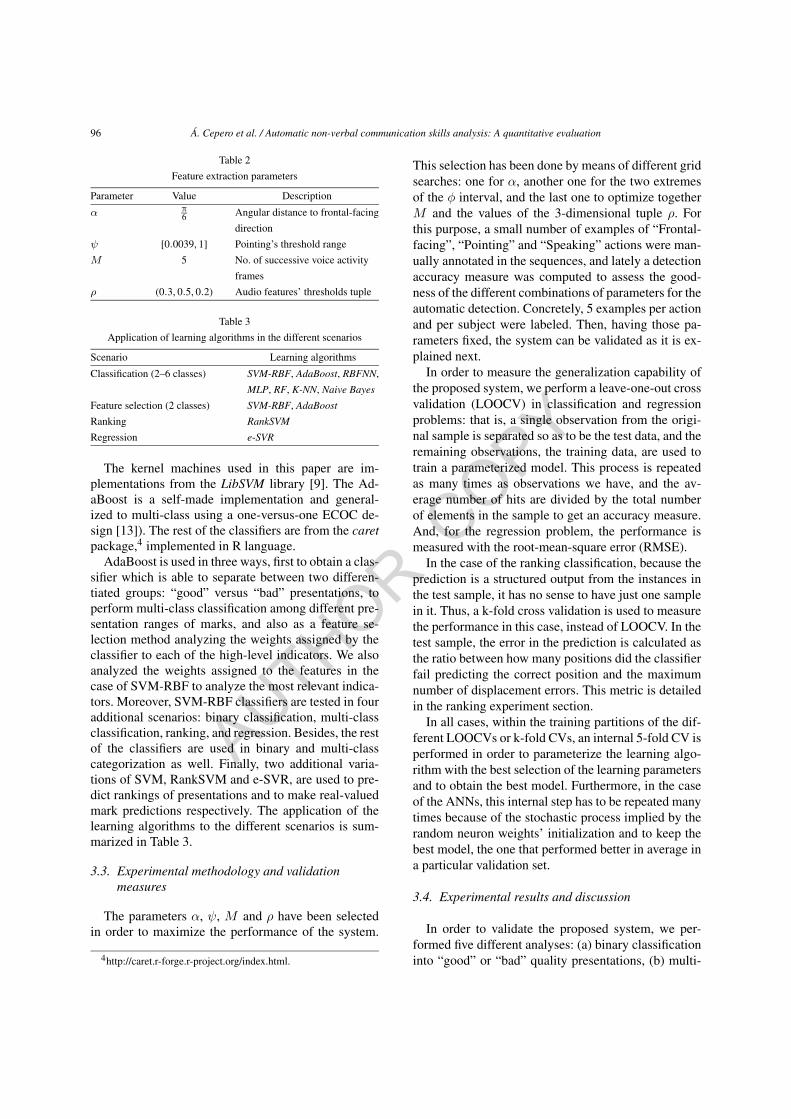
Table 1
Pearson correlation coefficient among raters
Rater 1 Rater 2 Rater 3
Rater 1 1 0.8353 0.4204
Rater 2 0.8353 1 0.4518
Rater 3 0.4204 0.4518 1
ered the average of the marks could be safely com-puted. In Table 1, the pairwise correlation coefficientsamong the three raters are shown.
3.2. Settings
Regarding the multi-modal feature extraction, someparameters were experimentally set. These values aresummarized in Table 2.
In order to train the multi-modal features and eval-uate the quality of the presentations, we use differ-ent statistical learning algorithms. Specifically, andfor the classification scenario, we selected the follow-ing classifiers: a Support Vector Machine with Ra-dial Basis Function kernel (SVM-RBF) [7], a GentleAdaBoost with decision stumps [17], a Radial-basisFunction Neural Network (RBFNN) [7], a Multi-LayerPerceptron (MLP) [34], a Random Forest (RF) [6],a k-Nearest Neighbor [15], and a Naive Bayes classi-fier. In the ranking experiment, we used Ranking Sup-port Vector Machine (RankSVM) [23]. Finally, and forregression purposes, epsilon-Support Vector Regressor(e-SVR) [40] has been used.
AUTHOR COPY
96 Á. Cepero et al. / Automatic non-verbal communication skills analysis: A quantitative evaluation
Table 2
Feature extraction parameters
Parameter Value Description
α π6 Angular distance to frontal-facing
direction
ψ [0.0039, 1] Pointing’s threshold range
M 5 No. of successive voice activity
frames
ρ (0.3, 0.5, 0.2) Audio features’ thresholds tuple
Table 3
Application of learning algorithms in the different scenarios
Scenario Learning algorithms
Classification (2–6 classes) SVM-RBF, AdaBoost, RBFNN,
MLP, RF, K-NN, Naive Bayes
Feature selection (2 classes) SVM-RBF, AdaBoost
Ranking RankSVM
Regression e-SVR
The kernel machines used in this paper are im-plementations from the LibSVM library [9]. The Ad-aBoost is a self-made implementation and general-ized to multi-class using a one-versus-one ECOC de-sign [13]). The rest of the classifiers are from the caretpackage,4 implemented in R language.
AdaBoost is used in three ways, first to obtain a clas-sifier which is able to separate between two differen-tiated groups: “good” versus “bad” presentations, toperform multi-class classification among different pre-sentation ranges of marks, and also as a feature se-lection method analyzing the weights assigned by theclassifier to each of the high-level indicators. We alsoanalyzed the weights assigned to the features in thecase of SVM-RBF to analyze the most relevant indica-tors. Moreover, SVM-RBF classifiers are tested in fouradditional scenarios: binary classification, multi-classclassification, ranking, and regression. Besides, the restof the classifiers are used in binary and multi-classcategorization as well. Finally, two additional varia-tions of SVM, RankSVM and e-SVR, are used to pre-dict rankings of presentations and to make real-valuedmark predictions respectively. The application of thelearning algorithms to the different scenarios is sum-marized in Table 3.
3.3. Experimental methodology and validationmeasures
The parameters α, ψ, M and ρ have been selectedin order to maximize the performance of the system.
4http://caret.r-forge.r-project.org/index.html.
This selection has been done by means of different gridsearches: one for α, another one for the two extremesof the φ interval, and the last one to optimize togetherM and the values of the 3-dimensional tuple ρ. Forthis purpose, a small number of examples of “Frontal-facing”, “Pointing” and “Speaking” actions were man-ually annotated in the sequences, and lately a detectionaccuracy measure was computed to assess the good-ness of the different combinations of parameters for theautomatic detection. Concretely, 5 examples per actionand per subject were labeled. Then, having those pa-rameters fixed, the system can be validated as it is ex-plained next.
In order to measure the generalization capability ofthe proposed system, we perform a leave-one-out crossvalidation (LOOCV) in classification and regressionproblems: that is, a single observation from the origi-nal sample is separated so as to be the test data, and theremaining observations, the training data, are used totrain a parameterized model. This process is repeatedas many times as observations we have, and the av-erage number of hits are divided by the total numberof elements in the sample to get an accuracy measure.And, for the regression problem, the performance ismeasured with the root-mean-square error (RMSE).
In the case of the ranking classification, because theprediction is a structured output from the instances inthe test sample, it has no sense to have just one samplein it. Thus, a k-fold cross validation is used to measurethe performance in this case, instead of LOOCV. In thetest sample, the error in the prediction is calculated asthe ratio between how many positions did the classifierfail predicting the correct position and the maximumnumber of displacement errors. This metric is detailedin the ranking experiment section.
In all cases, within the training partitions of the dif-ferent LOOCVs or k-fold CVs, an internal 5-fold CV isperformed in order to parameterize the learning algo-rithm with the best selection of the learning parametersand to obtain the best model. Furthermore, in the caseof the ANNs, this internal step has to be repeated manytimes because of the stochastic process implied by therandom neuron weights’ initialization and to keep thebest model, the one that performed better in average ina particular validation set.
3.4. Experimental results and discussion
In order to validate the proposed system, we per-formed five different analyses: (a) binary classificationinto “good” or “bad” quality presentations, (b) multi-
AUTHOR COPY
Á. Cepero et al. / Automatic non-verbal communication skills analysis: A quantitative evaluation 97
class classification into three, four five and six cat-egories of quality, (c) analysis of feature relevanceand feature selection and classification with differentfeature subsets, (d) ranking of presentations based onquality, and finally, (e) regression.
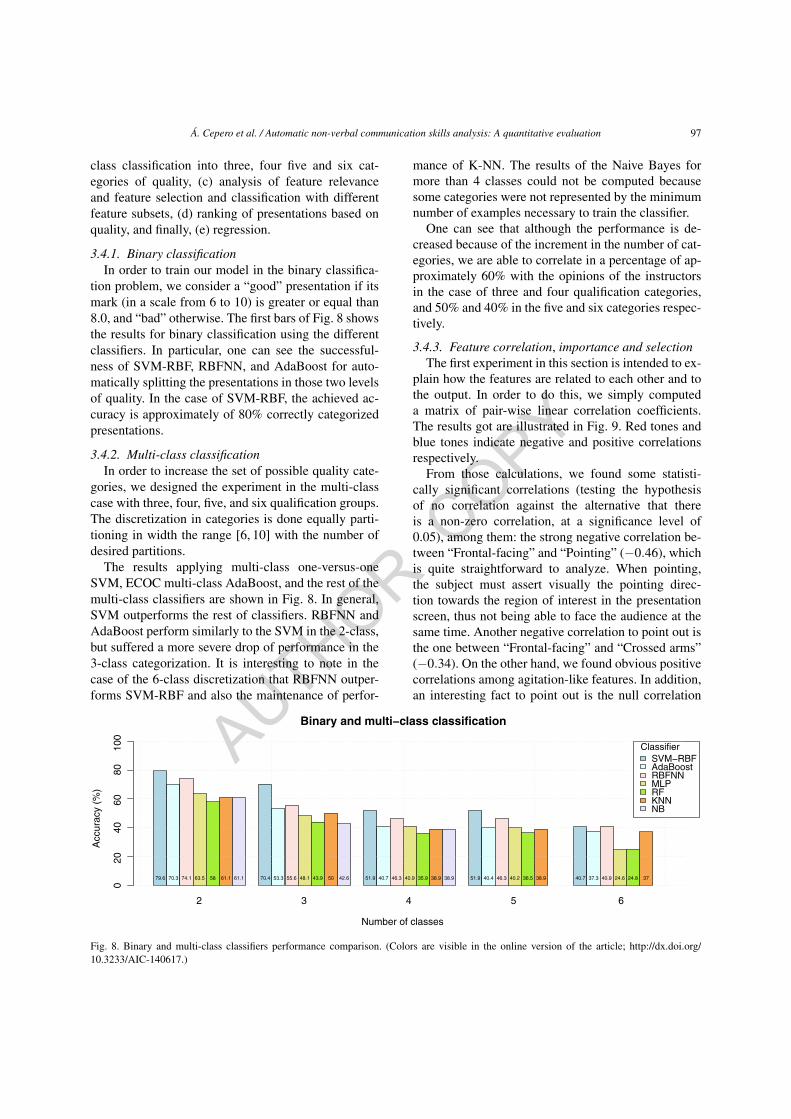
3.4.1. Binary classificationIn order to train our model in the binary classifica-
tion problem, we consider a “good” presentation if itsmark (in a scale from 6 to 10) is greater or equal than8.0, and “bad” otherwise. The first bars of Fig. 8 showsthe results for binary classification using the differentclassifiers. In particular, one can see the successful-ness of SVM-RBF, RBFNN, and AdaBoost for auto-matically splitting the presentations in those two levelsof quality. In the case of SVM-RBF, the achieved ac-curacy is approximately of 80% correctly categorizedpresentations.
3.4.2. Multi-class classificationIn order to increase the set of possible quality cate-
gories, we designed the experiment in the multi-classcase with three, four, five, and six qualification groups.The discretization in categories is done equally parti-tioning in width the range [6, 10] with the number ofdesired partitions.
The results applying multi-class one-versus-oneSVM, ECOC multi-class AdaBoost, and the rest of themulti-class classifiers are shown in Fig. 8. In general,SVM outperforms the rest of classifiers. RBFNN andAdaBoost perform similarly to the SVM in the 2-class,but suffered a more severe drop of performance in the3-class categorization. It is interesting to note in thecase of the 6-class discretization that RBFNN outper-forms SVM-RBF and also the maintenance of perfor-
mance of K-NN. The results of the Naive Bayes formore than 4 classes could not be computed becausesome categories were not represented by the minimumnumber of examples necessary to train the classifier.
One can see that although the performance is de-creased because of the increment in the number of cat-egories, we are able to correlate in a percentage of ap-proximately 60% with the opinions of the instructorsin the case of three and four qualification categories,and 50% and 40% in the five and six categories respec-tively.
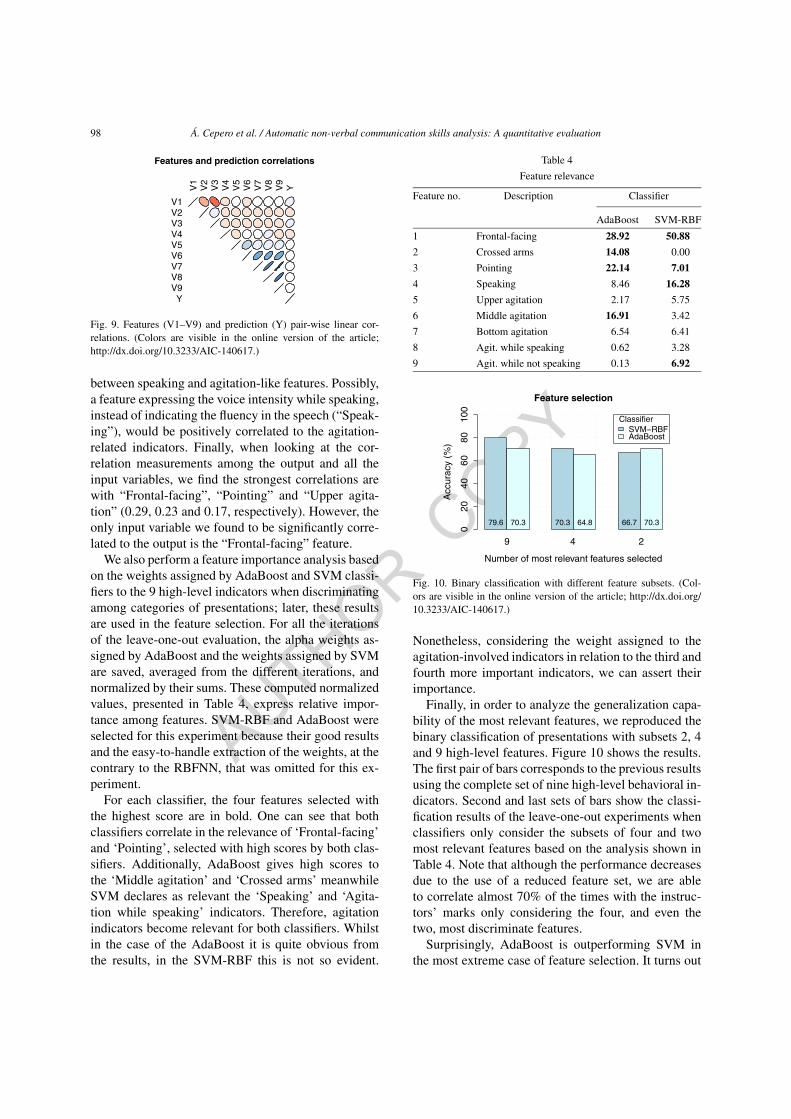
3.4.3. Feature correlation, importance and selectionThe first experiment in this section is intended to ex-
plain how the features are related to each other and tothe output. In order to do this, we simply computeda matrix of pair-wise linear correlation coefficients.The results got are illustrated in Fig. 9. Red tones andblue tones indicate negative and positive correlationsrespectively.
From those calculations, we found some statisti-cally significant correlations (testing the hypothesisof no correlation against the alternative that thereis a non-zero correlation, at a significance level of0.05), among them: the strong negative correlation be-tween “Frontal-facing” and “Pointing” (−0.46), whichis quite straightforward to analyze. When pointing,the subject must assert visually the pointing direc-tion towards the region of interest in the presentationscreen, thus not being able to face the audience at thesame time. Another negative correlation to point out isthe one between “Frontal-facing” and “Crossed arms”(−0.34). On the other hand, we found obvious positivecorrelations among agitation-like features. In addition,an interesting fact to point out is the null correlation
Fig. 8. Binary and multi-class classifiers performance comparison. (Colors are visible in the online version of the article; http://dx.doi.org/10.3233/AIC-140617.)
AUTHOR COPY
98 Á. Cepero et al. / Automatic non-verbal communication skills analysis: A quantitative evaluation
Fig. 9. Features (V1–V9) and prediction (Y) pair-wise linear cor-relations. (Colors are visible in the online version of the article;http://dx.doi.org/10.3233/AIC-140617.)
between speaking and agitation-like features. Possibly,a feature expressing the voice intensity while speaking,instead of indicating the fluency in the speech (“Speak-ing”), would be positively correlated to the agitation-related indicators. Finally, when looking at the cor-relation measurements among the output and all theinput variables, we find the strongest correlations arewith “Frontal-facing”, “Pointing” and “Upper agita-tion” (0.29, 0.23 and 0.17, respectively). However, theonly input variable we found to be significantly corre-lated to the output is the “Frontal-facing” feature.
We also perform a feature importance analysis basedon the weights assigned by AdaBoost and SVM classi-fiers to the 9 high-level indicators when discriminatingamong categories of presentations; later, these resultsare used in the feature selection. For all the iterationsof the leave-one-out evaluation, the alpha weights as-signed by AdaBoost and the weights assigned by SVMare saved, averaged from the different iterations, andnormalized by their sums. These computed normalizedvalues, presented in Table 4, express relative impor-tance among features. SVM-RBF and AdaBoost wereselected for this experiment because their good resultsand the easy-to-handle extraction of the weights, at thecontrary to the RBFNN, that was omitted for this ex-periment.
For each classifier, the four features selected withthe highest score are in bold. One can see that bothclassifiers correlate in the relevance of ‘Frontal-facing’and ‘Pointing’, selected with high scores by both clas-sifiers. Additionally, AdaBoost gives high scores tothe ‘Middle agitation’ and ‘Crossed arms’ meanwhileSVM declares as relevant the ‘Speaking’ and ‘Agita-tion while speaking’ indicators. Therefore, agitationindicators become relevant for both classifiers. Whilstin the case of the AdaBoost it is quite obvious fromthe results, in the SVM-RBF this is not so evident.
Table 4
Feature relevance
Feature no. Description Classifier
AdaBoost SVM-RBF
1 Frontal-facing 28.92 50.88
2 Crossed arms 14.08 0.00
3 Pointing 22.14 7.01
4 Speaking 8.46 16.28
5 Upper agitation 2.17 5.75
6 Middle agitation 16.91 3.42
7 Bottom agitation 6.54 6.41
8 Agit. while speaking 0.62 3.28
9 Agit. while not speaking 0.13 6.92
Fig. 10. Binary classification with different feature subsets. (Col-ors are visible in the online version of the article; http://dx.doi.org/10.3233/AIC-140617.)
Nonetheless, considering the weight assigned to theagitation-involved indicators in relation to the third andfourth more important indicators, we can assert theirimportance.
Finally, in order to analyze the generalization capa-bility of the most relevant features, we reproduced thebinary classification of presentations with subsets 2, 4and 9 high-level features. Figure 10 shows the results.The first pair of bars corresponds to the previous resultsusing the complete set of nine high-level behavioral in-dicators. Second and last sets of bars show the classi-fication results of the leave-one-out experiments whenclassifiers only consider the subsets of four and twomost relevant features based on the analysis shown inTable 4. Note that although the performance decreasesdue to the use of a reduced feature set, we are ableto correlate almost 70% of the times with the instruc-tors’ marks only considering the four, and even thetwo, most discriminate features.
Surprisingly, AdaBoost is outperforming SVM inthe most extreme case of feature selection. It turns out
AUTHOR COPY
Á. Cepero et al. / Automatic non-verbal communication skills analysis: A quantitative evaluation 99
that, in its case, all but the two most discriminative fea-tures were acting like noise in the classification task.
3.4.4. RankingThe goal of RankSVM [23] is to predict multi-
variate or structured outputs. In this case, we usethe groundtruth mark value to order all the presenta-tions by score, and generate pair-wise preference con-straints. For this experiment, we defined different num-ber of splits of our data, namely 2, 3 and 5-fold cross-validation, so that the instances in the different testsamples are ordered by quality. In this case, a rankingerror Eε is computed, as the ratio in percentage be-tween by how many positions did the classifier failedpredicting the correct position and the maximum num-ber of displacement errors, defined as follows:
Eε =m
(2∑d/2−1
i=0 S − (2i+ 1)) − S + d· 100,
where m is the number of missed positions, S is to-tal of test samples at each iteration of a k-fold exper-iment, and d is the number of different marks withinthe test samples. Then, the classification performanceC is defined as C = 100 − Eε. The results of theseexperiments are shown in Table 5. One can see that fordifferent values of k ∈ {2, 3, 5}, corresponding to rankat each iteration of the cross validation 27, 18 and 10test samples, respectively, high performance rates wereachieved, approximately in the range of 75–90%.
Table 5
Ranking of presentation results
k Eε (%) C (%)
2 24 76
3 12 88
5 19 81
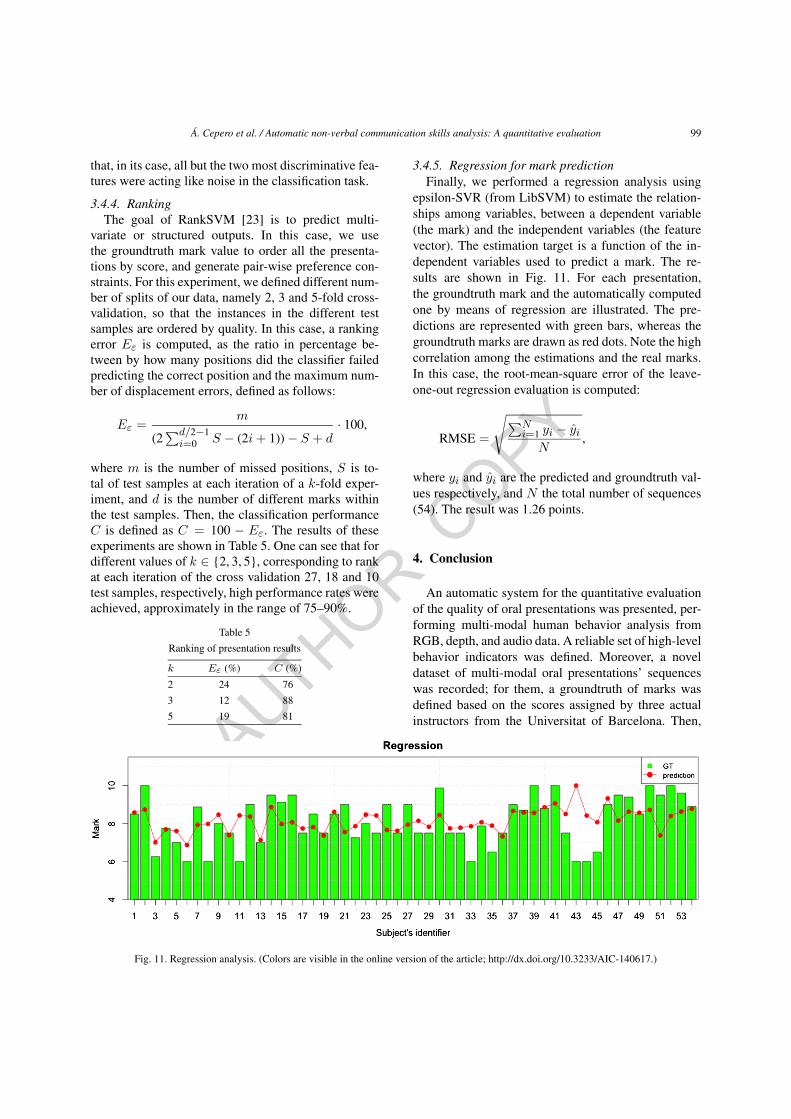
3.4.5. Regression for mark predictionFinally, we performed a regression analysis using
epsilon-SVR (from LibSVM) to estimate the relation-ships among variables, between a dependent variable(the mark) and the independent variables (the featurevector). The estimation target is a function of the in-dependent variables used to predict a mark. The re-sults are shown in Fig. 11. For each presentation,the groundtruth mark and the automatically computedone by means of regression are illustrated. The pre-dictions are represented with green bars, whereas thegroundtruth marks are drawn as red dots. Note the highcorrelation among the estimations and the real marks.In this case, the root-mean-square error of the leave-one-out regression evaluation is computed:
RMSE =
√∑Ni=1 yi − yi
N,
where yi and yi are the predicted and groundtruth val-ues respectively, and N the total number of sequences(54). The result was 1.26 points.
4. Conclusion
An automatic system for the quantitative evaluationof the quality of oral presentations was presented, per-forming multi-modal human behavior analysis fromRGB, depth, and audio data. A reliable set of high-levelbehavior indicators was defined. Moreover, a noveldataset of multi-modal oral presentations’ sequenceswas recorded; for them, a groundtruth of marks wasdefined based on the scores assigned by three actualinstructors from the Universitat of Barcelona. Then,
Fig. 11. Regression analysis. (Colors are visible in the online version of the article; http://dx.doi.org/10.3233/AIC-140617.)
AUTHOR COPY
100 Á. Cepero et al. / Automatic non-verbal communication skills analysis: A quantitative evaluation
trained binary, multi-class, and ranking classifiers, to-gether with a regressor, evaluated the performance ofthe proposed system. In addition, feature relevance andfeature selection analyses determined which were themost discriminative features, that correlates to the ob-servers opinion, achieving classification rates of ap-proximately 80% of accuracy categorizing two levelsof presentation quality, and upon 60% three and fourcategorization, and 50% and 40% in the case of fiveand six qualities respectively.
One of the main issues we found in our setup is thewide range of movement of the speaker; this causesa great number of potential occlusions of body parts(with tables or other furniture) or even the possibilityof not having the subject in the view frustum, whichincrease the bad estimations of the indicators involv-ing the body pose estimation, yielding in a decreaseof performance. In any case, since we assume the sys-tem would be used as a CAT application in a very con-trolled environment, the former problems will not oc-cur. On the other hand, the feature vectors represent-ing the presentations are global summaries that do nottake into account changes in the quality of the presenta-tion throughout time. In many cases, the speaker startsmore nervous and performs worse than normal, but asthe time goes by, the speaker calms down and recovershis usual non-verbal communication quality level. Thisfact affects the systems’ prediction, since the indica-tors measure the average performance of the speaker.However, our hypothesis is that the quality level ob-served in later track of the presentation tends to havemore impact in the observers’ evaluation than the onein the initial track.
The results of this work show the feasibility of thesystem to be applied as an automatic tool useful forboth evaluation purposes, and for providing user feed-back in training scenarios as well.
5. Future work
Given the reliability of our system, as future work,we first plan to increase the amount of behavioral pat-terns including temporal information (the quality of thepresentation may vary during time, for instance, beingworse at the beginning and better at the end). Then,we plan to recognize facial expressions. Moreover, weare also planning to extend the number of samples sothat the learners can have more data to learn and thecorrect quality level, rank position, or more a precisemark in regression for each presentation could be com-
puted. Finally, we plan to apply the methodology inreal scenarios to define a useful protocol for user feed-back and include the framework as an e-Learning toolin the training routine of non-verbal communicationcompetence.
References
[1] E. Babad, Teachers’ nonverbal behavior and its effects on stu-dents, in: The Scholarship of Teaching and Learning in HigherEducation: An Evidence-Based Perspective, Springer, 2007,pp. 201–261.
[2] H. Blok, R. Oostdam, M.E. Otter and M. Overmaat, Computer-assisted instruction in support of beginning reading instruction:a review, Review of Educational Research 72(1) (2002), 101–130.
[3] C.J. Bonk and C.R. Graham, The Handbook of Blended Learn-ing: Global Perspectives, Local Designs, Wiley, 2012.
[4] C.L. Breazeal, Sociable machines: Expressive social exchangebetween humans and robots, PhD thesis, Massachusetts Insti-tute of Technology, 2000.
[5] C.L. Breazeal, Designing Sociable Robots, MIT Press, 2004.[6] L. Breiman, Random forests, Machine Learning 45(1) (2001),
5–32.[7] D.S. Broomhead and D. Lowe, Radial basis functions, multi-
variable functional interpolation and adaptive networks, Tech-nical report, DTIC Document, 1988.
[8] J. Cassell, Embodied Conversational Agents, MIT Press,2000.
[9] C.-C. Chang and C.-J. Lin, LIBSVM: a library for support vec-tor machines, ACM Transactions on Intelligent Systems andTechnology (TIST) 2(3) (2011), 27.
[10] R.C. Clark, Developing Technical Training: A Structured Ap-proach for Developing Classroom and Computer-Based In-structional Materials, Wiley, 2011.
[11] J.E. Coulson, Programmed learning and computer-based in-struction, in: Proceedings of the Conference on Application ofDigital Computers to Automated Instruction, Wiley, 1962.
[12] G.J. Edwards, C.J. Taylor and T.F. Cootes, Interpreting faceimages using active appearance models, in: Proceedings of theThird IEEE International Conference on Automatic Face andGesture Recognition, IEEE, 1998, pp. 300–305.
[13] S. Escalera, O. Pujol and P. Radeva, Error-correcting out-put codes library, Journal of Machine Learning Research 11(2010), 661–664.
[14] S. Escalera, O. Pujol, P. Radeva, J. Vitria and M.T. Anguera,Automatic detection of dominance and expected interest,EURASIP Journal on Advances in Signal Processing 2010(2010), 39.
[15] E. Fix and J.L. Hodges Jr., Discriminatory analysis-nonparametric discrimination: consistency properties, Techni-cal report, DTIC Document, 1951.
[16] Y. Freund and R.E. Schapire, A decision-theoretic general-ization of on-line learning and an application to boosting, in:Computational Learning Theory, Springer, 1995, pp. 23–37.
[17] J. Friedman, T. Hastie and R. Tibshirani, Additive logistic re-gression: a statistical view of boosting, 1998, 7(7.1), availableat: citeseer.ist.psu.edu/friedman98additive.html.
AUTHOR COPY
Á. Cepero et al. / Automatic non-verbal communication skills analysis: A quantitative evaluation 101
[18] R.M. Gagné, Instructional Technology: Foundations, Rout-ledge, 2013.
[19] P.J. Gorman, A.H. Meier and T.M. Krummel, Computer-assisted training and learning in surgery, Computer AidedSurgery 5(2) (2000), 120–130.
[20] V. Günther, P. Schäfer, B. Holzner and G. Kemmler, Long-termimprovements in cognitive performance through computer-assisted cognitive training: a pilot study in a residential homefor older people, Aging & Mental Health 7(3) (2003), 200–206.
[21] D.M. Hardison, Generalization of computer-assisted prosodytraining: quantitative and qualitative findings, LanguageLearning & Technology 8(1) (2004), 34–52.
[22] H. Ishikawa, H. Hashimoto, M. Kinoshita, S. Fujimori,T. Shimizu and E. Yano, Evaluating medical students’ non-verbal communication during the objective structured clinicalexamination, Medical Education 40(12) (2006), 1180–1187.
[23] T. Joachims, Training linear SVMS in linear time, in: Proceed-ings of the 12th ACM SIGKDD International Conference onKnowledge Discovery and Data Mining, ACM, 2006, pp. 217–226.
[24] C.-L.C. Kulik and J.A. Kulik, Effectiveness of computer-basedinstruction: an updated analysis, Computers in Human Behav-ior 7(1) (1991), 75–94.
[25] A. Marcos-Ramiro, D. Pizarro-Perez, M. Marron-Romera,L. Nguyen and D. Gatica-Perez, Body communicative cue ex-traction for conversational analysis, in: 10th IEEE Interna-tional Conference and Workshops on Automatic Face and Ges-ture Recognition (FG), IEEE, 2013, pp. 1–8.
[26] L. McCowan, D. Gatica-Perez, S. Bengio, G. Lathoud,M. Barnard and D. Zhang, Automatic analysis of multimodalgroup actions in meetings, IEEE Transactions on Pattern Anal-ysis and Machine Intelligence 27(3) (2005), 305–317.
[27] M. Moattar, M. Homayounpour and N.K. Kalantari, A newapproach for robust realtime voice activity detection usingspectral pattern, in: IEEE International Conference on Acous-tics Speech and Signal Processing (ICASSP), IEEE, 2010,pp. 4478–4481.
[28] G. Mohammadi and A. Vinciarelli, Automatic personality per-ception: prediction of trait attribution based on prosodic fea-tures, IEEE Transactions on Affective Computing 3(3) (2012),273–284.
[29] M.R. Nosik, W.L. Williams, N. Garrido and S. Lee, Compar-ison of computer based instruction to behavior skills trainingfor teaching staff implementation of discrete-trial instructionwith an adult with autism, Research in Developmental Disabil-ities 34(1) (2013), 461–468.
[30] D.O. Olguín, B.N. Waber, T. Kim, A. Mohan, K. Ara andA. Pentland, Sensible organizations: technology and method-ology for automatically measuring organizational behavior,IEEE Transactions on Systems, Man, and Cybernetics, Part B:Cybernetics 39(1) (2009), 43–55.
[31] W. Pan, W. Dong, M. Cebrian, T. Kim, J.H. Fowler andA. Pentland, Modeling dynamical influence in human inter-action: using data to make better inferences about influence
within social systems, Signal Processing Magazine, IEEE29(2) (2012), 77–86.
[32] C.P. Papageorgiou, M. Oren and T. Poggio, A general frame-work for object detection, in: Sixth International Conferenceon Computer Vision, IEEE, 1998, pp. 555–562.
[33] J.M. Roschelle, R.D. Pea, C.M. Hoadley, D.N. Gordin andB.M. Means, Changing how and what children learn in schoolwith computer-based technologies, The Future of Children(2000), 76–101.
[34] F. Rosenblatt, Principles of neurodynamics: perceptrons andthe theory of brain mechanisms, Technical report, DTIC Doc-ument, 1961.
[35] D. Sanchez-Cortes, O. Aran, D.B. Jayagopi, M.S. Mast andD. Gatica-Perez, Emergent leaders through looking and speak-ing: from audio-visual data to multimodal recognition, Journalon Multimodal User Interfaces 7 (2012), 1–15.
[36] O. Serin and N.-N. Cyprus, The effects of the computer-basedinstruction on the achievement and problem solving skills ofthe science and technology students, The Turkish Online Jour-nal of Educational Technology 10(1) (2011), 183–202.
[37] J. Shotton, T. Sharp, A. Kipman, A. Fitzgibbon, M. Finoc-chio, A. Blake, M. Cook and R. Moore, Real-time human poserecognition in parts from single depth images, Communica-tions of the ACM 56(1) (2013), 116–124.
[38] H. Tanaka, S. Sakti, G. Neubig, T. Toda, N. Campbell andS. Nakamura, Non-verbal cognitive skills and autistic condi-tions: an analysis and training tool, in: IEEE 3rd InternationalConference on Cognitive Infocommunications (CogInfoCom),2012, pp. 41–46.
[39] J.A. Tulsky, R.M. Arnold, S.C. Alexander, M.K. Olsen,A.S. Jeffreys, K.L. Rodriguez, C.S. Skinner, D. Farrell,A.P. Abernethy and K.I. Pollak, Enhancing communication be-tween oncologists and patients with a computer-based trainingprogram: randomized trial, Annals of Internal Medicine 155(9)(2011), 593–601.
[40] V. Vapnik, Statistical Learning Theory, 1998.[41] A. Vinciarelli, M. Pantic and H. Bourlard, Social signal pro-
cessing: survey of an emerging domain, Image Vision Comput.27(12) (2009), 1743–1759.
[42] A. Vinciarelli, H. Salamin and M. Pantic, Social signal pro-cessing: understanding social interactions through nonverbalbehavior analysis, in: IEEE Computer Society Conference onComputer Vision and Pattern Recognition Workshops, IEEE,2009, pp. 42–49.
[43] P. Viola and M.J. Jones, Robust real-time face detection, Int. J.Comput. Vision 57(2) (2004), 137–154.
[44] J.S. Webster, P.T. McFarland, L.J. Rapport, B. Morrill,L.A. Roades and P.S. Abadee, Computer-assisted trainingfor improving wheelchair mobility in unilateral neglect pa-tients, Archives of Physical Medicine and Rehabilitation 82(6)(2001), 769–775.
[45] T. Yoshida, A perspective on computer-based training, CBT,in: Proceedings of the 2013 IEEE 37th Annual Computer Soft-ware and Applications Conference, IEEE Computer Society,2013, pp. 778–783.


![Reviving Verbal Skills at College and Graduate Levels[1]](https://img.pdfslide.net/doc/110x75/577dad241a28ab223f8ed579/reviving-verbal-skills-at-college-and-graduate-levels1.jpg)


