Embed Size (px)
Citation preview
Automatic scoring of singing voice based on melodic
similarity measures
Emilio Molina Martínez
MASTER THESIS UPF / 2012
Master in Sound and Music Computing
Master thesis supervisors:
Emilia Gómez
Department of Information and Communication Technologies
Universitat Pompeu Fabra
Isabel Barbancho
Departamento de Ingeniería de Comunicaciones
Universidad de Málaga
Automatic scoring of singing voice based on melodic simila-rity measures
Emilio Molina
Music Technology GroupUniversitat Pompeu FabraTanger, 122-140, 3rd Floor08018 Barcelona, SPAIN.
Master’s thesis
Abstract A method for automatic assessment of singing voice is proposed. Suchmethod quantifies in a meaningful way the similarity between the user performanceand a reference melody. A set of melodic similarity measures comprising intonationand rhythmic aspects have been implemented for this goal. Such measure imple-ment different MIR techniques, such as melodic transcription or score alignment.The reference melody is a professional performance of the melody, but the originalscore could be also used with minor changes in the schema. In a first approach, onlyintonation, rhythm and overall score have been considered. A polynomial combina-tion of the similarity measures output are finally used to compute the final score.The optimal combination has been obtained by data fitting from a set of scoresgiven by real musicians to different melodies. The teacher criteria is specially wellmodelled for pitch intonation evaluation. The general schema is also applicable tomore complex aspects such as dynamics or expressiveness if some other meaningfulsimilarity measures are included.
Computing Reviews (1998) Categories and Subject Descriptors:
H Information SystemsH.5 Information Interfaces and PresentationH.5.5 Sound and Music Computing
Copyright: c© 2012 Emilio Molina Martınez. This is an open-access document distributed underthe terms of the Creative Commons Attribution License 3.0 Unported, which permits unrestricteduse, distribution, and reproduction in any medium, provided the original author and source arecredited.

ii
Acknowledgements
I wish to thank my supervisors Emilia and Isabel for their guidance and advice. Ialso thank my family for their confidence in me, as well as my classmates for theirsupport and for the good times we have experienced together. Special thanks toXavier Serra for giving me the chance of being part of the SMC Master. Finally, Ithank ATIC team of the University of Malaga for taking me into account for theirresearch projects.

iv

Contents
1 Introduction 1
1.1 Motivation . . . . . . . . . . . . . . . . . . . . . . . . . . . . . . . . 1
1.2 Goals . . . . . . . . . . . . . . . . . . . . . . . . . . . . . . . . . . . 2
1.3 Structure of the thesis . . . . . . . . . . . . . . . . . . . . . . . . . 3
2 State-of-the-Art 5
2.1 Music performance assessment . . . . . . . . . . . . . . . . . . . . . 5
2.1.1 Existing systems for automatic evaluation . . . . . . . . . . 5
2.1.2 Musicological perspective . . . . . . . . . . . . . . . . . . . . 6
2.2 Melody description and extraction . . . . . . . . . . . . . . . . . . . 7
2.2.1 Pitch estimation . . . . . . . . . . . . . . . . . . . . . . . . 7
2.2.2 Note segmentation . . . . . . . . . . . . . . . . . . . . . . . 8
2.2.3 Extraction of note descriptors . . . . . . . . . . . . . . . . . 8
2.2.4 Evaluation of the transcription accuracy . . . . . . . . . . . 9
2.3 Melodic similarity measure . . . . . . . . . . . . . . . . . . . . . . . 9
2.3.1 Musicological perspective . . . . . . . . . . . . . . . . . . . . 10
2.3.2 Representation of melodies and data transformations . . . . 10
2.3.3 Score alignment . . . . . . . . . . . . . . . . . . . . . . . . . 11
2.3.4 Vector measures . . . . . . . . . . . . . . . . . . . . . . . . . 11
2.3.5 Musical measures . . . . . . . . . . . . . . . . . . . . . . . . 12
v
vi CONTENTS
2.3.6 Evaluation of the similarity measures . . . . . . . . . . . . . 12
2.4 Evaluation . . . . . . . . . . . . . . . . . . . . . . . . . . . . . . . . 13
3 Selected approach 15
3.1 Low-level features extraction . . . . . . . . . . . . . . . . . . . . . . 15
3.2 Singing transcription . . . . . . . . . . . . . . . . . . . . . . . . . . 16
3.2.1 Voiced/Unvoiced segments classification . . . . . . . . . . . 17
3.2.2 Pitch-based segmentation . . . . . . . . . . . . . . . . . . . 18
3.2.3 Note pitch estimation . . . . . . . . . . . . . . . . . . . . . . 19
3.3 Similarity measure . . . . . . . . . . . . . . . . . . . . . . . . . . . 19
3.3.1 Reference melody . . . . . . . . . . . . . . . . . . . . . . . . 19
3.3.2 Score alignment . . . . . . . . . . . . . . . . . . . . . . . . . 20
3.3.3 Mean onset deviation . . . . . . . . . . . . . . . . . . . . . . 22
3.3.4 Mean pitch deviation . . . . . . . . . . . . . . . . . . . . . . 23
3.3.5 Mean interval deviation . . . . . . . . . . . . . . . . . . . . 23
3.3.6 Harmonic profile correlation . . . . . . . . . . . . . . . . . . 23
3.3.7 Interval profile correlation . . . . . . . . . . . . . . . . . . . 24
3.4 Performance score . . . . . . . . . . . . . . . . . . . . . . . . . . . . 24
3.4.1 Teacher criteria modelling . . . . . . . . . . . . . . . . . . . 24
4 Evaluation methodolody 27
4.1 Dataset building . . . . . . . . . . . . . . . . . . . . . . . . . . . . 27
4.1.1 Harmonic plus stochastic model . . . . . . . . . . . . . . . . 28
4.1.2 Random variations of pitch and rhythm . . . . . . . . . . . . 28
4.2 Evaluation measures . . . . . . . . . . . . . . . . . . . . . . . . . . 29
4.2.1 Singing transcription accuracy . . . . . . . . . . . . . . . . . 29
4.2.2 Interjudgement reliability . . . . . . . . . . . . . . . . . . . 30
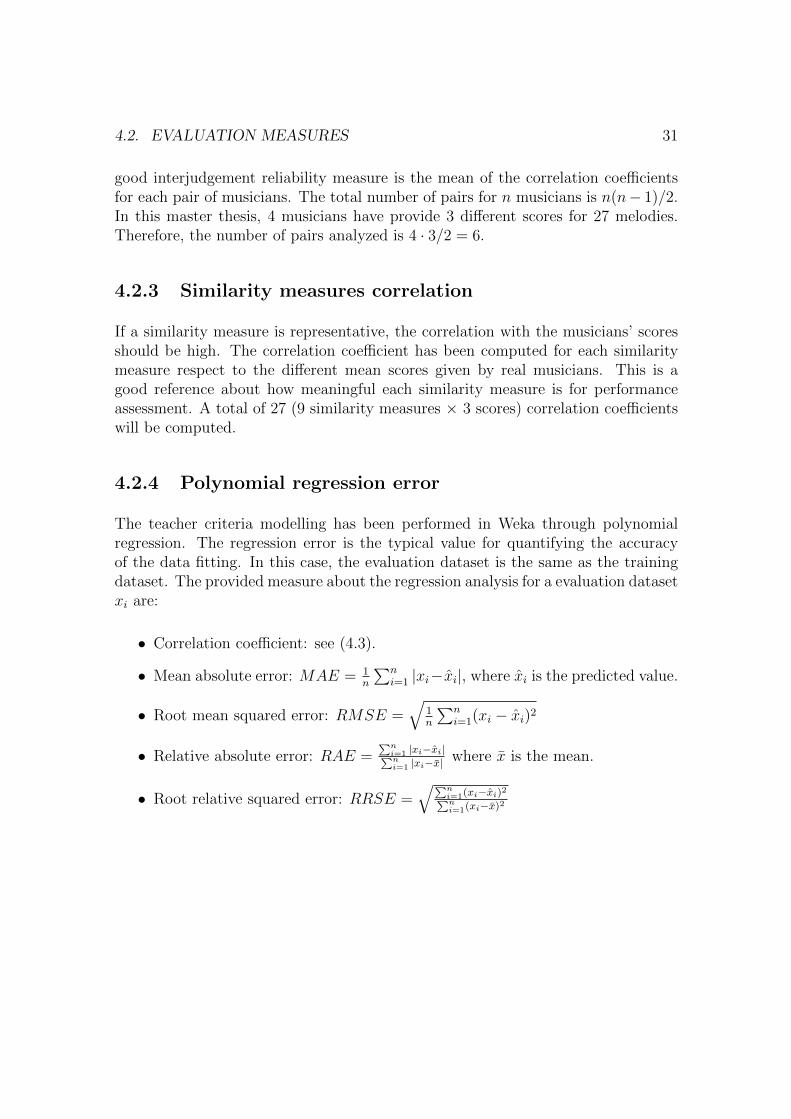
4.2.3 Similarity measures correlation . . . . . . . . . . . . . . . . 31
4.2.4 Polynomial regression error . . . . . . . . . . . . . . . . . . 31
CONTENTS vii
5 Results and discussion 33
5.1 Singing transcription accuracy . . . . . . . . . . . . . . . . . . . . . 33
5.2 Interjudgment reliability . . . . . . . . . . . . . . . . . . . . . . . . 34
5.3 Similarity measures correlation . . . . . . . . . . . . . . . . . . . . 34
5.3.1 Correlation with pitch intonation score . . . . . . . . . . . . 35
5.3.2 Correlation with rhythm score . . . . . . . . . . . . . . . . . 36
5.3.3 Correlation with overall score . . . . . . . . . . . . . . . . . 37
5.3.4 General table of correlation coefficients . . . . . . . . . . . . 38
5.4 Polynomial regression error . . . . . . . . . . . . . . . . . . . . . . 38
6 Conclusions 41
6.1 Contributions . . . . . . . . . . . . . . . . . . . . . . . . . . . . . . 41
6.2 Future work . . . . . . . . . . . . . . . . . . . . . . . . . . . . . . . 42
References 43
Chapter 1
Introduction
New information technologies have opened a wide range of possibilities for edu-cation. Nowadays, students can easily access to powerful resources than can bedidactically exploited. Specifically, new portable devices such as smartphones, padsor laptops can be combined with complex signal processing techniques to enhancethe capabilities of such didactic tools. On the other hand, current trends such asweb 2.0 or cloud computing clearly set a framework that definitely is very interestingfor educational purposes.
For the specific field of music, didactic applications usually take advantage ofmusic information retrieval techniques. Such techniques can be efficiently imple-mented in different type of devices in order to provide a meaningful analysis of thestudent’s performance.
This master thesis is framed in such context. It investigates about novel methodsfor an automatic assessment of music performances. Specifically, the adressed topicis the case of singing voice.
1.1 Motivation
Singing voice has been proved to be specially important during the music learningprocess. It strongly contributes to achieve a proper development of the musicianskills (Welch et al., 1988).
The assessment of a singing performance is based on different criteria dependingon the context and the age of the students. In the case of children and beginners,the evaluation criteria are mainly based on tuning, rhythm and the proper impost
1
2 CHAPTER 1. INTRODUCTION
of voice (in terms of energy and timbre) (Welch, 1994). Other advanced aspectssuch as vibrato or dynamics nuances are not taken into account at these levels.
Most of the existing systems are either oriented to entertainment, or they aredesigned as an auxiliary tool for a singing teacher (e.g. reviewed in Section 2.1.1).In general, they do not provide a tool for actual self-learning to the student. In thismaster thesis, novel techniques for automatic assessment of the singing performanceare proposed. The novelty respect to previous system is an evaluation system basedon a model of a real teacher to provide a helpful and complete feedback to thestudent.
1.2 Goals
The main goal is to develop novel methods for automatic assessment of the singingperformance by modelling the criteria of a real teacher. The selected approachis based on melodic similarity measures of the user’s performance respect to thereference melody. This goal is constraint to basic singing levels.
This aim is related to a sort of secondary goals:
1. Provide a state-of-the-art review in the fields of the music performance assess-ment, melody description and extraction and melodic similarity measures.
2. Elaborate an evaluation dataset
(a) Recording of reference singing melodies. They can be post-processedwith several software tools to correct any tuning or rhythm mistake.
(b) Automatic processing of the signals in order to introduce controlled ran-dom variations of pitch and/or rhythm.
3. Develop a singing transcription algorithm: pitch estimation, note segmenta-tion and parametrization.
4. Implement an score alignment algorithm.
5. Adapt the existing melodic similarity measures for the specific needs of thesystem.
6. Perform a regression analysis in order to model the criteria of real musicians.
7. Evaluate the system and discuss the results.
1.3. STRUCTURE OF THE THESIS 3
1.3 Structure of the thesis
1. Introduction: Motivation and goals of this master thesis.
2. State of the art: Relevant existing research about music performance assess-ment, melody description and extraction and melodic similarity measures.
3. Selected approach: Technical details about the selected approach for auto-matic singing assessment.
4. Evaluation methodology: Elaboration of the dataset and details about theevaluation measures.
5. Results and discussion: Obtained results and discussion about them.
6. Conclusions and Future work: Relevant conclusions and contributions, andsome guidelines for future work.
7. References

4 CHAPTER 1. INTRODUCTION
Chapter 2
State-of-the-Art
In this literature review, current research about the main aspects of this masterthesis will be analyzed and contextualized. Firstly, an overview on music perfor-mance evaluation will be presented. Some existing systems for automatic rating willbe studied, as well as a musical perspective of the addressed problem. Most of thetechniques to be implemented in this master thesis deal with such musical concepts.Then, the most relevant music information retrieval (MIR) techniques will be re-viewed. These techniques will be organized into two sections: Melody description& extraction, and melodic similarity measures. Finally, in the last chapter someconclusions about the evaluation of the system have been extracted from previousresearch.
2.1 Music performance assessment
This master thesis aims to develop a system for the automatic rating of singingvoice with pedagogic purposes. However, the scoring of a musical performance isnot an easy task, even for expert musicians. In this section we present some previousapproaches for automatic performance assessment, as well as a musicological studyabout the related problematic.
2.1.1 Existing systems for automatic evaluation
The systems for automatic rating of the singing voice have been typically appliedin two fields: entertainment and educational applications.
5
6 CHAPTER 2. STATE-OF-THE-ART
Games and entertainment
In the last years, many musical games have been successfully commercialized. Inthe case of singing voice, the main approach is a karaoke-style game with automaticscoring. Some examples of these games are Singstar (Singstar, 2004), and othersimilar games (Ultrastar, Karaoke Revolution, etc.). These systems usually performa rude analysis of the singing voice, and it usually takes into account just pitch andtime.
Educational applications
The automatic assessment of singing voice with educational purposes typically leadto more complex systems. These systems should be able to provide a meaningfulfeedback to the user with the aim of improving the singing performance (like avirtual singing tutor). Songs2See is the most recent commercial system for thispurpose, finally released in 2012 by Fraunhofer Institute (Dittmar et al., 2010).In (Mayor et al., 2006), a complete system for singing assessment based on pitch,rhythm and expressiveness accuracy is proposed. Such research finally lead to Skore(Skore, 2008), the system for online singer selection used in a famous reality TVshow. Some other examples of previous educational systems are SINGAD (SINGingAssessment and Development)(Welch et al., 1988), WinSINGAD (Howard et al.,2004), ALBERT (Acoustic and Laryngeal Biofeedback Enhancement in Real Time)(Rossiter and Howard, 1996) and Sing & See (Sing&See, 2004). Some of the previoussystems are rather oriented to provide low-level information about the singing voice,but they do not provide musical feedback for self-learning.
In general, all of them implement a meaningful performance analysis in real-time.However, the real-time approach can only give information about very short-timeperiods, and this doesn’t model the complete judgment of an expert music teacher.Some other measures apart from real-time feedback are needed to really emulate therole of a music teacher. In the proposed system, this information for an appropriateassessment will be implemented by melodic similarity measures.
2.1.2 Musicological perspective
The assessment of a given musical performance is commonly affected by many sub-jective factors, even in the case of experts musicians’ judgments. A sort of aspectssuch as the context, the evaluator’s mood, or even the physical appearance of theperformer (Griffiths and Davidson, 2006) can strongly change the perceived qual-ity of the same performance. Thus, the development of an automatic performance
2.2. MELODY DESCRIPTION AND EXTRACTION 7
evaluation system seems to be a really challenging problem. However, under thecorrect conditions, some objectives aspects can be analyzed in order to model theexpert’s judgment.
Previous researchers have studied the reliability of judgments in music perfor-mance evaluation (Ekholm et al., 1998; Bergee, 2003; Wapnick and Ekholm, 1997),with some relevant results for the purposes of this master thesis. In such studies,different musicians were asked to grade a certain number of performers according todifferent aspects, with the aim to study how similar the different judgments were.In (Wapnick and Ekholm, 1997), the case of solo voice evaluation has been ad-dressed. The different aspects to be evaluated in such experiment were rather tech-nique: appropriate vibrato, color/warmth, diction, dynamic range, efficient breathmanagement, evenness of registration, flexibility, freedom in vocal range, intensity,intonation accuracy, legato line, resonance/ring and overall score. Among these as-pects, the ones presenting a higher reliability were intonation accuracy, appropriatevibrato, resonance/ring and the overall score. In the rest of experiments (Bergee,2003), the rhythm/tempo aspects are also considered, and the conclusions are quitesimilar.
Such results are a good starting point in the automatic analysis of the perfor-mance. Since intonation, vibrato, timbre (resonances) and overall score seems tobe more objectives aspects than the others (according to the reliability analysis),we will mainly focus our evaluation on these parameters. Rhythmic analysis will bealso analyzed, since it can be easily evaluated for certain type of music material. Inorder to provide extra information for the overall score, an expressiveness evaluationof the performance will be also considered (phrasing, dynamics, etc).
2.2 Melody description and extraction
A good review about melody description and extraction techniques can be foundin (Gomez et al., 2003). On the other hand, (Klapuri and Davy, 2006), presentssome detailed information about melody transcription, with an specific approachfor singing voice.
2.2.1 Pitch estimation
Pitch is the perceptual correlate of fundamental frequency, which is a physical mea-sure. In this master thesis, we will use the term pitch referring to fundamentalfrequency, without perceptual considerations. In (Gomez et al., 2003), a general
8 CHAPTER 2. STATE-OF-THE-ART
review about the main methods for this purpose is presented. These techniques areclassified in time-domain and frequency-domain approach. Two different techniqueshas been studied for the development of this master thesis:
• Yin algorithm (De Cheveigne and Kawahara, 2002): It is a time domain ap-proach, and it can be considered as a improved version of the autocorrelationmethod.
• Two-Way Mismatch Method (Maher and Beauchamp, 1994): This is an har-monic matching method based on a frequency domain approach.
Other procedures such as zero-crossing rate estimation, or (Klapuri, 2003) approachhave been discarded because they are either too simple or too complex. Betweenthese two approaches, YIN algorithm has been the chosen technique for fundamentalfrequency extraction.
2.2.2 Note segmentation
The identification of notes from the original singing voice is a key task to achievea good assessment of the performance. This is a problem very related to onsetdetection, since a note event can be identify from a similar approach. A goodreview on generic onset detection can be found in (Bello et al., 2005). However, thesinging voice has some special features that lead to more specific algorithms.
An approach for note segmentation applied to singing voice is presented in (Vi-itaniemi et al., 2003) and (Ryyn et al., 2004). It describes note events with a hiddenMarkov model (HMM) using four musical features: pitch, voicing, accent and met-rical accent. These features are used to estimate the transition between states ofthe note event: Attack, Sustain and Silence/Noise. In (Klapuri and Davy, 2006),this model is also exposed and detailed. This is the chosen approach in the systemdeveloped by (Mayor et al., 2006) for singing evaluation.
2.2.3 Extraction of note descriptors
Once the different notes have been segmented, a set of parameters have to be ex-tracted from each one. In (Mayor, Oscar., Bonada, Jordi., Loscos, 2009), the con-sidered parameters are pitch, volume, timing and expressive aspects such as vibratoor timbre.
2.3. MELODIC SIMILARITY MEASURE 9
According to (McNab et al., 1996) the perceived pitch of a note can be calculatedby averaging the most representative pitch values into such time interval. This canbe considered a mix between the mean and the mode of the pitch values. The wholeenergy is commonly computed with a simple average. Respect to the vibrato issue,in (Rossignol et al., 1999) a sort of procedures for its parametrization are reviewed.
2.2.4 Evaluation of the transcription accuracy
In (Ryyn et al., 2004), the transcription accuracy is evaluated by measuring thedifference between a reference melody and the transcribed one. Two evaluation cri-teria were used: frame-based and note-based. The frame-based evaluation computedthe error between the estimated pitch curve, and the reference. In the note-basedevaluation, the hit ratio reflects the goodness of the system.
The case of melody extraction from polyphonic music is a more complex prob-lem, and its evaluation usually takes into account more variables. The reviewedapproaches for this type of evaluation also measure voicing and chroma accuracy(Poliner et al., 2007). The MIREX contest (MIREX, 2012) is also concerned aboutthis problem, and similar evaluation procedures are proposed (MIREX, 2012). De-spite singing transcription is a different problem, the related evaluation procedurescan be useful to evaluate certain aspects of such task.
2.3 Melodic similarity measure
Melodic performance assessment, and melodic similarity are two related issues. Apossible way to address the automatic assessment is by quantifying the similaritybetween the user performance and a target melody. This is the main idea behindthe evaluation for the similarity measures proposed in (Mullensiefen and Frieler,2004), and it is the selected approach in this master thesis.
Melodic similarity measures has been applied in many MIR tasks, such as query-by-humming systems (Pardo et al., 2004) or genre classification (Anan et al., 2011).A very interesting review on melodic similarity measures can be found in (Mullen-siefen and Frieler, 2004). The same authors also implemented the toolkit SIMILE(Mullensiefen and Frieler, 2006). It consists on a set of implemented melodic simi-larity measures with a detailed documentation.
10 CHAPTER 2. STATE-OF-THE-ART
2.3.1 Musicological perspective
McAdams and Matzkin (2001) present a study on perceptual similarity from a musi-cal point of view. They analyze the way we perceive similarity between two musicalmaterials after applying a certain transformation. Such transformations are studiedin different dimensions (mainly pitch and rhythm), and they evaluate the weightthey affect the similarity perception and how are they interconnected. In such ex-periments, pitch and rhythm were initially considered as independent dimensions,and transformations were applied to each one in an independent way. However, theresults showed a certain dependency between pitch and rhythm dimensions. Rhyth-mic variations in the same pitch pattern are usually perceived as more different thanpitch variations in the same rhythmic pattern. On the other hand, a very importantaddressed point in (McAdams and Matzkin, 2001) is the importance of the musical“grammar”. When studying grammatically coherent music (according to the tonalwestern style), transformations affecting the coherence of the music were perceivedas more strong.
The results of the previous experiments lead to a sort of conclusions to be appliedin this master thesis:
• The abstract information related to tonality and structure (in general ”gram-mar” information) strongly affects the perception of similarity. Thus, theseconcepts should be somehow considered in a meaningful similarity measure.
• Overall similarity is perceived in different dimensions: pitch, duration, tim-bre, etc. According to the results of (McAdams and Matzkin, 2001), thesedimensions are relatively independent, but not completely. The stored pitchinformation seems to be affected by rhythmic aspects, and that’s also an im-portant factor to be considered in the developed similarity measures. Rhythmcan be taken as the skeleton of the music, that can really change the overallaspect of the above details (pitch, timbre, etc).
2.3.2 Representation of melodies and data transformations
Any measure of melodic similarity will necessarily be computed from a representa-tion of the musical theme. The representation of the melody will affect the behaviorof a given similarity measure, so it is an important aspect to take into account. In(Mullensiefen and Frieler, 2004), several melodic representations are proposed:
2.3. MELODIC SIMILARITY MEASURE 11
• [Duration, Pitch] series: Melody is represented as a series of a bidimensionalpoints [Di,Pi]. Di makes reference to the inter-onset interval (IOI), and Pi tothe absolute pitch position (MIDI note).
• [Duration, Interval] series: Instead of using the absolute pitch position, it usesthe relative difference between consecutive pitches (intervals).
• Rhythmically weighted pitch series: In this case, the rhythmic information isstored in the number of times a certain pitch is repeated (e.g. [Di,Pi]=[1, 69],[2, 67] would be converted to wPi = [69, 67, 67].
The previous exposed melodic representations, ideally contain a complete descrip-tion of the input melody. However, the simplification of the representations some-times contributes to a similarity measure more related to the rough aspect of thewhole melody.
2.3.3 Score alignment
When two melodies to be compared are rhythmically misaligned, a direct compari-son over the pitch curve is meaningless. Due to that, the similarity measures shouldbe complemented with a score alignment algorithm.
Cano et al. (1999) propose a method for score alignment of symbolic melodicrepresentations based on hidden Markov models. However, it is not very appropri-ated for continuous curves. Other approaches are based on Dynamic Time Warping(DTW) for the alignment of two similar curves (Kaprykowsky and Rodet, 2006).This technique allows to find the optimal match between two vectors for aligningthem. An implementation of a generic DTW algorithm can be found in (Ellis, 2003).This has been an important starting point in this master thesis. For possible real-time purposes, MATCH is a very interesting toolkit for dynamic score alignment(Dixon and Widmer, 2005).
2.3.4 Vector measures
If we consider the pitch series and the duration series as metrical vectors, we canperform some similarity measures by quantifying distances and projections betweenthem. This kind of measures have been studied in (Aloupis et al., 2003), and theycan found in the toolkit SIMILE (Mullensiefen and Frieler, 2006).
The proposed vector measures are the mean absolute difference (equation 2.1)and the correlation (equation 2.2)).
12 CHAPTER 2. STATE-OF-THE-ART
MAD(x1, x2) =1
N
N∑i=1
|x1i − x2
i | (2.1)
corr(x1, x2) =
∑Ni=1 x
1i · x2
i√∑Ni=1 x
1i · x1
i ·∑N
i=1 x2i · x2
i
(2.2)
Where x1i and x2
i are the two vectors of equal length N .
2.3.5 Musical measures
The use of the same scale into two different melodies can strongly affect to theperceived similarity between them. The predominant scale of a melody can beanalyzed by a twelve-notes histogram, commonly called chromagram. The use ofthe chromagram vector for extracting tonal information from polyphonic audio datahas been studied by (Gomez, 2006). The computation of the chromagram fromsymbolic information is even easier, since the histogram only takes into account theknown pitch and duration of every note.
In (Mullensiefen and Frieler, 2004), two different types of harmonic similaritymeasures based on the Krumhansl-Schmuckler (Krumhansl, 1990) vectors are pro-posed:
• Harmonic vector correlation: For every bar of both melodies, the correlationwith the Krumhansl-Schmuckler profiles are computed. The resulting vector-of-vectors from each melody are correlated bar by bar. Finally, the averagecorrelation can be considered a harmonic similarity measures. Variations overthis idea con provide some other harmonic vector correlations.
• Harmonic edit-distance: We compute a single tonality value for each bar asthe key, which had the maximum value of the 24 possible keys, taking values0-11 as major keys and values 12-23 as minor keys. This gave a “harmonicstring” for each melody for which we can compute the edit-distance.
2.3.6 Evaluation of the similarity measures
We consider the methodology proposed by Mullensiefen and Frieler (2004), wherethe compared the results of such measures with an average of expert musicians
2.4. EVALUATION 13
judgments. This is the chosen approach in order to evaluate further similaritymeasures.
MIREX contest is only oriented to symbolic similarity in the context of similarmelodies retrieval, but it’s an interesting evaluation procedure to take into account.
2.4 Evaluation
The evaluation of previous systems can be a good starting point to design a properevaluation of the developed system. In the case of the singing scoring system pre-sented in (Mayor, Oscar., Bonada, Jordi., Loscos, 2009), the evaluation has beenperformed with amateurs singers and five different pop songs. The accuracy in notesegmentation, as well as expression regions, were evaluated to consider that the aimof the system was successfully achieved.
Other approaches have tried to study the influence of the system in a group ofstudents during a certain time period. The evaluation of WinSingad (Howard et al.,2004) was performed in a singing studio with four adults students for an initialperiod of 2 months. A teacher was monitoring the evolution of the students, andhis opinion was considered as a good feedback about the performance of the system.
A good evaluation should combine both approaches: the evaluation of the com-putational tasks comprising the system (such as transcription, similarity, etc.), aswell as the representativeness of the final score for a musical self-learning of thestudent.

14 CHAPTER 2. STATE-OF-THE-ART
Chapter 3
Selected approach
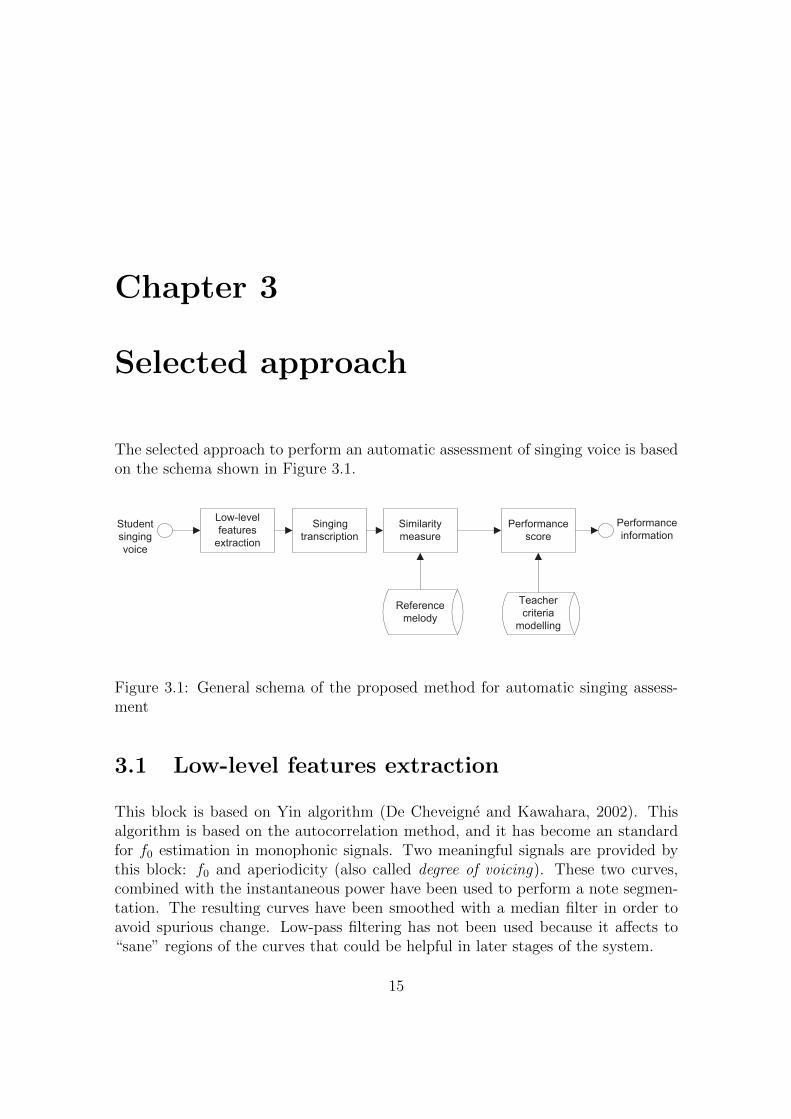
The selected approach to perform an automatic assessment of singing voice is basedon the schema shown in Figure 3.1.
Low-levelfeatures
extraction
Similaritymeasure
Teachercriteria
modelling
Performancescore
Referencemelody
Studentsingingvoice
Performanceinformation
Singingtranscription
Figure 3.1: General schema of the proposed method for automatic singing assess-ment
3.1 Low-level features extraction
This block is based on Yin algorithm (De Cheveigne and Kawahara, 2002). Thisalgorithm is based on the autocorrelation method, and it has become an standardfor f0 estimation in monophonic signals. Two meaningful signals are provided bythis block: f0 and aperiodicity (also called degree of voicing). These two curves,combined with the instantaneous power have been used to perform a note segmen-tation. The resulting curves have been smoothed with a median filter in order toavoid spurious change. Low-pass filtering has not been used because it affects to“sane” regions of the curves that could be helpful in later stages of the system.
15
16 CHAPTER 3. SELECTED APPROACH
3.2 Singing transcription
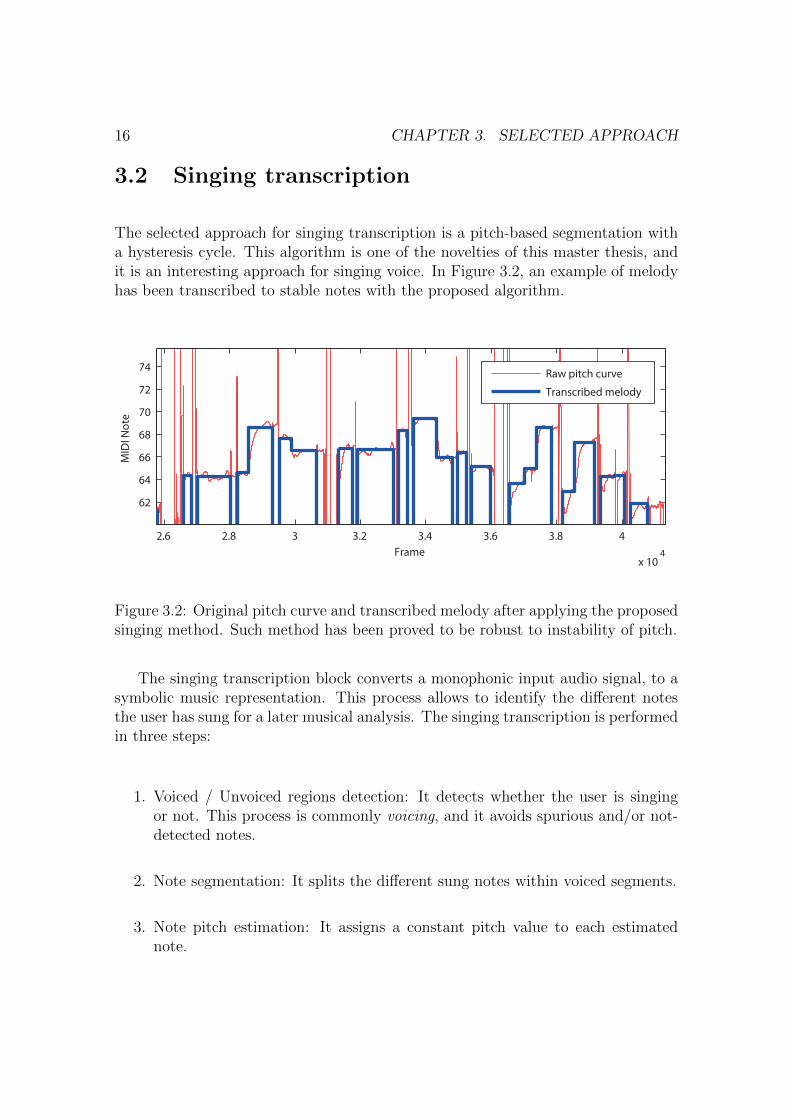
The selected approach for singing transcription is a pitch-based segmentation witha hysteresis cycle. This algorithm is one of the novelties of this master thesis, andit is an interesting approach for singing voice. In Figure 3.2, an example of melodyhas been transcribed to stable notes with the proposed algorithm.
2.6 2.8 3 3.2 3.4 3.6 3.8 4
x 104
62
64
66
68
70
72
74
Frame
MID
I No
te
Raw pitch curve
Transcribed melody
Figure 3.2: Original pitch curve and transcribed melody after applying the proposedsinging method. Such method has been proved to be robust to instability of pitch.
The singing transcription block converts a monophonic input audio signal, to asymbolic music representation. This process allows to identify the different notesthe user has sung for a later musical analysis. The singing transcription is performedin three steps:
1. Voiced / Unvoiced regions detection: It detects whether the user is singingor not. This process is commonly voicing, and it avoids spurious and/or not-detected notes.
2. Note segmentation: It splits the different sung notes within voiced segments.
3. Note pitch estimation: It assigns a constant pitch value to each estimatednote.
3.2. SINGING TRANSCRIPTION 17
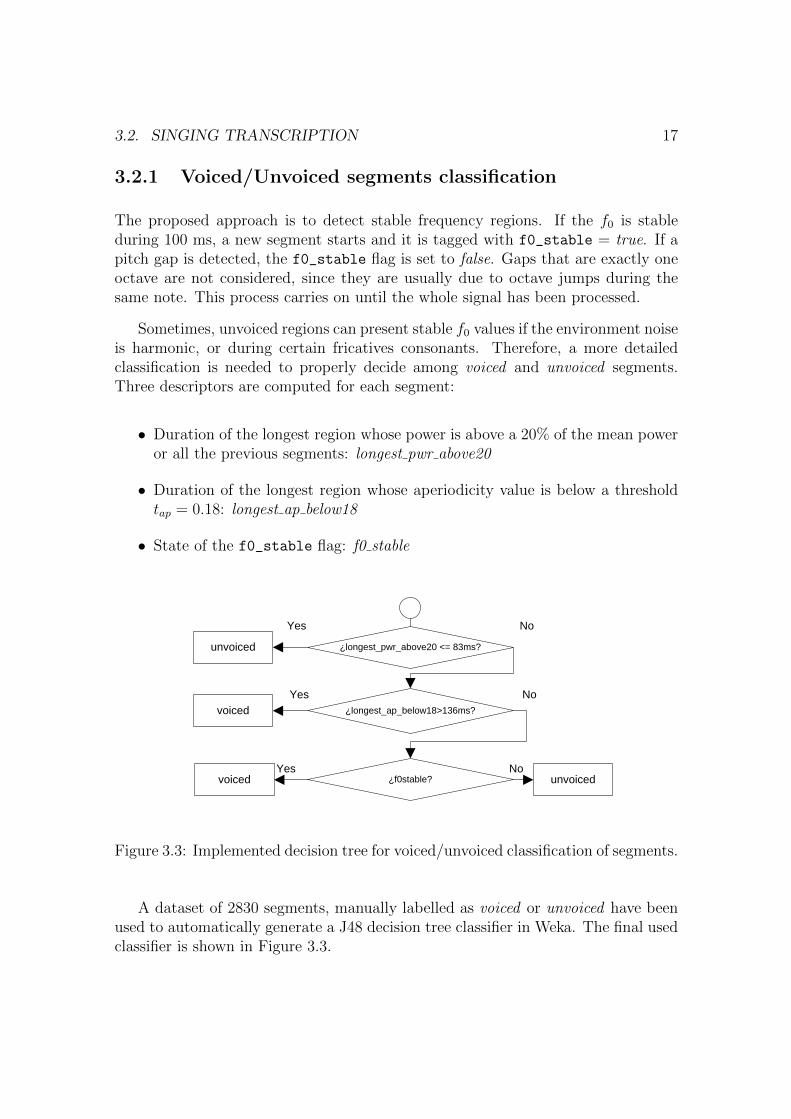
3.2.1 Voiced/Unvoiced segments classification
The proposed approach is to detect stable frequency regions. If the f0 is stableduring 100 ms, a new segment starts and it is tagged with f0_stable = true. If apitch gap is detected, the f0_stable flag is set to false. Gaps that are exactly oneoctave are not considered, since they are usually due to octave jumps during thesame note. This process carries on until the whole signal has been processed.
Sometimes, unvoiced regions can present stable f0 values if the environment noiseis harmonic, or during certain fricatives consonants. Therefore, a more detailedclassification is needed to properly decide among voiced and unvoiced segments.Three descriptors are computed for each segment:
• Duration of the longest region whose power is above a 20% of the mean poweror all the previous segments: longest pwr above20
• Duration of the longest region whose aperiodicity value is below a thresholdtap = 0.18: longest ap below18
• State of the f0_stable flag: f0 stable
¿longest_pwr_above20 <= 83ms?
¿longest_ap_below18>136ms?
¿f0stable?
unvoiced
voiced
unvoiced
Yes No
Yes No
Yes Novoiced
Figure 3.3: Implemented decision tree for voiced/unvoiced classification of segments.
A dataset of 2830 segments, manually labelled as voiced or unvoiced have beenused to automatically generate a J48 decision tree classifier in Weka. The final usedclassifier is shown in Figure 3.3.
18 CHAPTER 3. SELECTED APPROACH
3.2.2 Pitch-based segmentation
Once the voiced regions are automatically identified, a second segmentation isneeded to split legato notes. In the case beginner singers, the note segmentationbecomes harder due the instability of pitch and energy within the same note. Theproposed solution is a pitch-based segmentation with an hysteresis cycle in time andfrequency. The hysteresis is a good approach to deal with unstable pitches. It isrobust to minor variations, but it is sensitive to important and sustained changesin pitch. This method is partially based on (McNab et al., 1996) and (Ryyn et al.,2004).
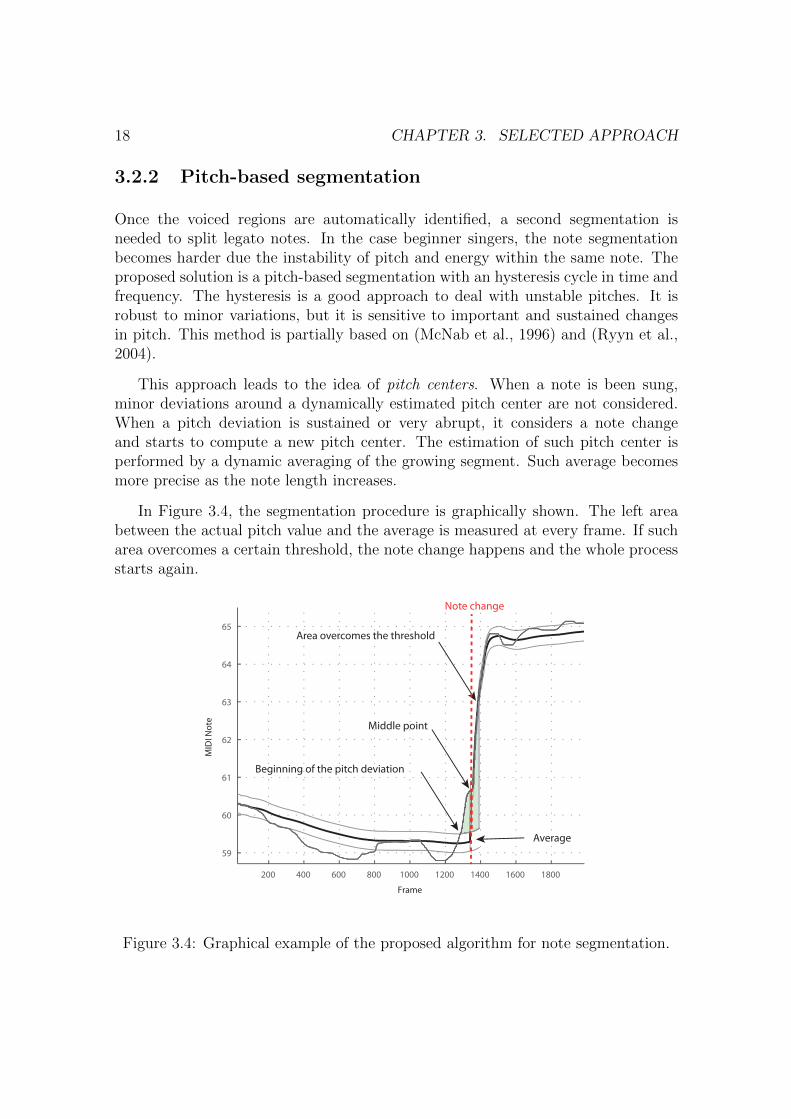
This approach leads to the idea of pitch centers. When a note is been sung,minor deviations around a dynamically estimated pitch center are not considered.When a pitch deviation is sustained or very abrupt, it considers a note changeand starts to compute a new pitch center. The estimation of such pitch center isperformed by a dynamic averaging of the growing segment. Such average becomesmore precise as the note length increases.
In Figure 3.4, the segmentation procedure is graphically shown. The left areabetween the actual pitch value and the average is measured at every frame. If sucharea overcomes a certain threshold, the note change happens and the whole processstarts again.
200 400 600 800 1000 1200 1400 1600 1800
59
60
61
62
63
64
65
MID
I N
ote
Frame
Beginning of the pitch deviation
Middle point
Area overcomes the threshold
Average
Note change
Figure 3.4: Graphical example of the proposed algorithm for note segmentation.
3.3. SIMILARITY MEASURE 19
3.2.3 Note pitch estimation
Once the different sung notes have been segmented, a single pitch value has to beassigned to every note. According to McNab et al. (1996), the best pitch estimationfor a note is a weighted mean of the most representative range of pitch values. Thistype of mean is called alpha-trimmed mean, and it removes the extreme pitch values(usually corresponding to boundaries) before computing the mean. In the chosenprocedure, an energy weighted mean has been computed after discarding extremepitch values.
3.3 Similarity measure
The automatic assessment of the singing performance is based on melodic similaritymeasures respect to a reference melody, considered as the “ideal” performance. Insubsection 3.3.1, the chosen definition for reference melody is exposed.
When two melodies are rhythmically misaligned, a direct comparison betweenthem can lead to meaningless results. Due to that, a score alignment based ondynamic time warping has been implemented (see subsection 3.3.2).
Next subsections presents the technical details about the developed similaritymeasures in this master thesis.
3.3.1 Reference melody
A key problem of musical performance assessment is defining the “ideal” perfor-mance, i.e. the reference melody. This reference melody can be defined in differentways, depending on the chosen assessment criteria. Two different approaches areinteresting to define the reference melody:
• Recording of a professional singer’s performance: In this case, thesinger is asked to sing with a rather pure voice, without vibrato, and tryingto be a good reference for beginners and children. Some post-processing withMelodyne (2010) has been applied to correct minor pitch. In such case, theprofessional musician agreed with the corrections.
• Midi score: On the other hand, the score of the melody can also be aninteresting reference. However, it has not been used because score alignmentdid not offer such good results for specific cases. Further research should beneeded for its robust implementation.
20 CHAPTER 3. SELECTED APPROACH
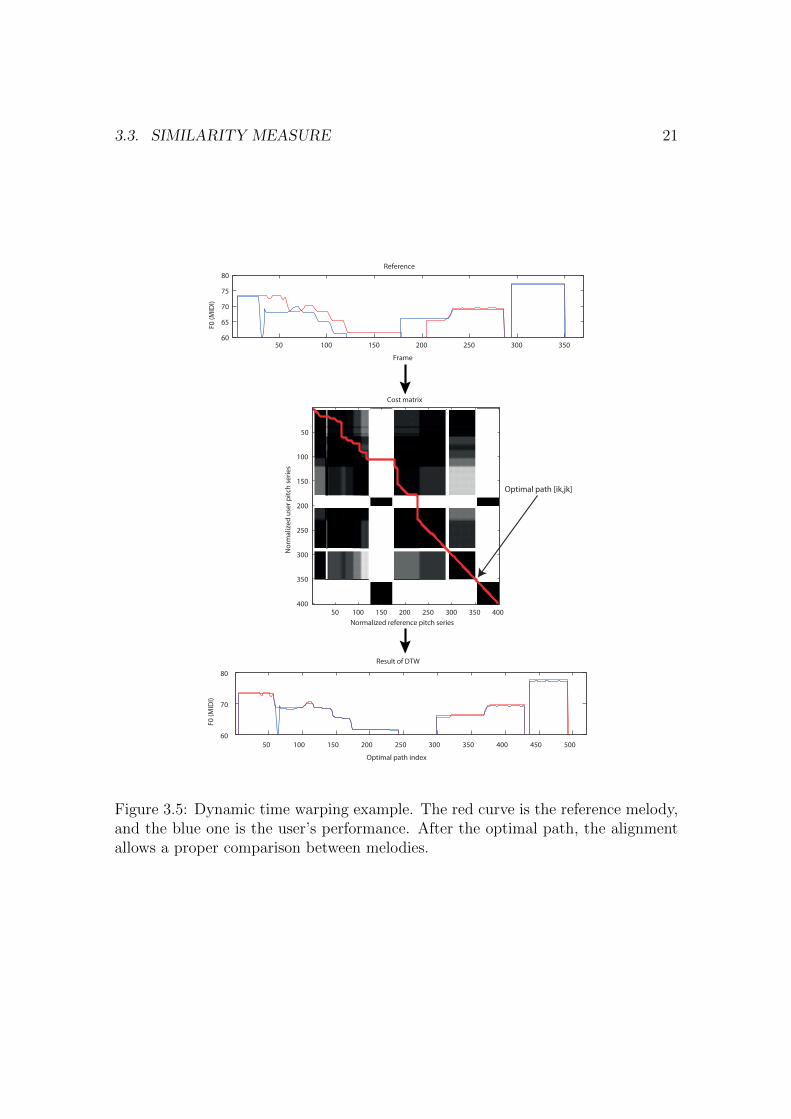
3.3.2 Score alignment
The selected approach for score alignment is based on Dynamic Time Warping(DTW). DTW is a method that allows a computer to find an optimal match betweentwo given sequences under certain restrictions. However, the definition of optimalmatch strongly affects the robustness of the alignment. In this case, the alignmentis optimized to fit the following conditions:
• The cost value to be minimized is the squared pitch difference between theuser and the reference melodies. When two unvoiced frames are compared,the cost value is zero.
• A comparison between a voiced and an unvoiced frame should produce acontrolled cost value.
This can be achieved by substituting pitch values of unvoiced regions by a verylow constant value. On this way, meaningless pitch values are avoided. Then, thecost matrix M can be defined as follow: Let p1 be the pitch series of the referencemelody, and p2 the pitch series of the user performance. The cost matrix is definedas: M(i, j) = min{(p1(i)− p2(j))2, α}. When the squared pitch difference becomeshigher than α, it is considered to be an spurious case and its contribution to thecost matrix is limited. It avoids that spurious pitch differences strongly affects thewhole cost value.
The DTW algorithm takes as input the cost matrix, and it provides an optimalpath [ik, jk] for k ∈ 1 . . . K, where K is the length of the path. Several restrictionsare applied to avoid illogical situations, such as the alignment between two pointsthat are too distant in time. More details about the DTW algorithm can be foundin (Ellis, 2003). In Figure 3.5, an example of cost matrix together with the resultingtime-warped pitch vectors are shown.
Score alignment as a similarity measure
Score alignment can be also considered a similarity measure. The shape of the pathwithin the cost matrix gives an interesting measure about rhythmic deviations,whereas the accumulated cost-value of the path is a good reference about pitchaccuracy. If the user performs with good rhythmic stability and exact tempo wouldproduce a 45o line. On the other hand, good rhythmic stability but different tempowould produce straight lines with different angles. Curved lines represent instabilityand deviations respect to the original rhythm. Therefore, the straightness on thepath is a good measure about the rhythmic performance.
3.3. SIMILARITY MEASURE 21
Normalized reference pitch series
No
rma
lize
d u
ser
pit
ch s
eri
es
Cost matrix
50 100 150 200 250 300 350 400
50
100
150
200
250
300
350
400
50 100 150 200 250 300 350 400 450 500
60
70
80
F0
(M
IDI)
Optimal path index
Result of DTW
Optimal path [ik,jk]
50 100 150 200 250 300 35060
65
70
75
80
Frame
F0
(M
IDI)
Reference
Figure 3.5: Dynamic time warping example. The red curve is the reference melody,and the blue one is the user’s performance. After the optimal path, the alignmentallows a proper comparison between melodies.
22 CHAPTER 3. SELECTED APPROACH
Rhythmic deviation: linear regression error
The straightness of the optimal path has been measure by performing a linearregression. The path values [ik, jk] have been fitted into a polynomial of degree 1by using the Matlab function polyfit. The mean squared difference between theoriginal function and such polynomial is the linear regression error ε.
The linear regression error has been called: lin reg err.
3.3.3 Mean onset deviation
The combination of score alignment and note segmentation provides an interest-ing framework to perform different similarity measures. By combining these twotechniques, the notes from the user performance can be directly associated to anote from the reference melody. Therefore, the same note can be identified in bothmelodies, even if they are not originally aligned in time.
The first interesting measure for rhythmic assessment is the mean onset deviationbetween notes. The problem of this measure is its low robustness against the onsetimprecision during the note segmentation. For most of the sung melodies, the onsetsshould be precise enough to allow a meaningful similarity measure. The advantageof this measure is that it is quite close to the way musicians actually judge aboutrhythm.
The mean onset deviation has been called: m onset dev.
Rhythmically weighted mean onset deviation
This measure is a rhythmically weighted mean of the onset deviation. In this case,onsets belonging to long notes have a higher weight than short notes. The typicalexpression for a weighted mean is shown in (3.1).
x =
∑ni=1 ωixi∑ni=1 ωi
(3.1)
Where x is the weighted mean, xi is the signal and ωi are the weights
The rhythmically weighted mean onset deviation has been called: wm onset dev.
3.3. SIMILARITY MEASURE 23
3.3.4 Mean pitch deviation
One of the most important aspects of singing assessment is the accuracy of intona-tion. The whole measure can be computed by measuring the mean absolute pitchdeviation respect to the reference melody. This measure is not key independent,and just absolute pitch values are taken into account. Depending on the chosen cri-teria, this is not totally meaningful, because key is not critical for a-capella singingat basic levels.
The mean pitch deviation has been called: m pitch dev.
Since the previous measure does not take into account the duration of the notes,a rhythmically weighted mean is also proposed. In this similarity measure, longnotes have a higher weight within the average.
The rhythmically weighted mean pitch deviation has been called: wm pitch dev.
3.3.5 Mean interval deviation
A way to normalize the key of the melodies is considering the interval deviation.The interval is defined as the pitch difference between two consecutive notes. In thiscase, the absolute key is not critical for the evaluation. This is a similarity measuremore appropriated for a-capella singing.
The mean interval deviation has been called: m interv dev.
The rhythmically weighted version of this measure has been also included. Ithas been called: wm interv dev.
3.3.6 Harmonic profile correlation
According to Mullensiefen and Frieler (2004), the harmonic correlation is an inter-esting measure for melodic similarity, since it is representative of the whole sonorityof a melody. In this case, the harmonic profile has been computed as an histogram ofthe importance for each pitch class within the melody. Such histogram is computedby summing the total duration of notes belonging to the same pitch class. Theresult is a chroma vector of 12 positions that contains interesting tonal informationabout the input melodic.
This is a key-dependent measure, and therefore it should be complemented witha key-independent measure.
The harmonic profile correlation has been called: h prof corr.
24 CHAPTER 3. SELECTED APPROACH
3.3.7 Interval profile correlation
The key-independent version of the previous measure is the interval profile corre-lation. In this case, a histogram of intervals belonging to the melody has beencomputed. This is representative of the whole sonority of the melody in a keyindependent way. For instance, a chromatic melody would strongly differ from adiatonic melody according to this measure.
The interval profile correlation has been called: interv profile corr.
3.4 Performance score
The final block of the singing assessment system if the Performance Score. It takesas input the similarity measure respect to the reference melody, and it gives aperformance score to the user as a feedback to keep learning. In total, nine differentsimilarity measures have been computed:
1. Linear regression error (rhythmic measure): lin reg err
2. Mean onset deviation (rhythmic measure): m onset dev
3. Rhythmically weighted mean onset deviation (rhythmic measure): wm onset dev
4. Mean pitch deviation (intonation measure): m pitch dev
5. Rhythmically weighted mean pitch deviation (intonation measure): wm pitch dev
6. Mean interval deviation (intonation measure): m interv dev
7. Rhythmically weighted mean interval deviation (intonation measure): wm interv dev
8. Harmonic profile correlation: h profile corr
9. Interval profile correlation: interv profile corr
These nine similarity measures is the input to the Performance Score block. Theoutput consists on three different scores:
1. Intonation score
2. Rhythm score
3. Overall score
3.4.1 Teacher criteria modelling
The optimal combination of the nine similarity measures has been obtained bypolynomial regression in Weka (Hall et al., 2009). The training dataset consists
3.4. PERFORMANCE SCORE 25
on real scores given by trained musicians (at least 7 years of formal music studies)to a set of sung melodies. In total, 4 trained musicians have evaluated 27 differentmelodies, producing a training dataset of 108 instances for each score. This approachdoes not model a single teacher, but the average opinion of a group of teachers.

26 CHAPTER 3. SELECTED APPROACH
Chapter 4
Evaluation methodolody
The evaluation methodology is mainly based on two steps:
1. Dataset building: A dataset carefully designed has been built to perform alater evaluation of the performance of the system.
2. Computation of four evaluation measures:
(a) Singing transcription accuracy: It measures the goodness of the singingtranscription block.
(b) Interjudgement reliability: It measures the correlation between the dif-ferent opinions of the musicians.
(c) Similarity measures correlation: It measures the correlation for each sim-ilarity measure with the scores given by the real musicians.
(d) Polynomial regression error: It measures how well the system models themusicians judgement.
4.1 Dataset building
Due to the difficult of obtaining a big number of representative singing records,an alternative solution is proposed. The evaluation dataset has been generated byintroducing random variations of pitch and rhythm to the reference melodies. Suchmelodic transformations are possible with an harmonic plus stochastic modelling ofthe input signal (Serra, 1989). For the case of singing voice, such model combinedwith the note segmentation definitely set an interesting framework to apply musicaltransformations.
27
28 CHAPTER 4. EVALUATION METHODOLODY
Three different melodies of reference have been recorded. These melodies havebeen sung by a singing teacher, and post-processed with Melodyne to achieve aperfect rhythm and intonation. Three levels of random variations have been appliedfor both pitch and rhythm. In total, nine combinations with different degrees ofmistakes are extracted from each reference melody. Therefore, 27 melodies (around22 minutes of audio) comprise the whole evaluation dataset.
4.1.1 Harmonic plus stochastic model
In the proposed procedure, this model has been applied to every independent note.The typical steps to perform an harmonic plus stochastic modelling of the signalare:
1. Sinusoidal estimation
2. Harmonic matching
3. Extraction of the residual component
4. Stochastic modelling of the residual component
4.1.2 Random variations of pitch and rhythm
Pitch variations
The intervals of the melody have been modified in order to emulate the typicalmistakes of beginners and children when they are singing. The whole contour ofthe melody is maintained, but the deviations of the intervals produce wrong pitchvalues. Three levels of interval modifications have been applied:
1. No variation: The pitch of the notes is not modified.
2. Weak interval variation: Every interval of the melody has been randomlymodified. If the original interval is smaller than 4 semitones, a random pitchshifting between [0, 0.8] semitones is applied. If the original interval is biggerthan 4 semitones, such variation is comprised in [0, 1.6] semitones. Thesevalues have been empirically chosen to achieve a realistic result.
3. Strong interval variation: For intervals smaller than 4 semitones, a randompitch shifting between [0, 1.3] semitones is applied. If the original intervalis bigger than 4 semitones, the variation is a random value between [0, 2]semitones.
4.2. EVALUATION MEASURES 29
Rhythm variations
The same approach has been applied to the rhythmical transformations. Threelevels of rhythmic variations have been considered:
1. No variation
2. Weak rhythmic variation: Each note has a random time stretching, whoseratio is comprised in [60%, 140%].
3. Strong rhythmic variation: The ratio of the random time stretching is com-prised in [25%, 170%].
In real singers, the typical rhythmic mistakes are not independent for consecutivenotes. Due to that, a slight low-pass filtering have been applied to the series of ratiosin order to model the inertia of tempo variations.
4.2 Evaluation measures
Four different measures have been computed in order to evaluate the system. Suchmeasures are presented at the beginning of this chapter, and they will be detailedin next subsections.
4.2.1 Singing transcription accuracy
The evaluation of the melodic transcription algorithm for singing voice is based onRyyn et al. (2004) approach. Two different measures are computed:
• Note-based error: It does not take into account the duration, just the numberof right notes.
• Frame-based error: It implicitly takes into account the duration of the notes,and it is more relevant for the needs of this master thesis.
These values are measured respect to manually annotated transcriptions. The an-notations have been made in Cubase by a trained musician (10 years of musiceducation) for 15 melodies randomly chosen from the dataset (around 12 minutes).
30 CHAPTER 4. EVALUATION METHODOLODY
According to Ryynanen approach, the note-based evaluation is symmetricallyapproached from both the reference and the transcribed melodies’ point of view.First, we count the number of reference notes that are hit by the transcribed melodyand denote this number with cR. A reference note is hit, if a note in the transcribedmelody overlaps with the reference note both in time and in pitch. Second, the samescheme is applied so that the reference and transcribed melody exchange roles, i.e.,we count the number of transcribed notes that are hit by the reference melody anddenote the count with cT . The note error En for a transcribed melody is the definedin (4.1).
En =1
2
(cR − cRcR
+cT − cTcT
)· 100% (4.1)
where cR is the number of reference notes, and cT is the number of transcribednotes.
The frame-based evaluation criterion is defined by the number of correctly tran-scribed frames ccor and the number of voiced frames cref in the reference melody.A frame is considered to be correctly transcribed, if the transcribed note equals tothe reference note in that frame. The frame error Ef for a transcribed melody isdefined in (4.2).
Ef =cref − ccor
cref· 100% (4.2)
The frame and note errors are calculated for each individual melody in theevaluation database, and the average of these is reported.
4.2.2 Interjudgement reliability
The interjudgement reliability is an evaluation measured extracted from (Wapnickand Ekholm, 1997). It measures the correlation of the scores given by differentmusicians. This measure is useful to check the reliability and “objectivity” of theopinions. The correlation coefficient is a good way to check the coherence betweentwo different musicians, and it can be computed as shown in (4.3).
rxy =
∑ni=1(xi − x)(yi − y)√∑n
i=1(xi − x)2∑n
i=1(yi − y)2(4.3)
Where xi are the scores given by one musician, and yi are the scores given byanother musician.
According to Wapnick and Ekholm (1997), in the case of having n musicians, a
4.2. EVALUATION MEASURES 31
good interjudgement reliability measure is the mean of the correlation coefficientsfor each pair of musicians. The total number of pairs for n musicians is n(n− 1)/2.In this master thesis, 4 musicians have provide 3 different scores for 27 melodies.Therefore, the number of pairs analyzed is 4 · 3/2 = 6.
4.2.3 Similarity measures correlation
If a similarity measure is representative, the correlation with the musicians’ scoresshould be high. The correlation coefficient has been computed for each similaritymeasure respect to the different mean scores given by real musicians. This is agood reference about how meaningful each similarity measure is for performanceassessment. A total of 27 (9 similarity measures × 3 scores) correlation coefficientswill be computed.
4.2.4 Polynomial regression error
The teacher criteria modelling has been performed in Weka through polynomialregression. The regression error is the typical value for quantifying the accuracyof the data fitting. In this case, the evaluation dataset is the same as the trainingdataset. The provided measure about the regression analysis for a evaluation datasetxi are:
• Correlation coefficient: see (4.3).
• Mean absolute error: MAE = 1n
∑ni=1 |xi−xi|, where xi is the predicted value.
• Root mean squared error: RMSE =√
1n
∑ni=1(xi − xi)2
• Relative absolute error: RAE =∑n
i=1 |xi−xi|∑ni=1 |xi−x| where x is the mean.
• Root relative squared error: RRSE =√∑n
i=1(xi−xi)2∑ni=1(xi−x)2

32 CHAPTER 4. EVALUATION METHODOLODY
Chapter 5
Results and discussion
In this chapter, the obtained results will be exposed and discussed. These resultshave been obtained with the selected approach and the previously exposed evalua-tion measures: Singing transcription accuracy, interjudgement reliability, similaritymeasures correlation and polynomial regression error.
5.1 Singing transcription accuracy
The obtained accuracy results for the proposed singing transcription system, ac-cording to Ryyn et al. (2004) evaluation measures are:
Note-based error: En = 9% (Ryynanen approach: En = 9.4%)Frame-based error: Ef = 10% (Ryynanen approach: Ef = 9.2%)
This error is computed respect to set of manually annotated transcriptions.Despite the proposed singing transcription approach is simple, the obtained error israther low, very close to state-of-the-art system such as Ryynanen approach. Thetypical errors are subsegmented notes, spurious notes and not detected notes. Thiskind of error, for the purpose of singing assessment are not critical. Therefore, thesinging transcription algorithm is considered to be good enough for the scope of thismaster thesis.
33
34 CHAPTER 5. RESULTS AND DISCUSSION
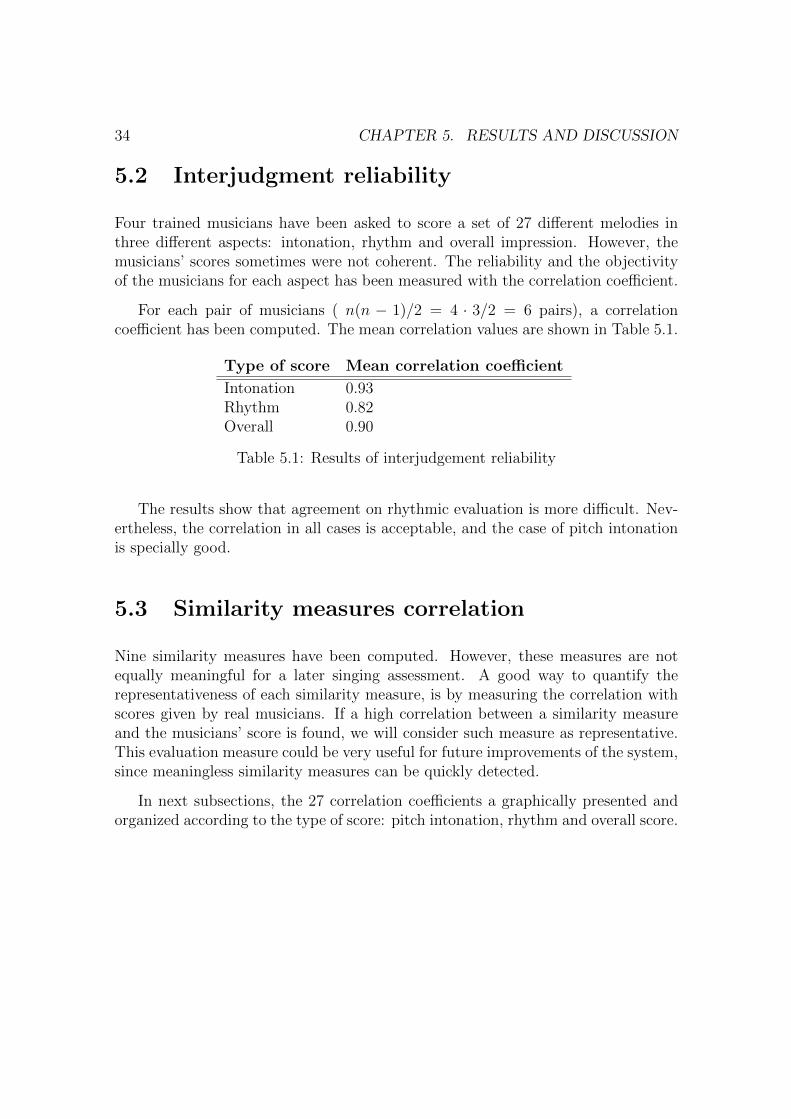
5.2 Interjudgment reliability
Four trained musicians have been asked to score a set of 27 different melodies inthree different aspects: intonation, rhythm and overall impression. However, themusicians’ scores sometimes were not coherent. The reliability and the objectivityof the musicians for each aspect has been measured with the correlation coefficient.
For each pair of musicians ( n(n − 1)/2 = 4 · 3/2 = 6 pairs), a correlationcoefficient has been computed. The mean correlation values are shown in Table 5.1.
Type of score Mean correlation coefficient
Intonation 0.93Rhythm 0.82Overall 0.90
Table 5.1: Results of interjudgement reliability
The results show that agreement on rhythmic evaluation is more difficult. Nev-ertheless, the correlation in all cases is acceptable, and the case of pitch intonationis specially good.
5.3 Similarity measures correlation
Nine similarity measures have been computed. However, these measures are notequally meaningful for a later singing assessment. A good way to quantify therepresentativeness of each similarity measure, is by measuring the correlation withscores given by real musicians. If a high correlation between a similarity measureand the musicians’ score is found, we will consider such measure as representative.This evaluation measure could be very useful for future improvements of the system,since meaningless similarity measures can be quickly detected.
In next subsections, the 27 correlation coefficients a graphically presented andorganized according to the type of score: pitch intonation, rhythm and overall score.
5.3. SIMILARITY MEASURES CORRELATION 35
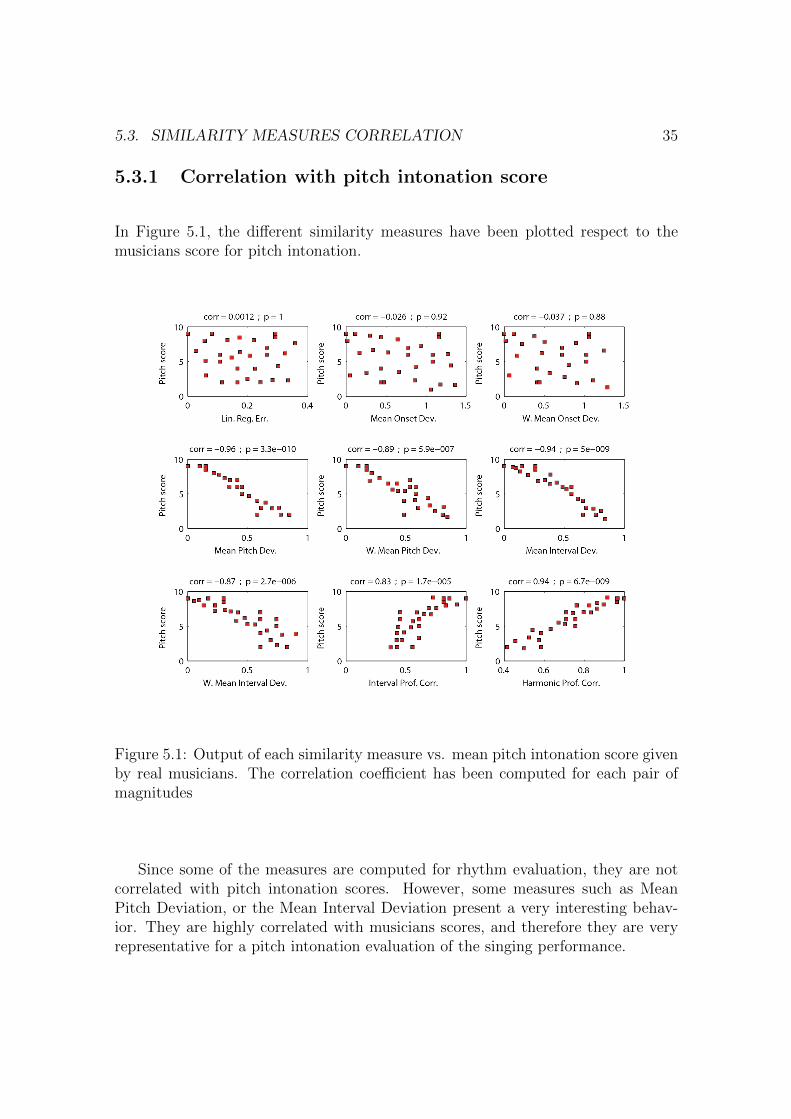
5.3.1 Correlation with pitch intonation score
In Figure 5.1, the different similarity measures have been plotted respect to themusicians score for pitch intonation.
Figure 5.1: Output of each similarity measure vs. mean pitch intonation score givenby real musicians. The correlation coefficient has been computed for each pair ofmagnitudes
Since some of the measures are computed for rhythm evaluation, they are notcorrelated with pitch intonation scores. However, some measures such as MeanPitch Deviation, or the Mean Interval Deviation present a very interesting behav-ior. They are highly correlated with musicians scores, and therefore they are veryrepresentative for a pitch intonation evaluation of the singing performance.
36 CHAPTER 5. RESULTS AND DISCUSSION
5.3.2 Correlation with rhythm score
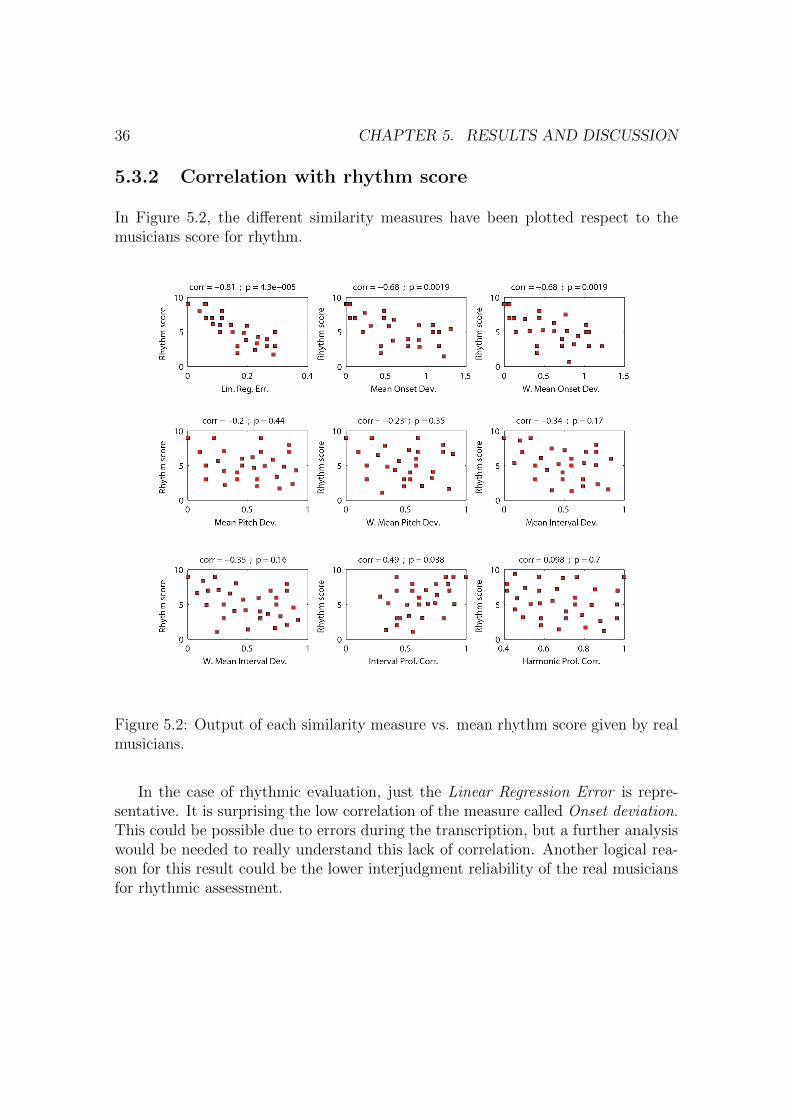
In Figure 5.2, the different similarity measures have been plotted respect to themusicians score for rhythm.
Figure 5.2: Output of each similarity measure vs. mean rhythm score given by realmusicians.
In the case of rhythmic evaluation, just the Linear Regression Error is repre-sentative. It is surprising the low correlation of the measure called Onset deviation.This could be possible due to errors during the transcription, but a further analysiswould be needed to really understand this lack of correlation. Another logical rea-son for this result could be the lower interjudgment reliability of the real musiciansfor rhythmic assessment.
5.3. SIMILARITY MEASURES CORRELATION 37
5.3.3 Correlation with overall score
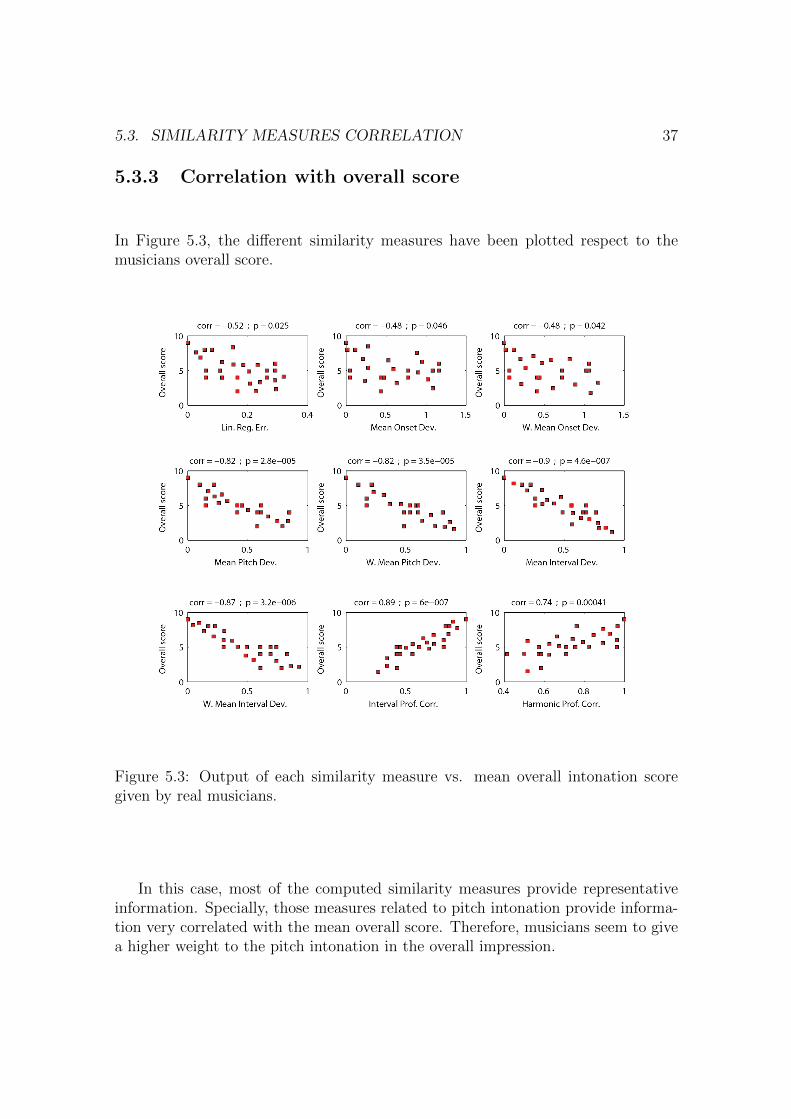
In Figure 5.3, the different similarity measures have been plotted respect to themusicians overall score.
Figure 5.3: Output of each similarity measure vs. mean overall intonation scoregiven by real musicians.
In this case, most of the computed similarity measures provide representativeinformation. Specially, those measures related to pitch intonation provide informa-tion very correlated with the mean overall score. Therefore, musicians seem to givea higher weight to the pitch intonation in the overall impression.
38 CHAPTER 5. RESULTS AND DISCUSSION
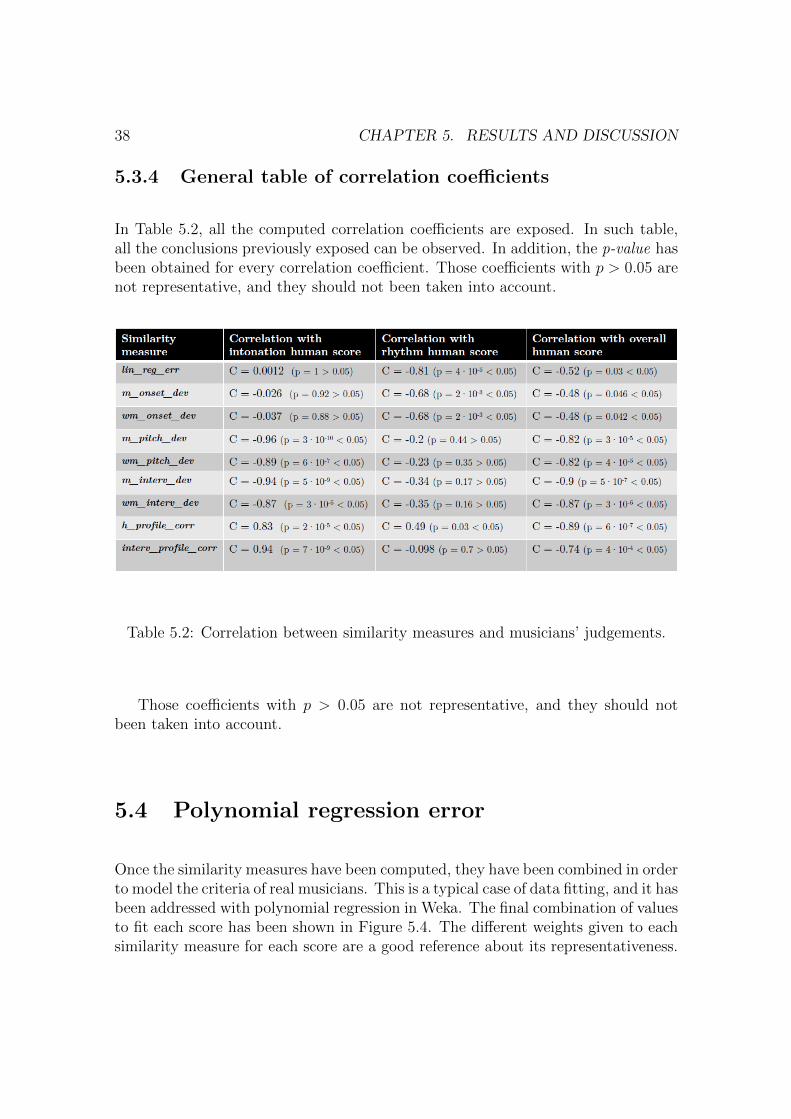
5.3.4 General table of correlation coefficients
In Table 5.2, all the computed correlation coefficients are exposed. In such table,all the conclusions previously exposed can be observed. In addition, the p-value hasbeen obtained for every correlation coefficient. Those coefficients with p > 0.05 arenot representative, and they should not been taken into account.
Table 5.2: Correlation between similarity measures and musicians’ judgements.
Those coefficients with p > 0.05 are not representative, and they should notbeen taken into account.
5.4 Polynomial regression error
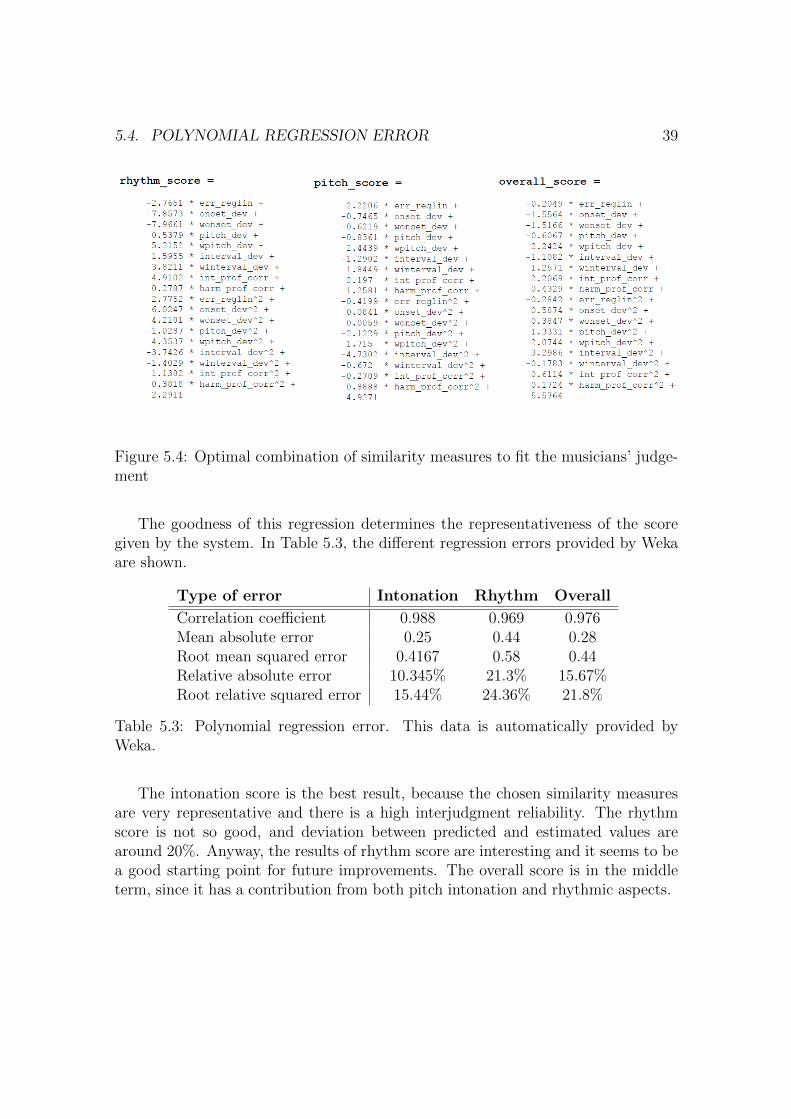
Once the similarity measures have been computed, they have been combined in orderto model the criteria of real musicians. This is a typical case of data fitting, and it hasbeen addressed with polynomial regression in Weka. The final combination of valuesto fit each score has been shown in Figure 5.4. The different weights given to eachsimilarity measure for each score are a good reference about its representativeness.
5.4. POLYNOMIAL REGRESSION ERROR 39
Figure 5.4: Optimal combination of similarity measures to fit the musicians’ judge-ment
The goodness of this regression determines the representativeness of the scoregiven by the system. In Table 5.3, the different regression errors provided by Wekaare shown.
Type of error Intonation Rhythm Overall
Correlation coefficient 0.988 0.969 0.976Mean absolute error 0.25 0.44 0.28Root mean squared error 0.4167 0.58 0.44Relative absolute error 10.345% 21.3% 15.67%Root relative squared error 15.44% 24.36% 21.8%
Table 5.3: Polynomial regression error. This data is automatically provided byWeka.
The intonation score is the best result, because the chosen similarity measuresare very representative and there is a high interjudgment reliability. The rhythmscore is not so good, and deviation between predicted and estimated values arearound 20%. Anyway, the results of rhythm score are interesting and it seems to bea good starting point for future improvements. The overall score is in the middleterm, since it has a contribution from both pitch intonation and rhythmic aspects.

40 CHAPTER 5. RESULTS AND DISCUSSION
Chapter 6
Conclusions
In this master thesis, a method for automatic assessment of singing is proposed.This method is based on a similarity measure between the user’s performance anda reference melody. Such reference melody is a recording from a singing teacher, asthe ideal performance that the student should reach in terms of pitch and rhythmaccuracy. The results of the different similarity measures have been combined inorder to fit the judgement of real musicians. Such fitting has been performed throughpolynomial regression in the Weka environment (Hall et al., 2009). A novel singingtranscription algorithm has been also implemented in order to allow note-to-notesimilarity measures. This algorithm is able to identify voiced segments and performa pitch-based note segmentation. In addition, a score alignment algorithm hasbeen included to properly compare both user and reference melodies when rhythmicdeviations are present. It is based on dynamic time warping over the pitch curve(with some constraints). Such score alignment has been also used as a similaritymeasure, since rhythmic deviations can be directly extracted from it. The evaluationmethodology is based on a dataset elaborated with randomly modified versions ofthe reference melodies. These manipulations have been performed with a pitchshifting / time stretching algorithm specially implemented for such purpose. Theresults after evaluation show that the chosen similarity measures are a good modelof the criteria of real musicians, especially for the case of pitch intonation evaluation.
6.1 Contributions
According to the goals defined in Section 1.2, the contributions of the present studyinclude:
41
42 CHAPTER 6. CONCLUSIONS
• State-of-the-art in the most relevant fields for automatic performance assess-ment, with the spotlight on the case of singing voice.
• Generic system for automatic performance assessment. It is flexible and it canbe easily extended to more complicated features, such as vibrato or dynamics.
• Novel algorithm for singing transcription based on a pitch-based note segmen-tation with a hysteresis cycle in pitch and time. It allows the note segmen-tation to be robust to unstable singing styles (appropriate for children andbeginners).
• Set of similarity measures specifically designed for a later evaluation of thesinging performance. They are complemented with a score alignment algo-rithm to deal with rhythmic misalignments.
• Dataset for singing evaluation based on random pitch shifting and time stretch-ing over a reference melody.
• Algorithm based on the harmonic-plus-stochastic model for pitch shifting /time stretching of singing voice.
• Detailed evaluation of the system and discussion of the results.
6.2 Future work
In this section, the points in which the systems could be improved in near futureare exposed.
• A real-time implementation of the system is proposed for future work. Visualfeedback in real-time has been proven to improve the learning process forsinging voice (Wilson et al., 2007). New causal similarity measures should beincluded for a real-time comparison between user’s performance and referencemelody. In such case, the final score would not be a number, but a curve alongtime.
• Rhythmic evaluation of the singing voice does not offer as good results as pitchintonation evaluation. A further research should be needed to find the realcause of this. Current similarity measures may be adjusted, and new rhythmicsimilarity measures could be included (currently there are only three).
• The dataset could be increased in number of reference melodies and musicians.This would serve to a better and more generic evaluation of the system.
6.2. FUTURE WORK 43
• Some other aspects apart from pitch and rhythm could be included: vibrato,dynamics, etc. New descriptors and similarity measures should be imple-mented, but the schema of the developed system is generic enough to remainthe same.

44 CHAPTER 6. CONCLUSIONS
Bibliography
Aloupis, G., Fevens, T., Langerman, S., Matsui, T., Mesa, A., Nunez, Y., Rap-paport, D., and Toussaint, G. (2003). Computing a Geometric Measure of theSimilarity Between two Melodies. Science, pages 11–14.
Anan, Y., Hatano, K., Bannai, H., and Takeda, M. (2011). Music Genre Classifica-tion using Similarity Functions. Learning, 56(Ismir):693–698.
Bello, J., Daudet, L., Abdallah, S., Duxbury, C., Davies, M., and Sandler, M.(2005). A tutorial on onset detection in music signals. IEEE Transactions onSpeech and Audio Processing, 13(5):1035–1047.
Bergee, M. J. (2003). Faculty Interjudge Reliability of Music Performance Evalua-tion. Journal of Research in Music Education, 51(2):137.
Cano, P., Loscos, A., and Bonada, J. (1999). Score-Performance Matching usingHMMs. In Proceedings of the International Computer Music Conference ICMC,volume 1, pages 441–444. Citeseer.
De Cheveigne, A. and Kawahara, H. (2002). YIN, a fundamental frequency es-timator for speech and music. Journal of the Acoustical Society of America,111(4):1917.
Dittmar, C., Großmann, H., Cano, E., Grollmisch, S., Lukashevich, H. M., andAbeßer, J. (2010). Songs2see and globalmusic2one: Two applied research projectsin music information retrieval at fraunhofer idmt. In Ystad, S., Aramaki, M.,Kronland-Martinet, R., and Jensen, K., editors, CMMR, volume 6684 of LectureNotes in Computer Science, pages 259–272. Springer.
Dixon, S. and Widmer, G. (2005). MATCH: A Music Alignment Tool Chest. InReiss, J. D. and Wiggins, G. A., editors, Proc ISMIR London GB, number Ismir,pages 492–497. University of London.
Ekholm, E., Papagiannis, G. C., and Chagnon, F. P. (1998). Relating objectivemeasurements to expert evaluation of voice quality in Western classical singing:
45
46 BIBLIOGRAPHY
critical perceptual parameters. Journal of voice official journal of the Voice Foun-dation, 12(2):182–196.
Ellis, D. (2003). Dynamic Time Warp ( DTW ) in Matlab. Web resource available:http://www.ee.columbia.edu/ dpwe/resources/matlab/dtw/.
Gomez, E. (2006). Tonal Description of Music Audio Signals. PhD thesis, UniversityPompeu Fabra, Barcelona, Spain.
Gomez, E., Klapuri, A., and Meudic, B. (2003). Melody Description and Extractionin the Context of Music Content Processing. Journal of New Music Research,32(1):23–40.
Griffiths, N. and Davidson, J. (2006). The effects of concert dress and physicalappearance on perceptions of female solo performers. In 9th International Con-ference on Music Perception and Cognition, pages 1723–1726.
Hall, M., Frank, E., Holmes, G., Pfahringer, B., Reutemann, P., and Witten, I. H.(2009). The weka data mining software: an update. SIGKDD Explor. Newsl.,11(1):10–18.
Howard, D. M., Welch, G., Brereton, J., Himonides, E., Decosta, M., Williams, J.,and Howard, A. (2004). WinSingad: a real-time display for the singing studio.Logopedics Phoniatrics Vocology, 29(3):135–144.
Kaprykowsky, H. and Rodet, X. (2006). Globally Optimal Short-Time DynamicTime Warping, Application to Score to Audio Alignment. 2006 IEEE Interna-tional Conference on Acoustics Speech and Signal Processing Proceedings, 5:249–252.
Klapuri, A. (2003). Multiple fundamental frequency estimation based on harmonic-ity and spectral smoothness. IEEE Transactions on Speech and Audio Processing,pages 804–816.
Klapuri, A. and Davy, M. (2006). Signal Processing Methods for Music Transcrip-tion. Springer.
Krumhansl, C. L. (1990). Cognitive foundations of musical pitch, volume 17. OxfordUniversity Press.
Maher, R. C. and Beauchamp, J. W. (1994). Fundamental frequency estimation ofmusical signals using a two-way mismatch procedure. Journal of the AcousticalSociety of America, 95(4):2254–2263.
BIBLIOGRAPHY 47
Mayor, O., Bonada, J., and Loscos, A. (2006). The singing tutor: Expressioncategorization and segmentation of the singing voice. Proceedings of the AES121st Convention.
Mayor, Oscar., Bonada, Jordi., Loscos, A. (2009). Performance analysis and scoringof the singing voice. Proc 35th AES Intl Conf London UK, pages 1–7.
McAdams, S. and Matzkin, D. (2001). Similarity, invariance, and musical variation.Annals Of The New York Academy Of Sciences, 930(1):62–76.
McNab, R. J., Smith, L. A., and Witten, I. H. (1996). Signal Processing for MelodyTranscription. Proceedings of the 19th Australasian Computer Science Confer-ence, 18(4):301–307.
Melodyne (2010). Melodyne Editor by Celemony. http://www.celemony.com.
MIREX (2012). Music Information Retrieval Evaluation eXchange contest, retrievedfrom www.music-ir.org/mirex.
Mullensiefen, D. and Frieler, K. (2004). Cognitive Adequacy in the Measurementof Melodic Similarity: Algorithmic vs. Human Judgments. Computing in Musi-cology, 13(2003):147–176.
Mullensiefen, D. and Frieler, K. (2006). The SIMILE algorithms documentation.
Pardo, B., Shifrin, J., and Birmingham, W. (2004). Name that tune: A pilot studyin finding a melody from a sung query. Journal of the American Society forInformation Science and Technology, 55(4):283–300.
Poliner, G. E., Ellis, D. P. W., Ehmann, A. F., Gomez, E., Streich, S., and Ong, B.(2007). Melody Transcription From Music Audio: Approaches and Evaluation.Ieee Transactions On Audio Speech And Language Processing, 15(4):1247–1256.
Rossignol, S., Depalle, P., Soumagne, J., Rodet, X., and Collette, J.-L. (1999).Vibrato: detection, estimation, extraction, modification. In Notes, volume 99,pages 3–6. Citeseer.
Rossiter, D. and Howard, D. M. (1996). ALBERT: a real-time visual feedbackcomputer tool for professional vocal development. Journal of voice official journalof the Voice Foundation, 10(4):321–336.
Ryyn, M. P., Klapuri, A. P., Box, P. O., and Tampere, F. (2004). Modelling of NoteEvents for Singing Transcription. In Signal Processing. ISCA, Citeseer.
48 BIBLIOGRAPHY
Serra, X. (1989). A System for Sound Analysis/Transformation/Synthesis based ona Deterministic plus Stochastic Decomposition. PhD thesis, Stanford University.
Sing&See (2004). Sing&See by CantOvation Ltd. Website:http://www.singandsee.com.
Singstar (2004). Singstar game, by Sony Computer Entertainment Europe.http://www.singstar.com/.
Skore (2008). Skore by Barcelona Music&Audio Technologies (BMAT). Retrievedfrom http://www.bmat.com/cas/productos/skore/index.php.
Viitaniemi, T., Klapuri, A., and Eronen, A. (2003). A probabilistic model for thetranscription of single-voice melodies. In Proceedings of the 2003 Finnish SignalProcessing Symposium FINSIG’03, number 20, pages 59–63. Tampere Universityof Technology, Citeseer.
Wapnick, J. and Ekholm, E. (1997). Expert consensus in solo voice performanceevaluation. Journal of voice official journal of the Voice Foundation, 11(4):429–436.
Welch, G. F. (1994). The assessment of singing. Psychology of Music, 22(1):3–19.
Welch, G. F., Rush, C., and Howard, D. M. (1988). The SINGAD (SINGing Assess-ment and Development) system: First applications in the classroom. Proceedingsof the Institute of Acoustics, 10(2):179–185.
Wilson, P. H., Lee, K., Callaghan, J., and Thorpe, C. W. (2007). Learning tosing in tune: Does real-time visual feedback help? CIM07 3rd Conference onInterdisciplinary Musicology Tallinn Estonia, 2(1):15–19.