Embed Size (px)
Citation preview

Automatic tuning of MST segmentation of mammograms
for registration and mass detection algorithms
Mariusz Bajger, Fei Ma, Murk J. Bottema
School of Computer Science, Engineering and Mathematics
Flinders University, Adelaide, SA 5001, Australia
{mbajger, ma029, murkb}@csem.flinders.edu.au
Abstract.
In this presentation, a technique utilizing an entropy measure is developed for automatically
tuning the segmentation of screening mammograms by minimum spanning trees (MST).
The lack of such technique has been a major obstacle in previous work to segment mammograms
for registration and applying mass detection algorithms.
The proposed method is tested on two sets of mammograms: a set of 55 mammograms chosen
from a publicly available Mini-MIAS database, and a set of 37 mammograms selected from a
local database.
The method performance is evaluated in conjunction with three different preprocessing filters:
gaussian, anisotropic and neutrosophic.
Results show that the automatic tuning has the potential to produce state-of-the art
segmentation of mass-like objects in mammograms.
The neutrosophic filtering provided the best performance.

Introduction.
Anomalies in mammograms associated with cancer, especially those associated with early cancer,
often resemble normal tissue patterns.
This complicates the interpretation of mammograms for computer-aided diagnostic (CAD)
schemes as well as human readers.
The static resemblance between normal and diseased tissue may be mitigated through bilateral
comparison or, when available, temporal comparison.
Human observers are often able to perform such comparisons very well, but computer algorithms
for this task are problematic.
Central to CAD comparison of mammograms is image registration.
In order to decide if there are new anomalies, evidence of changes in appearance of anomalies, or
if patterns between the left and right breast are different, algorithms must have the ability to
associate objects between images.
Introduction – cont.
The registration process is increasingly important for the detection of pathologies at early stages
[10].
[10] K. Marias, C. Behrenbruch, S. Parbhoo, A. Seifalian, and M. Brady. A registration framework for the
comparison of mammogram sequences. IEEE Trans. On Medical Imaging, 24(6):782–790, June 2005.
Two general classes of image registration techniques are local matching of pixel intensity values
and the use of landmarks.
Many registration schemes use a combination of both these approaches.
However, neither of these techniques are particularly well suited for registration of
mammograms.
The matching of local pixel intensities is compromised by the fact that the same object in two
views of the same breast may be represented by very different sets of intensity values.
This is due, in turn, to the contortion of breast tissue during image acquisition, differences in
exposure and positioning as well as normal changes of surrounding breast tissue over time.

Introduction – cont.
Landmarks in mammograms may include the border of the pectoral muscle, the nipple, and the
breast boundary [10].
[10] K. Marias, C. Behrenbruch, S. Parbhoo, A. Seifalian, and M. Brady. A registration framework for the
comparison of mammogram sequences. IEEE Trans. On Medical Imaging, 24(6):782–790, June 2005.
The nipple is often difficult to detect and the breast boundary is not entirely invariant between
different images of the same breast due to the inconsistencies of image acquisition mentioned
above.
The pectoral muscle boundary does not change substantially over time, is not subject to distortion
at acquisition and is usually easy to delineate near the top of medio lateral views.
However, the boundary tends to fade below the middle of the image and is absent in cranial
caudal views.
In addition, these landmarks are not generally the objects of interest in screening mammograms;
at best they serve as intermediates toward registration and subsequent detection or
characterization of anomalies associated with disease.

Introduction – cont.
Thus conclusions regarding the disease state of tissue requires first the accurate detection of the
landmarks, then correct registration and finally correct detection of the anomalies of interest.
This paper reports a key step in replacing registration of mammograms based on general
landmarks by registration of the objects of interest themselves.
Specifically, the goal is to segment mass-like regions in the mammogram for the future purpose of
studying the similarity and differences between mass-like objects in different views (say from
different screening visits) of the same breast.
This context is important for formulating the exact objective of the segmentation and for
evaluating the performance.
Numerous algorithms have appeared for automatic detection of masses in screening
mammograms.

Remarks.
Generally, the steps are to find the boundary of the anomaly as accurately as possible, measure
shape, size, contrast, and texture features within the anomaly, around the anomaly or on the
border and classify the objects as a mass or non-mass or as a malignant or benign mass.
For these schemes, the boundary must be such as to maximally capture differences in the
measured features inside and outside (or on the border of) the anomaly.
Normally, an assumption is made that such a boundary coincides with the visually apparent
boundary.
In contrast, the objective here is to identify objects that could possibly be masses and identify the
general shape, size, contrast, location, etc. only.
The exact boundary is not needed and is not even desirable since the appearance of the object in
another view of the same breast may not be the same.

Remarks – cont.
For this reason, the performance of the segmentation should not be measured by comparing
boundaries of objects with ”true” boundaries drawn by an expert.
The ultimate measure of segmentation performance is the ability of the final scheme to detect
breast cancer, but this is an unrealizable criterion during the development stage.
The approach taken here is to compare segmented regions with general information of anomalies
provided by an expert.
Instead of a carefully drawn boundary, the expert information consists of a center point indicating
the location of the anomaly and a circle or a box that roughly indicates the size.
The segmentation method used is a graph-theory method based on minimum spanning trees
(MST) [2].
[2] P. F. Felzenszwalb and D. P. Huttenlocher. Efficient graph-based image segmentation. Int. J. Comput.
Vision, 59(2):167–181, 2004.
Remarks – cont.
MST segmentation is attractive in this setting for a number of reasons.
First, methods based on graphs are able to combine both global and local image information in the
segementation process and, among graph based methods, the MST is fairly fast.
Second, previous work indicates that this method is quite robust to shifts, rotations and warping
of the type expected when comparing sequential screening mammograms [8].
[8] F. Ma, M. Bajger, and M. J. Bottema. Robustness of two methods for segmenting salient features in
screening mammograms. In Proc. of the 9th Conf. on Digital Image Computing Techniques and Applications
(DICTA2007), pages 112–117, Adelaide, 2007.
Third, applying the MST algorithm requires choosing only one parameter.
This is a distinct advantage over methods that rely on a larger collection of parameters that must
be chosen at hoc for each class of images or for each individual image.
Remarks – cont.
The single parameter needed to run MST is denoted by k and controls the granularity of the
resulting segmentation [2], [9].
[2] P. F. Felzenszwalb and D. P. Huttenlocher. Efficient graph-based image segmentation. Int. J. Comput.
Vision, 59(2):167–181, 2004.
[9] F. Ma, M. Bajger, J. P. Slavotinek, and M. J. Bottema. Two graph theory based image segmentation
methods for identifying pectoral muscle in mammograms. Pattern Recognition, 40:2592–2602, 2007.
Because k has a predictable effect on the nature of the segmentation, it can be used to tune the
process optimaly.
This approach was used in [15] to detect optimal accurate boundaries of the pectoral muscle line
in mammograms using the image entropy measure introduced in [18].
[15] H. Susukida, F. Ma, and M. Bajger. Automatic tuning of a graph-based image segmentation method for
digital mammography applications. In Proc. of the 5th IEEE Intern. Symp. on Biomedical Imaging (ISBI
2008), pages 89–92, Paris, France, May 14-17 2008.
[18] H. Zhang, J. E. Fritts, and S. A. Goldman. An entropy-based objective evaluation method for image
segmentation. In Proc. of SPIE: Storage and Retrieval Methods and Applications for Multimedia, volume
5307, pages 38–49, 2004.
Remarks – cont.
In this presentation, the granularity parameter, k, is used to optimize the MST algorithm for the
purpose of identifying mass-like regions.
The motivation for this approach comes from the variety of breasts encountered in screening
mammography.
Some breasts appear in mammograms as essentially featureless with little dense tissue and very
few features which could be interpreted as mass-like.
Other images, sometimes called ”busy breasts”, comprise a variety of intensity variation and
many mass-like regions.
In each case, better segmentation results if a good ballance is achieved between the use of overall
variation of image intensity and local variation associated with mass-like regions.
This motivates measuring the criterion for optimal segmentation as a balance between overall
and local image entropy.

Remarks – cont.
Since MST segmentation is very sensitive to noise, a denoising filter has to be used before the
segmentation process is performed.
In what follows this problem is addressed in depth by quantifying the results of segmentation
after preprocessing by a gausian filter (most often used in the literature for MST segmentation),
an anistropic filter ([11]), and a very new, neutrosophic denoising method ([4]).
[4] Y. Guo and H. D. Cheng. New neutrosophic approach to image segmentation. Pattern Recognition,
42:587–595, 2009.
[11] P. Perona and J. Malik. Scale-space and edge detection using anisotropic diffusion. IEEE Pattern Anal.
Machine Intell., 12:629–639, 1990.
The MST segmentation method was proposed in [2] and was adapted for mammography in [9].
[2] P. F. Felzenszwalb and D. P. Huttenlocher. Efficient graph-based image segmentation. Int. J. Comput.
Vision, 59(2):167–181, 2004.
[9] F. Ma, M. Bajger, J. P. Slavotinek, and M. J. Bottema. Two graph theory based image segmentation
methods for identifying pectoral muscle in mammograms. Pattern Recognition, 40:2592–2602, 2007.
The key structures needed for this application are presented in the next slides.
MST segmentation.
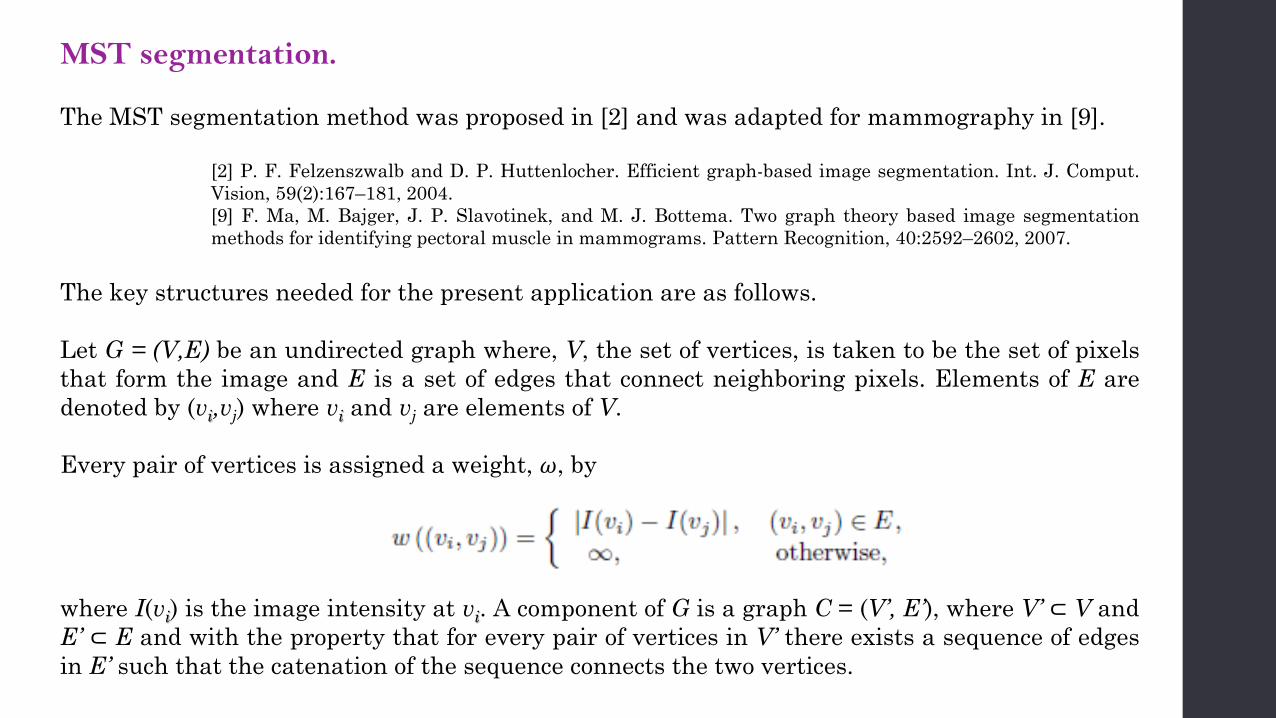
The MST segmentation method was proposed in [2] and was adapted for mammography in [9].
[2] P. F. Felzenszwalb and D. P. Huttenlocher. Efficient graph-based image segmentation. Int. J. Comput.
Vision, 59(2):167–181, 2004.
[9] F. Ma, M. Bajger, J. P. Slavotinek, and M. J. Bottema. Two graph theory based image segmentation
methods for identifying pectoral muscle in mammograms. Pattern Recognition, 40:2592–2602, 2007.
The key structures needed for the present application are as follows.
Let G = (V,E) be an undirected graph where, V, the set of vertices, is taken to be the set of pixels
that form the image and E is a set of edges that connect neighboring pixels. Elements of E are
denoted by (vi,vj) where vi and vj are elements of V.
Every pair of vertices is assigned a weight, 𝜔, by
where I(vi) is the image intensity at vi. A component of G is a graph C = (V’, E’), where V’ ⊂ V and
E’ ⊂ E and with the property that for every pair of vertices in V’ there exists a sequence of edges
in E’ such that the catenation of the sequence connects the two vertices.
MST segmentation - cont.
A tree that spans a component C and has a minimum total weight is called a minimum spanning
tree of C (MST(C)).
A segmentation of G is a collection of components Ck = (Vk, Ek) such that ∪ Vk = V and Vi ∩ Vj = ∅for i ≠ j.
For a component C ∈ G and minimum spanning tree MST(C), the internal difference, Int(C), is
defined as the largest weight in MST(C).
For two components C1 and C2, their difference Diff(C1, C2) is defined as the minimum weight
connecting C1 and C2.
The MST algorithm builds a new graph H =(V, F).
Initially, F = F0 is the empty set, meaning that each vertex (pixel) is a component unto itself.
In subsequent iterations, components C1 and C2 are merged, meaning that C1 and C2 form a
single component, if – see eq. next slide

MST segmentation - cont.
where the threshold function τ is given by
|C| denotes the number of elements in C, and k is a constant.
The process terminates when no new mergers are allowed.
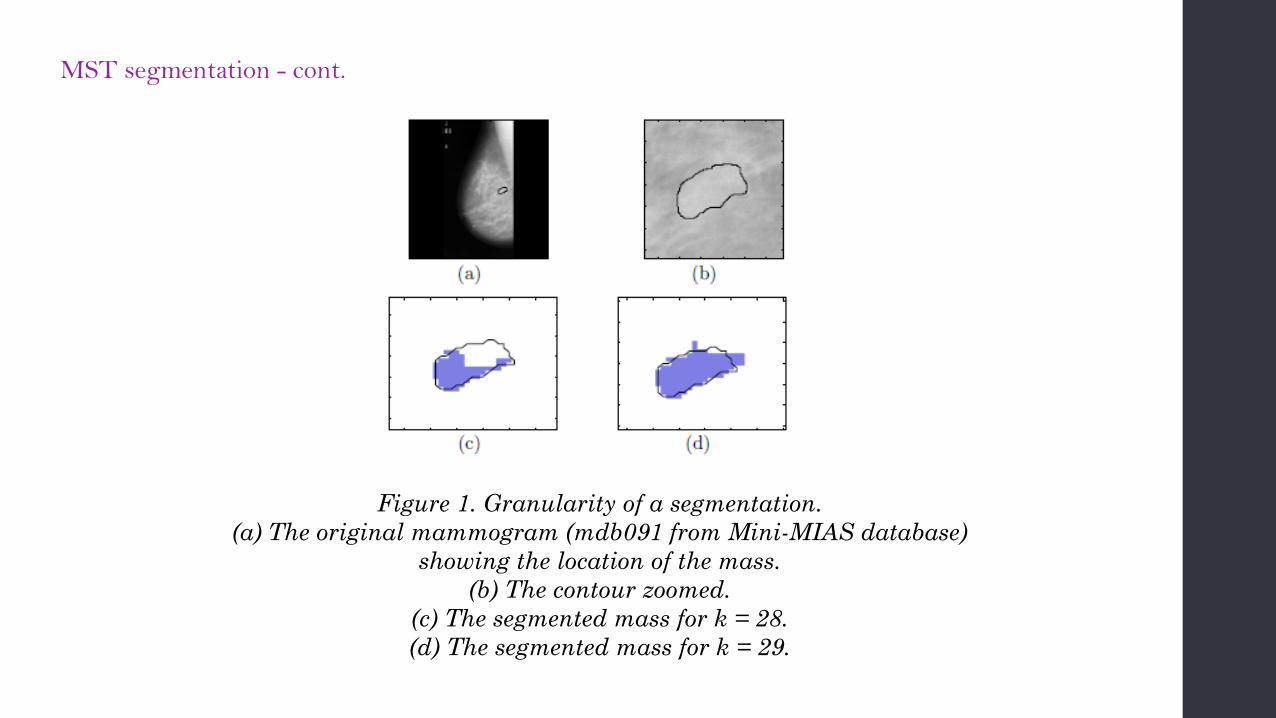
The constant k controls the granularity and hence the quality of the segmentation.
Even very close values of k may produce very different segmentations, as the Figure 1 next slide
shows.
In most applications of the MST algorithm, k is fixed empirically for a class of images with the
result that the granularity is far from optimal for some members of the class.
In this presentation, k is adjusted automatically for each image by optimizing the measure of
entropy described in the next section.
MST segmentation - cont.
Figure 1. Granularity of a segmentation.
(a) The original mammogram (mdb091 from Mini-MIAS database)
showing the location of the mass.
(b) The contour zoomed.
(c) The segmented mass for k = 28.
(d) The segmented mass for k = 29.
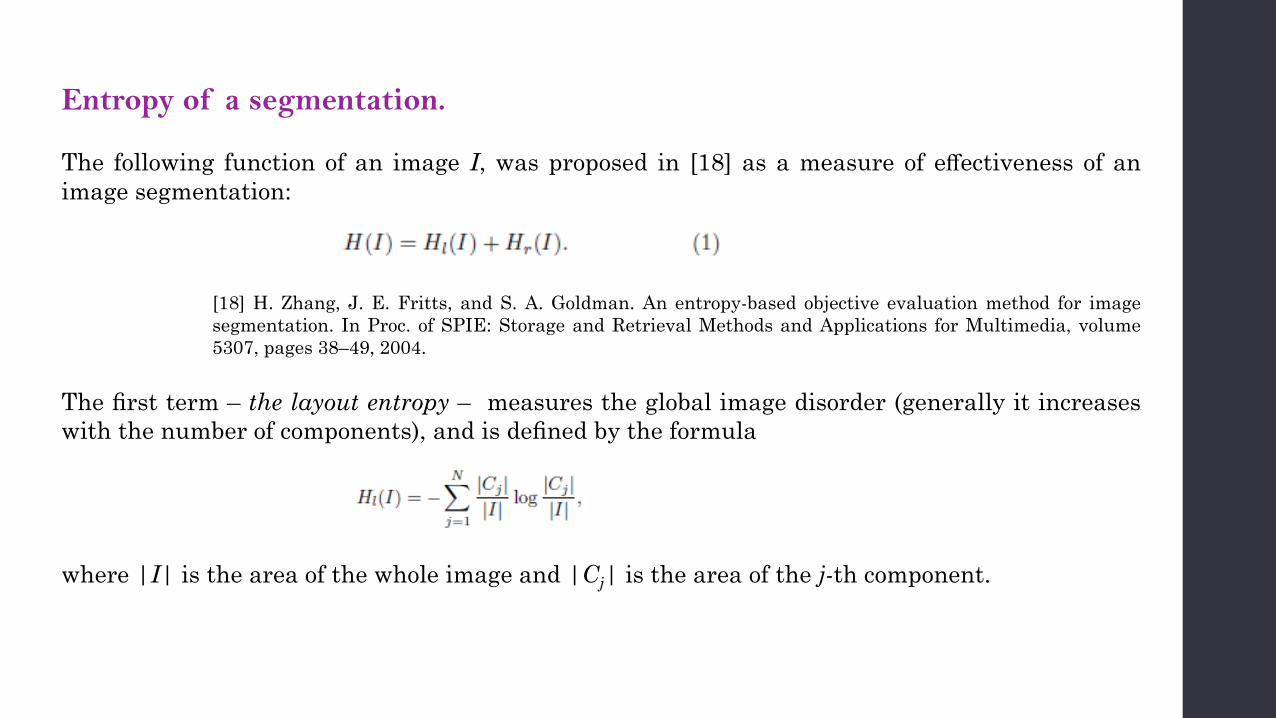
Entropy of a segmentation.
The following function of an image I, was proposed in [18] as a measure of effectiveness of an
image segmentation:
[18] H. Zhang, J. E. Fritts, and S. A. Goldman. An entropy-based objective evaluation method for image
segmentation. In Proc. of SPIE: Storage and Retrieval Methods and Applications for Multimedia, volume
5307, pages 38–49, 2004.
The first term – the layout entropy – measures the global image disorder (generally it increases
with the number of components), and is defined by the formula
where |I| is the area of the whole image and |Cj| is the area of the j-th component.
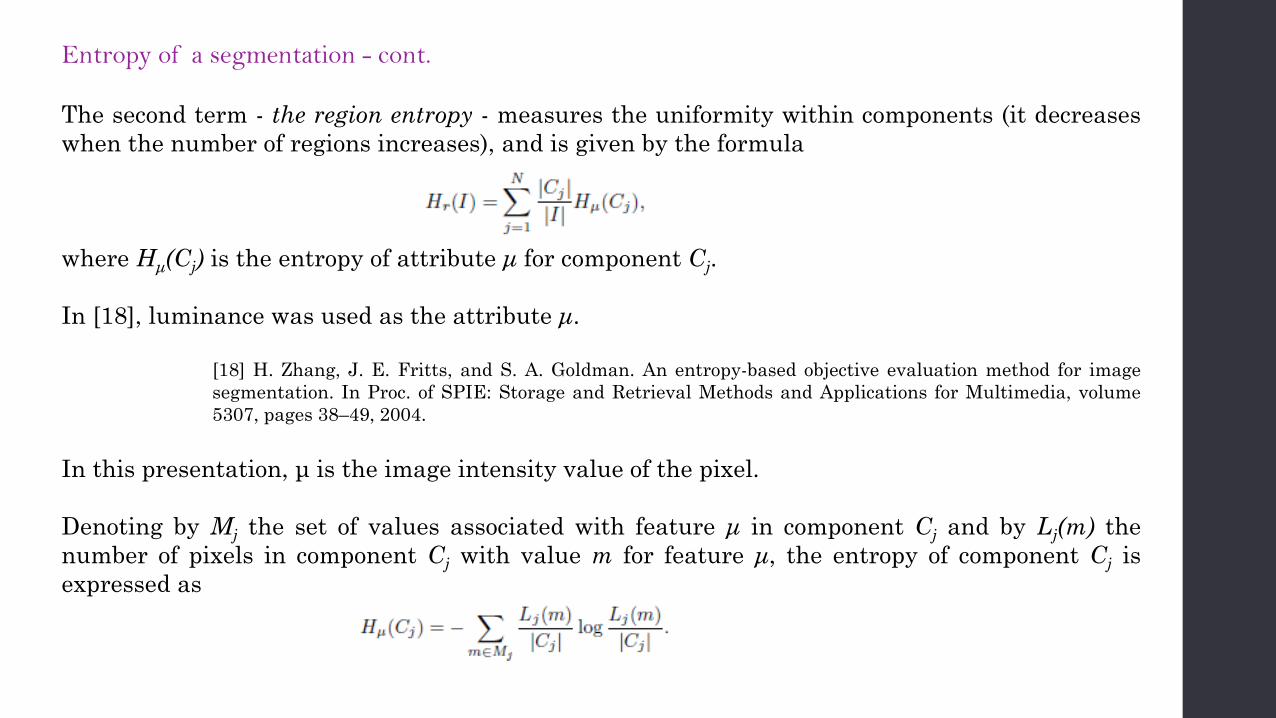
Entropy of a segmentation - cont.
The second term - the region entropy - measures the uniformity within components (it decreases
when the number of regions increases), and is given by the formula
where Hμ(Cj) is the entropy of attribute μ for component Cj.
In [18], luminance was used as the attribute μ.
[18] H. Zhang, J. E. Fritts, and S. A. Goldman. An entropy-based objective evaluation method for image
segmentation. In Proc. of SPIE: Storage and Retrieval Methods and Applications for Multimedia, volume
5307, pages 38–49, 2004.
In this presentation, μ is the image intensity value of the pixel.
Denoting by Mj the set of values associated with feature μ in component Cj and by Lj(m) the
number of pixels in component Cj with value m for feature μ, the entropy of component Cj is
expressed as
Neutrosophic image denoising.
The concept of neutrosophic image denoising was introduced in [3] and successfully applied to
segmentation of natural and synthetic images in [4].
[3] Y. Guo, H. Cheng, Y. Zhang, and W. Zhao. A new neutrosophic approach to image denoising. In
Proceedings of the 11th Joint Conference on Information Science, pages 1–6. Atlantis Press, 2008.
[4] Y. Guo and H. D. Cheng. New neutrosophic approach to image segmentation. Pattern Recognition,
42:587–595, 2009.
In [3] the neutrosophic filter (NS filter) was proposed for image denoising and a comparison with
the median and mean filter was reported.
[3] Y. Guo, H. Cheng, Y. Zhang, and W. Zhao. A new neutrosophic approach to image denoising. In
Proceedings of the 11th Joint Conference on Information Science, pages 1–6. Atlantis Press, 2008.
The NS filter outperformed the other filters when applied to images with different kinds and
levels of noise.
For convenience we briefly describe NS filtering.
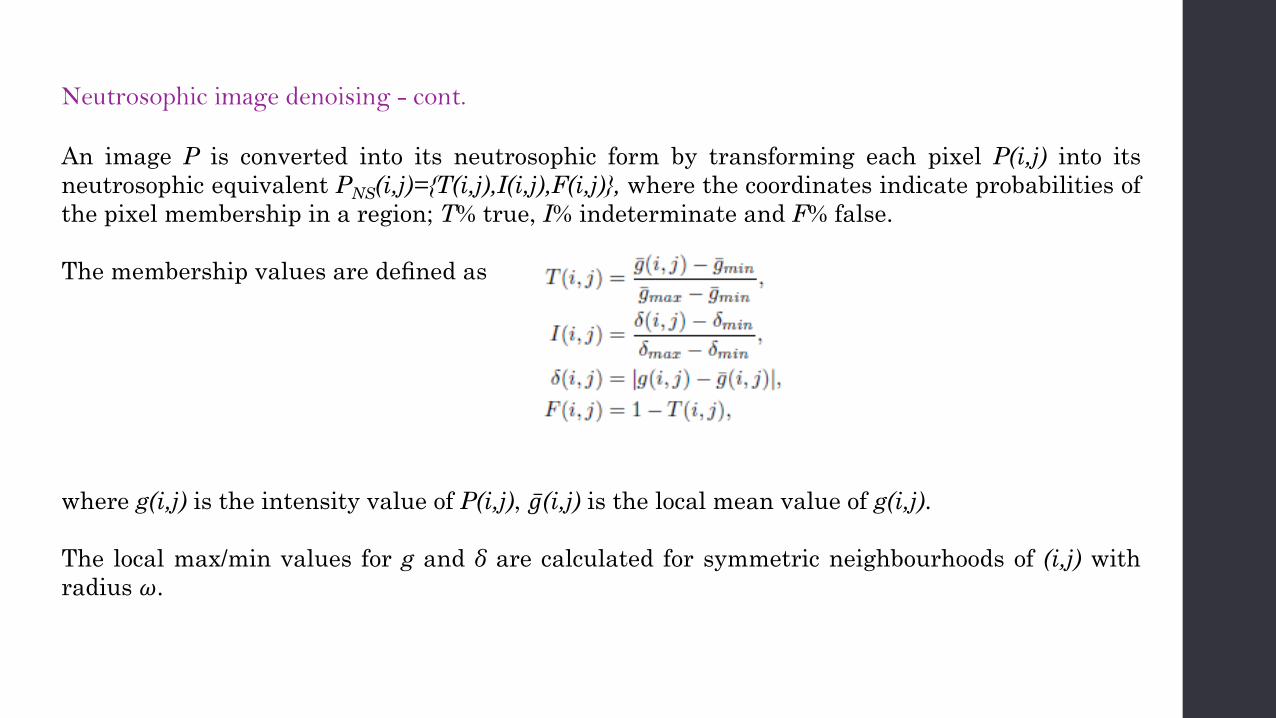
Neutrosophic image denoising - cont.
An image P is converted into its neutrosophic form by transforming each pixel P(i,j) into its
neutrosophic equivalent PNS(i,j)={T(i,j),I(i,j),F(i,j)}, where the coordinates indicate probabilities of
the pixel membership in a region; T% true, I% indeterminate and F% false.
The membership values are defined as
where g(i,j) is the intensity value of P(i,j), ҧ𝑔(i,j) is the local mean value of g(i,j).
The local max/min values for g and δ are calculated for symmetric neighbourhoods of (i,j) with
radius 𝜔.

Neutrosophic image denoising - cont.
Neutrosophic image denoising - cont.
The α-filtering is performed on the image until the relative entropy of the indeterminate set I is
smaller than a specified threshold.
In this study authors used
α = 0 .85 for all images,
𝜔 = 4, for Mini-MIAS images, and𝜔 = 6 for our local database.
The entropy thresholds were set to 10−3 and 5×10⁻⁶ for Mini-MIAS and the local set, respectively.
These values were determined empirically.
Databases.
Two mammographic databases were used to test the method: the publicly available and widely
used Mini-MIAS mammographic database [14], and a local database of mammograms.
[14] J. Suckling, J. Parker, D. Dance, S. Astley, I. Hutt, C. Boggis, I. Ricketts, E. Stamatakis, N. Cerneaz, S.
Kok, P. Taylor, D. Betal, and J. Savage. The mammographic images analysis society digital mammogram
database. Exerpta Medica, 1069:375–378, 1994.
The spatial resolution of Mini-MIAS images is 200 μm per pixel and the depth resolution is 8 bit.
All images in the database are of 1024x1024 pixels in size.
To reduce the computation time the images were subsampled by a factor of four to 256x256
pixels.
Thus the final pixel size for the images used in experiments was 800 μm.
Databases - cont.
Mammograms from the local database were digitized at 50 μm per pixel and 12 bit depth
resolution.
The images were subsampled by the factor of 8, so that the final pixels size was 400 μm.
A set of 55 mammograms was selected from the Mini-MIAS database and another set of 37
mammograms was taken from the local database.
The only criterion for selection was that at least one mass-like object was present and annotated
by a radiologist with expertise in mammography.

Method. Mass coverage ratio
The ultimate goal of this study is to provide a rigorous method of selecting automatically k value
which results in a usable segmentation of all mass regions.
Depending on the application ’usable’ may be as little as 40% of the mass area segmented
properly, if only detection is concerned, or 70% or more if also classification is involved.
However, it is critical that no mass-like object is missed, so the emphasis is more on being able to
obtain a minimum coverage of masses than being able to segment accurately most mass-like
objects but totally missing some of them.
To meet this goal an appropriate measure of the segmentation quality is necessary.
Authors adopt measure ℛ called the mass coverage ratio [7]. ℛ was computed for each mass-likeregion and each segmentation.
[7] M. Kupinski and M. L. Giger. Automated seeded lession segmentation on digital mammograms. IEEE
Transactions on Medical Imaging, 17(4):510–517, 1998.

Method. Mass coverage ratio – cont.
Since an exact representation of the mass-like region is not necessary and not even possible due
to undefined boundaries for masses, the subsequent processing includes the merging of
components if, in aggregate, they are more mass-like.
Accordingly, a suitable criterion for measuring the quality of the segmentation of mass-like
regions is to compute how well the union of all reasonable components which overlap the
annotated region fits the annotation.
By a reasonable component is meant a component with at least half of its area residing within the
annotated region.
Thus a component C is said to overlap the annotated region T if
The mass coverage ratio is then defined by
where A = ∪ Ci and the union is taken over components that overlap T.
Method. Mass coverage ratio – cont.
Since the MST segmentation parameter k roughly determines the area of the smallest component
in terms of numbers of pixels that can be retained, and circular objects having 3-5mm diameter
are most important mass candidates the appropriate range of k values can be estimated based on
the spatial resolution of images.
For Mini-MIAS mammograms, those objects have estimated area 27-34 pixels, while for images
from our local database the area ranges from 110-134 pixels.
Hence, the reasonable ranges for k were estimated as 27-34, for Mini-MIAS mammograms and
110-134, for mammograms from the local database.

Method. Noise reduction
Three methods for noise reduction were tested for use prior to MST segmentation:
an anisotropic filter
the symmetric Gaussian filter of size 6 (4 for Mini-MIAS images) with standard
deviation σ = 0.8, and
the neutrosophic filter described above.
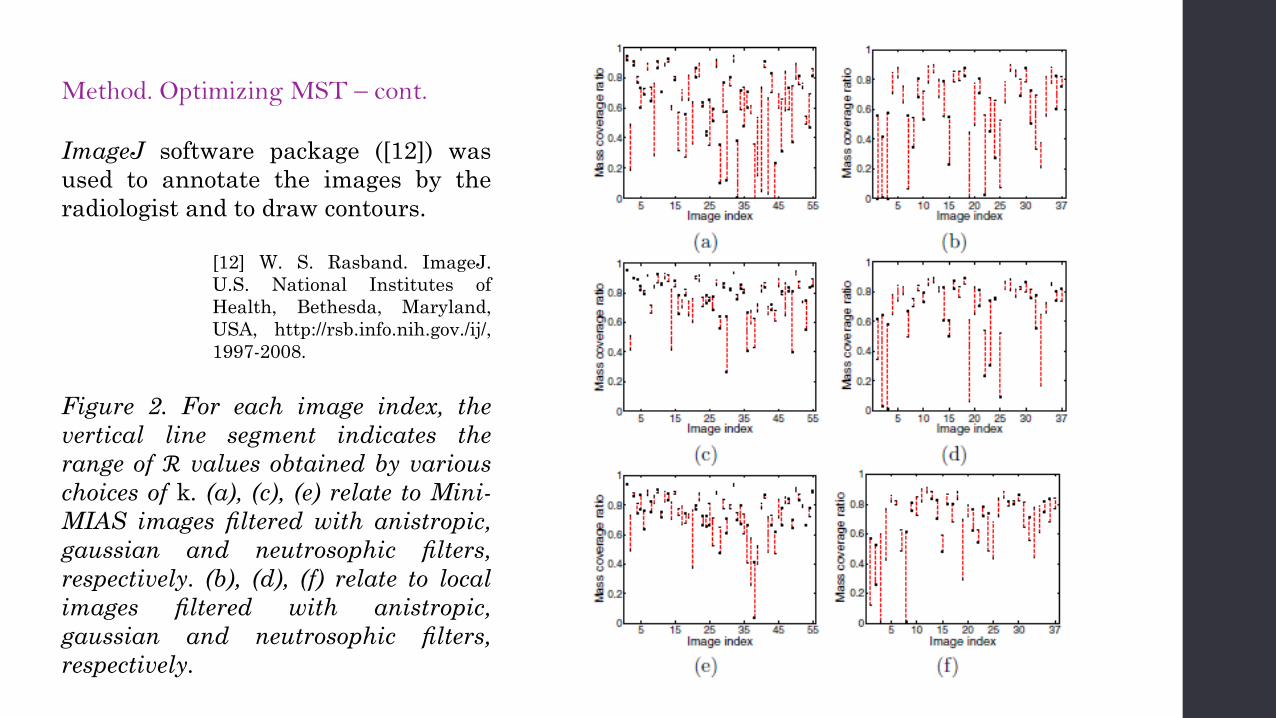
Figure 2 next slides shows the range of mass coverage ratio for each mass in each database,
obtained by varying k, after anistropic, gaussian and neutrosophic filtering. Regardless of the
kind of filter applied, one cannot generally expect that there is a single value of k producing high
ℛ values for each image.
The local set of mammograms used in this study is an example of a collection where no such
value exists. Gaussian and neutrosophic smoothing prior to segmentation reduced the range of ℛvalues substantially while anistropic filtering reduced the range less.
The graphs also show that for each image there exist values of k resulting in mass coverage ratio
value of 40% or higher. This observation motivated the search for an automatic method for
choosing an optimal value of k (in that it avoids disastrous mass coverage ratios) for each image.
Method. Optimizing MST
To determine optimal values of the parameter k the following algorithm was followed.
Every mammogram was segmented for the specified range of values of k as determined above.
For each value of k, the entropy of the segmentation was computed using the formula in [1].
[1] J. Cousty, M. Couprie, N. L., and G. Bertrand. Weighted fusion graphs: Merging properties and
watersheds. Discrete Applied Mathematics, 156:3011–3027, 2008.
The value of k resulting in the smallest entropy segmentation was selected as an optimal one.
In order to be able to quantify the results, approximate mass contours were drawn (within the
radiologist annotated areas) for each image.
A single contour was used for each Mini-MIAS image (drawn by one of the authors), while for the
more challenging local set of images two contours were drawn independently by the authors, and
both union and intersection of those contours were tested.
This compensates for subjective estimation of boundaries of difficult to draw contours.
Method. Optimizing MST – cont.
ImageJ software package ([12]) was
used to annotate the images by the
radiologist and to draw contours.
[12] W. S. Rasband. ImageJ.
U.S. National Institutes of
Health, Bethesda, Maryland,
USA, http://rsb.info.nih.gov./ij/,
1997-2008.
Figure 2. For each image index, the
vertical line segment indicates the
range of ℛ values obtained by various
choices of k. (a), (c), (e) relate to Mini-
MIAS images filtered with anistropic,
gaussian and neutrosophic filters,
respectively. (b), (d), (f) relate to local
images filtered with anistropic,
gaussian and neutrosophic filters,
respectively.
Results.
Table 1 next slide shows that all Mini-MIAS images were segmented successfully, that is, with ℛat least 40%, when neutrosophic filtering was applied.
Moreover, 69% of images were segmented with a very high ratio (at least 70%).
For gaussian filtering the numbers are comparable while for the anistropic filtering they are
significantly worse.
For images from our local database the ratios were obtained for both union and intersection of
two independently drawn contours by the authors, according to the radiologist annotations.
These are shown separately in Table 1. In all cases the superiority of neutrosophic filtering is
visible.
It allowed for about 50% reduction of number of potential failures (those less than 40%
segmented).
The results for the gaussian filtering were comparable, while the anistropic filtering produced
significantly worse outcomes.

Results – cont.
Table 1. Mass coverage ratio by range for the Mini-MIAS set for each of the three filters.
The first number gives the number of images falling into that range for some values of k. The
corresponding number for k value selected with our method (the optimal value) is shown in
brackets. Local database images were tested for the union and intersection of two contours drawn
by the authors according to the radiologist annotations.
Results – cont.
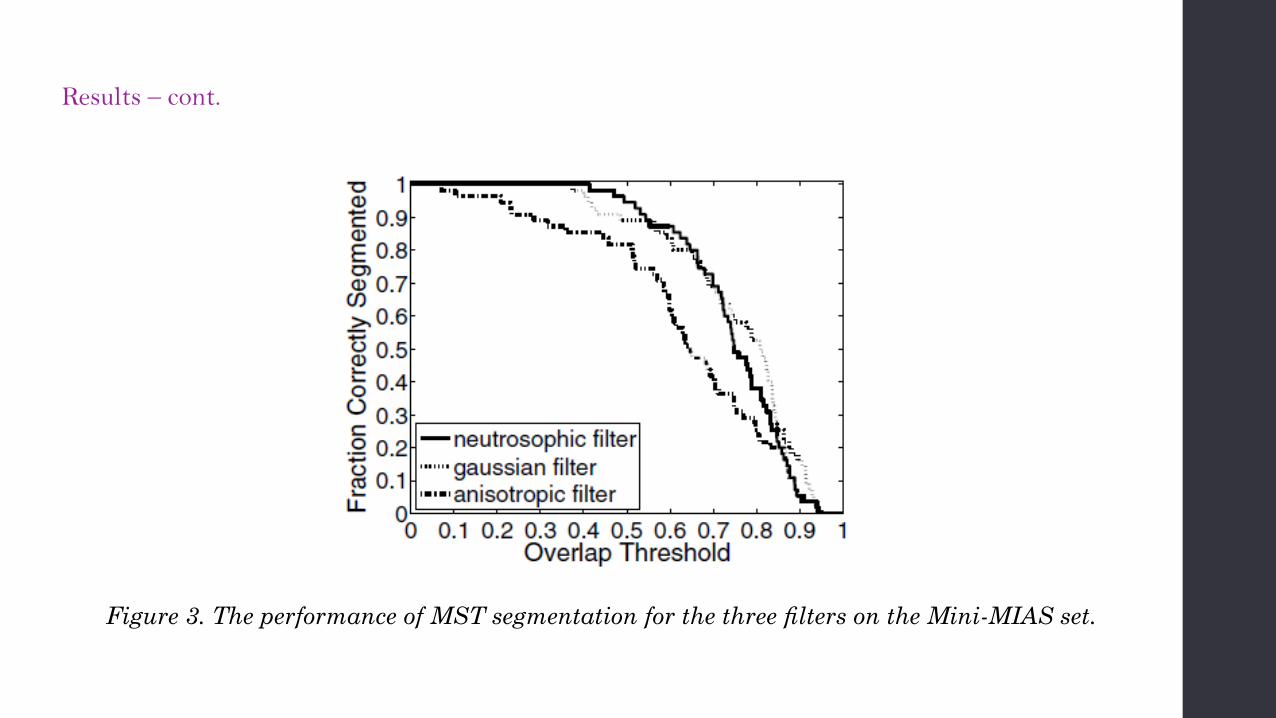
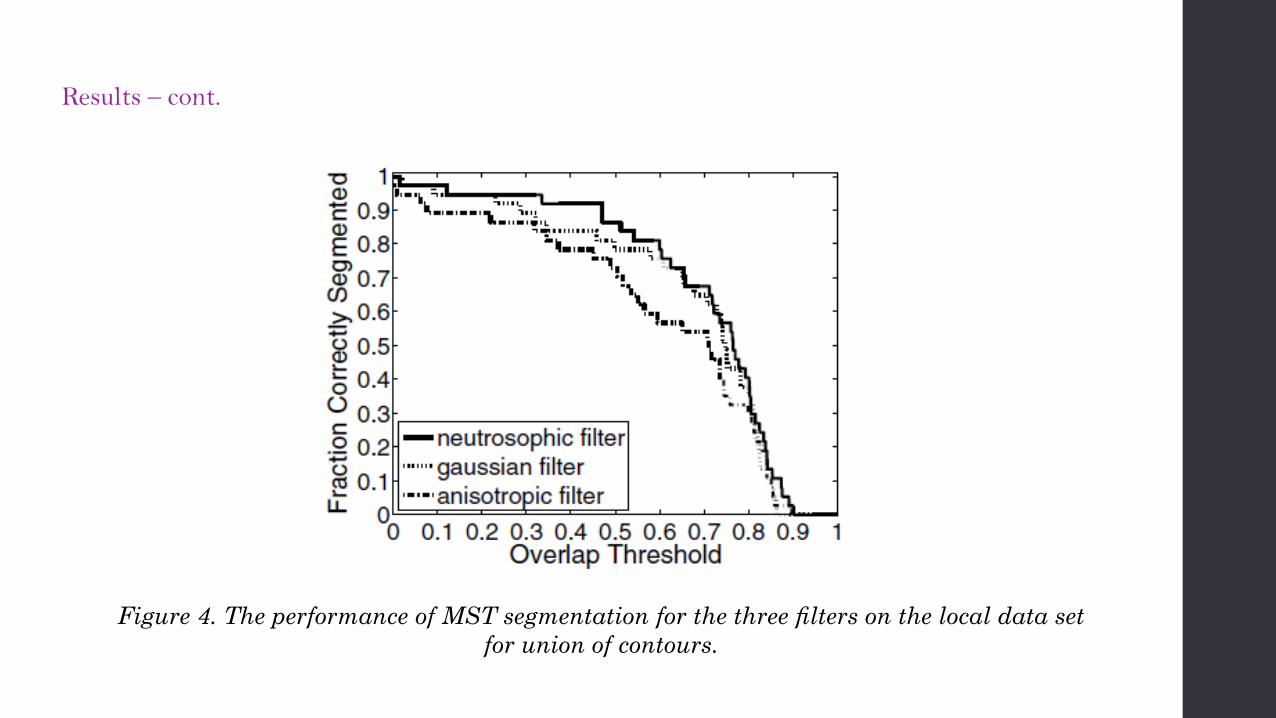
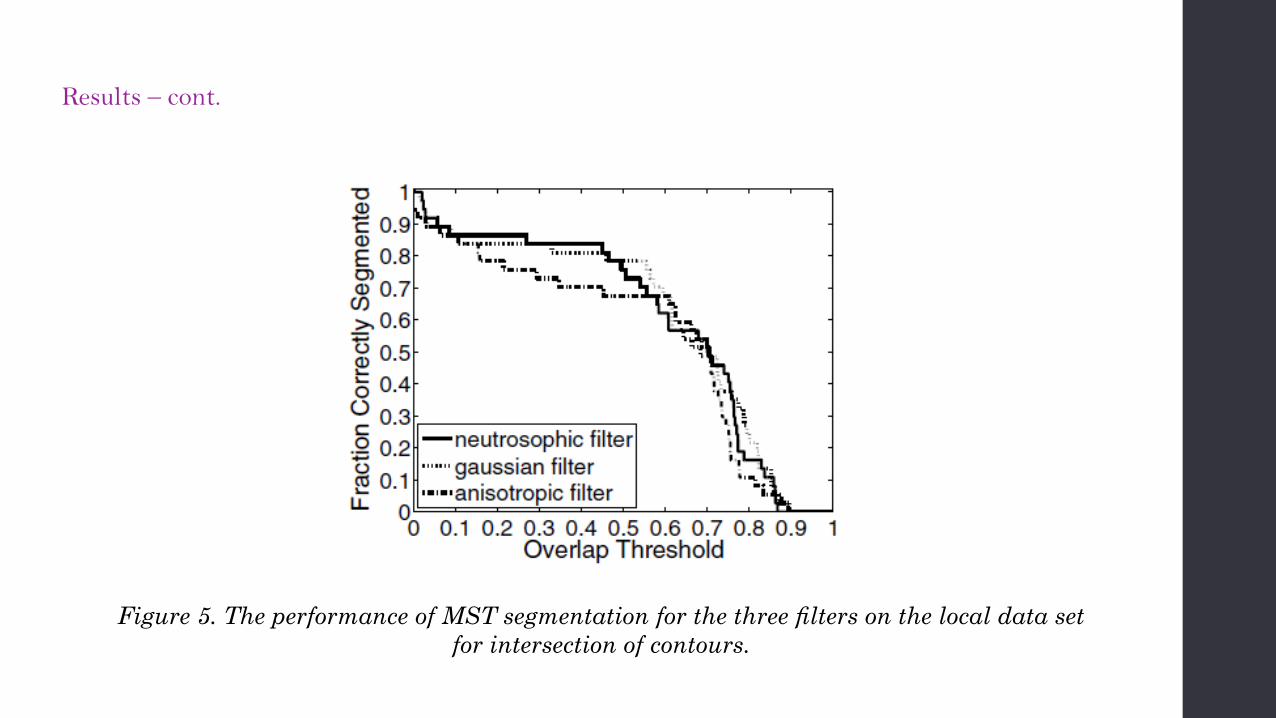
Figures 3, 4 and 5 next slides show plots of the proportion of correctly segmented masses as
functions of the overlap threshold used to define successful segmentation for various versions of
segmentation methods discussed.
The graphs indicate that the performances of MST segmentation for gaussian and neutrosophic
filters are comparable and outperform the segmentation for images with anisotropic filtering.
Comparing Figures 3, 4 and 5 to the one obtained in [7] (indicative only since different databases
were used) we see that MST segmentation is capable of producing radiologist-like outlines.
[7] M. Kupinski and M. L. Giger. Automated seeded lession segmentation on digital mammograms. IEEE
Transactions on Medical Imaging, 17(4):510–517, 1998.
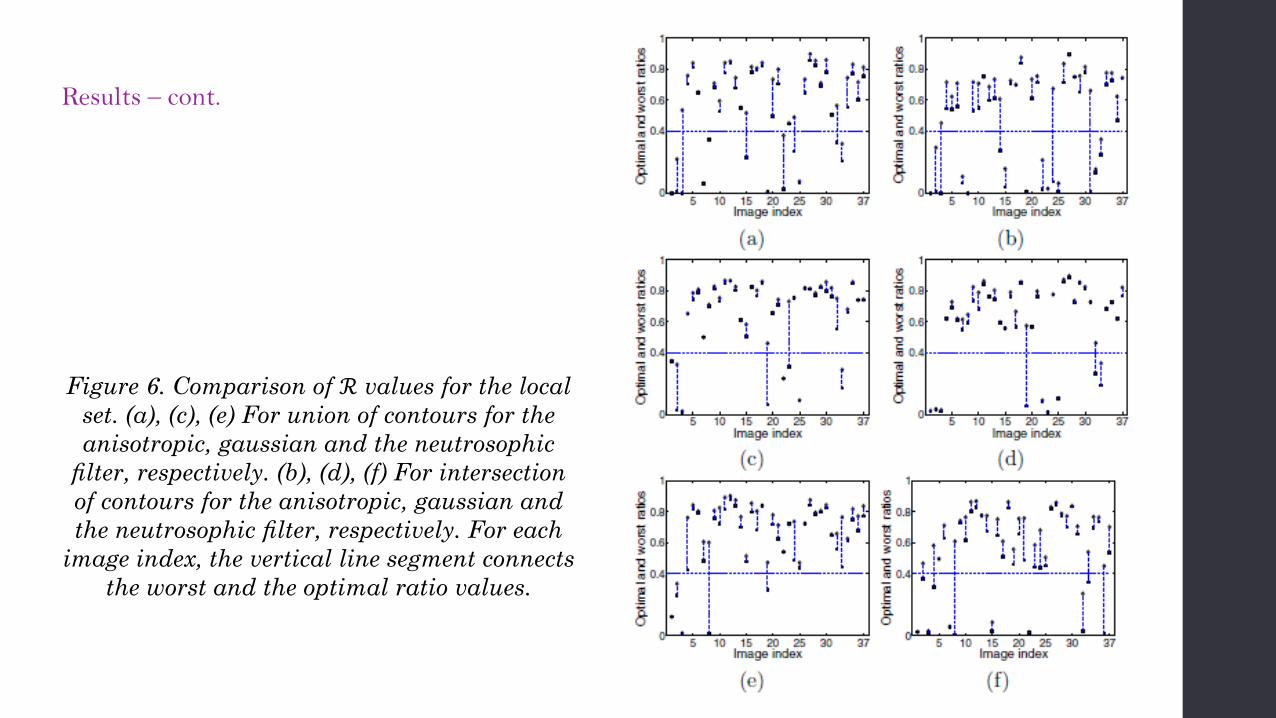
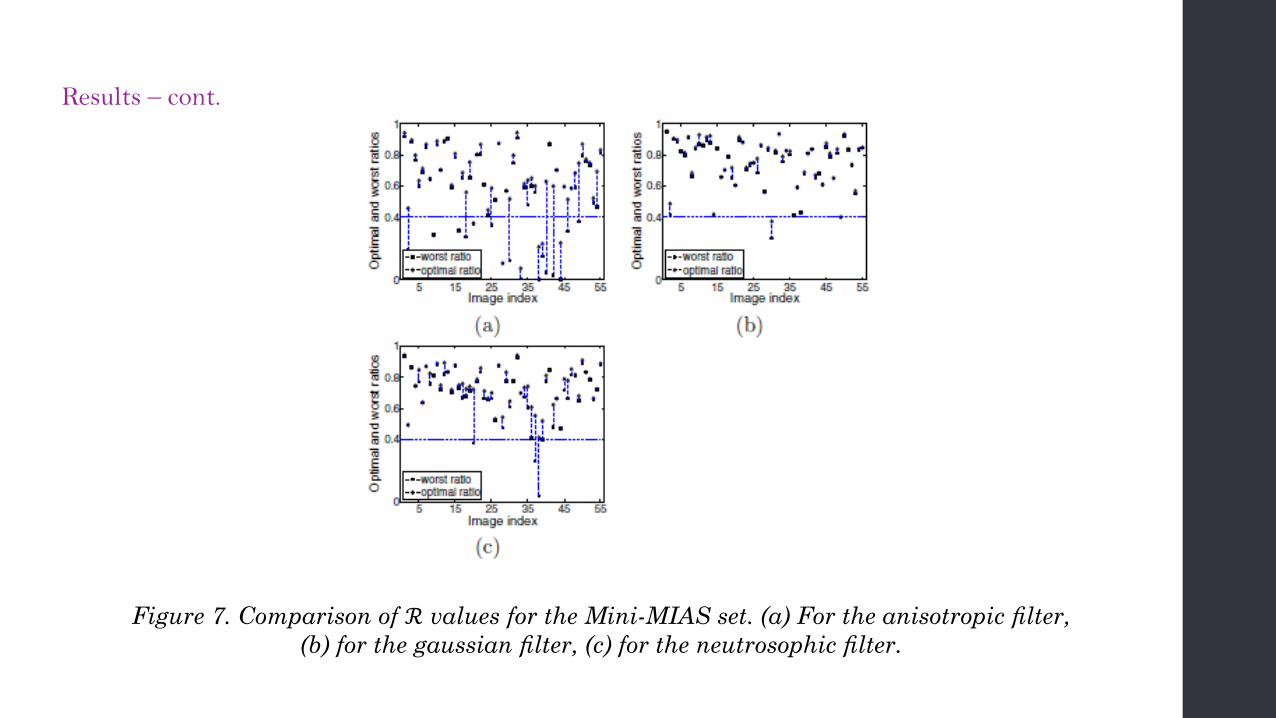
Looking at the details of ratio values on image-by image base, Figures 6, 7, we also conclude that
the anistropic filtering is not appropriate for MST segmentation and the neutrosophic one
outperforms both the gaussian and anistropic filtering in terms of minimizing the number of
failures (images with less than 40% segmentation ratios).
Results – cont.
Figure 3. The performance of MST segmentation for the three filters on the Mini-MIAS set.
Results – cont.
Figure 4. The performance of MST segmentation for the three filters on the local data set
for union of contours.
Results – cont.
Figure 5. The performance of MST segmentation for the three filters on the local data set
for intersection of contours.
Results – cont.
Figure 6. Comparison of ℛ values for the local
set. (a), (c), (e) For union of contours for the
anisotropic, gaussian and the neutrosophic
filter, respectively. (b), (d), (f) For intersection
of contours for the anisotropic, gaussian and
the neutrosophic filter, respectively. For each
image index, the vertical line segment connects
the worst and the optimal ratio values.
Results – cont.
Figure 7. Comparison of ℛ values for the Mini-MIAS set. (a) For the anisotropic filter,
(b) for the gaussian filter, (c) for the neutrosophic filter.
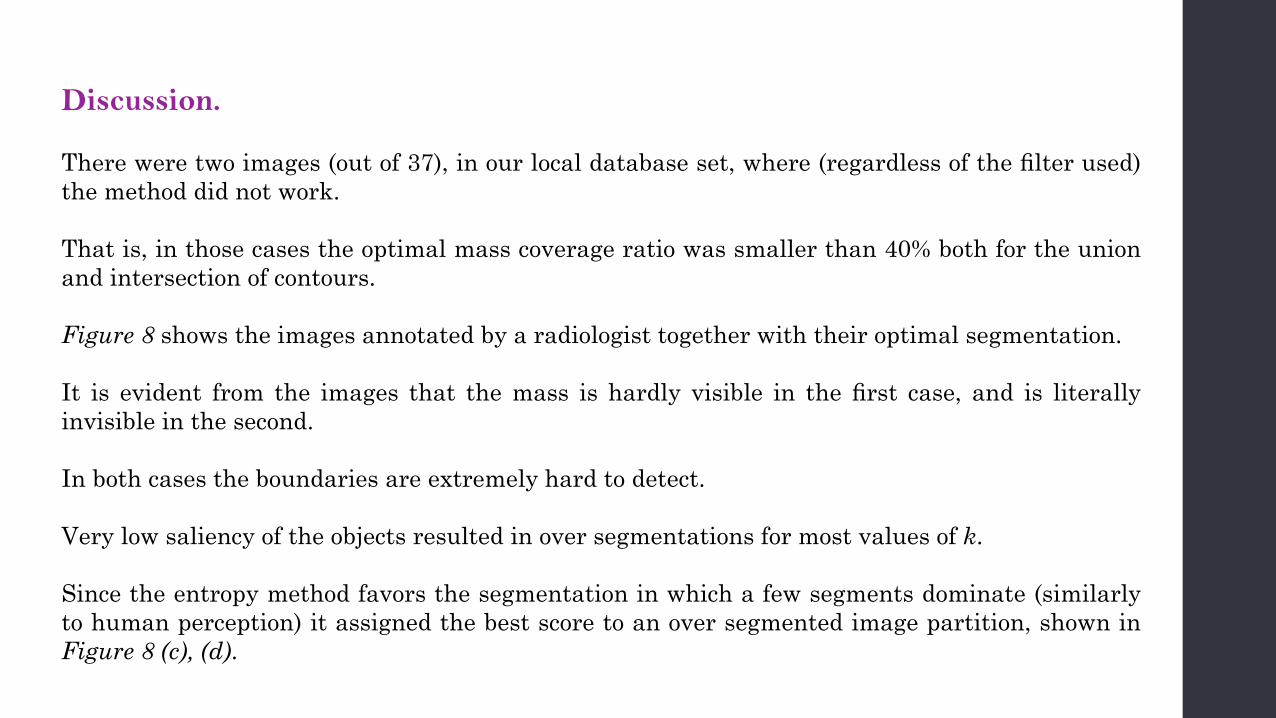
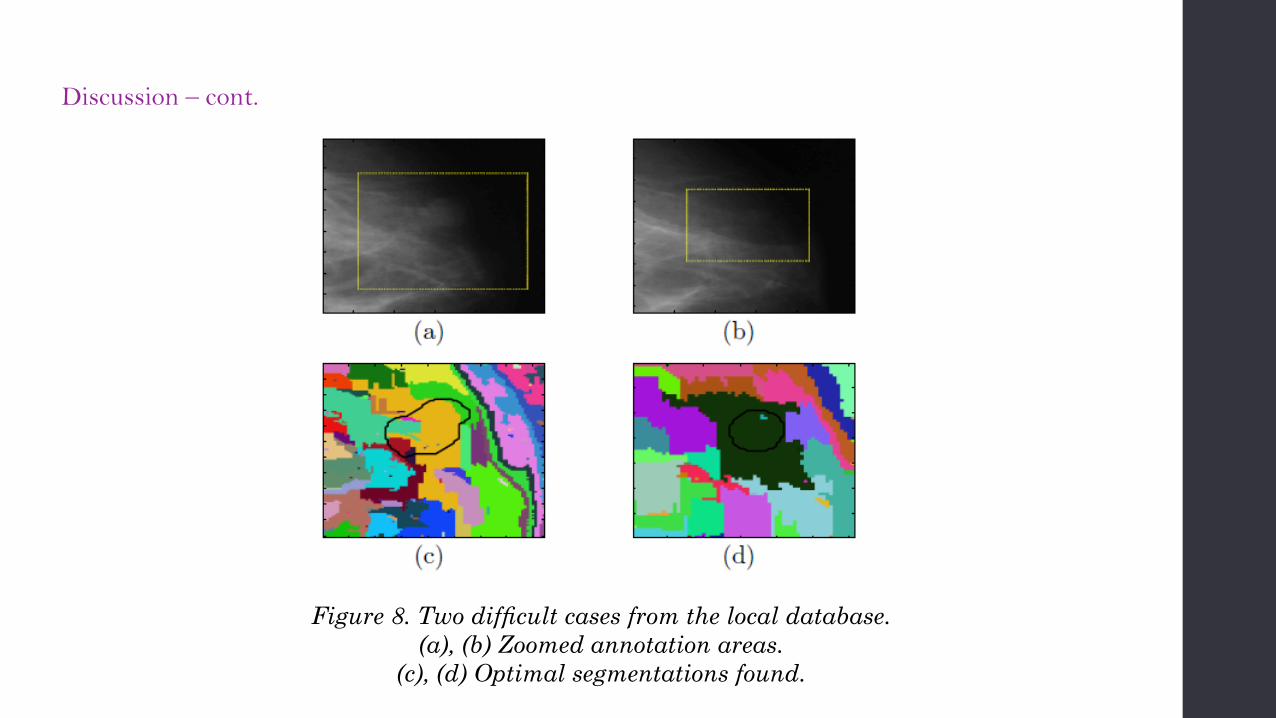
Discussion.
There were two images (out of 37), in our local database set, where (regardless of the filter used)
the method did not work.
That is, in those cases the optimal mass coverage ratio was smaller than 40% both for the union
and intersection of contours.
Figure 8 shows the images annotated by a radiologist together with their optimal segmentation.
It is evident from the images that the mass is hardly visible in the first case, and is literally
invisible in the second.
In both cases the boundaries are extremely hard to detect.
Very low saliency of the objects resulted in over segmentations for most values of k.
Since the entropy method favors the segmentation in which a few segments dominate (similarly
to human perception) it assigned the best score to an over segmented image partition, shown in
Figure 8 (c), (d).
Discussion – cont.
Figure 8. Two difficult cases from the local database.
(a), (b) Zoomed annotation areas.
(c), (d) Optimal segmentations found.
Conclusion and further work.
The presentation shows that automatic tuning of MST segmentation by using a measure of
entropy to select one of several possible segmentations has a potential to deliver useful
delineation of mass-like objects in mammograms for the purpose of CAD systems.
It is capable of producing very high mass coverage ratio for majority of mammograms and, more
importantly, producing very few failures.
This is a critical issue, since the outcome of the segmentation will become an input into CAD and
mammogram registration methods.
A disadvantage of the proposed method is that every image must be segmented several times
before the best segmentation can be selected.
It is expected that for some applications the obtained approximate contours will be subject of
further processing using one of the numerous region-merging algorithms available in literature
to further improve their accuracy before being used for detection algorithms.
References.
[1] J. Cousty, M. Couprie, N. L., and G. Bertrand. Weighted fusion graphs: Merging properties and
watersheds. Discrete Applied Mathematics, 156:3011–3027, 2008.
[2] P. F. Felzenszwalb and D. P. Huttenlocher. Efficient graph-based image segmentation. Int. J. Comput.
Vision, 59(2):167–181, 2004.
[3] Y. Guo, H. Cheng, Y. Zhang, and W. Zhao. A new neutrosophic approach to image denoising. In
Proceedings of the 11th Joint Conference on Information Science, pages 1–6. Atlantis Press, 2008.
[4] Y. Guo and H. D. Cheng. New neutrosophic approach to image segmentation. Pattern Recognition, 42:587–
595, 2009.
[5] K. Haris, S. N. Efstratiadis, N. Maglaveras, and A. K. Katsaggelos. Hybrid image segmentation using
watersheds and fast region merging. IEEE transactions on Image Processing, 7:1684–1699, 1998.
[6] M. Kass, A. Witkin, and D. Terzopoulos. Snakes: active contour models. Int. J. Comput. Vision, 1(4):321–
331, 1987.
[7] M. Kupinski and M. L. Giger. Automated seeded lession segmentation on digital mammograms. IEEE
Transactions on Medical Imaging, 17(4):510–517, 1998.
[8] F. Ma, M. Bajger, and M. J. Bottema. Robustness of two methods for segmenting salient features in
screening mammograms. In Proc. of the 9th Conf. on Digital Image Computing Techniques and Applications
(DICTA2007), pages 112–117, Adelaide, 2007.
[9] F. Ma, M. Bajger, J. P. Slavotinek, and M. J. Bottema. Two graph theory based image segmentation
methods for identifying pectoral muscle in mammograms. Pattern Recognition, 40:2592–2602, 2007.
References – cont.
[10] K. Marias, C. Behrenbruch, S. Parbhoo, A. Seifalian, and M. Brady. A registration framework for the
comparison of mammogram sequences. IEEE Trans. On Medical Imaging, 24(6):782–790, June 2005.
[11] P. Perona and J. Malik. Scale-space and edge detection using anisotropic diffusion. IEEE Pattern Anal.
Machine Intell., 12:629–639, 1990.
[12] W. S. Rasband. ImageJ. U.S. National Institutes of Health, Bethesda, Maryland, USA,
http://rsb.info.nih.gov./ij/, 1997-2008.
[13] M. Sonka, V. Hlavac, and R. Boyle. Image processing, Analysis, and Machine Vision. Thomson, 3 edition,
2008.
[14] J. Suckling, J. Parker, D. Dance, S. Astley, I. Hutt, C. Boggis, I. Ricketts, E. Stamatakis, N. Cerneaz, S.
Kok, P. Taylor, D. Betal, and J. Savage. The mammographic images analysis society digital mammogram
database. Exerpta Medica, 1069:375–378, 1994.
[15] H. Susukida, F. Ma, and M. Bajger. Automatic tuning of a graph-based image segmentation method for
digital mammography applications. In Proc. of the 5th IEEE Intern. Symp. on Biomedical Imaging (ISBI
2008), pages 89–92, Paris, France, May 14-17 2008.
[16] C. Xu and J. L. Prince. Snakes, shapes, and gradient vector flow. IEEE Transactions on Image
Processing, 7(3):359–369, 1998.
[17] H. Zhang, J. E. Frits, and S. A. Goldman. Image segmentation evaluation: A survey of unsupervised
methods. Computer Vision and Image Understanding, 110:260–280, 2008.
[18] H. Zhang, J. E. Fritts, and S. A. Goldman. An entropy-based objective evaluation method for image
segmentation. In Proc. of SPIE: Storage and Retrieval Methods and Applications for Multimedia, volume
5307, pages 38–49, 2004.