Embed Size (px)
Citation preview
Automating Gene Editing
Using Digital Microfluidics
to Decipher Cancer Pathways
Hugo Sinha
A Thesis
In
The Department
Of
Electrical & Computer Engineering
Presented in Partial Fulfillment of the Requirements
For the Degree of Master of Applied Science at
Concordia University
Montreal, Québec
© Hugo Sinha, 2018

ii
CONCORDIA UNIVERSITY
SCHOOL OF GRADUATE STUDIES
This is to certify that the thesis prepared
By: Hugo Sinha
Entitled: Automating Gene Editing Using Digital Microfluidics to Decipher Cancer
Pathways
and submitted in partial fulfillment of the requirements for the degree of
Master of Applied Science (Electrical and Computer Engineering)
complies with the regulations of this University and meets the accepted standards with respect to
originality and quality.
Signed by the final examining committee:
________________________________________________ Chair
Dr. R. Raut
________________________________________________ External to Program Examiner
Dr. D. Kwan
________________________________________________ Internal Examiner
Dr. N. Kharma
________________________________________________ Supervisor
Dr. S. Shih
Approved by: ___________________________________
Dr. W.E. Lynch, Chair
Department of Electrical and Computer Engineering
May, 25, 2018 __________________________________
Dr. Amir Asif, Dean,
Faculty of Engineering and Computer Science

iii
Abstract
Automating Gene Editing Using Digital Microfluidics
to Decipher Cancer Pathways
Hugo Sinha
Gene-editing techniques such as RNA-guided endonuclease systems are becoming increasingly
popular for phenotypic screening. Such screens are normally conducted in arrayed or pooled
formats. There has been considerable interest in recent years to find new technological methods
for conducting these gene-editing assays. We report here the first digital microfluidic method that
can automate arrayed gene-editing in mammalian cells. Functional microfluidic devices were
designed and optimized to produce repeatable experiments and validate the relevant biological
processes on device. Specifically, this method was useful in culturing lung cancer cells for up to
six days, as well as implementing automated gene transfection and knockout procedures. In
addition, a standardized imaging pipeline to analyse fluorescently labelled cells was also designed
and implemented during these procedures. A gene editing assay for interrogating the MAPK/ERK
pathway was performed to show the utility of our platform and to determine the effects of knocking
out the RAF1 gene in lung cancer cells. In addition to gene knockout, we also treated the cells
with an inhibitor, Sorafenib Tosylate, to determine the effects of enzymatic inhibition. The
combination of enzymatic inhibition and guide targeting on device resulted in lower drug
concentrations for achieving half-inhibitory effects (IC50) compared to cells treated only with the
inhibitor, confirming that lung cancer cells are being successfully edited on the device. We
propose that this system will be useful for other types of gene-editing assays and applications
related to personalized medicine.

iv
This thesis is dedicated to Dr. Jean de Vellis, an illustrious neuroscientist and a passionate
botanist, who provided my young research brain with blossoms of pragmatic optimism.

v
Acknowledgements
First and foremost, I would like to thank my supervisor, Dr. Steve Shih for agreeing to take me
onboard this crazy journey and empowering me to express my scientific curiosity. His enthusiasm
and inexhaustible motivation inspired me to become the graduate student that I am today. In
addition, his interdisciplinary vision of science pushed me to see beyond my preconceptions of the
research world.
Next, I would like to thank my entire lab for their help and support throughout these past two years.
Their value in my project cannot be underlined enough. Special mention to Angela Quach for her
eagerness to do well and her hands-on assistance throughout my project, without whom my project
would not be completed at this date. James Perry and Fatemeh Ahmadi, thank you for your good
spirit and openness to troubleshoot with me. Thank you to Philippe Vo and Mathieu Husser for
their great work as exemplary undergrads.
I thank the ECE department for their FRS funding and for curating such a pleasant master’s
program. I recognize the entire Martin Lab for their constant good will and for providing me with
the scientific advice I was lacking. I also thank the Martin Lab and the Centre for Applied Synthetic
Biology for their resources and making the working environment so pleasant. Thank you to the
Sacher Lab for their help with tissue culturing.
Next, I thank my committee members, Dr. Nawwaf Kharma and Dr. David Kwan, as well as my
chair, Dr. Rabin Raut, for reading, reviewing and accommodating my thesis.
Finally, thank you to my parents for respecting my decisions and giving me the keys to success
and my sister supporting her ‘geeky’ brother. I would also like to thank the rest of my family and
friends for keeping me from alienating myself too much and my partner, Madeleine, for bearing
with me and my stress with incredible patience.

vi
Overview of Chapters
This thesis describes the project I conducted and completed for my Master’s in Applied
Science in Dr. Steve Shih’s research group at Concordia University. In this work, I aimed to
develop a fully-automated digital microfluidic platform tailored to CRISPR-Cas9 genome editing
in cancer cells, for systematic loss-of-function screens. This thesis provides a literature review on
the history of miniaturization and microfluidic paradigms, an in-depth review of digital
microfluidics and a commentary on the state of gene editing techniques while assessing the
technological challenges in operating CRISPR-Cas9. I will then get into the core of my research,
reporting the methodology utilized for the development of an intuitive gene editing platform, and
validating the platform with experimental results.
Chapter 1 is an introduction to microfluidics within the bigger realm of miniaturization, describing
the three dominant paradigms and briefly evaluating their potential for cell-based applications.
From this review, we will draw a table comparing the three paradigms.
Chapter 2 provides an in-depth review of digital microfluidics theory, venting its merits as a
versatile liquid handling platform, describes the fabrication methods, assess the potential for
automation and finally comments on its amenability to cell culture.
Chapter 3 is a review of the biological stakes that we will be addressing with our platform,
presenting gene editing techniques with a special focus on CRISPR-Cas9 in the context of cancer
research, and comments on the technological limitations in operating CRISPR-Cas9 today. This
commentary will lead to the presentation of my thesis objectives.
Chapter 4 provides a complete description of my methods, both on the biology and engineering
side, to develop a functional gene editing system.

vii
Chapter 5 describes my results in validating the gene editing platform. I will describe the device
design optimization, the validation of the platform for transfection of nucleic acid, proof-of-
concept work for knock-out of endogenous genes and applying our platform to study cell
proliferation.
Chapter 6 provides concluding remarks regarding my work and its potential in clinical research. I
will also evaluate future perspectives for DMF, CRISPR-Cas9 and my platform.

viii
Overview of Author Contributions
This work described in my thesis was made possible with the help of colleagues from the
Shih Lab. Here, I outline the contributions that each author made to the work.
The project was thought out and designed by Dr. Steve Shih and myself and the research
article relevant to this work was written and edited by Dr. Steve Shih and myself.
All experiments were conducted by myself, and I collected and analyzed all the data
relevant to my thesis. The resulting figures were revised and approved by Dr. Steve Shih.
Tissue culture work (cell passaging, maintenance) and DMF device fabrication was
performed with the help of Angela Quach.
The code for the automation system was written, optimized and troubleshooted by Philippe
Vo. The hardware for the automation system was designed and optimized by Amin Firouzeh and
Philippe Vo.
ix
Table of Contents
List of Figures .......................................................................................................................... xi
List of Tables ........................................................................................................................... xii
List of Equations ..................................................................................................................... xii
List of Abbreviations .............................................................................................................. xiii
List of Foundations and Funding Sources .............................................................................. xiv
List of Co-Authored Publications ............................................................................................. xv
Chapter 1. Introduction to Miniaturized Fluid Handling .....................................................1
1.1 Historical Perspectives on the Miniaturization of Biology .................................................. 1
1.2 Microchannels ....................................................................................................................... 3
1.3 Droplets-in-Channel ............................................................................................................. 5
1.4 Digital Microfluidics ............................................................................................................. 6
1.5 Summary Table of Microfluidic Technologies ..................................................................... 8
Chapter 2. Special Focus on Digital Microfluidics ...............................................................9
2.1 Digital Microfluidic Theory .................................................................................................. 9
2.2 Digital Microfluidics and Automation ............................................................................... 13
2.3 Digital Microfluidics and Cell Culture ............................................................................... 16
Chapter 3. Gene Editing and Thesis Objectives .................................................................. 20
3.1 Introduction to Gene Editing Techniques .......................................................................... 20
3.2 Special Focus on CRISPR-Cas9 ......................................................................................... 22
3.3 CRISPR-Cas9 in Cancer Research .................................................................................... 24
3.4 Technological Challenges in CRISPR-Cas9 Operation ..................................................... 26
3.5 Thesis Objectives ................................................................................................................ 28
Chapter 4. Methodology: Operating Biology On-Chip ....................................................... 30
4.1 Reagents and Materials ...................................................................................................... 30
4.2 Plasmid Construction and Purification .............................................................................. 31
4.3 Macro-Scale Cell Culture, Transfection and Knock-Out .................................................. 35
4.4 Device Fabrication and Assembly ...................................................................................... 36
4.5 Automation Setup and Device Operation .......................................................................... 39
4.6 Microfluidic Cell Culture, Transfection and Knock-Out .................................................. 41
4.7 Cell Imaging and CellProfiler Pipeline .............................................................................. 44
4.8 Western Blot Experiments .................................................................................................. 45
4.9 MAPK/ERK Pathway Experiments ................................................................................... 47

x
Chapter 5. Validation of the ACE Platform ........................................................................ 49
5.1 Device Design: DMF Platform for gene editing ................................................................. 49
5.2 Platform Validation: Transfection Efficiency .................................................................... 57
5.3 Proof-of-Concept: Knock-Out of Stably Integrated GFP.................................................. 63
5.4 Application: Identification of Cancer Genes in the Ras Pathway ..................................... 68
Chapter 6. Concluding Remarks and a Look to the Future ................................................ 76
6.1 Conclusion ........................................................................................................................... 76
6.2 Future Perspectives............................................................................................................. 77
References ................................................................................................................................ 79

xi
List of Figures
Figure 1.1 – Microfluidic Paradigms. ..........................................................................................7 Figure 2.1 – Single-plate and two-plate configurations for DMF. .............................................. 13 Figure 2.2 – Operations performed on a DMF device. ............................................................... 14 Figure 2.3 – Digital microfluidic automation system. ................................................................ 15 Figure 2.4 – Graphical User Interface. ....................................................................................... 16 Figure 2.5 – DMF Cell Culture Strategy. ................................................................................... 19 Figure 3.1 – Endogenous DNA dsBreak repair mechanisms promoting gene editing. ................ 23 Figure 4.1 – The sgRNA sequence represents the template designed for all sgRNAs. ................ 33 Figure 4.2 – PCR products of the synthesized CRISPR guides, yielding g-blocks. ..................... 33 Figure 4.3 – Blue-White Screening for pCRISPR All-in-one assembly. ..................................... 34 Figure 4.4 – DMF Device Fabrication. ...................................................................................... 38 Figure 4.5 – Microfluidic automation system for gene-editing. .................................................. 40 Figure 4.6 – 3D-Printed Humidified Chamber and microscope holder for imaging. ................... 43 Figure 5.1 – Schematic of the ACE Device................................................................................ 53 Figure 5.2 – Optimization of chip configuration and electrode design........................................ 54 Figure 5.3 – Step-by-step CRISPR-Cas9 knock-out process at the cellular level. ....................... 55 Figure 5.4 – Timeline showing the process of automated gene-editing on chip. ......................... 56 Figure 5.5 – A schematic showing the imaging pipeline used for analyzing transfection. ........... 57 Figure 5.6 – mCherry transfection of H1299 cells in well-plates vs. on DMF. ........................... 58 Figure 5.7 – Video sequence depicting the transfection strategy on the ACE platform. .............. 59 Figure 5.8 – Optimization of the lipid complex to media ratio for transfection on device. .......... 60 Figure 5.9 – Optimization of on-chip transfection by diluting lipid complexes in liquid media. . 61 Figure 5.10 – Transfection efficiency of mCherry2-N1 well-plates vs. DMF devices. ............... 62 Figure 5.11 – Cas9 protein levels in H1299 cells when transfecting different starting material. . 63 Figure 5.12 – Imaging the knockout of stably integrated eGFP. ................................................. 65 Figure 5.13 – eGFP knockout design considerations. ................................................................. 66 Figure 5.14 – Plot of the transfection efficiency for both the pCRISPR and mCherry2-N1. ....... 66 Figure 5.15 – Plot shown for the GFP knock-out in well-plates compared to the microscale. ..... 67 Figure 5.16 – Identification of cancer genes in the Ras pathway. ............................................... 69 Figure 5.17 – Raw data showing absolute fluorescence and the morphology of H1299 cells. ..... 70 Figure 5.18 – Plot showing progression of cell viability over time. ............................................ 71 Figure 5.19 – Example of microscopy images used for dose-response curves. ........................... 73 Figure 5.20 – Dose-response relationships on- and off-chip with relevant GC50. ...................... 74 Figure 5.21 – Western blot showing probing RAF1 expression levels in H1299 cells ................ 75

xii
List of Tables
Table 1.1 – Comparative table assessing the state of miniaturization techniques. .........................8 Table 4.1 – Cells and Plasmids used in this study ...................................................................... 31 Table 4.2 – CRISPR Target Sequences ...................................................................................... 31 Table 4.3 – Primer sequences .................................................................................................... 34
List of Equations
Equation 1.1: Reynold's Number .................................................................................................3 Equation 2.1: Young-Lippman Equation ................................................................................... 10 Equation 2.2: Driving force using Young-Lippman ................................................................... 10 Equation 2.3: Energy equation using electromechanical model .................................................. 11 Equation 2.4: Force equation using electromechanical model .................................................... 11 Equation 4.1: Percentage of fluorescent cells ............................................................................. 45

xiii
List of Abbreviations
1. Acceleration (ACL)
2. Alternating Current (AC)
3. Automated CRISPR Editing (ACE)
4. Automated Liquid Handling Robotics (ALHR)
5. Bovine Serum Albumin (BSA)
6. Computer-Aided Design (CAD)
7. Clustered Regularly Interspaced Short Palindromic Repeats (CRISPR)
8. CRISPR-Associated (Cas)
9. CRISPR RNA (crRNA)
10. Deionized (DI)
11. Direct Current (DC)
12. Digital Microfluidics (DMF)
13. Dimethyl Sulfoxide (DMSO)
14. Double-Strand Break (DSB)
15. Electrowetting-on-Dielectric (EWOD)
16. Enhanced GFP (eGFP)
17. Extracellular Signal-Regulated Kinases (ERK)
18. Fetal Bovine Serum (FBS)
19. Green Fluorescent Protein (GFP)
20. High-Throughput Screening (HTS)
21. Homology-Directed Repair (HDR)
22. Integrated Circuit (IC)
23. Indium Tin Oxide (ITO)
24. Insertions/Deletions (Indels)
25. Lab-On-Chip (LOC)
26. Lysogeny Broth (LB)
27. Methanol (MeOH)
28. Mitogen-Activated Protein Kinase (MAPK)
29. Mitogen-Activated Protein Kinase Kinase (MAPKK, MEK)
30. Next-Generation Sequencing (NGS)
31. Non-Homologous End Joining (NHEJ)
32. Phosphate Buffer Saline (PBS)
33. Polydimethylsiloxane (PDMS)
34. Polymerase Chain Reaction (PCR)
35. Printed Circuit Board (PCB)
36. Proportional Integral Derivative (PID)
37. Protospacer-Adjacent Motif (PAM)
38. Reynolds Number (Re)
39. Ribonucleoprotein (RNP)
40. Roswell Park Memorial Institute (RPMI)
41. Single Guide RNA (sgRNA)
42. Transactivating CRISPR RNA (tracrRNA)
43. Transcription Activator-Like Effector Nuclease (TALEN)
44. Zinc Finger Nuclease (ZFN)

xiv
List of Foundations and Funding Sources
I thank the following funding sources for providing financial support and allowing this project to
be conducted:
Natural Sciences and Engineering Council (NSERC)
Fonds de Recherche Nature et Technologies (FRQNT)
Canadian Foundation of Innovation (CFI)
I also thank the following institutions and organisations for their contribution for funding and
resources:
Concordia University Department of Electrical and Computer Engineering for FRS
funding and academic resources.
Centre for Applied Synthetic Biology (CASB) for equipment and technical support.
Concordia University Department of Biology for academic resources and for their tissue
culturing facility.
McGill Nanotools Microfab (MNM) for their clean-room facilities.
Concordia Silicon Microfabrication lab (ConSIM) for clean-room facilities.

xv
List of Co-Authored Publications
Image-based Feedback and Analysis System for Digital Microfluidics
Philippe Q.N. Vo 1, 2, Mathieu C. Husser, 2,3 Fatemeh Ahmai 1,3, Hugo Sinha1,3, Steve C.C. Shih1-3
1Department of Electrical and Computer Engineering, Concordia University, Montréal, Québec, Canada 2Centre for Applied Synthetic Biology, Concordia University, Montréal, Québec, Canada 3 Department of Biology, Concordia University, Montréal, Québec, Canada
Abstract
Digital microfluidics (DMF) is a technology that provides a means of manipulating nL-L
volumes of liquids on an array of electrodes. By applying an electric potential to an electrode,
these discrete droplets can be controlled in parallel which can be transported, mixed, reacted, and
analyzed. Typically, an automation system is interfaced with a DMF device uses a standard set of
basic instructions written by the user to execute droplet operations. Here, we present the first
feedback method for DMF that relies on imaging techniques that will allow online detection of
droplets without the need to reactivate all destination electrodes while minimizing the biofouling
within a given experiment. Our system consists of integrating open-source electronics with a
CMOS camera with a zoom lens for acquisition of the droplet movements on the device. We also
created an algorithm that uses a Hough transform to detect a variety of droplet sizes and to detect
singular droplet dispensing and movement failures on the device. As a first test, we applied this
feedback system to testing the droplet movement of a variety of liquids used in cell-based assays
and implemented a colorimetric cellulase assay to determine enzymes suitable for breaking down
biomass for biofuel production. We believe using our approach of integrating imaging and
feedback with DMF can provide a platform for automating biological assays with high-fidelity.
Vo, P.Q.N., Husser, M.C., Ahmadi, F., Sinha, H. & Shih, S.C.C. Image-based feedback and
analysis system for digital microfluidics. Lab on a Chip 17, 3437-3446 (2017).
xvi
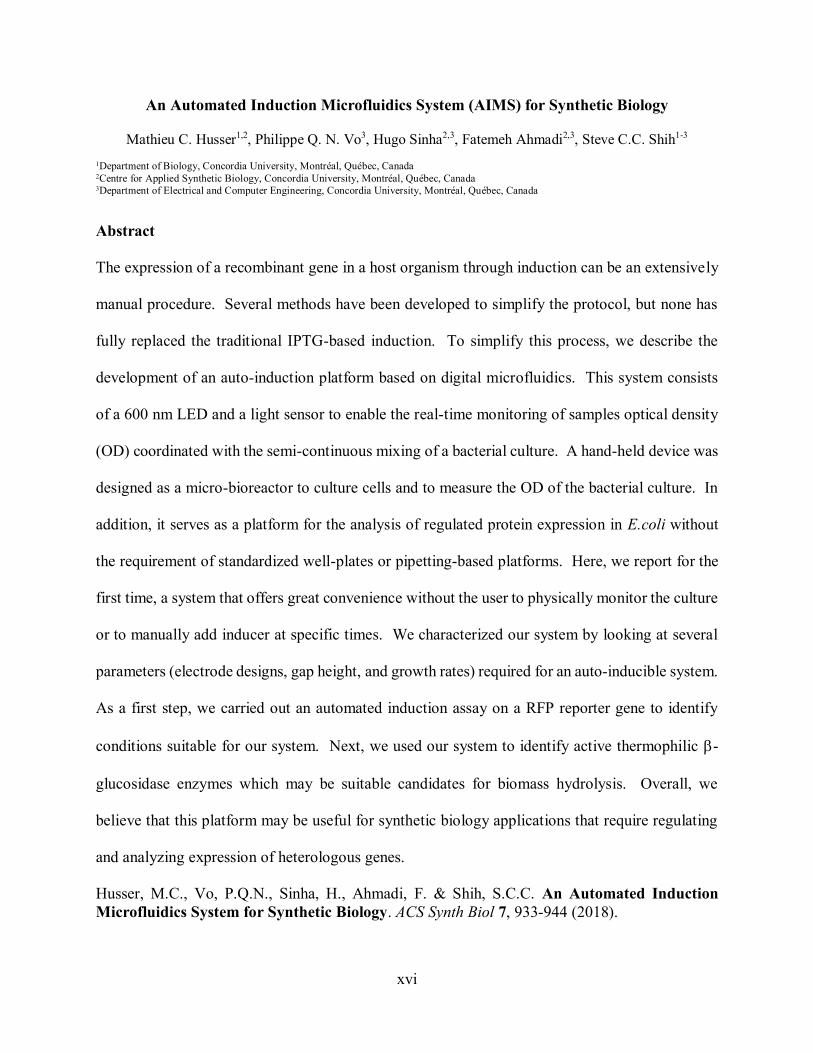
An Automated Induction Microfluidics System (AIMS) for Synthetic Biology
Mathieu C. Husser1,2, Philippe Q. N. Vo3, Hugo Sinha2,3, Fatemeh Ahmadi2,3, Steve C.C. Shih1-3
1Department of Biology, Concordia University, Montréal, Québec, Canada 2Centre for Applied Synthetic Biology, Concordia University, Montréal, Québec, Canada
3Department of Electrical and Computer Engineering, Concordia University, Montréal, Québec, Canada
Abstract
The expression of a recombinant gene in a host organism through induction can be an extensively
manual procedure. Several methods have been developed to simplify the protocol, but none has
fully replaced the traditional IPTG-based induction. To simplify this process, we describe the
development of an auto-induction platform based on digital microfluidics. This system consists
of a 600 nm LED and a light sensor to enable the real-time monitoring of samples optical density
(OD) coordinated with the semi-continuous mixing of a bacterial culture. A hand-held device was
designed as a micro-bioreactor to culture cells and to measure the OD of the bacterial culture. In
addition, it serves as a platform for the analysis of regulated protein expression in E.coli without
the requirement of standardized well-plates or pipetting-based platforms. Here, we report for the
first time, a system that offers great convenience without the user to physically monitor the culture
or to manually add inducer at specific times. We characterized our system by looking at several
parameters (electrode designs, gap height, and growth rates) required for an auto-inducible system.
As a first step, we carried out an automated induction assay on a RFP reporter gene to identify
conditions suitable for our system. Next, we used our system to identify active thermophilic -
glucosidase enzymes which may be suitable candidates for biomass hydrolysis. Overall, we
believe that this platform may be useful for synthetic biology applications that require regulating
and analyzing expression of heterologous genes.
Husser, M.C., Vo, P.Q.N., Sinha, H., Ahmadi, F. & Shih, S.C.C. An Automated Induction
Microfluidics System for Synthetic Biology. ACS Synth Biol 7, 933-944 (2018).

1
Chapter 1. Introduction to Miniaturized Fluid Handling
In this section, we will introduce microfluidics in the bigger realm of miniaturization,
describe the three dominant paradigms and briefly evaluate their potential for cell-based
applications. From this review, we will draw a table comparing the three paradigms.
1.1 Historical Perspectives on the Miniaturization of Biology
Biologists first began shifting away from traditional glass tubes and dishes for bench-top
biology in the 1950s when Dr. G. Takatsy described the first microtiter well-plates. 1 The invention
of multi-well plates led to an unprecedented increase in throughput, having a number of wells with
predefined volumetric capacities in the range of microliters to milliliters arranged in a
standardized, rectangular matrix. Takatsy laid the foundations for early bench-top miniaturization
and his contemporary counterparts still resort to such methods for high-throughput drug screening,
enzymatic assays, cell-based assays, and countless other applications.
Towards the end of the twentieth century, high-throughput screening (HTS) became the
gold standard for pharmaceutical drug discovery, where the limits of throughput and screening
efficiency were stretched by creating new 384- and 1536-well formats. Such formats enabled
higher experimental densities in parallel with lower experimental footprints due to reduced reagent
consumptions along with higher statistical significance with facilitated experiment replication.
HTS is now actively used in a wide-range of applications, from genomics to environmental
sampling and from protein crystallization to cell-based assays.
2
HTS requires cutting-edge technologies at high precision to keep up with the number of
samples being assayed in parallel, at a pace that is unachievable by manual labor. In the past few
decades, automated liquid handling robotics (ALHR) have been developed to automate fluid
handling and facilitate the handling of large numbers samples in microtiter plates. Despite the
groundbreaking technological advances in such systems, robotics is often inaccessible given the
high capital costs (can reach a few million USD), the excessive consumption of consumables
(pipette tips, multi-well plates, etc.) and large volumes of reagents being consumed (media, drugs,
cells, etc.). Attention is slowly shifting towards cheaper alternatives for biology miniaturization
and automation, with higher content and quality of the data.
As progress was being made in miniaturizing benchtop experiments into microtiter plates,
significant progress was being made in understanding fluid dynamics, notably Brownian motion
and diffusion, by the combined efforts from Einstein2 and Berg3 in biological systems. In parallel,
Taylor4 had been examining liquid flow in micron-scale channels. The development of
miniaturized chromatographic5 and ink-jet technologies6 enabled the innovation and
implementation of “microfluidics” for biological investigation. Furthermore, the development of
soft-lithography, solid etching and replica molding in PDMS, presented by the Whitesides group
in 1998,7 led to the popularization of microfluidic technologies. Microfluidic technologies are
being extensively explored as an alternative to multi-well plates and led to the development of
numerous technologies vulgarized as “labs-on-a-chip” (LOC) technologies.
LOC technologies are characterized by a miniaturization of experiments and integration of
laboratory instruments onto tiny hand-held devices. With simple and cheap fabrication procedures,
and handling of small volumes and samples, such devices bypass the need for expensive operating
systems, and enable high-throughput and automation. Three paradigms have emerged and become

3
dominant in the midst of miniaturization. The first is microchannels, being the most popular
paradigm, where bulk fluid flows through micron-sized dimension channels.8, 9 The second is
droplets-in-channel, where fluid is manipulated as discrete droplets in enclosed channels, where
each droplet acts as an individual microreactor.10, 11 Finally, digital microfluidics (DMF) is the
manipulation of fluids as discrete droplets on an open array of electrodes.12-14 I will briefly review
all of these paradigms before venting the merits of DMF as a versatile liquid handling platform.
1.2 Microchannels
The most widespread form of microfluidics today is microchannels, also known as
continuous channel microfluidics, where micron-sized dimension channels confine reagents. The
liquid transport of such reagents is driven by pressure gradients from external (e.g. syringe pumps)
or internal pressure sources. Fluid flow is enabled after injection of reagents into the chip either
batch-wise or in continuous mode. In these systems, the flow is dependent on two conflicting
forces: (1) inertia, the resistance of objects to changing their current state of motion and (2)
viscosity, i.e. the resistance of a fluid to stress-induced deformations. The balance of these two
forces is described by the dimensionless Reynold’s number:
Equation 1.1: Reynold's Number
𝑹𝒆 =𝑵𝒆𝒕 𝑰𝒏𝒆𝒓𝒕𝒊𝒂𝒍 𝑭𝒐𝒓𝒄𝒆𝒔
𝑵𝒆𝒕 𝑽𝒊𝒔𝒄𝒐𝒖𝒔 𝑭𝒐𝒓𝒄𝒆𝒔=
𝝆𝝂𝑳
𝝊
where ρ is the fluid density (kg/m3), v is the mean velocity (m/s), L is the characteristic length of
the system, and υ is the kinematic viscosity (m2/s).
The dominance of one of these two forces over the other will determine whether the flow
is turbulent (chaotic) or laminar (deterministic). When Re < 2000, the flow is laminar, when 2000

4
< Re < 4000, the flow is unstable and when Re > 4000, the flow is turbulent. Given the micron-
size of these channels, the length can be estimated to around 10-6 m – this results in most
microfluidic systems to be viscosity dominated, resulting in laminar flows with low Reynold’s
number regimes. Such laminar flow enables multiple streams of reagents to be constrained within
a single channel without mixing.
Such a technology has been used in numerous biological applications, including chemical
separations,15 single cell/molecule analysis,16 and simple reactions performing better at the
microscale with high surface-to-volume ratio.17 The surface area to volume ratio increases when
the scale of volumes is reduced. This substantially increases heat and mass transfer rates, useful to
speed up exothermic and endothermic reactions. The integration of microvalves relying on flexible
membranes and pneumatic control layers on-device allows these devices to become
compartmentalized high-throughput systems.8, 18-20 Such compartmentalization enables
multiplexing, by which ~ 106 independent compartments are formed, each containing volumes in
the range of 10-100 picoliters.18 Nevertheless, microvalves require complex fabrication techniques
(1 compartment requires at least 1 valve) and precise alignment strategies to make a functional
device. In addition, the number of inlets and external pressure sources such as syringe pumps
increases the complexity in fabrication, costs, manual intervention and expertise. Such inherently
complex fabrication techniques, coupled to the dependence on external equipment and complex
tubing/device assembly often makes microchannels undesirable to implement in the daily
workflows of biologists. In addition, the inability to efficiently mix reagents limits the breadth of
potential applications.

5
1.3 Droplets-in-Channel
The droplets-in-channel paradigm is characterized by a two-phase flow, usually with water,
oil and/or gas, in microchannels. Such a configuration enables the formation of pico and nano-liter
droplets, that can be generated at rates in the thousands of droplets per second. These droplets can
be merged, sorted and reacted on-demand.10, 21, 22 Such devices are simple to fabricate and can
operate at high-throughput (10-100 kHz) which makes them desirable for biological screening
applications. Research and development in this field has been increasing control over individual
droplets, for better in-channel guiding and sorting using rails,23-25 laser forcing,26 or electrostatic
charging. 27-29
The most significant advantages of such a miniaturized platform is the small size of
working volumes, the high-throughput nature of reagent manipulation, the individuality of each
droplet eliminating the risk of cross-contamination, different strategies to mix reagents within
droplets and the ability to incubate and store these miniscule droplets for extended periods of time
without evaporation. Bio-compatible surfactants are often used to stabilize emulsions, which
allows live cells to be encapsulated, and fluorinated oils in the continuous phase allows sufficient
gas exchanges to maintain cell viability for extended periods of time. Such advantages have
garnered interest in numerous fields and applications, including magnetic-bead based assays,30-32
single cell high-throughput studies,33-35 protein crystallization36 and chemical synthesis.37
Nevertheless, just like microchannels, droplet microfluidics requires pumps, complex
tubing for inlets and outlets and other external equipment, which discourages certain researchers
to move away from their traditional practices. Also, multi-step long-term applications are difficult
to implement in such systems given that the speed of individual droplets makes the individual
addressability of droplets complicated for reagent addition, staining and media exchange.

6
Furthermore, sorting and detection often requires optical systems and read-outs, and specialized
microscopy analysis techniques, thereby complicating the process.
1.4 Digital Microfluidics
My research utilized a more recent technology developed in the realm of miniaturization
called digital microfluidics (DMF), still in its infancy. Such a technology accurately represents the
“lab-on-a-chip mindset”, where all laboratory instruments and components are integrated onto a
single hand-held device. The technology relies on the manipulation of picoliter-milliliter sized
droplets on an array of electrodes. DMF is now being used in a wide-range of applications, with
the advantages of reduced sample size, fast heat transfer and reduced reaction rates (explained by
the high surface area to volume ratio) and is highly amenable to integration. A wide range of
operations can be performed and reprogrammed on-demand, such as dispensing droplets from
reservoirs, moving, merging, mixing and splitting into smaller droplets. One of the key advantages
is that droplets can be addressed individually, where each reagent operated on a DMF device is
isolated until merged with another reagent, and with each droplet acting as a discrete microvessel
with no cross-talk with neighboring samples. Microchannels are very different in that respect
where they operate with conventional flow and may be disturbed by hydrostatic and capillary
flows. In addition, DMF devices are operated on generic platforms with simple configurations (M
x N array), making them easy to operate and to reconfigure.
The individual addressability of samples makes DMF an inherently array-based technique.
This makes DMF ideal for array-based biochemical applications. Despite certain challenges and
disadvantages of DMF, we sought to harness the platform to automate gene editing, given that
DMF allows a rational design approach to be used to target certain specific genes in an arrayed

7
manner, where experiments can be multiplexed and reprogrammed, cell-based assays can be
performed on demand, and phenotypic readouts can be obtained, all in an automated manner.
Figure 1.1 – Microfluidic Paradigms.
(a) Microchannels. Reproduced with permission from the Royal Society of Chemistry.38
(b) Droplets-in-channel. Reproduced with permission from the Royal Society of Chemistry.39
(c) Digital Microfluidics.
b a
c

8
1.5 Summary Table of Microfluidic Technologies
We hereby present a comparative table (Table 1.1) showing the state of microfluidic
techniques versus traditional sampling in multiwell plates and show the advantages that each of
these solutions offer in the market of miniaturization.
Table 1.1 – Comparative table assessing the state of miniaturization techniques.
Criteria Well-Plate Microchannel
Droplets-in-
Channel
Digital
Microfluidics
Cost of platform $1-2 per plate $5-10 PDMS
device
$5-10 PDMS
device
$6-10 per
substrate
Reagent volume μL-mL nL-μL pL-nL 100 pL-mL
Throughput High Moderate High Low
Automation ++ + + +++
Reprogramming + + + +++
External Parts Robotics Pumps & valves Pumps & valves None
Temperature
Control
+ + + +++
Operations on
device
None Dispensing,
separations,
valving
Dispensing,
mixing, splitting,
merging, sorting
Dispensing,
mixing, splitting,
merging
No. of Scientists
in the Field
> 100,000 > 1,000 < 1000 < 30

9
Chapter 2. Special Focus on Digital Microfluidics
This chapter will provide an in-depth review of DMF theory, venting its merits as a
versatile liquid handling platform, describe the fabrication methods, assess the potential for
automation and finally comment on its amenability to cell culture.
2.1 Digital Microfluidic Theory
In the broad realm of biomimicry, scientists have been eager to control the surface
wettability by fluids, in a similar way that nature has engineered “self-cleaning” lotus leaves or
“fog-collecting” Stenocara beetle.14 From this research drive emerged a phenomenon known as
“electrowetting”, by which a solid surface’s wettability can be altered using electric potential.40-42
Electrowetting-on-dielectric (EWOD) is a phenomenon that can be applied to control aqueous
liquids by varying the electric energy across the micron-thick dielectric layer separating the liquid
and the conducting substrate.42 This phenomenon can be translated to a driving mechanism, where
liquids can be shaped and driven along a path of electrodes. Fluid position can therefore be
modulated by placing droplets on an array of electrodes coated with an insulator.14 Electrical
potential can be applied sequentially to adjacent electrodes on a path, and the droplets carrying
various reagents can be moved on that array on-demand.
The reigning forces in EWOD can be separated into driving and resistive forces. The
earliest theoretical attempts for estimating the driving forces were based on a thermodynamic
approach using the Young-Lippman equation:

10
Equation 2.1: Young-Lippman Equation
𝐜𝐨𝐬 𝜽𝒘 = 𝐜𝐨𝐬 𝜽𝟎 +𝜺𝟎𝜺𝒓𝑽𝟐
𝟐𝜸𝒕
where θw and θ0 are the wetted and static contact angles, respectively; ε0 and εr are the permittivities
of free space and of the dielectric, respectively; V is the applied voltage; γ is the liquid/filler media
surface tension (air or oil); and t is the dielectric thickness. In this model, it is assumed that droplets
are moved due to capillary pressure resulting from asymmetric contact angles across the droplet.
In Equation 2.1, the contact angles are static and do not account for droplet motion after
deformation. Therefore, the driving force F in this model can be expressed as:
Equation 2.2: Driving force using Young-Lippman
𝐅 = 𝐋𝜸𝑳𝑮(𝐜𝐨𝐬 𝜽𝒘 − 𝐜𝐨𝐬 𝜽𝟎) =𝜺𝟎𝜺𝒓𝑳𝑽𝟐
𝟐𝒕
where F is the driving force and L is the length of the contact line overlapping the actuated
electrode. This driving force is often referred to as the “EWOD force”.
The term “Digital Microfluidics” emerged upon the realization that the theory behind
electrowetting does not apply to fluids with low surface tension, given that such liquids are readily
moved on electrodes but do not exhibit a significant change in contact angle – this empirical result
showed that large changes in contact angles are not a requirement for droplet movement. In
addition, the thermodynamic approach fails to explain the liquid-dielectrophoretic force, which is
predominant at high frequencies.
In fact, the wetting is an observable effect of the forces acting on the droplet. The most
accurate way to estimate the forces on the droplet in DMF is to use a circuit diagram and adopting
an electromechanical approach. The amount of energy stored in this system is calculated as a

11
function of the applied voltage frequency and droplet position along the direction of translation.
Here is the Equation 2.3 representing the amount of energy, E, of the system:
Equation 2.3: Energy equation using electromechanical model
𝑬(𝒇, 𝒙) = 𝑳
𝟐(𝒙 ∑
𝜺𝟎𝜺𝒓𝒊,𝒍𝒊𝒒𝒖𝒊𝒅𝑽𝒊,𝒍𝒊𝒒𝒖𝒊𝒅𝟐 (𝒋𝟐𝝅𝒇)
𝒅𝒊+ (𝑳 − 𝒙) ∑
𝜺𝟎𝜺𝒓𝒊,𝒇𝒊𝒍𝒍𝒆𝒓𝑽𝒊,𝒇𝒊𝒍𝒍𝒆𝒓𝟐 (𝒋𝟐𝝅𝒇)
𝒅𝒊𝒊𝒊
)
where L is the dimension of the droplet (estimated by the cross-section of the drop), εri,liquid, Vi,liquid
and εri,filler, Vi,filler are the relative permittivity and voltage drop for the liquid and filler fluid portions
of the electrode, respectively, and di is the thickness of layer i (corresponds to the dielectric,
hydrophobic, liquid or filler layers). Differentiating the energy calculated in Equation 2.3 with
respect to x yields the driving force as a function of frequency:
Equation 2.4: Force equation using electromechanical model
𝑭(𝒇) =𝝏𝑬(𝒇, 𝒙)
𝝏𝒙=
𝑳
𝟐(∑
𝜺𝟎𝜺𝒓𝒊,𝒍𝒊𝒒𝒖𝒊𝒅𝑽𝒊,𝒍𝒊𝒒𝒖𝒊𝒅𝟐 (𝒋𝟐𝝅𝒇)
𝒅𝒊− ∑
𝜺𝟎𝜺𝒓𝒊,𝒇𝒊𝒍𝒍𝒆𝒓𝑽𝒊,𝒇𝒊𝒍𝒍𝒆𝒓𝟐 (𝒋𝟐𝝅𝒇)
𝒅𝒊𝒊𝒊
)
The key advantage of the electromechanical model is that it takes into account the frequency of
the applied voltage on droplets across each layer and portion of the device – it represents the stored
energy that results in an applied force.
From this, we can calculate a critical frequency (fc) for each device geometry and the
liquids being operated.43 Below the critical frequency, we can apply the equations relative to the
EWOD model. The force that is driving the droplet at low frequencies comes from charges
accumulation near the three-phase contact line, which are being pulled toward the actuated
electrode electrostatically. The magnitude of this force depends on the capacitive energy stored
within the dielectric. When we apply frequencies above fc, an electric field gradient is generated

12
across the droplet, generating a liquid-dielectrophoretic force to pull the droplet toward the
activated electrode. Here, the magnitude depends on the difference in permittivity between the
liquid and filler medium (air, in our case). In DMF, droplets are manipulated by AC frequencies
in the order of kHz and the majority of the voltage drops across the dielectric. When inserting this
range of frequencies in Equation 2.4, we obtain an estimation of DMF forces with magnitudes in
the range of N, which can be applied to a wide range of fluids using driving voltages of 100-
300VRMS.
The driving electrostatic forces acting on the drop compete with counteracting forces. The
first is the shear force between the droplet and the plates,44, 45 which is highly dependent on local
surface smoothness and heterogeneity, dictated by the quality of dielectric and hydrophobic
coating and resulting nano- and micro- scale roughness of the hydrophobic surface. The second
factor impeding droplet movement is the viscous drag force resulting from displacement of the
filler fluid during droplet translation.45 As soon as the driving force is greater than both the shear
and viscous drag forces, droplet movement can be observed. Overcoming such movement
limitations is critical in enhancing droplet movement, and the optimization lies in surface
characterization, use of surfactants, device design and the device hydrophobicity.
We must note that for most DMF systems, the forces calculated by electrowetting and
electromechanical models reach consensus. In this thesis, we are manipulating conductive liquids
(media charged with salts) in air, which makes the energy stored in the filler portion of the
electromechanical model negligible in comparison to that in the liquid portion (𝜀𝑟𝑖,𝑙𝑖𝑞𝑢𝑖𝑑 ≫
𝜀𝑟𝑖,𝑓𝑖𝑙𝑙𝑒𝑟). In addition, the energy that is stored in the liquid layers are negligible in comparison to
that stored in the dielectric layer (𝑑𝑑𝑖𝑒𝑙𝑒𝑐𝑡𝑟𝑖𝑐 = 7𝜇𝑚 𝑣𝑠. 𝑑𝑙𝑖𝑞𝑢𝑖𝑑/𝑓𝑖𝑙𝑙𝑒𝑟 = 140𝜇𝑚).

13
Figure 2.1 – Single-plate and two-plate configurations for DMF.
(Image obtained from Choi et al.46)
2.2 Digital Microfluidics and Automation
The greatest advantage of digital microfluidics is perhabs its amenability to integrating
automation systems47, 48 and coupling the platform to external detectors (or internal in-line
detectors49, 50) for real-time or downstream biological analysis. 51, 52 The core of DMF automation
systems interfaces with a DMF device which enables droplet movement with a standard set of
basic instructions written by the user. The user will interact with the graphical user interface (GUI)
to program a set of instructions to dispense, move and split droplets, merge droplets together and
to mix resulting samples and sort droplets for analysis (Figure 2.2). Such automation gives DMF
the capacity to operate droplets in parallel on a single device, without the need for any valves or
pumps.

14
Figure 2.2 – Operations performed on a DMF device.
(Image obtained from Choi et al.46)
Typically, DMF automation systems rely on an array of relay switches, each of which is
responsible for one individual electrode on the device and relays AC or DC voltages to it when
instructed. The state of the switches is controlled through a computer and microcontroller.
Specifically, our automation system (Figure 2.3) consists of a MATLAB program (Figure 2.4) that
is used to control an Arduino Uno microcontroller. Driving input potentials of 130-270 VRMS are
generated by amplification of a sine wave output from a function generator operating at 10 kHz by
an amplifier and delivered to the PCB control board. The Arduino controls the state of high-voltage
relays that are soldered onto the PCB control board. The logic state of an individual solid-state
switch is controlled through an I2C communication protocol by an I/O expander. This control board
is mated to a pogo pin interface (104 pins), where each switch delivers a high-voltage potential (or
ground) signal to a contact pad on the DMF device. See our GitHub registry
(https://github.com/shihmicrolab/Automation) to assemble the hardware and to install the open-
source software program to execute the automation system.

15
The ideal result of the DMF automation system is that every set of instructions would
equate to a droplet movement (e.g., mix, dispense, split) towards the energized electrode.
However, due to surface heterogeneity or roughness or the contents of the droplet, every
application of a potential does not easily translate to a movement on the device. This behaviour is
exacerbated when the droplet constituents contains cells or proteins as they tend to ‘biofoul’ the
surface and render the device useless over a few actuations.53, 54 Appendix A describes our
published work in trying to alleviate this issue, through use of an image-based feedback system to
monitor droplet movement in real-time and overcome droplet failure by providing additional
driving voltages until the droplet completes the desired operation.55
Figure 2.3 – Digital microfluidic automation system.

16
Figure 2.4 – Graphical User Interface.
2.3 Digital Microfluidics and Cell Culture
Numerous cell-based applications have been explored on microfluidic platforms, with the
majority of these studies being conducted in microchannels. Microchannels are very useful in
establishing well defined chemical gradients due to the laminar flow of the system.56 Droplets-in-
channel have also been widely used for cell-based assays, whereby the encapsulation of 103 to 106
single cells in isolated droplet microbioreactors has been popularized for high-throughput
genomics, transcriptomics and single-cell sequencing.10, 57, 58 Finally, digital microfluidics has
been rapidly developing cell-based applications, popularized by its ability to rapidly reconfigure
fluid handling on-demand to manipulate cells and reagents in a highly controlled manner.59-61
In recent years, DMF has been shown to be amenable for two-dimensional cell culture,
showing great promise for miniaturizing cell culture and assays. DMF has been growing in
popularity for cell-based applications because it enables precise manipulation of droplets of
17
different reagents with different volumes, the possibility to rapidly reconfigure fluidic paths using
a software-friendly automation system, handle cells with very low shear stress and the possibility
of integration with other external equipment for real-time monitoring and downstream analysis.
Compatibility for the culture of suspension cells in liquid media was initially shown in 2008 with
Jurkat T-cells, with droplets containing cells being manipulated on a hydrophobic surface resistant
to adhesion – validation was performed by assessing cell viability, which was shown to be
comparable to macroscale (96-well plate) cell culture.60 Such miniaturization resulted in 100-fold
reductions in reagent volumes. The two-plate format of DMF proves microvessel
compartmentalization, where droplet mixing by translation allows for cell growth, and droplet
splitting and merging enables dilutions and cell passaging.
DMF was initially problematic for adherent cell culture given the hydrophobic nature of
the surfaces, being incompatible with cell adhesion. Preliminary studies on surface
functionalization were performed using dried extracellular matrix protein spots to overcome the
hydrophibicity of DMF devices.60 In this system, adherent mammalian cells were successfully
grown, subcultured and transfected. However, the reproducibility of such culture protein spots was
low, which posed a problem for replicating experiments. To overcome this challenge, a
microfabrication procedure was developed to create hydrophilic spots on the hydrophobic top-
plate by a fluorocarbon lift-off technique.62 This technique has also been demonstrated for culture
of immortalized cell lines and was particularly successful at culturing more sensitive cell types (ie:
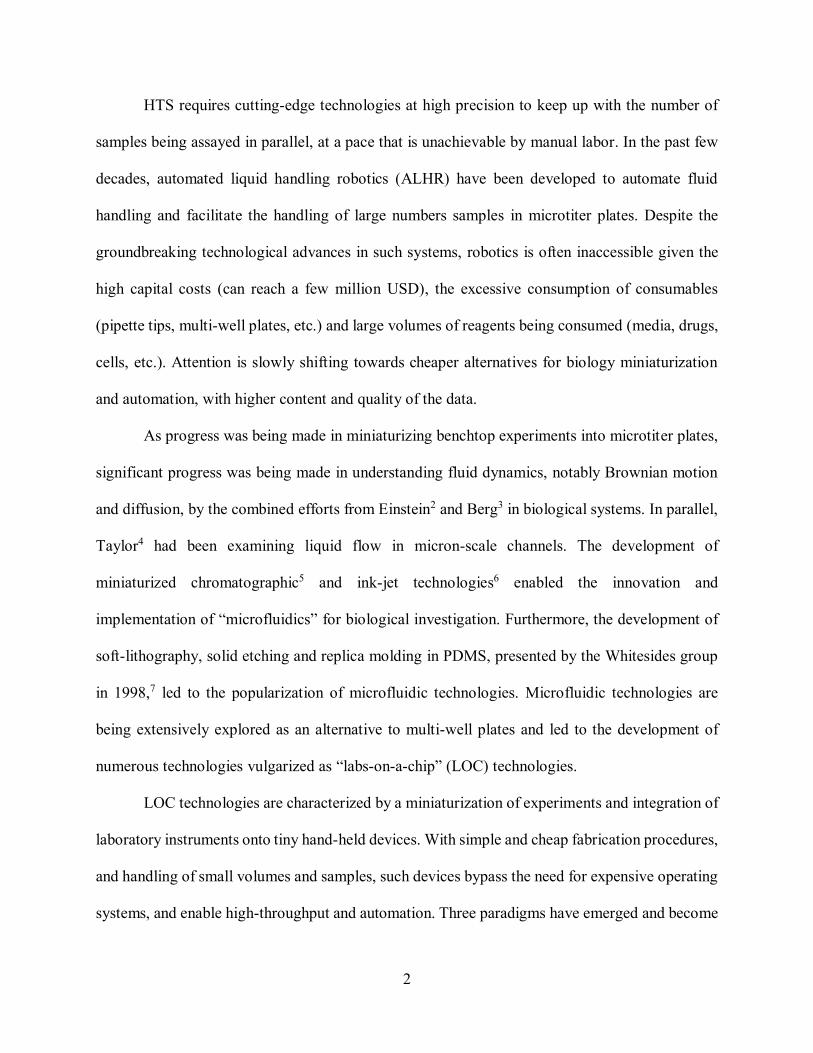
primary cells). Top-plate surface functionalization enabled separate functions for both plates, with
the continuous electrode-bearing top-plate responsible for adherent cell culture and the patterned
electrode-bearing bottom-plate responsible for fluid handling (Figure 2.5). Such a development
led to the discovery of a new fluidic phenomenon, coined “passive dispensing”, which refers to

18
the pinning of a portion of a droplet to the hydrophilic site when a bigger droplet is translated
across that site (Figure 2.5).63 The formed sub-droplet acts as an individual microwell, in which
cell-based experiments can occur. Passive dispensing enabled precise cell seeding and subsequent
media and reagent exchange.
19
Figure 2.5 – DMF Cell Culture Strategy.
(a) Two-plate DMF design with cell culture sites on the top plate. (b) Side-view schematic showing
adherent cells culture on the top-plate. (c) Microscopy image of a confluent microwell. (d) Frames
from a video depicting the process of passive dispensing, producing a microwell.

20
Chapter 3. Gene Editing and Thesis Objectives
We hereby review the biological stakes that we will be addressing with our platform,
presenting gene editing techniques with a special focus on CRISPR-Cas9 in the context of cancer
research, and comment on the technological limitations in operating CRISPR-Cas9 today. This
commentary will lead to the presentation of my thesis objectives.
3.1 Introduction to Gene Editing Techniques
Systematic loss-of-function screens and precise tweaking of the human genome is
attracting an immense attention for the functional characterization of elements inherent in genetic
pathways, the identification of components of cellular signaling pathways and the repair of
mutated genes.64 The Online Mendelian Inheritance of Man database (OMIM,
http://www.omim.org/) serves as an online catalog of human genes and genetic disorders and
shows that out of the approximately 20,000 annotated genes, 3,890 genes have already been paired
with disease phenotypes. With the rapid drop in sequencing costs, the collaborative efforts around
gene annotation projects (i.e.: the human genome project) and the development in sequencing
methods from genomes of diseased individuals, there has been an exponential growth in the
knowledge of the biological functions encoded in the genome and on the genetic basis of inherited
diseases and cancer.65, 66 Such a genomic revolution has poised researchers to rapidly develop new
methods to determine the influence that genotype has on phenotype, thus providing great promise
for genomics in medicine. Thus far, the most common gene therapeutic strategies are viral gene
therapy, where original gene function is restored through retrovirus action,67 and RNA interference
that target the pools of cytoplasmic mRNAs for repression of defective genes by directed knock-

21
down of the transcript.68 Both of these strategies are limited in many respects, such as
dysregulation at the transgene integration site with gene therapy or only partial, transient and
unprecise repression of gene expression by RNAi.69, 70 Such limitations have stressed the
development of new technologies to precisely regulate gene expression at the genome level.
Introducing genomic sequence changes in a targeted manner into living cells is also a
potential avenue for therapy of genetic diseases.71 Novel gene editing technologies are thus critical
to increase the proficiency of such screens and therapies. Therapeutic genome editing in diseased
cells and tissues to remove or correct deleterious mutations are being actively explored since the
development of genome editing technologies based on programmable nucleases,66 notably zinc
finger nucleases (ZFNs),72 transcription activator-like nucleases (TALENs)73 and clustered
regularly interspaced short palindromic repeat (CRISPR)-associated nuclease Cas9.74 These three
technologies are characterized by a DNA-binding motif and a DNA-cleavage module, and generate
double-strand breaks (DSBs) at the target loci, stimulating cellular DNA repair mechanisms
including error-prone non-homologous end joining (NHEJ) or homology-directed repair (HDR).
75, 76 Both these mechanisms result in genomic disruption, deletion, correction or addition at the
targeted loci.

22
3.2 Special Focus on CRISPR-Cas9
First discovered in prokaryotes, the type II CRISPR-Cas9 adaptive immune system was
shown to facilitate RNA-guided site-specific DNA cleavage of foreign genetic elements, including
plasmids or phage-injected viral RNA.77 Similar to the adaptive immune system in humans which
relies on memory T cells for rapid elimination of any returning foreign antigens, bacteria have a
similar mechanism to cope with returning foreign nucleic acids. Initial studies performed in S.
thermophiles identified Cas9 as a key player for defense against viral invasion, by cutting the
foreign plasmid or phage. Further studies revealed a genomic CRISPR locus, with upstream
transactivating CRISPR RNA (tracrRNA), the cas operon with genes encoding various cas proteins
and the CRISPR repeat-spacer array, consisting of the crRNA. Such bacterial systems utilize an
RNA duplex, tracrRNA:crRNA, that base pairs with the viral or plasmid foreign species and
recruits the Cas9 endonuclease to generate a site-directed double stranded break.78 In further
research, the dual RNA was engineered as a single guide chimera RNA (sgRNA) with a seed
sequence at the 5’ end and the dCas-handle structure at the 3’ end to bind Cas9.79 Next, the
discovery of inherent repair machinery to mediate the repair of DSBs that would otherwise be
lethal led to an unprecedented strategy for targeted genetic engineering.80 The advent of such a
technology enables the systematic interrogation of gene function in mammalian cells, study of
genomic rearrangements and the progression of cancer and other diseases and shows great promise
in gene therapy and personalized medicine.78, 81, 82
Since its discovery, the CRISPR-Cas nuclease system has been used in numerous
organisms including mouse and human cell lines.77, 83, 84 The popularity of this system can be
attributed to its specificity, efficiency, ease of reprogramming and given that it is well suited for
high-throughput and multiplexed gene editing.85, 86 In the two component CRISPR-Cas9 system,

23
an sgRNA directs the Cas9 nuclease to a specific DNA target region where the nuclease gets
activated and acts as a pair of genetic scissors to introduce a double-strand break.87 Designed
sgRNAs directs and targets Cas9 to a 20-22 bp DNA target region using Watson-Crick base
pairing. The system we are utilizing, CRISPR-Cas9, has a prerequisite for its target DNA – it must
immediately precede a 5’-NGG protospacer-adjacent motif (PAM) sequence which is essential for
Cas9 activation. Two cellular mechanisms follow to address the double-strand break and attempt
repair (Figure 3.1). In the first scenario, NHEJ leaves scars in the form of insertions/deletions
(indels), which enables loss-of-function mutations into the genome at specific target genomic
loci.85, 88 NHEJ is harnessed to mediate gene knockouts, given that indels inserted within exons
can produce frameshift mutations and premature stop codons, thereby inhibiting protein expression
at the gene level.89 Furthermore, an exogenous donor DNA can be added to the system to leverage
homology directed repair (HDR) for precise, defined genetic modifications at your target region.
Figure 3.1 – Endogenous DNA dsBreak repair mechanisms promoting gene editing.
Reproduced with permission from Springer Nature.

24
3.3 CRISPR-Cas9 in Cancer Research
Recent efforts in cancer characterization are shifting towards a more personalized approach rather
than hierarchical classifications based on chemosensitivity experiments.90 Cancer is a
heterogeneous disease that highly differs in genetic makeup and relies on different pathways for
survival – this gives rise to a wide-range of potential responses to different anti-cancer agents.91,
92 One method that has been rapidly growing in interest is to use CRISPR-based screens to
systematically identify the genes that are required for the survival and proliferation of mammalian
cells.85, 91-97 Such a method enables complete and permanent inactivation of genes and can offer
insight into the genetic basis of the disease and lead to the identification of new drug targets.94, 98-
101 Several groups have reported successful editing of endogenous genes in cells in culture via
transfection of plasmid DNA102 or stable delivery into cells through the use of lentiviruses or other
retroviruses103. The advantages of the CRISPR-Cas9 system have generated immense interest in
using this approach for screens aimed at identifying potential drug targets for cancer treatment.94,
98-105
The most common format for these loss-of-function perturbations is in vitro ‘pooled’
screens94, 99, 103 relying on the delivery of Cas9 nucleases and a ‘pool’ of guide RNAs (sgRNAs)
into the cells by transfection or transduction. Pooled libraries enable screens that simultaneously
assess the effect of knocking out hundreds to thousands of individual genes at multiple loci in a
phenotypic readout, such as proliferation or metastasis assays. Although such developments
provide new opportunities for drug target identification and validation, interpretation of results in
a pooled format rely on differential representation of guide RNAs after vs before (as assessed by
Next-Generation Sequencing) and rely on enrichment of multiple guide RNAs as a validation of
target relevance.99, 104 Furthermore, the complexity of population dynamics, each cell being in

25
competition with many others, may contribute to biases resulting in higher relative abundance of
some perturbations compared to some others. An alternative to ‘pooled’ screens is to implement
‘arrayed’ screens where cells are genetically perturbed only with one known gene target.106, 107
This can potentially enable use of a wider range of cellular phenotypes to be investigated.108-110
Limitations of arrayed experiments are the associated costs (usually an order of magnitude more
expensive than pooled libraries111) since they require special facilities that use automation for the
handling of plates and the inefficient workflow that includes labor-intensive preparatory work to
build and produce individual guide libraries and transferring the samples to other platforms for
analysis. Thus, an automated and integrated platform that will culture cells for days, enable
efficient handling of mammalian cells and reagents, express the gene editing machinery targeting
an individual gene or locus in cells, and assay cell phenotypes will be beneficial for these arrayed-
type experiments to save overall costs and to improve the workflow that minimizes the time frame
between perturbation and measurement.

26
3.4 Technological Challenges in CRISPR-Cas9 Operation
Arrayed libraries are typically generated in multi-well plates, where each well contains a
virus or vector, or reagents with a guide targeting a specific gene. The tools used for these types
of experiments, such as automated robotics coupled with flow cytometry, can provide an
exploration of complex phenotypes arising from single perturbations. Despite their outstanding
features in reducing cell death or limiting off-target mutagenesis associated with editing,112, 113
these techniques suffer from three key limitations. First, available liquid handling technologies,
data acquisition equipment and data storage/processing systems have traditionally been expensive
and have large footprints that are well outside of the budgetary reach of many laboratories. In
addition, the programming software packages are not standardized between laboratories which
frequently discourages inter-disciplinary scientists and researchers to use robots as it usually
requires more time and effort to instruct a robot to perform a task. Second, liquid handlers for cell
culture and sample preparation have multiple sources of variability (especially at the nL volumes)
which can cause unintended perturbations related to the gene-editing process – e.g., different
volumes can alter cell growth resulting in unequal number of cells across wells of a plate. This
can pose variability issues with downstream analysis in terms of measuring transfection and
knockout efficiencies related to cell density. Third, there is a lack of standardization in assay and
in instrument set-up for flow cytometry and especially how flow data are analyzed and reported.
Thus, these approaches may present additional challenges to the already complex procedures of
gene editing.
With such high demand for gene editing and the incredible number of genes to be screened
to fully characterize diseases, technology must be at the cutting-edge. A strategy to alleviate the
challenges described above is to use flow-based microfluidics and fluorescent microscopy

27
techniques114-116. The development and maturation of these microdevices and optical techniques
have been a boon to be used for cell-based assays and genomics.117-123 Microfluidics allows the
manipulation of small volumes of liquids in nanoliter (or smaller) scales in interconnected micron-
sized dimension channels and enables the automated delivery of chemical stimulant to cells. The
resulting cellular responses can be imaged with fluorescent reporters or fluorescent labelling
techniques. For gene-editing assays, this includes delivery of Cas9 into the cells and visualizing
them via a fluorescence reporter or using Western blot techniques to determine if the Cas9 has
been delivered into the cell.124, 125 These methods offer an exciting new framework into gene-
editing, but do not incorporate two key steps in the gene-editing process. First, the serial nature
of flow-based microfluidics present challenges in delivering many reagents (i.e. lipids, DNA,
culture medium, drugs, etc…) needed for the gene-editing process. Indeed, valves can be
integrated into the PDMS-based microdevice, but this can be very complicated to setup (in terms
of alignment and insertion of tubing) and to operate.126, 127 Second, two key steps in gene editing -
cell culturing and analysis have been performed off-chip – i.e. the cells have been cultured in flasks
analyzed by flow cytometry. A standardized automated gene-editing platform that can automate
all the steps would improve the workflow.

28
3.5 Thesis Objectives
To address the challenges described above, we report here a new droplet-based method for
gene editing called microfluidic Automated CRISPR-Cas9 Editing (ACE) which can automate all
the steps for gene-editing – culture, delivery, and analysis. In this work, we report the application
of ACE to evaluate the well-characterized mitogen-activated protein kinase or extracellular signal-
regulated kinase (MAPK/ERK) pathway128, 129 downstream editing of the Raf-1 gene with and
without a Raf-1 inhibitor Sorafenib Tosylate. The results recapitulate what is known about the
pathway and its effect on cell viability, but the technique presented here shows that we are capable
of conducting an automated gene-editing workflow from cell culturing to analysis with an open-
source automation system coupled with a standardized pipeline to analyse the transfected/knockout
fluorescent cells. These results (to our knowledge) are the first of their kind and serve as examples
of what is possible for the future – a new technique for probing other types of cancer and serve as
a platform for ex vivo applications relating to personalized medicine that require automated cell
culture, transfection, CRISPR-Cas9 editing, and drug inhibition.
My research was segmented into four steps, described below in chronological order:
1. Chip design: The device layout was established for cell culture and optimized for
delivery of CRISPR-Cas9 components to cells.
2. Platform validation: Transfection conditions were optimized using a dummy
fluorescent reporter vector on-chip to obtain efficiencies similar to those in the multi-
well plate format.
3. Proof-of-Concept: All-in-one pCRISPR vectors targeting a stably integrated
fluorescent gene were used and knock-out efficiency on- and off-chip using a

29
phenotypic fluorescent readout were compared to establish the platform as an efficient
gene editing micromachine.
4. Application: To confirm the broad applicability of our platform, we performed a
proliferation assay coupling both CRISPR editing with drug inhibition to validate our
innovation’s potential in cancer research.
These results (to our knowledge) are the first of their kind and serve as examples of what
is possible for the future – a new technique for probing other types cancer and serve as a platform
for ex vivo applications leading to personalized medicine.

30
Chapter 4. Methodology: Operating Biology On-Chip
In this chapter, I will describe my methodology for integrating the biological processes
relevant to CRISPR-Cas9 gene editing on the ACE platform. Topics covered in this section are
CRISPR plasmid assembly techniques, macro-scale cell experiments. I will also describe device
fabrication, assembly, and operation with the automation system before reviewing methods for
microfluidic cell culture, transfection and knock-out. Finally, I will present the data analysis
methods, namely image processing and protein expression experiments.
4.1 Reagents and Materials
Microfluidic device fabrication reagents and supplies included chromium-coated glass slides with
S1811 photoresist from Telic (Valencia, CA), indium tin oxide (ITO)- coated glass slides, RS =15-
25 (Cat no. CG-61IN- S207, Delta Technologies, Loveland CO), FluoroPel PFC1601V from
Cytonix LLC (Beltsville, MD), MF-321 positive photoresist developer from Rohm and Haas
(Marlborough, MA), CR-4 chromium etchant from OM Group (Cleveland, OH), AZ-300T
photoresist stripper from AZ Electronic Materials (Somerville, NJ), DuPont AF from DuPont
Fluoroproducts (Wilmington, DE). Transparency masks for device fabrication were printed from
CADArt (Bandon, OR) and polylactic acid (PLA) material for 3D printing were purchased from
3Dshop (Mississauga, ON, Canada). General chemicals for tissue culture were purchased from
Wisent Bio Products (Saint-Bruno, QC, Canada). Invitrogen Lipofectamine 3000 Transfection
Reagent was purchased from Thermo Fisher Scientific (Waltham, MA). Unless specified
otherwise, general-use chemicals and kits were purchased from Sigma-Aldrich (St. Louis, MO).
Plasmids for this study were purchased from Addgene or donated (see Table 4.1) and primers were

31
purchased from Invitrogen (Waltham, MA), and genes (438 bp) were synthesized by IDT
(Coralville, IA) (Table 4.2). Sorafenib Tosylate was purchased from Selleckchem (Houston, TX).
Table 4.1 – Cells and Plasmids used in this study
Cells Genotype Source
E. coli DH5α
fhuA2 Δ(argF-lacZ)U169 phoA
glnV44 Φ80 Δ(lacZ)M15 gyrA96
recA1 relA1 endA1 thi-1 hsdR17
V. Martin
Cell Line Transgene Integration Source
NCI-H1299 (Human lung squamous cell
carcinoma dual-labeled stable) KanR
Genecopoeia
SL001
Plasmids Relevant characteristics Addgene #
mCherry2-N1 KanR 54517
All_in_one_CRISPR/Cas9_LacZ AmpR 74293
pSpCas9(BB)-2A-Puro (PX459) v2.0 AmpR, PuroR 62988
Table 4.2 – CRISPR Target Sequences
Custom pCRISPR
Plasmids Custom Sequence PAM Source
pCRISPR_eGFP_191 – / ACTGCACGCCGTAGGTCAGGG TGG This study
pCRISPR_eGFP_314 + / GCAACTACAAGACCCGCGCCG AGG This study
pCRISPR_eGFP_369 + / TCGATGCCCTTCAGCTCGATG CGG This study
pCRISPR_eGFP_497 + / TCAAGATCCGCCACAACATCG AGG This study
pCRISPR_eGFP_683 – / CCATGCCGAGAGTGATCCCGG CGG This study
pCRISPR_RAF1_94 + / GCCGCCCGAGAGTCTTAATCG CGG This study
PX459_eGFP_12-31 + / GGGCGAGGAGCTGTTCACCG GGG Genscript
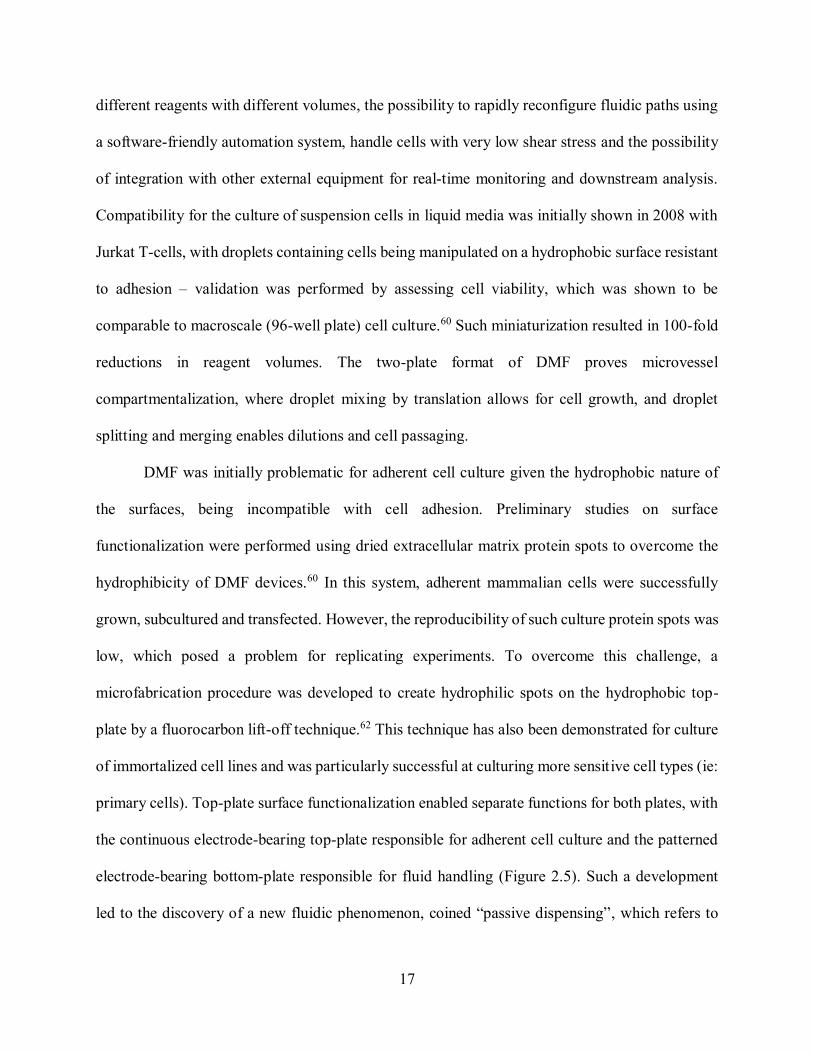
4.2 Plasmid Construction and Purification
CRISPR guide RNAs (gRNA) were synthesized (Figure 4.1) by IDT Technologies after being
designed via the Benchling online platform (https://benchling.com/), and were PCR amplified to
create g-blocks flanked with Esp3I type IIS restriction sites (see Table 4.3 for primers) Individual
PCR reactions consisted of 10 L 5X Phusion buffer, 1 L dimethylsulfoxide (DMSO), 20 ng

32
template DNA, individual dNTPs and primers to a final concentration of 200 M and 0.5 M each,
0.5 L Phusion polymerase and distilled water up to 50 L. The following PCR thermocycling
conditions were used: initial denaturation at 98 °C for 30 s followed by 35 cycles of denaturation
at 98 °C for 10 s, annealing at 55 °C for 30 s and extension at 72 °C for 30 s/kb, and a final
extension step at 72 °C for 10 min. PCR products were loaded into a 0.8% agarose gel in TAE
buffer and resolved at 130 V for 30 min. The corresponding bands from a gel (Figure 4.2) were
extracted using a gel extraction kit from BioBasic (Markham, ON, Canada). The one-step gRNA
cloning method was adapted from the Findlay et al. protocol.130 The gRNAs were assembled via
restriction digestion/ligation into the All_in_one_CRISPR/Cas9_LacZ backbone containing
Esp3I cut sites on both the 3’ and 5’ ends of LacZ gene fragment. Individual reactions consisted
of 25 ng of the g-Block (10 ng/L), 75 ng All_in_one_CRISPR/Cas9_LacZ1 L BsmBI (10
U/L), 1 L T4 ligase (Thermo Fisher, Waltham, MA), 2uL T4 buffer and nuclease-free water to
20 L total. The mixture was incubated in a thermal cycler at 37 °C for 5 min, 16 °C for 10 min,
37 °C for 15min and 80 °C for 5 min. Assembled products were heat-shock transformed into the
LacZ deficient DH5 E. Coli strain. The transformed products were grown on LB/S-Gal agar
blend and assembled products were discriminated by a color bias for colonies – blue colonies
contained the LacZ fragment required for S-Gal hydrolysis, whereas white colonies possessed
the g-block insert (i.e. without the LacZ gene). White colonies were picked and grown overnight
before being DNA purified and sent out for sequencing by Eurofins Genomics (Toronto, ON,
Canada). See Figure 4.3 for more details.

33
sgRNA 438 bp
5’ – ATTCCCCAGTGGAAAGACGCGCAGGCAAAACGCACCACGTGACGGAGCGTGA
CCGCGCGCCGAGCGCGCGCCAAGGTCGGGCAGGAAGAGGGCCTATTTCCCATGATTCCTTCATA
TTTGCATATACGATACAAGGCTGTTAGAGAGATAATTAGAATTAATTTGACTGTAAACACAAAGA
TATTAGTACAAAATACGTGACGTAGAAAGTAATAATTTCTTGGGTAGTTTGCAGTTTTAAAATTA
TGTTTTAAAATGGACTATCATATGCTTACCGTAACTTGAAAGTATTTCGATTTCTTGGGTTTATAT
ATCTTGTGGAAAGGACGAggatcNNNNNNNNNNNNNNNNNNNNNGTTTTAGAGCTAGAAATA
GCAAGTTAAAATAAGGCTAGTCCGTTATCAACTTGAAAAAGTGGCACCGAGTCGGTGCTTTTTT –
3’
Figure 4.1 – The sgRNA sequence represents the template designed for all sgRNAs.
It consists of the U6 Promoter, the variable seed sequence, the dCas9 handle and the S. pyogenes
terminator. The seed sequences varied according to the target region (see Table 4.2). All eight
constructs were synthesized by Integrated DNA Technologies, Inc. (Coralville, IA).
Figure 4.2 – PCR products of the synthesized CRISPR guides, yielding g-blocks.
PCR products were loaded into a 0.8% agarose gel in TAE buffer and resolved at 130 V for 30
min. These represent the g-blocks flanked with BsmBI cut sites, ready for insertion into a pCRISPR
backbone. (1) KRAS_5608; (2) KRAS_41162; (3) RAF1_94; (4) RAF1_253; (5) RAF1_64486; (6)
EGFP_191; (7) EGFP_314; (8) EGFP_369; (9) EGFP_497; (10) EGFP_683.
34
Table 4.3 – Primer sequences
Gene Orientation Sequence
g-block_universal Forward ATATATCGTCTCGAACTTGAAAGTATTTCGATTTCTTGGGT
g-block_universal Reverse ATAATTCGTCTCTAGCGCAAAACGCCTAACCCTAAGCAGATTCTTCATGCAATTGTGTCTAGAAAAAAGCACCGACTCGGTG
SP6 sequencing primers Forward ATTTAGGTGACACTATAG
Figure 4.3 – Blue-White Screening for pCRISPR All-in-one assembly.
A schematic showing the procedure of inserting a CRISPR guide into a Cas9 vector backbone. An
all-in-one pCRISPR template tailored to blue-white screening was used. The LacZα open reading
frame, necessary to complement Δ(lacZ)M15 for functional beta-galactosidase expression, was
inserted between two BsmBI flanking sites. One-pot assembly reactions containing the all-in-one
pCRISPR template, the restriction enzymes, the g-block and the T4 DNA ligase were placed in a
thermal cycler and the product was transformed into E. coli. Cells were plated on LB Agar with
S-Gal, a colorless substrate that gets hydrolyzed by beta-galactosidase and results in blue
bacterial colonies. Cells that were transformed with recombinant vectors of interest would be
white, and those transformed with non-recombinant vectors would be blue.

35
4.3 Macro-Scale Cell Culture, Transfection and Knock-Out
Human lung squamous cell carcinoma dual-labeled stable NCI-H1299 cell line was purchased
from Genecopoeia, Inc (SL001, Rockville, MD). H1299 cells were grown in RPMI 1640
containing 10 % fetal bovine serum with no antibiotics in a humidified chamber at 37 °C with 5%
CO2.
For macroscale transfection experiments, cells were seeded (1.0 x 10⁵ cells/mL) a day
before transfection (day 0) to reach 70-80% confluency in 24 well-plates. On day 1, 500 ng/L of
DNA were pre-mixed with 1 L of P3000 reagent in 25 L of Opti-MEM and added to 1.5 L
Lipofectamine 3000 that was pre-mixed in 25 L Opti-MEM. Lipids were then incubated with the
DNA at room temperature for 10 min to for lipid-DNA complexes. The complexes were pipetted
into each individual well containing the adhered cells. On day 2, after incubation, the lipid complex
with DNA was removed by aspiration and fresh complete media was replenished into the wells.
Cells were stained with Hoechst 33342 and incubated for 30 min on day 3. The cells were imaged
with a 20x objective on an Olympus IX73 inverted microscope (Olympus Canada, Mississauga,
ON, Canada) that has fluorescence imaging capabilities (Hoechst: ex = 350 nm and em = 461 nm;
GFP: ex = 488 nm and em = 509 nm; mCherry: ex = 585 nm and em = 608 nm). Fluorescence
images were further analyzed using the CellProfiler transfection pipeline.
For knockout experiments, the cell seeding followed the steps described in the transfection
experiments. For transfection (day 1), 600 ng/L of assembled pCRISPR plasmid (with the
inserted sgRNA) were mixed with the same reagent compositions as above (1:10 ratio of lipid
complexes to media in wells). After cells were maintained (i.e. replaced with fresh media) on day
3, cells were sub-cultured at a 1:4 ratio in a new 24-well plate on day 4 by washing the cells with

36
200 L of PBS and removing the cells with 150 L of 0.25 % trypsin-EDTA. Following further
maintenance on day 5, on day 6 the cells were stained with 1 M Hoechst 33342 and imaged using
the same microscope (and filters) for knockout analysis using the CellProfiler knockout pipeline.
Data were considered statistically significant at P < 0.05 using a student’s t-test.
4.4 Device Fabrication and Assembly
Digital microfluidic devices were fabricated following methods described previously.131, 132
Briefly, designs were drawn using AutoCAD 2015 (Autodesk, San Rafael, CA) and photomasks
were then printed in high-resolution (20,000 dpi) by CAD/Art Services Inc (Bandon, OR). The
bottom-plates bearing patterned electrodes were formed by standard photolithography techniques,
in the Concordia Silicon Microfabrication Lab (ConSIM). Chromium substrates coated with
photoresist were UV-exposed through the photomask (7 s, 42.4 mW/cm2) to imprint the
transparency mask designs. Substrates were then developed in MF-321 positive photoresist
developer (2 min, shaking), rinsed with DI water, dried under a stream of nitrogen and baked for
1 min at 115 °C. The exposed chromium was then etched using CR-4 chromium etchant (3 min)
and substrates were then rinsed with DI water and dried under a stream of nitrogen. Finally, devices
were immersed in AZ300T photoresist stripper (3 min) to remove any remaining photoresist before
being rinsed and dried under a stream of nitrogen. Once the patterning step was completed, the
substrates were immersed in a silane solution consisting of deionized water, isopropanol and 3-
(Trimethoxysilyl)propyl-methacrylate (50:50:1) for dielectric priming during 15 min. Substrates
were rinsed with isopropanol, DI water and then dried under a stream of nitrogen. Prior to the
addition of the polymer coatings to complete the process, thermal tape was added on top of the
contact pads to facilitate later removal of the polymer coatings from the contact pads and allow

37
electrical contact for droplet actuation. Parylene-C was used as a dielectric which was deposited
by chemical vapor deposition in a SCS Labcoter 2 PDS 2010 (Specialty Coating Systems,
Indianapolis, IN) achieving a homogenous final thickness of 7 m. FluoroPel PFC1601V was used
as a hydrophobic coating and was spin-coated in a Laurell spin-coater at 1500 rpm for 30 s
followed by post-baking on a hot-plate (180 °C, 10 min).
The DMF top-plates consist of a continuous ground electrode formed from an indium tin
oxide (ITO) coated glass substrate. For typical ground plates, ITOs were spin-coated with the
FluoroPel PFC1601V using the same program as described in the bottom-plate fabrication
procedure. ITOs bearing an array of hydrophilic spots (i.e., circular regions of exposed ITO) for
on-chip tissue culture were microfabricated using a fluorocarbon-liftoff procedure (following
procedures described previously.61, 133 ITOs were cleaned by immersion in an RCA solution
comprising of DI water, 28% aqueous ammonium hydroxide, 30% hydrogen peroxide (5:1:1 v/v/v)
for 30 min at 80 °C on a hotplate. After rinsing, drying and dehydrating (2 min at 95°C), the
substrates were spin-coated with Shipley S1811 photoresist (10 s, 500 rpm, ACL=100 rpm and 60
s, 3000 rpm, ACL=500 rpm) and baked at 95 °C for 2 min. Slides were cut to the desired size (i.e.:
50 x 75 mm) using a Cuter’s Mate (Creator’s Stained Glass, Victoria, BC) and vented under a
stream of nitrogen. Substrates were exposed through the photomask with an array of six 1.75 mm
diameter circular features (10 s, 42.4 mW/cm2) and developed in MF-321 (3 min). After rinsing,
air-drying and dehydrating (1 min, 95°C), top-plates were then flood exposed (10 sec, 42.4
mW/cm2), spin-coated with 1% Teflon in FC-40 (10 s, 500 rpm, ACL = 100 rpm and 60 s, 3000
rpm, ACL = 500), and post-baked on a hotplate (165 °C, 10 min). After allowing to cool on
aluminum foil for 2 min, substrates were immersed in acetone with gentle agitation for 10-15 s
until the Teflon-AF over the patterned sites was lifted off. After being rinsed with DI water and

38
dried under a stream of nitrogen, droplets of AZ300T stripper was gently placed over the spots and
substrates were placed aside for 1 min followed by rinsing with DI water and air-drying. Post-
baking followed to reflow the Teflon-AF at 165°C, 210°C and 300°C for 5 min at each
temperature. See Figure 4.4 for complete device fabrication schematic.
Complete devices were assembled with the continuous ground ITO top-plate and the
chromium electrode-bearing bottom plate, being joined by stacking two layers of double sided tape
to a gap height of approximately 140 m. Alignment of the ITO top plate above the bottom plate
was performed with care such that the edge of the top plate was adjacent to the outer-edges of the
reservoir electrodes of the bottom-plate pattern (see Figure 5.1). Moreover, each 25 mm x 75 mm
top plate was roughly aligned to the electrodes over which the virtual microwells were required.
Figure 4.4 – DMF Device Fabrication.
(a) Bottom-plate fabrication, positive photolithography. (b) Top-plate fabrication, lift-off
procedure.
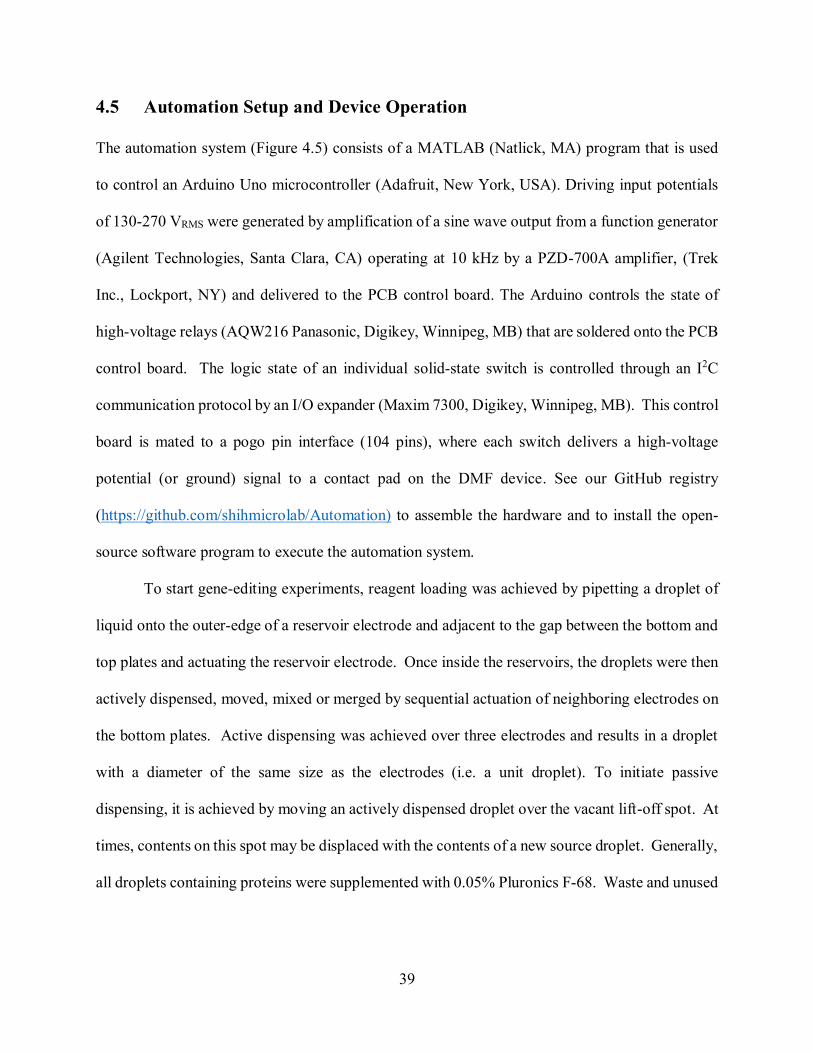
39
4.5 Automation Setup and Device Operation
The automation system (Figure 4.5) consists of a MATLAB (Natlick, MA) program that is used
to control an Arduino Uno microcontroller (Adafruit, New York, USA). Driving input potentials
of 130-270 VRMS were generated by amplification of a sine wave output from a function generator
(Agilent Technologies, Santa Clara, CA) operating at 10 kHz by a PZD-700A amplifier, (Trek
Inc., Lockport, NY) and delivered to the PCB control board. The Arduino controls the state of
high-voltage relays (AQW216 Panasonic, Digikey, Winnipeg, MB) that are soldered onto the PCB
control board. The logic state of an individual solid-state switch is controlled through an I2C
communication protocol by an I/O expander (Maxim 7300, Digikey, Winnipeg, MB). This control
board is mated to a pogo pin interface (104 pins), where each switch delivers a high-voltage
potential (or ground) signal to a contact pad on the DMF device. See our GitHub registry
(https://github.com/shihmicrolab/Automation) to assemble the hardware and to install the open-
source software program to execute the automation system.
To start gene-editing experiments, reagent loading was achieved by pipetting a droplet of
liquid onto the outer-edge of a reservoir electrode and adjacent to the gap between the bottom and
top plates and actuating the reservoir electrode. Once inside the reservoirs, the droplets were then
actively dispensed, moved, mixed or merged by sequential actuation of neighboring electrodes on
the bottom plates. Active dispensing was achieved over three electrodes and results in a droplet
with a diameter of the same size as the electrodes (i.e. a unit droplet). To initiate passive
dispensing, it is achieved by moving an actively dispensed droplet over the vacant lift-off spot. At
times, contents on this spot may be displaced with the contents of a new source droplet. Generally,
all droplets containing proteins were supplemented with 0.05% Pluronics F-68. Waste and unused

40
fluids were removed by delivering them to reservoirs and removed using KimWipes (Kimberly-
Clark, Irving, TX).
Figure 4.5 – Microfluidic automation system for gene-editing.
The automation system consists of a custom MATLAB program interfaced to an Arduino Uno
microcontroller. The Arduino controls the state of high-voltage relays on a switching control
board. Sine waves are generated from a function generator operating at 10kHz and amplified
using a high-voltage amplifier, producing driving input potentials of 130-270 VRMS to the control
board. The control of the state of an individual switch is done through an I2C communication
protocol using an I/O expander. The control board is mated to a pogo pin board, where each
switch is wired to an individual pogo-pin, in contact with a contact pad. The whole system is
imaged live through a CMOS camera.

41
4.6 Microfluidic Cell Culture, Transfection and Knock-Out
DMF was used to automate the protocols required for gene editing including cell seeding, culture,
lipid transfection, reagent delivery, staining, washing, and drug inhibition. In all droplet
manipulation steps, the device was oriented in standard configuration, with the top plate on top,
while in all incubation steps, the devices were inverted, with the top plate on the bottom and in a
3D- printed humidified chamber (Figure 4.6-a). Before seeding cells onto DMF devices (day 0),
cell cultures were grown in T-75 flasks and were rinsed with PBS, trypsinized and suspended in
10 mL of complete media. After centrifugation at 1,000 x g for 5 min, the cell pellet was suspended
in 2 mL of complete media (and supplemented with 0.05% w/v Pluronics F-68) such that the initial
concentration of cells is ~1.5 x 10⁶ cells/mL.
To seed and culture cells (day 0), 2 L of cells at 1.75 x 10⁶ cells/mL in culture medium
were pipetted onto the edge of the ITO and actively dispensed from the reservoirs into 690 nL unit
droplets. These droplets were sequentially passively dispensed on each vacant lift-off spot forming
285 nL droplets on the hydrophilic sites. The excess liquid from the spot was actuated to a waste
reservoir and removed with a KimWipe. The device was inverted and incubated in a 37 °C
incubator with 5% CO2 overnight allowing the cells to adhere onto the hydrophilic spot. In the
next 7 steps, a sequence of transfection reagents was mixed to form lipid complexes and delivered
(via passive dispensing) to each hydrophilic site that contains cells on day 1. (1) 1 L of
Lipofectamine was diluted in 25 L of Opti-MEM and premixed and 2 L was added to a reservoir.
(2) 500 ng/L of the plasmid DNA to be inserted and 1 L of P3000 reagent diluted in 25 L of
Opti-MEM was also added to another reservoir. (3) Both reagents were actively dispensed (360
nL each), merged and mixed in a square configuration using 2 x 2 electrodes and incubated for 10
min to form lipid complexes. (4) The lipid complexes were diluted in a 1:1 ratio by combining

42
with a 690 nL unit droplet of Opti-MEM. (5) After mixing, the complexes were delivered to the
cells via passive dispensing 6 x 285 nL and incubated for 24 h overnight. (6) The lipid complexes
on the cells were removed by passively dispensing 6 x 285 nL of fresh complete media. (7) After
24 h, 6 x 285 nL of 1 M Hoechst stain in liquid media was passively dispensed to each well and
fluorescence images were acquired to measure transfection efficiency. In transfection optimization
experiments, lipid:media ratios in step 4 were changed by performing serial dilutions – by splitting
the initial droplet containing the 1:1 diluted complexed DNA into two daughter droplets (360 nL
each) and mixing it with a unit droplet of liquid media (690 nL). mCherry transfection efficiency
was monitored on the device by microscopy, mounting the devices on a custom 3D-printed
microscope holder (Figure 4.6-b). Fluorescence images were further analyzed using the
CellProfiler transfection pipeline.
For assessing GFP knockout efficiency, 2 L of cells (~1.75 x 10⁶ cells/mL) were pipetted
onto the reservoir and a unit droplet was actuated to the vacant lift-off spot. After overnight
incubation, the adhered cells were transfected with 600 ng/L of pCRISPR (with the inserted
sgRNA) following the steps for transfection (steps 1-6). Cells were maintained until day 5 by
passively dispensing fresh media daily (6 x 285 nL) to each cell culture site. GFP knock-out was
monitored on the device by using microscopy and mounting the devices on a custom 3D-printed
microscope holder (Figure 4.6-b) to ensure healthy cells during image acquisition. On day 5, the
microwells were rinsed with PBS followed by 0.25% trypsin-EDTA by passively dispensing a unit
droplet across each well. Following incubation at 37°C for 5 min, the top-plate was disassembled
from the bottom-plate and 100 L of complete media was pipetted directly onto each hydrophilic
spot and transferred to an individual well of a 96-well plate and incubated for 2 days. On day 6, 1

43
M Hoechst stain in liquid media was added to each well and fluorescence images were acquired
to measure knock-out efficiency using the custom CellProfiler knock-out efficiency pipeline.
Figure 4.6 – 3D-Printed Humidified Chamber and microscope holder for imaging.
(A) Cell humidified chamber with cover to prevent evaporation of droplets. The design consists of
a rack above a water reservoir, on which the devices are placed and of a lid to prevent evaporation
and enable saturation in humidity. (B) Microscope holder tailored to digital microfluidic devices,
with opaque cover for fluorescence microscopy.

44
4.7 Cell Imaging and CellProfiler Pipeline
Top plates bearing stained and fluorescent cells were analyzed using an inverted Olympus
microscope. Typically, images were acquired using an Hamamatsu digital camera (Model C1140-
42U) camera with the HCImageLive software. We typically acquired images using a UV (250 ms
exposure time), GFP (500 ms), or mCherry filter set (1000 ms).
Images from the microscope were analysed using the open-source CellProfiler 2.2.0
r9969F42 software package (http://www.cellprofiler.org/).134 A custom pipeline was developed,
including image cropping, identifying individual and overlapping cells from Hoechst-stained and
mCherry fluorescent images, counting total number of cells, measuring the size and shape of cells,
creating binary images of the cells (i.e. black and white images), and comparing knocked-out and
non-knocked out cells (UV and GFP channels). For transfection analysis, the pipeline is divided
into four modules. In module 1, the software was instructed to smooth the Hoechst-stained image
with a Gaussian filter ( and uses the Otsu Global thresholding method to detect objects with
diameters of 20-100 pixel units (two classes, threshold correction factor = 0.8). Neighboring pixels
are grouped into objects and undesired clumped objects (i.e. two close overlapping objects) are
declumped using intensity segregation. In module 2, the software was instructed to threshold the
mCherry image to select cells that have the plasmid (threshold correction factor = 1) and binarize
the image to have black (corresponding to mCherry-negative) and white (mCherry-positive)
regions. In module 3, the software was instructed to overlap images from module 1 and 2 where
the image from module 2 served as a mask for the identified nuclei in module 1. All the nuclei-
stained cells (from module 1) overlapping with an mCherry-positive region (module 2) were
retained and counted which gave the total of transfected cells. In module 4, we use the equation
1:

45
Equation 4.1: Percentage of fluorescent cells
𝐸𝑓𝑓𝑖𝑐𝑖𝑒𝑛𝑐𝑦 (%) = [𝑜𝑣𝑒𝑟𝑙𝑎𝑝𝑝𝑖𝑛𝑔 𝑛𝑢𝑐𝑙𝑒𝑖 𝑡𝑜𝑡𝑎𝑙 𝑛𝑢𝑐𝑙𝑒𝑖⁄ ] × 100
The result corresponds to the proportion of mCherry-positive nuclei (i.e. transfected cells)
versus the total number or nuclei. Each data point was further corrected from the negative control
cells (i.e. non-transfected cells) using the same pipeline.
For the knockout pipeline, four similar modules were created to analyse knockout
efficiencies. In module 1, the software followed the instructions for the transfection pipeline. In
module 2, a GFP image was thresholded using the Otsu method (two classes, 0.65 threshold
correction factor). Module 3 consisted of overlapping the image with the image from module 2
serving as a mask for the image from module 1. Nuclei-stained cells that overlap with GFP-
positive cells (90% of its total pixels) were not considered as knocked-out cells. Module 4
followed equation 1 – total number of knocked out cells from module 3 divided by the total number
of cells obtained from module 1 to obtain knockout efficiencies.
4.8 Western Blot Experiments
Cells were transfected with the desired pCRISPR (with sgRNA inserts) plasmids in 10 cm dishes,
with reagents being scaled up from 24-well plates with a multiplication factor of 28.95. Dishes
were incubated until cells reached 90-100% confluency. Cell lysis buffer was prepared by adding
a tablet of protease and phosphatase inhibitors to 10 mL of Pierce IP Lysis Buffer (Thermo Fisher,
Waltham, MA). All subsequent solutions and consumables were placed on ice to prevent protein
degradation. Cell media was aspirated from the dish and cells were rinsed with 5 mL of ice-cold
PBS. Next, 750 L of ice-cold lysis buffer was added to the dish, and the Petri dishes were
incubated on ice for 5 min, with periodic mixing. The produced lysate was transferred to a

46
microcentrifuge tube (using a cell scraper) and centrifuged at 12 300 rpm for 10 min at 4°C. The
supernatant was transferred to a new tube and stored at -20°C. Protein concentration determination
was performed for each lysate using the manufacturer’s protocol for BSA Protein Concentration.
For the SDS-PAGE, 25 L of Laemmli Loading Buffer (Bio-Rad, Hercules, CA) was
added to 75 L of cell lysate, and placed on a heat block at 100 °C for 10 min while the samples
were returned to ice for 5 min. Bio-Rad pre-cast gels (Bio-Rad, Hercules, CA) were placed in the
Bio-Rad SDS-PAGE running apparatus (Bio-Rad, Hercules, CA) and the chamber was filled with
running buffer. Two gels were run in parallel loading different amounts of protein (20 g and 40
g), and the running apparatus was operated at 150 V for 60 min at 4 °C. The gels were then
removed from their cast and immersed in ice-cold transfer buffer for 10 min to equilibrate.
Nitrocellulose membranes and blotting paper were also immersed in transfer buffer to equilibrate.
The setup was stacked in a vertical orientation (sponge, blotting paper, gel, nitrocellulose
membrane, blotting paper, sponge) and clamped. The clamp was placed in the transfer apparatus
which was run at 82 mA at 4 °C.
After overnight transfer, the membranes were removed and placed face-up in PBS for 5
min on an agitator. Membranes were then immersed in LiCor PBS blocking buffer (Lincoln, NE)
for 1 h on a slow shaker. Next, the membranes were immersed in a 1:1000 mouse monoclonal
Primary Antibody solution (Abcam, Cambridge, MA) in 5 mL blocking buffer with 25 L Tween
20 (0.05%) on a slow-shaker overnight at 4°C. Antibodies used (Abcam, Cambridge, MA): Anti-
GAPDH antibody [mAbcam 9484] and Anti-Raf1 antibody [RNP1] ab50858. Membranes were
washed four times on a shaker with PBST for 5 min per wash, to remove any non-specific antibody
interactions. Membranes were then placed in a 1:10,000 secondary antibody solution (Abcam,
Cambridge, MA) in 10 mL blocking buffer with 50 L Tween 20 (0.5%) on a slow-shaker for 1

47
hour. Antibody used (LiCor, Lincoln, NE): IRDye 800 CW Goat Anti-Mouse (925-32210).
Membranes were washed 4 times on a shaker with PBST and once with PBS for 5 min per wash.
Membranes were immersed in PBS to prevent drying. Finally, the membranes were imaged with
the LiCor Odyssey Scanner using the ImageStudio program.
4.9 MAPK/ERK Pathway Experiments
MAPK/ERK pathway experiments consisted of two key components: CRISPR-Cas9 genomic
disruption of Raf1 and drug inhibition using Sorafenib Tosylate. In the macroscale, 0.75 x 10⁵
cells/mL of H1299 cells were seeded on day 0 in 24-well plates. 600 ng of the pCRISPR plasmid
targeting eGFP (control) or RAF1 was applied to the wells containing the cells on day 1. On day
3, drug conditions were added at different concentrations: 7.5
which were diluted in complete media. On day 5, 5 M
Calcein-AM violet stain (ex = 408 nm and em = 450 nm) diluted in 250 L fresh serum-free
media was added to the cells and incubated at 37°C for 30 min. The viability of cells was assessed
by performing a fluorescence well scan using the CLARIOStar well-plate reader. The measured
fluorescence was normalized to the control to determine the % viability.
Similarly, in the microscale, we followed the transfection protocol for seeding cells and the
7-step protocol for transfection of the pCRISPR plasmid containing sgRNA targeting eGFP or
Raf-1. The standard step 7 was replaced with step 7a and step 7b. In step 7a, Sorafenib Tosylate
in complete media were actively dispensed into unit droplets and then were diluted with complete
media to form six different concentrations 7.5 in
which one droplet (0.7 L was used to passively dispense onto each hydrophilic spot and the other
droplet was saved for future dilutions. After all cells were interrogated with the drugs, they were

48
incubated for 2 days. In step 7b, six unit droplets of 5 Calcein-AM violet stain were passively
dispensed to the cells and incubated for 30 min in which images were taken to count the cells using
the pipeline. The counted cells were normalized to the control (i.e. cell interrogated with no drugs).

49
Chapter 5. Validation of the ACE Platform
This chapter consists of my results and discussion. I will describe the four steps involved
in developing the ACE platform. First, device and experimental design troubleshooting was
essential to produce a DMF platform for gene editing. Next, the ACE platform was validated as a
robust on-demand transfection platform of nucleic acids. Proof-of-concept gene editing was then
performed by targeted CRISPR-Cas9 gene knock-out of a stably integrated GFP. Finally, the ACE
platform was demonstrated to hold promise in the identification of cancer genes, by applying it to
interrogate the MAPK/ERK pathway.
5.1 Device Design: DMF Platform for gene editing
There has been a wide variety of applications that use gene-editing techniques, particularly those
involving silencing genes or developing gene therapy techniques related to diseases.135-137 Such
applications would benefit from a miniaturized automated technique that is capable of integrating
the gene-editing process on one platform. Here, we present an automated CRISPR-based
microfluidic platform that is capable of culturing, editing, and analysing cells. We call this
platform “ACE” after the function of this platform – Automated CRISPR Editing.
The ACE platform was developed to automate the processes related to gene-editing and to
address the limitations in current techniques to evaluate genes related to a cancer pathway. ACE
relies mainly on digital microfluidics (DMF) that will automate the gene-editing processes through
its versatile liquid handling operations: dispense, merge, mix, and split droplets. This work builds
upon several DMF and cell-culture studies that have established proof-of-principle protocols.63,
138-140 To our knowledge, this is the first DMF-based technique that is capable of cell culturing,

50
gene editing, and image analysis for lung cancer cells, shown in Figure 5.1. Specifically, this
platform was tailored to rapidly deliver single-guided RNAs (sgRNA) in an all-in-one pCRISPR
plasmid format to effectively knockout targeted genes in lung cancer cells. The device was
customized with reservoirs for the necessary reagents for lipid-mediated transfection and
designated regions for incubation, along with a cell culture region to accommodate cell seeding,
healthy maintenance, and transfection (Figure 5.1). Genomic disruption can be assessed
phenotypically on the same device using a microscopy-based imaging analysis workflow to
determine plasmid delivery efficiencies through monitoring fluorescent protein expression and cell
viability using various fluorescent dyes. The device comprises of two parallel-plates separated by
a 140 m spacer. The bottom-plate consists of metal-patterned electrodes with dielectric and
hydrophobic layers and serves to manipulate the droplets containing the constituents for gene-
editing. One of the primary reasons for using DMF in this work is the individual addressability of
droplets that allows for controlled automated liquid handling on the device. However, a
continuous challenge with DMF is the reproducibility of droplet movement on the device,
especially for liquids that are high in viscosity (e.g., complete cell media). To alleviate this
challenge, there are studies that introduce chemical additives or an immiscible fluid to prolong
droplet movement.53, 141, 142 In this study, one of the primary challenges we initially observed is
that droplet movement of protein rich solutions (e.g., suspended cells) are difficult to move after
two days of culturing and maintenance (see Figure 5.2 for designs). This is problematic given that
typical gene-editing phenotypic readouts are usually observable beyond two days. Previous work
has shown that changing the electrode shape can enhance the driving force of the droplet. 143, 144
Here, we have modified the electrode design such that the boundary between electrodes are
interlaced and have added chemical additives in the droplet and observed that droplet movement

51
was improved and completed all the droplet movements necessary (~ 300 total movements for five
days) for cell culture and maintenance, and gene editing assay. As described from other studies,
the primary reason for this improvement could be due to the overlap of the droplet on the adjacent
electrode which increases the applied force on the droplet and thereby increases the velocity of the
droplet movement.145 This will minimize the time a droplet is on activated electrode which can
minimize biofouling on the hydrophobic surface and enable more actuations on the device.
The top-plate is responsible for adherent cell culture and relies on the microfabrication of
six 1.5 mm diameter hydrophilic sites. Typically, the cells in suspension are manipulated by
applying an electric potential. When moved across the hydrophilic spot, a fraction of the droplet
remains pinned to the hydrophilic spot and will serve as the cell culture microvessel – this
operation is called “passive dispensing”.146 The delivery of cells to these hydrophilic spots will
enable cells to adhere, spread, and proliferate in an upside-down configuration (i.e. top plate on
the bottom).62, 147-149 To prevent evaporation, devices are incubated in a 3D printed humidified
chamber (Figure 4.6). After the cells are fixed, the device is flipped to its standard configuration
and at designated periods, the cells are transfected with CRIPSR-based plasmids that are
complexed in lipid vesicles for efficient delivery of exogenous material to the cells. As shown in
Figure 5.3 successful gene-editing in individual cells using our method occur when cells co-
express both the Cas9 and the sgRNA that assemble into a ribonucleoprotein (RNP) complex and
is delivered to the nucleus for targeted cleavage. The complex will seek the target sequence,
complementary to the seed sequence, using the designed sgRNA and will cleave the target DNA
which results in a double stranded break and ideally causing a knockout. For downstream analysis,
the cells are incubated and labeled with a fluorescent dye delivered in liquid media by passive
dispensing to determine efficiencies of transfection and gene knockout. Using a custom 3D-
52
printed microscope holder (Figure 4.6), images of the top plate containing cells (without
disassembling the device) are captured which can be analysed by CellProfiler to calculate the
percentage of transfected or knocked-out cells to the total number of cells.134 There have been
previous five other studies which have cultured adherent cells with DMF, but this is the first time
that lung cancer cells have been cultured, edited, and analysed on such a platform. Using the
passive dispensing technique, we tested the reproducibility and viability of the lung cancer cells
on the hydrophilic spots. A significant amount of trial-and-error was required to ensure cells were
healthy and growing to enable gene-editing. Factors such as cell seeding density and microwell
culture volume are critical to the maintenance of the cell viability and morphology on the device.
Cell densities between 1 – 2 x 10⁶ cells/mL were seeded and maintained over five days by
exchanging media once per 24 h maintained viable lung cancer cells with appropriate
morphologies. Depending on the assay, the seeding densities were altered to ensure cells are ready
for the experiments. For example, for transfection optimization, cells were required to be 70-80
% confluent to ensure optimal transfection and therefore we seeded cells at a higher density – 1.75
x 106 cells/mL (see Figure 5.4 for gene-editing assay timeline). For longer term experiments –
such as knockout experiments which required 5-6 days – cells were seeded at a smaller density to
achieve the desired confluence for gene editing. At higher densities > 1.5 x 10⁶ cells/mL, the cells
reached confluency very quickly, resulting in cell senescence prior to endpoint knock-out
efficiency measurements.

53
Figure 5.1 – Schematic of the ACE Device.
(a) Top-view schematic of a digital microfluidic device used for cell culturing, transfection, gene-
editing, and analysis. (b) Side-view schematic showing adherent cells culture on the top-plate.
The cells are transfected using lipid-mediated delivery of plasmids and then measured for knockout
by imaging techniques.

54
Figure 5.2 – Optimization of chip configuration and electrode design.
(a) The first design shows a configuration with square electrodes. (b) The current design is
modified to have interdigitated electrodes to facilitate droplet movement.

55
Figure 5.3 – Step-by-step CRISPR-Cas9 knock-out process at the cellular level.
(1) Assembly of DNA-lipid complex, (2) endocytosis, (3) endosomal escape, (4) transduction of
Cas9 and sgRNA, (5) translation of Cas9 mRNA, (6) Cas9 ribonucleoprotein assembly, (7) nuclear
localization, (8) double-strand break, (9) DNA repair by non-homologous end joining and
subsequent genomic disruption by indels.

56
Figure 5.4 – Timeline showing the process of automated gene-editing on chip.
In red are the reagents added to the cell culture wells, and in green are the cell processing steps
– namely, transfection efficiency measurements and outgrowth in well-plates for downstream GFP
KO efficiency measurements on day 6.

57
5.2 Platform Validation: Transfection Efficiency
One of the advantages of digital microfluidics is its compatibility with external equipment and
amenability with microscopy techniques for cellular analysis. 53, 132, 150, 151 In this study,
microscopic imaging is used to analyse transfection and gene knockout of lung cancer cells on a
DMF platform. Fluorescence-based imaging is enabled by staining with fluorescent dyes or by
the integration of fluorescent proteins and the use of reporter genes (e.g., mCherry, GFP) which
can also help reveal information about cell state, phenotype and possibly provide some valuable
insight on gene expression. As shown in Figure 5.5, for each condition, two images (using UV
and mCherry filters) displaying fluorescently labelled cells are counted, thresholded, and
overlapped to measure the transfection efficiency. The simplicity of positioning the top plate on
the bottom (such that the top plate was adjacent to the objective) is unique to digital microfluidics
since there is no requirement of moving parts or tubing that may interfere with the imaging. Figure
5.6 shows a representative image that displays two overlapped fluorescent-labelled images grown
on the hydrophilic spot on DMF devices and for comparison, an overlapped image showing lung
cancer cells grown on standard 24 well-plates. As shown, the morphologies of the cultured cells
were similar on both surfaces.
Figure 5.5 – A schematic showing the imaging pipeline used for analyzing transfection.

58
Figure 5.6 – mCherry transfection of H1299 cells in well-plates vs. on DMF.
For gene-editing assays, transfection is typically a necessary procedure and the successful delivery
of sgRNA and Cas9 into cells is critical in producing double-stranded breaks at the target DNA.152
Lipid-mediated transfection remains popular due to the ease of use and its availability of reagents
on the market and is usually less harmful than electroporation techniques. 153, 154 One of the factors
that affects cationic lipid-mediated transfection is the bioavailability of lipids assembled with the
anionic nucleic acids or to the negatively supercharged proteins, which can be effectively directed
to and engulfed by a large proportion of target cells. Concentration of lipid reagents and of nucleic
acids are essential to maximize transfection efficiency while minimizing cytotoxicity. Seeking
validation of our platform for the transfection of nucleic acids, we generated the lipid-DNA
complexes by encapsulating an mCherry plasmid and delivering it to the cells on-chip to optimize
transfection and measure the delivery efficiency. A portion of the experiment is depicted in Figure
5.7. Briefly, droplets of diluted lipids and DNA are dispensed, merged, mixed, and incubated.
The droplet of complexed DNA-lipids is split and one droplet is used for passive dispensing to
transfect the cells while the other droplet is used for further dilutions on the chip.

59
Figure 5.7 – Video sequence depicting the transfection strategy on the ACE platform.
A video sequence from Supplementary Movie 1 depicting the mixing of lipids and DNA and the
passive dispensing procedure onto the hydrophilic spot. (i) Dispensing DNA and lipids from
separate reservoirs and merging both unit droplets, (ii) Mixing of DNA and lipids on a 2 x 2
electrode array, (iii) Incubation of complexes for 10 min, (iv) preparing the dilution by dispensing
a droplet of liquid media, (v) 1:1 dilution of lipid complexes in media and (vi) passive dispensing
of dilute lipids onto the cell culture spot.
We varied the dilutions of lipid complexes in media from 1:1 to 1:10 and determined that
transfection efficiency is highest (~65 %) when a ratio of 1:1 is delivered to the cells on chip. Off-
chip manufacturer’s protocols suggest 1:10 ratios as the optimal,155 however, low efficiencies
(~15%) are observed when this ratio is performed on chip (Figure 5.8). We additionally conducted
higher ratios (> 1:10) in well-plates, but observed that this ratio exhibited cytotoxic effects. We
hypothesize that signs of deterioration may be due to the presence of larger quantities of lipids

60
which may cause toxicity to the cells due to the increase in likelihood in forming higher charge
ratio complexes.156 While on device, higher ratios are preferred since the lower volumes and cell
densities require higher lipid complexes to media ratios for transfection to occur. As shown from
Figure 5.8 (inset images) and Supplementary Figure 5.9, the morphology of the cells at the 1:1
ratio is very similar to the 1:10 (and the other ratios) on device and do not show any signs of cell
detachment or toxicity. Next, with the optimal ratios for each platform (1:10 in well plates; 1:1 on
device), we assessed the transfection efficiency 24 to 48 h post-transfection.
Figure 5.8 – Optimization of the lipid complex to media ratio for transfection on device.

61
Figure 5.9 – Optimization of on-chip transfection by diluting lipid complexes in liquid media.
Overlapped eGFP and mCherry images show empirical transfection efficiencies for a range of
different ratios (1:10, 1:8, 1:6, 1:4, 1:2, 1:1). The 1:1 ratio shows highest transfection efficiency.
Scale bar = 0.5 mm.
As shown in Figure 5.10, we successfully delivered plasmids encoding mCherry to H1299 cells
using our device with transfection efficiencies that were highest after 48 h exhibiting ~74.7 %
6.8 compared to ~45.7 % 5.9 after 24 h. We also compared on-chip with well-plate techniques
and observed no significant differences (P > 0.05) in their efficiencies suggesting that DMF is a
suitable alternative platform for transfection.

62
Figure 5.10 – Transfection efficiency of mCherry2-N1 well-plates vs. DMF devices.
Error bars are ± 1 s.d. from n = 3 with *P < 0.05.

63
5.3 Proof-of-Concept: Knock-Out of Stably Integrated GFP
To test the efficacy of our ACE platform of achieving knockout of endogenous gene targets, we
used H1299 cells that stably express enhanced GFP (eGFP) at the AAVS1 harboring sites, where
there are no known adverse effects on cells resulting from the inserted DNA fragment.157 This
allows simple phenotypic readouts of gene knock-out using GFP fluorescence to monitor the
success of our platform in producing CRISPR-mediated genome editing. Initially, we performed
three experiments to test the starting material for transfecting Cas9: (1) directly transfecting the
Cas9 protein, (2) co-transfecting plasmids encoding Cas9 only and sgRNAs targeting GFP, and
(3) transfecting an all-in-one pCRISPR plasmid containing both the Cas9 and sgRNA. transfecting
the all-in-one pCRISPR plasmid enabled high levels of Cas9 expression in 24 h while protein
transfection showed low levels at 24 h. In the Cas9 protein transfected cells, the level of Cas9
protein peaked at the first measured time point 4 h, then rapidly decreased and is barely detectable
in the blot after 24 h.
Figure 5.11 – Cas9 protein levels in H1299 cells when transfecting different starting material.
Lipid-mediated transfection was done using three different starting materials (DNA and protein),
and lysates were collected at three different time-points (4, 24, and 72 h). Lane (1) shows pure

64
Cas9 protein to assess transfection of RNP complexes. Lane (2) shows Cas9 expressing plasmid,
pCas9, to assess co-transfection of pCas9 with an sgRNA plasmid. Lane (3) shows transfection of
pCRISPR all-in-one plasmid (Cas9 and sgRNA). A negative control was transfected with the
mCherry2-N1 plasmid and the lysate was collected after 24 h. The expected protein size of Cas9
is 160 kDa which is highlighted in red.
Upon realizing favorable expression patterns of the all-in-one pCRISPR plasmid, we opted for this
format given the stability of plasmid DNA as opposed to RNA and protein, the guarantee that
successfully transfected cells co-express both the sgRNA and the Cas9 protein as opposed to co-
transfection, and finally, the ease by which such plasmids are redesigned (Figure 4.1, Figure 4.3).
For proof-of-concept knock-out experiments, we targeted the GFP and analyzed the knockout
using a pipeline similar to the transfection pipeline (Figure 5.12-a). Briefly, a Hoechst stained
image and a GFP image (Figure 5.12-b) are processed by identifying nuclei and thresholding GFP
regions – overlapping these images will highlight all the nuclei that are not overlapping GFP-
positive regions, thereby being counted as cells exhibiting GFP knock-out. Comparing the number
of knock-out nuclei to the total number of nuclei allows for a calculation of GFP knock-out
efficiency.

65
Figure 5.12 – Imaging the knockout of stably integrated eGFP.
(a) A schematic showing the imaging pipeline used for analyzing knockout. (b) An image set
(Hoechst, GFP, overlap) processed by CellProfiler to assess eGFP knock-out efficiency.
We designed and assembled three pCRISPR plasmids that contain an sgRNA targeting different
loci in the GFP: upstream (sg_12), middle (sg_497), downstream (sg_683) where the number
represents the location of the base pairs for targeting (Figure 5.13). Cells were transfected with a
larger pCRISPR plasmid (~ 10.5 kb), with a reported transfection efficiency similar to a ~ 5 kb
mCherry plasmid (~ 60 % vs. 70 %, as seen in Figure 5.14) and knockout is observed on day 6.

66
Figure 5.13 – eGFP knockout design considerations.
Plasmid map of the pCRISPR plasmid used showing the transgene integration in NCI-H1299 and
sgRNA target regions of eGFP.
Figure 5.14 – Plot of the transfection efficiency for both the pCRISPR and mCherry2-N1.
All_in_one_CRISPR/Cas9_LacZ (pCRISPR) has a reporter mCherry gene under an SV40
promoter, and a CMV promoter was used for the mCherry plasmid. For the transfection, a 1:10
ratio of lipid complexes to media was used in 24-well plates. Images of the transfected H1299
cells were taken after 48 h and processed using the CellProfiler pipeline.
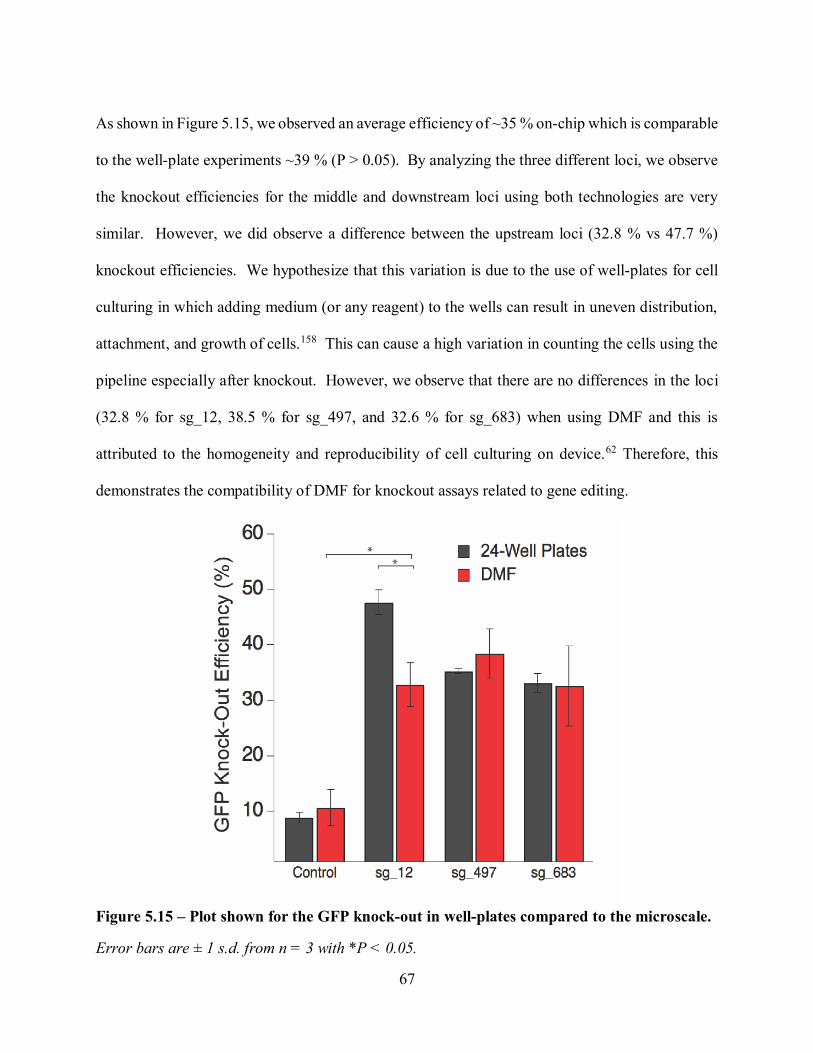
67
As shown in Figure 5.15, we observed an average efficiency of ~35 % on-chip which is comparable
to the well-plate experiments ~39 % (P > 0.05). By analyzing the three different loci, we observe
the knockout efficiencies for the middle and downstream loci using both technologies are very
similar. However, we did observe a difference between the upstream loci (32.8 % vs 47.7 %)
knockout efficiencies. We hypothesize that this variation is due to the use of well-plates for cell
culturing in which adding medium (or any reagent) to the wells can result in uneven distribution,
attachment, and growth of cells.158 This can cause a high variation in counting the cells using the
pipeline especially after knockout. However, we observe that there are no differences in the loci
(32.8 % for sg_12, 38.5 % for sg_497, and 32.6 % for sg_683) when using DMF and this is
attributed to the homogeneity and reproducibility of cell culturing on device.62 Therefore, this
demonstrates the compatibility of DMF for knockout assays related to gene editing.
Figure 5.15 – Plot shown for the GFP knock-out in well-plates compared to the microscale.
Error bars are ± 1 s.d. from n = 3 with *P < 0.05.

68
5.4 Application: Identification of Cancer Genes in the Ras Pathway
To evaluate the potential of using our platform for gene editing, we explored the relationship
between gene function and cell phenotype by studying a cellular signaling pathway. Cellular
signaling is an intricate process driving various cellular activities such as protein synthesis, cell
growth and cell senescence, which hold major implications regarding our understanding of tumor
cell behavior and progression.159 Specifically, the MAPK/ERK (or also known as RAS-RAF-
MEK-ERK) pathway is a highly conserved signaling cascade that plays a crucial role regulating
cell fate decisions and is often upregulated in human cancers.160, 161 The pathway is depicted in
Figure 5.16, where a tyrosine receptor kinase serves to relay extracellular signaling to individual
cells, through mitogen-activation. RAS and RAF genes are upstream components of the
MAPK/ERK kinase signaling cascade, and therefore are a nodal point in cell proliferation, flagging
them as potent oncogenes and natural targets for therapy. Generally, the RAS protein kinase gets
phosphorylated and activated and the resulting RAS-GTP will complex with RAF in the plasma
membrane. The order of subsequent events is still largely unknown, but a series of phosphorylation
and dephosphorylation enable the dimerization of Raf protein kinases, essential for the catalytic
activation of RAF.162, 163 Once activated, RAF kinases activate various effector proteins which
govern cell proliferation. RAF proteins have been studied for characterization of human cancer –
notably RAF1 (also known as c-RAF) was the first isoform to be identified as an oncogene, but
interestingly mutations of RAF1 are rare in human cancers.164 Uncertainties surrounding the
precise role of RAF1 have driven our interest in studying the effects of disrupting its encoding
gene. We initiated this by regulating RAF1 protein expression at both the gene level by CRISPR-
mediated knock-out and at the protein level by enzyme inhibition using protein inhibitor Sorafenib
Tosylate.165

69
Figure 5.16 – Identification of cancer genes in the Ras pathway.
Cartoon illustrating signal transduction in the Ras pathway that leads to eventual cell
proliferation. The red highlighted boxes show the targeted genes using sgRNAs and the added
drug (i.e. sorafenib).

70
To assess the coupled effects of genome editing and drug inhibition in the macroscale, we
transfected the H1299 cells with a pCRISPR targeting RAF1 or a control sgRNA and added 15
M Sorafenib Tosylate on day 2. Cells with RAF1 gene editing showed a minimum viability of
~50 % on day 4 over a 7-day experiment (Figure 5.17, Figure 5.18). However, after day 4, cell
viability levels started to increase while cells interrogated with both pCRISPR and sorafenib
maintained low basal viability levels (~25 %) after day 4. We hypothesized that this may be due
to the heterogeneity of the cell population after transfection and knock-out, thereby allowing non-
knocked out cells to continue proliferating. Evolving the Cas9 enzyme to be more versatile166 or
using other types of RNA-guided endonucleases167 can perhaps alleviate these lower efficiencies.
Figure 5.17 – Raw data showing absolute fluorescence and the morphology of H1299 cells.
Four conditions were tested, and microscopy fluorescent images were captured on day 5 using
GFP filter set.

71
Figure 5.18 – Plot showing progression of cell viability over time.
Four conditions were tested by acquiring fluorescent measurements were over 7 days to assess
proliferation. Cells were transfected with either an sgRNA targeting RAF1 or a scramble
sgRNA, and drug Sorafenib Tosylate or DMSO and was added 48 h post-transfection. All
reading were taken in triplicate and error bars represent ± 1 s.d.

72
To confirm the effects of targeting RAF1 by genome editing and enzymatic inhibition,
H1299 cells were cultured, edited, assayed and analysed on the ACE platform following
procedures for measuring transfection and knockout efficiencies. Images of the lung cancer cells
that were transfected with pCRISPR targeting RAF1 and labeled with Calcein-AM were analysed
using an imaging pipeline (Figure 5.19). Figure 5.20a (using ACE) shows a dose-response curve
for Sorafenib Tosylate, illustrating the cell viability of the edited H1299 cells. We examined the
effects of RAF protein kinase inhibitor Sorafenib Tosylate with and without CRISPR-mediated
RAF1 targeting. For the case with CRISPR-mediated RAF1 targeting, the edited H1299 cells
showed sensitivity in the linear micromolar range (~7-35 M) upon treatment of sorafenib (similar
to previous studies168). In addition, the viability of cells decreased compared to the control which
only targeted eGFP. Specifically, the fitted dose-response curve based on the sigmoid equation
revealed that the inhibitory sorafenib concentration achieved half-maximal viability level (IC50) is
at 7.54 M for the control while there is a ~1.8-fold reduction (13.2 M) when using pCRISPR
targeting RAF1. An F-test revealed a significant difference between these two curves for
concentrations between the linear regions of the curve (2.5 – 50 M) (P < 0.05). These results are
also verified using well-plates and we observed similar results through fluorescence well-plate
measurements and microscopy images (Figure 5.20d; see examples of raw data in Figure 5.17). In
addition, we performed preliminary work to further analyse this result by Western blotting and we
observed that endogenous RAF1 protein expression was not reduced significantly compared to
expression in control cells that are transfected with a control pCRISPR (Figure 5.21). We suspect
that this is due to cell population heterogeneity – to confirm that RAF1 protein expression is
significantly reduced, we will perform flow cytometry to sort and collect mCherry-positive cells
(transfected cells) and then reproduce the western blot.

73
The ability to edit genes in cancer cells and to detect a phenotypic response highlights the
potential of the ACE platform to investigate other pathways using gene-editing techniques.
Figure 5.19 – Example of microscopy images used for dose-response curves.
GFP image showing H1299 cells on day 5 with different doses of drugs. Scale bar = 0.5 mm.

74
Figure 5.20 – Dose-response relationships on- and off-chip with relevant GC50.
(a) On-chip dose-response curve for H1299 cells transfected with and without individual guides
targeting Raf-1 at different concentrations of sorafenib. (b) Off-chip dose-response curve for
H1299 cells transfected with and without individual guides targeting Raf-1 at different
concentrations of sorafenib.
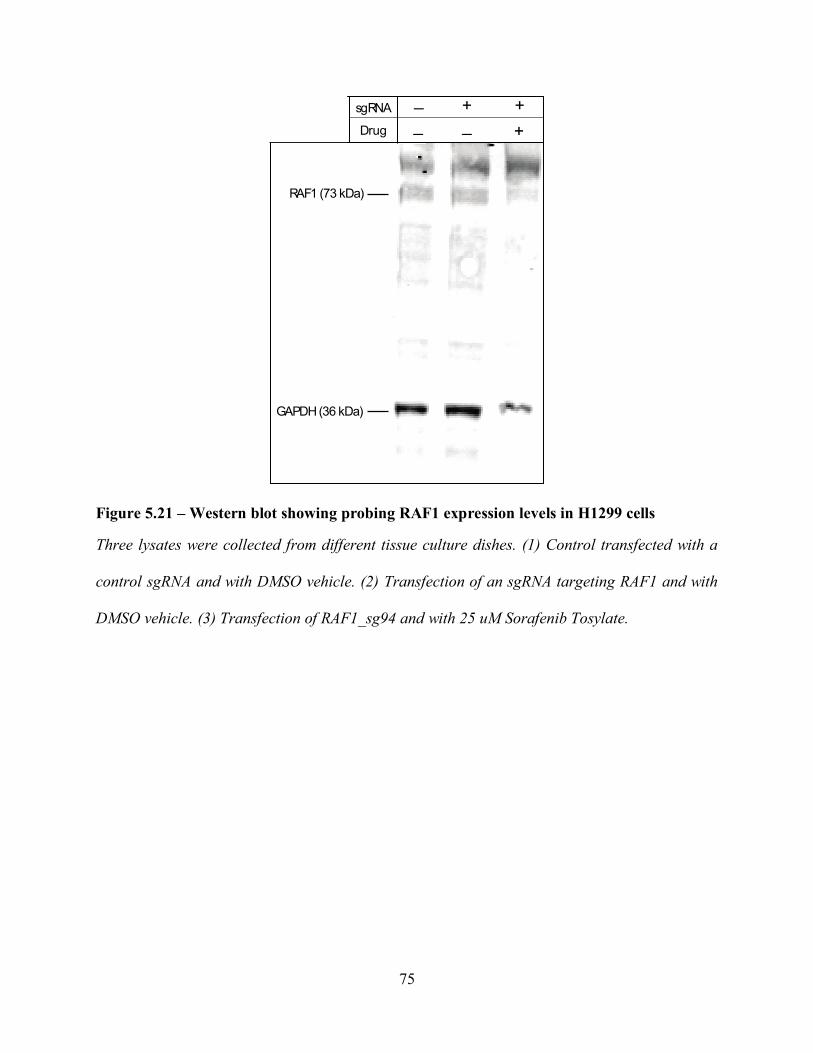
75
Figure 5.21 – Western blot showing probing RAF1 expression levels in H1299 cells
Three lysates were collected from different tissue culture dishes. (1) Control transfected with a
control sgRNA and with DMSO vehicle. (2) Transfection of an sgRNA targeting RAF1 and with
DMSO vehicle. (3) Transfection of RAF1_sg94 and with 25 uM Sorafenib Tosylate.
RAF1 (73 kDa)
GAPDH (36 kDa)
_ _ +
sgRNA
Drug
_ + +

76
Chapter 6. Concluding Remarks and a Look to the Future
In this section, I recapitulate the hallmarks of the thesis and vent the merits of the ACE platform
as a versatile gene editing platform. In addition, assess the limitations of this work and evaluate
the future work related to the ACE platform.
6.1 Conclusion
In this thesis, we report the first demonstration of automated gene editing using digital
microfluidics with an application to decipher cancer genes. First, we optimized microfabrication
procedures related to DMF to accommodate cell culture and gene editing. We characterized the
integration of gene-editing with DMF in terms of transfection and knockout efficiencies. We
optimized and validated our system for transfection efficiency by assessing the expression of an
mCherry reporter plasmid, comparing it to macroscale results. A new standardized imaging
pipeline was developed for the first time to analyse transfected cells. Upon realizing favorable
transfection conditions, we further tailored our ACE platform for directed gene editing using the
CRISPR-Cas9 system and observed similar transgene (stably integrated GFP) knock-out
efficiencies to those in the macroscale. After successful proof-of-concept gene knock-out, we
demonstrated the functionality of the ACE platform using a gene-editing assay that targets the
RAF1 gene in the MAPK/ERK pathway. In the process, we highlight the standardized imaging
pipeline platform, which can be reprogrammed to probe for a wide-range of expression patterns.
The versatility of the ACE platform is also underlined by integrating a drug inhibition assay related
to cancer studies. The combination of automation, DMF, and gene-editing presented here provides
77
a basis for future studies that can potentially analyze a wide range of cancer genes. Such a system
holds great promise in applications related to personalized medicine.
6.2 Future Perspectives
Digital microfluidics has often been limited by its throughput. However, this limitation can
be attributed to the immaturity of the technology today. DMF is rapidly evolving, with numerous
emerging research groups who will serve as frontrunners in the development of HTS using DMF.
As of today, we can foresee the development of self-contained dynamic microwells and DMF-
operated microtiter plates, that could complement or replace ALHR. This would enable
independent cell culture and analysis and multiplexed cell-based assays, holding great promise in
cell proliferation studies and, more broadly, provide great insight into numerous fundamental
biological processes. Currently, our individual ACE devices harbor six individual microwells,
which could be seen as a limiting factor. However, now that the platform has been functionally
tested and validated, we can consider strategies for increased throughput by developing new DMF
cell culture methods, bypassing the need for top-plate microfabrication and limiting cell culture
related biofouling. For example, we could tether DMF bottom-plates to standard microtiter top-
plates to culture cells and develop a miniaturized ALHR using DMF. For such developments in
HTS, we would need robust low-cost devices with optimized surface functionalization to prevent
biofouling, chemical development of novel surfactants and enhanced automation systems to drive
perfectly reproducible droplet translation.
Another area under active investigation today to increase throughput is the use vertical
interconnects for electrode actuation, which would overcome the design limitations involved in
wiring individual electrodes. This has been achieved in the past using printed circuit boards

78
(PCBs)169 but the low resolution of PCBs (130 m inter-electrode gap) leads to issues in
reproducible droplet translation. A solution to this would be to operate DMF using thin-film
transistors, which would eliminate planar interconnections, reduce the footprint of the controlling
system and reduce the number of interconnections. Such a solution can be leveraged to create large
arrays of individually addressable electrodes (e.g. 50 x 50 = 2500 electrodes), thereby allowing
assays to run in parallel. Combining this with flow-based microfluidics in a hybrid system could
also significantly increase throughput.
Nevertheless, our ACE platform is not as concerned with throughput as other applications
may be. Upstream bioinformatics and deep learning strategies can narrow down our experimental
procedures to just a few high probability conditions. Here, we used Benchling for our sgRNA
design, using a ranking system based on minimizing off-target effects while maximizing on-target
efficiency. In other words, we performed rational design to plan for our arrayed experiment, by
selecting the best sgRNA candidate to target the RAF1 gene. The work presented here showcased
the last step of a potential multi-module gene editing pipeline, where we study the phenotypic
readout of a gene edit. In the future, we envision a consolidated CRISPR gene editing platform
streamlining on-demand synthesis of sgRNAs (as double-stranded DNA or as single-stranded
RNA), with pCRISPR assembly or RNP complex assembly, and downstream transfection and
analysis. This can be achieved by multiplexing DMF devices by stacking devices and establishing
fluid communication between individual devices. To my knowledge, such a consolidated CRISPR
pipeline has not yet been developed and would hold tremendous value in the gene editing
community.

79
References
1. Takatsy, G. The use of spiral loops in serological and virological micro-methods. Acta
Microbiol Acad Sci Hung 3, 191-202 (1955).
2. Einstein, A. Investigations on the theory of brownian movement. Dover Publications
(1956).
3. Berg, H. (Princeton University Press; 1993).
4. Taylor, G. Dispersion of soluble matter in solvent flowing slowly through a tube. Proc.
R. Soc. Lond. A Math. Phys. Sci. 219, 186–203 (1953).
5. Manz, A., Graber, N. & Widmer, H.M. Miniaturized total chemical analysis systems: A
novel concept for chemical sensing. Sensors and Actuators B: Chemical 1, 244-248
(1990).
6. Lemmo, A.V., Rose, D.J. & Tisone, T.C. Inkjet dispensing technology: applications in
drug discovery. Curr Opin Biotechnol 9, 615-617 (1998).
7. Duffy, D.C., McDonald, J.C., Schueller, O.J. & Whitesides, G.M. Rapid Prototyping of
Microfluidic Systems in Poly(dimethylsiloxane). Anal Chem 70, 4974-4984 (1998).
8. Thorsen, T., Maerkl, S.J. & Quake, S.R. Microfluidic large-scale integration. Science
298, 580-584 (2002).
9. Wang, Y. et al. An integrated microfluidic device for large-scale in situ click chemistry
screening. Lab Chip 9, 2281-2285 (2009).
10. Song, H., Chen, D.L. & Ismagilov, R.F. Reactions in droplets in microfluidic channels.
Angew Chem Int Ed Engl 45, 7336-7356 (2006).
11. Xu, J. et al. Droplet-based microfluidic device for multiple-droplet clustering. Lab Chip
12, 725-730 (2012).
12. Jebrail, M.J., Bartsch, M.S. & Patel, K.D. Digital microfluidics: a versatile tool for
applications in chemistry, biology and medicine. Lab Chip 12, 2452-2463 (2012).
13. Jebrail, M.J. & Wheeler, A.R. Let's get digital: digitizing chemical biology with
microfluidics. Curr Opin Chem Biol 14, 574-581 (2010).
14. Wheeler, A.R. Chemistry. Putting electrowetting to work. Science 322, 539-540 (2008).
15. Jacobson, S.C., Hergenroder, R., Koutny, L.B., Warmack, R.J. & Ramsey, J.M. Effects
of Injection Schemes and Column Geometry on the Performance of Microchip
Electrophoresis Devices. Anal Chem 66, 1107-1113 (1994).

80
16. Takayama, S. et al. Subcellular positioning of small molecules. Nature 411, 1016 (2001).
17. Liu, Y. et al. Multilayer-assembled microchip for enzyme immobilization as reactor
toward low-level protein identification. Anal Chem 78, 801-808 (2006).
18. Heyries, K.A. et al. Megapixel digital PCR. Nat Methods 8, 649-651 (2011).
19. Araci, I.E. & Quake, S.R. Microfluidic very large scale integration (mVLSI) with
integrated micromechanical valves. Lab Chip 12, 2803-2806 (2012).
20. Unger, M.A., Chou, H.P., Thorsen, T., Scherer, A. & Quake, S.R. Monolithic
microfabricated valves and pumps by multilayer soft lithography. Science 288, 113-116
(2000).
21. Song, H., Tice, J.D. & Ismagilov, R.F. A microfluidic system for controlling reaction
networks in time. Angew Chem Int Ed Engl 42, 768-772 (2003).
22. Ismagilov, R.F. Integrated microfluidic systems. Angew Chem Int Ed Engl 42, 4130-4132
(2003).
23. Abbyad, P., Dangla, R., Alexandrou, A. & Baroud, C.N. Rails and anchors: guiding and
trapping droplet microreactors in two dimensions. Lab Chip 11, 813-821 (2011).
24. Ahn, B. et al. Guiding, distribution, and storage of trains of shape-dependent droplets.
Lab Chip 11, 3915-3918 (2011).
25. Xu, L., Lee, H., Panchapakesan, R. & Oh, K.W. Fusion and sorting of two parallel trains
of droplets using a railroad-like channel network and guiding tracks. Lab Chip 12, 3936-
3942 (2012).
26. Fradet, E. et al. Combining rails and anchors with laser forcing for selective manipulation
within 2D droplet arrays. Lab Chip 11, 4228-4234 (2011).
27. Link, D.R. et al. Electric control of droplets in microfluidic devices. Angew Chem Int Ed
Engl 45, 2556-2560 (2006).
28. Park, S.Y., Kalim, S., Callahan, C., Teitell, M.A. & Chiou, E.P. A light-induced
dielectrophoretic droplet manipulation platform. Lab Chip 9, 3228-3235 (2009).
29. Ahn, B., Lee, K., Panchapakesan, R. & Oh, K.W. On-demand electrostatic droplet
charging and sorting. Biomicrofluidics 5, 24113 (2011).
30. Lee, M., Lee, K., Kim, K.H., Oh, K.W. & Choo, J. SERS-based immunoassay using a
gold array-embedded gradient microfluidic chip. Lab Chip 12, 3720-3727 (2012).
31. Chung, E. et al. Trace analysis of mercury(II) ions using aptamer-modified Au/Ag core-
shell nanoparticles and SERS spectroscopy in a microdroplet channel. Lab Chip 13, 260-
266 (2013).

81
32. Choi, N. et al. Simultaneous detection of duplex DNA oligonucleotides using a SERS-
based micro-network gradient chip. Lab Chip 12, 5160-5167 (2012).
33. Macosko, E.Z. et al. Highly Parallel Genome-wide Expression Profiling of Individual
Cells Using Nanoliter Droplets. Cell 161, 1202-1214 (2015).
34. Klein, A.M. et al. Droplet barcoding for single-cell transcriptomics applied to embryonic
stem cells. Cell 161, 1187-1201 (2015).
35. Brouzes, E. et al. Droplet microfluidic technology for single-cell high-throughput
screening. Proc Natl Acad Sci U S A 106, 14195-14200 (2009).
36. Yadav, M.K. et al. In situ data collection and structure refinement from microcapillary
protein crystallization. J Appl Crystallogr 38, 900-905 (2005).
37. Gerdts, C.J., Sharoyan, D.E. & Ismagilov, R.F. A synthetic reaction network: chemical
amplification using nonequilibrium autocatalytic reactions coupled in time. J Am Chem
Soc 126, 6327-6331 (2004).
38. Urbanski, J.P., Thies, W., Rhodes, C., Amarasinghe, S. & Thorsen, T. Digital
microfluidics using soft lithography. Lab on a Chip 6, 96-104 (2006).
39. Pan, J. et al. Quantitative tracking of the growth of individual algal cells in microdroplet
compartments. Integr Biol-Uk 3, 1043-1051 (2011).
40. Li, X.M., Reinhoudt, D. & Crego-Calama, M. What do we need for a superhydrophobic
surface? A review on the recent progress in the preparation of superhydrophobic surfaces.
Chem Soc Rev 36, 1350-1368 (2007).
41. Pollack, M.G., Fair, R.B. & Shenderov, A.D. Electrowetting-based actuation of liquid
droplets for microfluidic applications. Appl Phys Lett 77, 1725-1726 (2000).
42. Lee, J., Moon, H., Fowler, J., Schoellhammer, T. & Kim, C.J. Electrowetting and
electrowetting-on-dielectric for microscale liquid handling. Sensor Actuat a-Phys 95,
259-268 (2002).
43. Chatterjee, D., Shepherd, H. & Garrell, R.L. Electromechanical model for actuating
liquids in a two-plate droplet microfluidic device. Lab on a Chip 9, 1219-1229 (2009).
44. Gao, J. et al. Adhesion promoter for a multi-dielectric-layer on a digital microfluidic
chip. Rsc Adv 5, 48626-48630 (2015).
45. Song, J.H., Evans, R., Lin, Y.Y., Hsu, B.N. & Fair, R.B. A scaling model for
electrowetting-on-dielectric microfluidic actuators. Microfluid Nanofluid 7, 75-89 (2009).
46. Choi, K., Ng, A.H.C., Fobel, R. & Wheeler, A.R. Digital Microfluidics. Annu Rev Anal
Chem 5, 413-440 (2012).

82
47. Dryden, M.D.M., Fobel, R., Fobel, C. & Wheeler, A.R. Upon the Shoulders of Giants:
Open-Source Hardware and Software in Analytical Chemistry. Anal Chem 89, 4330-4338
(2017).
48. Shih, S.C.C., Barbulovic-Nad, I., Yang, X., Fobel, R. & Wheeler, A.R. Digital
microfluidics with impedance sensing for integrated cell culture and analysis. Biosens.
Bioelectron. 42, 314-320 (2013).
49. Zeng, X. et al. Chemiluminescence detector based on a single planar transparent digital
microfluidic device. Lab Chip 13, 2714-2720 (2013).
50. Lin, L., Evans, R.D., Jokerst, N.M. & Fair, R.B. Integrated optical sensor in a digital
microfluidic platform. IEEE Sens. J. 8, 628-635 (2008).
51. Malic, L., Veres, T. & Tabrizian, M. Two-dimensional droplet-based surface plasmon
resonance imaging using electrowetting-on-dielectric microfluidics. Lab Chip 9, 473-475
(2009).
52. Au, S.H., Shih, S.C.C. & Wheeler, A.R. Integrated microbioreactor for culture and
analysis of bacteria, algae and yeast. Biomed. Microdevices 13, 41-50 (2011).
53. Au, S.H., Kumar, P. & Wheeler, A.R. A New Angle on Pluronic Additives: Advancing
Droplets and Understanding in Digital Microfluidics. Langmuir 27, 8586-8594 (2011).
54. Freire, S.L. & Tanner, B. Additive-free digital microfluidics. Langmuir 29, 9024-9030
(2013).
55. Vo, P.Q.N., Husser, M.C., Ahmadi, F., Sinha, H. & Shih, S.C.C. Image-based feedback
and analysis system for digital microfluidics. Lab on a Chip 17, 3437-3446 (2017).
56. Walker, G.M. et al. Effects of flow and diffusion on chemotaxis studies in a
microfabricated gradient generator. Lab Chip 5, 611-618 (2005).
57. Zare, R.N. & Kim, S. Microfluidic platforms for single-cell analysis. Annu Rev Biomed
Eng 12, 187-201 (2010).
58. Koster, S. et al. Drop-based microfluidic devices for encapsulation of single cells. Lab
Chip 8, 1110-1115 (2008).
59. Barbulovic-Nad, I., Au, S.H. & Wheeler, A.R. A microfluidic platform for complete
mammalian cell culture. Lab on a Chip 10, 1536-1542 (2010).
60. Barbulovic-Nad, I., Yang, H., Park, P.S. & Wheeler, A.R. Digital microfluidics for cell-
based assays. Lab Chip 8, 519-526 (2008).
61. Shih, S.C., Barbulovic-Nad, I., Yang, X., Fobel, R. & Wheeler, A.R. Digital
microfluidics with impedance sensing for integrated cell culture and analysis. Biosens
Bioelectron 42, 314-320 (2013).

83
62. Srigunapalan, S., Eydelnant, I.A., Simmons, C.A. & Wheeler, A.R. A digital microfluidic
platform for primary cell culture and analysis. Lab Chip 12, 369-375 (2012).
63. Eydelnant, I.A., Uddayasankar, U., Li, B., Liao, M.W. & Wheeler, A.R. Virtual
microwells for digital microfluidic reagent dispensing and cell culture. Lab Chip 12, 750-
757 (2012).
64. Berns, K. et al. A large-scale RNAi screen in human cells identifies new components of
the p53 pathway. Nature 428, 431-437 (2004).
65. Lander, E.S. Initial impact of the sequencing of the human genome. Nature 470, 187-197
(2011).
66. Cox, D.B., Platt, R.J. & Zhang, F. Therapeutic genome editing: prospects and challenges.
Nat Med 21, 121-131 (2015).
67. Kay, M.A. State-of-the-art gene-based therapies: the road ahead. Nat Rev Genet 12, 316-
328 (2011).
68. Vaishnaw, A.K. et al. A status report on RNAi therapeutics. Silence 1, 14 (2010).
69. Castanotto, D. & Rossi, J.J. The promises and pitfalls of RNA-interference-based
therapeutics. Nature 457, 426-433 (2009).
70. Howe, S.J. et al. Insertional mutagenesis combined with acquired somatic mutations
causes leukemogenesis following gene therapy of SCID-X1 patients. J Clin Invest 118,
3143-3150 (2008).
71. Sander, J.D. & Joung, J.K. CRISPR-Cas systems for editing, regulating and targeting
genomes. Nat Biotechnol 32, 347-355 (2014).
72. Urnov, F.D., Rebar, E.J., Holmes, M.C., Zhang, H.S. & Gregory, P.D. Genome editing
with engineered zinc finger nucleases. Nat Rev Genet 11, 636-646 (2010).
73. Bogdanove, A.J. & Voytas, D.F. TAL effectors: customizable proteins for DNA
targeting. Science 333, 1843-1846 (2011).
74. Hsu, P.D., Lander, E.S. & Zhang, F. Development and applications of CRISPR-Cas9 for
genome engineering. Cell 157, 1262-1278 (2014).
75. Wyman, C. & Kanaar, R. DNA double-strand break repair: all's well that ends well. Annu
Rev Genet 40, 363-383 (2006).
76. Gaj, T., Gersbach, C.A. & Barbas, C.F., 3rd ZFN, TALEN, and CRISPR/Cas-based
methods for genome engineering. Trends Biotechnol 31, 397-405 (2013).
77. Cong, L. et al. Multiplex Genome Engineering Using CRISPR/Cas Systems. Science 339,
819-823 (2013).

84
78. Doudna, J.A. & Charpentier, E. Genome editing. The new frontier of genome engineering
with CRISPR-Cas9. Science 346, 1258096 (2014).
79. Jinek, M. et al. A programmable dual-RNA-guided DNA endonuclease in adaptive
bacterial immunity. Science 337, 816-821 (2012).
80. Rouet, P., Smih, F. & Jasin, M. Introduction of Double-Strand Breaks into the Genome of
Mouse Cells by Expression of a Rare-Cutting Endonuclease. Mol Cell Biol 14, 8096-
8106 (1994).
81. High, K., Gregory, P.D. & Gersbach, C. CRISPR technology for gene therapy. Nature
Medicine 20, 476-477 (2014).
82. Zhang, X.H., Wang, L.R., Liu, M.Y. & Li, D.L. CRISPR/Cas9 system: a powerful
technology for in vivo and ex vivo gene therapy. Sci China Life Sci 60, 468-475 (2017).
83. Mali, P. et al. RNA-guided human genome engineering via Cas9. Science 339, 823-826
(2013).
84. Hsu, P.D., Lander, E.S. & Zhang, F. Development and Applications of CRISPR-Cas9 for
Genome Engineering. Cell 157, 1262-1278 (2014).
85. Shalem, O. et al. Genome-scale CRISPR-Cas9 knockout screening in human cells.
Science 343, 84-87 (2014).
86. Shalem, O., Sanjana, N.E. & Zhang, F. High-throughput functional genomics using
CRISPR-Cas9. Nat Rev Genet 16, 299-311 (2015).
87. Xue, W. et al. CRISPR-mediated direct mutation of cancer genes in the mouse liver.
Nature 514, 380-+ (2014).
88. Wang, T., Wei, J.J., Sabatini, D.M. & Lander, E.S. Genetic Screens in Human Cells
Using the CRISPR-Cas9 System. Science 343, 80-84 (2014).
89. Perez, E.E. et al. Establishment of HIV-1 resistance in CD4(+) T cells by genome editing
using zinc-finger nucleases. Nature Biotechnology 26, 808-816 (2008).
90. Friedman, A.A., Letai, A., Fisher, D.E. & Flaherty, K.T. Precision medicine for cancer
with next-generation functional diagnostics. Nat Rev Cancer 15, 747-756 (2015).
91. Barretina, J. et al. The Cancer Cell Line Encyclopedia enables predictive modelling of
anticancer drug sensitivity. Nature 483, 603-607 (2012).
92. Garnett, M.J. et al. Systematic identification of genomic markers of drug sensitivity in
cancer cells. Nature 483, 570-575 (2012).
93. Wang, T. et al. Identification and characterization of essential genes in the human
genome. Science 350, 1096-1101 (2015).

85
94. Wang, T., Wei, J.J., Sabatini, D.M. & Lander, E.S. Genetic screens in human cells using
the CRISPR-Cas9 system. Science 343, 80-84 (2014).
95. Sanjana, N.E., Shalem, O. & Zhang, F. Improved vectors and genome-wide libraries for
CRISPR screening. Nat Methods 11, 783-784 (2014).
96. Koike-Yusa, H., Li, Y., Tan, E.P., Velasco-Herrera Mdel, C. & Yusa, K. Genome-wide
recessive genetic screening in mammalian cells with a lentiviral CRISPR-guide RNA
library. Nat Biotechnol 32, 267-273 (2014).
97. Gilbert, L.A. et al. Genome-Scale CRISPR-Mediated Control of Gene Repression and
Activation. Cell 159, 647-661 (2014).
98. Sanjana, N.E., Shalem, O. & Zhang, F. Improved vectors and genome-wide libraries for
CRISPR screening. Nat Methods 11, 783-784 (2014).
99. Shalem, O. et al. Genome-Scale CRISPR-Cas9 Knockout Screening in Human Cells.
Science 343, 84-87 (2014).
100. Cong, L. et al. Multiplex genome engineering using CRISPR/Cas systems. Science 339,
819-823 (2013).
101. Ran, F.A. et al. Genome engineering using the CRISPR-Cas9 system. Nat Protoc 8,
2281-2308 (2013).
102. Choi, P.S. & Meyerson, M. Targeted genomic rearrangements using CRISPR/Cas
technology. Nat Commun 5, 3728 (2014).
103. Konermann, S. et al. Genome-scale transcriptional activation by an engineered CRISPR-
Cas9 complex. Nature 517, 583-U332 (2015).
104. Chen, S. et al. Genome-wide CRISPR screen in a mouse model of tumor growth and
metastasis. Cell 160, 1246-1260 (2015).
105. Platt, R.J. et al. CRISPR-Cas9 knockin mice for genome editing and cancer modeling.
Cell 159, 440-455 (2014).
106. Hsu, P.D. et al. DNA targeting specificity of RNA-guided Cas9 nucleases. Nat
Biotechnol 31, 827-832 (2013).
107. Doench, J.G. et al. Optimized sgRNA design to maximize activity and minimize off-
target effects of CRISPR-Cas9. Nature Biotechnology 34, 184-+ (2016).
108. Neumann, B. et al. High-throughput RNAi screening by time-lapse imaging of live
human cells. Nat Methods 3, 385-390 (2006).
109. Moffat, J. et al. A lentiviral RNAi library for human and mouse genes applied to an
arrayed viral high-content screen. Cell 124, 1283-1298 (2006).

86
110. Hasson, S.A. et al. High-content genome-wide RNAi screens identify regulators of parkin
upstream of mitophagy. Nature 504, 291-295 (2013).
111. Shalem, O., Sanjana, N.E. & Zhang, F. High-throughput functional genomics using
CRISPR-Cas9. Nat Rev Genet 16, 299-311 (2015).
112. Lonowski, L.A. et al. Genome editing using FACS enrichment of nuclease-expressing
cells and indel detection by amplicon analysis. Nature Protocols 12, 581-603 (2017).
113. Hsu, P.D. et al. DNA targeting specificity of RNA-guided Cas9 nucleases. Nature
Biotechnology 31, 827-+ (2013).
114. Bennett, M.R. et al. Metabolic gene regulation in a dynamically changing environment.
Nature 454, 1119-1122 (2008).
115. Moore, T.A. & Young, E.W. Single cell functional analysis of multiple myeloma cell
populations correlates with diffusion profiles in static microfluidic coculture systems.
Biomicrofluidics 10, 044105 (2016).
116. Paie, P., Bragheri, F., Di Carlo, D. & Osellame, R. Particle focusing by 3D inertial
microfluidics. Microsyst Nanoeng 3 (2017).
117. Au, S.H. et al. Clusters of circulating tumor cells traverse capillary-sized vessels. Proc
Natl Acad Sci U S A 113, 4947-4952 (2016).
118. Upadhyaya, S. & Selvaganapathy, P.R. Microfluidic devices for cell based high
throughput screening. Lab Chip 10, 341-348 (2010).
119. Nevill, J.T., Cooper, R., Dueck, M., Breslauer, D.N. & Lee, L.P. Integrated microfluidic
cell culture and lysis on a chip. Lab Chip 7, 1689-1695 (2007).
120. Lan, F., Demaree, B., Ahmed, N. & Abate, A.R. Single-cell genome sequencing at ultra-
high-throughput with microfluidic droplet barcoding. Nat Biotechnol 35, 640-646 (2017).
121. Marimuthu, M. et al. Multi-size spheroid formation using microfluidic funnels. Lab Chip
18, 304-314 (2018).
122. Linshiz, G. et al. PR-PR: cross-platform laboratory automation system. ACS Synth Biol 3,
515-524 (2014).
123. Pak, C. et al. MicroC(3): an ex vivo microfluidic cis-coculture assay to test
chemosensitivity and resistance of patient multiple myeloma cells. Integr Biol-Uk 7, 643-
654 (2015).
124. Han, X. et al. CRISPR-Cas9 delivery to hard-to-transfect cells via membrane
deformation. Sci Adv 1, e1500454 (2015).

87
125. Han, X. et al. Microfluidic Cell Deformability Assay for Rapid and Efficient Kinase
Screening with the CRISPR-Cas9 System. Angew Chem Int Ed Engl 55, 8561-8565
(2016).
126. Gomez-Sjoberg, R., Leyrat, A.A., Pirone, D.M., Chen, C.S. & Quake, S.R. Versatile,
fully automated, microfluidic cell culture system. Analytical Chemistry 79, 8557-8563
(2007).
127. Gu, W., Zhu, X.Y., Futai, N., Cho, B.S. & Takayama, S. Computerized microfluidic cell
culture using elastomeric channels and Braille displays. P Natl Acad Sci USA 101,
15861-15866 (2004).
128. Vojtek, A.B. & Der, C.J. Increasing complexity of the Ras signaling pathway. J Biol
Chem 273, 19925-19928 (1998).
129. Paez, J.G. et al. EGFR mutations in lung cancer: Correlation with clinical response to
gefitinib therapy. Science 304, 1497-1500 (2004).
130. Findlay, S.D., Vincent, K.M., Berman, J.R. & Postovit, L.M. A Digital PCR-Based
Method for Efficient and Highly Specific Screening of Genome Edited Cells. Plos One
11 (2016).
131. Vo, P.Q.N., Husser, M.C., Ahmadi, F., Sinha, H. & Shih, S.C.C. Image-based feedback
and analysis system for digital microfluidics. Lab Chip 17, 3437-3446 (2017).
132. Husser, M.C., Vo, P.Q.N., Sinha, H., Ahmadi, F. & Shih, S.C.C. An Automated
Induction Microfluidics System for Synthetic Biology. ACS Synth Biol 7, 933-944
(2018).
133. Ng, A.H.C., Chamberlain, M.D., Situ, H., Lee, V. & Wheeler, A.R. Digital microfluidic
immunocytochemistry in single cells. Nat Commun 6 (2015).
134. Carpenter, A.E. et al. CellProfiler: image analysis software for identifying and
quantifying cell phenotypes. Genome Biol 7 (2006).
135. Zhang, Y. et al. Targeted-gene silencing of BRAF to interrupt BRAF/MEK/ERK
pathway synergized photothermal therapeutics for melanoma using a novel FA-GNR-
siBRAF nanosystem. Nanomedicine (2018).
136. Sharei, A. et al. A vector-free microfluidic platform for intracellular delivery. Proc Natl
Acad Sci U S A 110, 2082-2087 (2013).
137. Whitehead, K.A., Langer, R. & Anderson, D.G. Knocking down barriers: advances in
siRNA delivery. Nat Rev Drug Discov 8, 129-138 (2009).
138. Ng, A.H., Li, B.B., Chamberlain, M.D. & Wheeler, A.R. Digital Microfluidic Cell
Culture. Annu Rev Biomed Eng 17, 91-112 (2015).

88
139. Aijian, A.P. & Garrell, R.L. Digital Microfluidics for Automated Hanging Drop Cell
Spheroid Culture. Jala-J Lab Autom 20, 283-295 (2015).
140. Witters, D. et al. Biofunctionalization of electrowetting-on-dielectric digital microfluidic
chips for miniaturized cell-based applications. Lab on a Chip 11, 2790-2794 (2011).
141. do Nascimento, D.F. et al. Microfluidic Fabrication of Pluronic Vesicles with Controlled
Permeability. Langmuir 32, 5350-5355 (2016).
142. Luk, V.N., Mo, G.C.H. & Wheeler, A.R. Pluronic additives: A solution to sticky
problems in digital microfluidics. Langmuir 24, 6382-6389 (2008).
143. Chen, J.F., Yu, Y.H., Li, J., Lai, Y.J. & Zhou, J. Size-variable droplet actuation by
interdigitated electrowetting electrode. Appl Phys Lett 101 (2012).
144. Jang, L.S., Hsu, C.Y. & Chen, C.H. Effect of electrode geometry on performance of
EWOD device driven by battery-based system. Biomed Microdevices 11, 1029-1036
(2009).
145. Rajabi, N. & Dolatabadi, A. Effect of Electrode Shape on Droplet Actuation in
Electrowetting-Based Microfluidics. Proceedings of the Asme International Mechanical
Engineering Congress and Exposition, Vol 13, Pts a and B, 1015-1020 (2009).
146. Eydelnant, I.A., Uddayasankar, U., Li, B.Y., Liao, M.W. & Wheeler, A.R. Virtual
microwells for digital microfluidic reagent dispensing and cell culture. Lab on a Chip 12,
750-757 (2012).
147. Shih, S.C.C., Barbulovic-Nad, I., Yang, X.N., Fobel, R. & Wheeler, A.R. Digital
microfluidics with impedance sensing for integrated cell culture and analysis. Biosensors
& Bioelectronics 42, 314-320 (2013).
148. Eydelnant, I.A., Li, B.B. & Wheeler, A.R. Microgels on-demand. Nat Commun 5 (2014).
149. Srigunapalan, S., Eydelnant, I.A., Simmons, C.A. & Wheeler, A.R. A digital microfluidic
platform for primary cell culture and analysis. Lab on a Chip 12, 369-375 (2012).
150. Kumar, P.T. et al. Digital microfluidics for time-resolved cytotoxicity studies on single
non-adherent yeast cells. Lab on a Chip 15, 1852-1860 (2015).
151. Bender, B.F., Aijian, A.P. & Garrell, R.L. Digital microfluidics for spheroid-based
invasion assays. Lab on a Chip 16, 1505-1513 (2016).
152. Ran, F.A. et al. Genome engineering using the CRISPR-Cas9 system. Nature Protocols
8, 2281-2308 (2013).
153. Kim, T.K. & Eberwine, J.H. Mammalian cell transfection: the present and the future.
Anal Bioanal Chem 397, 3173-3178 (2010).
89
154. Li, S.L. Electroporation gene therapy: New developments in vivo and in vitro. Curr Gene
Ther 4, 309-316 (2004).
155. Technologies, L. in Invitrogen Application Note (2013).
156. Lv, H.T., Zhang, S.B., Wang, B., Cui, S.H. & Yan, J. Toxicity of cationic lipids and
cationic polymers in gene delivery. J Control Release 114, 100-109 (2006).
157. Sadelain, M., Papapetrou, E.P. & Bushman, F.D. Safe harbours for the integration of new
DNA in the human genome. Nat Rev Cancer 12, 51-58 (2011).
158. Lundholt, B.K., Scudder, K.M. & Pagliaro, L. A simple technique for reducing edge
effect in cell-based assays. J Biomol Screen 8, 566-570 (2003).
159. Marshall, C.J. Specificity of Receptor Tyrosine Kinase Signaling - Transient Versus
Sustained Extracellular Signal-Regulated Kinase Activation. Cell 80, 179-185 (1995).
160. Gray-Schopfer, V., Wellbrock, C. & Marais, R. Melanoma biology and new targeted
therapy. Nature 445, 851-857 (2007).
161. Samatar, A.A. & Poulikakos, P.I. Targeting RAS-ERK signalling in cancer: promises and
challenges. Nat Rev Drug Discov 13, 928-+ (2014).
162. Wellbrock, C., Karasarides, M. & Marais, R. The RAF proteins take centre stage. Nat
Rev Mol Cell Bio 5, 875-885 (2004).
163. Weber, C.K., Slupsky, J.R., Kalmes, H.A. & Rapp, U.R. Active Ras induces
heterodimerization of cRaf and BRaf. Cancer Research 61, 3595-3598 (2001).
164. Emuss, V., Garnett, M., Mason, C., Marais, R. & Project, C.G. Mutations of C-RAF are
rare in human cancer because C-RAF has a low basal kinase activity compared with B-
RAF. Cancer Research 65, 9719-9726 (2005).
165. Wilhelm, S. et al. Discovery and development of sorafenib: a multikinase inhibitor for
treating cancer. Nat Rev Drug Discov 5, 835-844 (2006).
166. Hu, J.H. et al. Evolved Cas9 variants with broad PAM compatibility and high DNA
specificity. Nature 556, 57-+ (2018).
167. Zetsche, B. et al. Cpf1 Is a Single RNA-Guided Endonuclease of a Class 2 CRISPR-Cas
System. Cell 163, 759-771 (2015).
168. Zheng, M. et al. Inhibition of the prolyl isomerase Pin1 enhances the ability of sorafenib
to induce cell death and inhibit tumor growth in hepatocellular carcinoma. Oncotarget 8,
29771-29784 (2017).

90
169. Jain, V., Raj, T.P., Deshmukh, R. & Patrikar, R. Design, fabrication and characterization
of low cost printed circuit board based EWOD device for digital microfluidics
applications. Microsyst Technol 23, 389-397 (2017).