Embed Size (px)
Citation preview
TS 3I - Deformation Monitoring – Techniques and Case Studies Halim Setan and Khairulnizam M.Idris Automation in Data Capture and Analysis for Industrial/Deformation Surveying Using Robotic Total Station Integrating Generations FIG Working Week 2008 Stockholm, Sweden 14-19 June 2008
1/16
Automation in Data Capture and Analysis for Industrial/Deformation Surveying Using Robotic Total Station
Halim SETAN and Khairulnizam M. IDRIS, Malaysia
Key words: automation, robotic total station, data communication, data gathering SUMMARY LEICA TCA2003/TM5100 is a high precision robotic total station (RTS)/electronic theodolite for industrial/deformation surveying with angle and distance measuring accuracies of 0.5” and 1mm respectively. This research focuses on the development of practical procedure for automation in data capture (via TCA2003/TM5100) and analysis for industrial/deformation surveying applications. Consequently, the procedure is implemented into an in-house software system called InDA (Industrial Deformation Analysis Software). InDA is developed using Microsoft Visual C++ and Visual Basic 6.0, and consists of several modules: Communication, Data Acquisition, and Analysis. The communication protocol uses GeoCOM command set, and data are obtained automatically from instrument command function. This paper discusses the Communication and Data Acquisition modules, using single RTS measurement. Simulation test and laboratory observation on real object are performed, using InDA and LEICA commercial software. The results show the consistency between the two software systems, with mm-level accuracy. In the near future, InDA will be a fully automated data gathering and analysis system for industrial deformation monitoring. RINGKASAN Leica TCA2003/TM5100 ialah sebuah robotic total station (RTS)/teodolit letronik berkejituan tinggi untuk pengukuran industri/deformasi dengan ketepatan cerapan sudut dan jarak 0.5” dan 1mm. Kajian ini khusus kepada pembangunan prosedur yang praktikal untuk automasi pengumpulan data (melalui TCA2003/TM5100) dan analisis untuk aplikasi pengukuran industri/deformasi. Prosedur diimplementasikan ke dalam sistem perisian InDA (Industrial Deformation Analysis Software). InDA dibangunkan menggunakan Microsoft Visual C++ dan Visual Basic 6.0, dan mengandungi beberapa modul: Komunikasi, Pengumpulan Data dan Analisis. Protokol komunikasi menggunakan set arahan GeoCOM, dan data diperolehi secara automatik dari arahan fungsi pada instrumen. Kertas ini membincangkan modul komunikasi dan pengumpulan data menggunakan pengukuran RTS tunggal. Ujian simulasi dan cerapan makmal terhadap objek benar telah dilaksana menggunakan perisian InDA dan perisian komersial LEICA. Keputusan menunjukkan kosistensi diantara kedua-dua perisian pada kejituan mm. Pada masa hadapan, InDA akan menjadi sistem pengumpulan data dan analisis yang automatik sepenuhnya bagi pengawasan deformasi industri.

TS 3I - Deformation Monitoring – Techniques and Case Studies Halim Setan and Khairulnizam M.Idris Automation in Data Capture and Analysis for Industrial/Deformation Surveying Using Robotic Total Station Integrating Generations FIG Working Week 2008 Stockholm, Sweden 14-19 June 2008
2/16
Automation in Data Capture and Analysis for Industrial/Deformation Surveying Using Robotic Total Station
Halim SETAN and Khairulnizam M. IDRIS, Malaysia
1 INTRODUCTION Currently, total station and electronic theodolite are the most commonly used instrument in surveying. Recent technology with ‘robotic’ function provides total station and electronic theodolite with servo drive mechanism. This mechanism enables instruments to aim automatically to the points to be measured. Leica TPS1000 series (e.g. TCA2003 total station and TM5100 electronic theodolite) with motorization and automatic targeting are used in this research. TPS1000 system contains two unit software, namely system software and application software. Using the “workbench” (computer), both units can be loaded across the serial interface by the user. Leica TCA2003 and TM5100 come with automatic target recognition (ATR) feature for complete measurement automation. Implementing of the real time concept in precise measurement is becoming important. Dimensional measurement and deformation detection task need real-time data gathering and on-site analysis. The latest enhancement in automatic measurement system is designed specifically for non-contact inspection and for monitoring either indoor or outdoor. With integrated software package, it enables to do non-contact measuring system for three-dimensional determination of coordinates and shape in industrial applications. The software package system InDA or Industrial Deformation and Analysis is developed in-house to gather the data, measure the point automatically, and analyze for deformation or industrial application. 2 CONCEPT OF InDA To serve for most automation application of the deformation and industrial measurement, InDA has the following features:
- can treat one, two or three dimensional, - can perform in single or dual instrumentation, - have communication module to communicate between user and instrument, - measure the point automatically either via command from user or timer system, - have database module to handle plenty of points, - have a data processing module for least square estimation and deformation
detection, - user friendly
InDA is developed for use on personal or notebook computer with Microsoft Window Me/2000/XP operation system. InDA allows user to perform all computation and analysis in the field or on-site.
TS 3I - Deformation Monitoring – Techniques and Case Studies Halim Setan and Khairulnizam M.Idris Automation in Data Capture and Analysis for Industrial/Deformation Surveying Using Robotic Total Station Integrating Generations FIG Working Week 2008 Stockholm, Sweden 14-19 June 2008
3/16
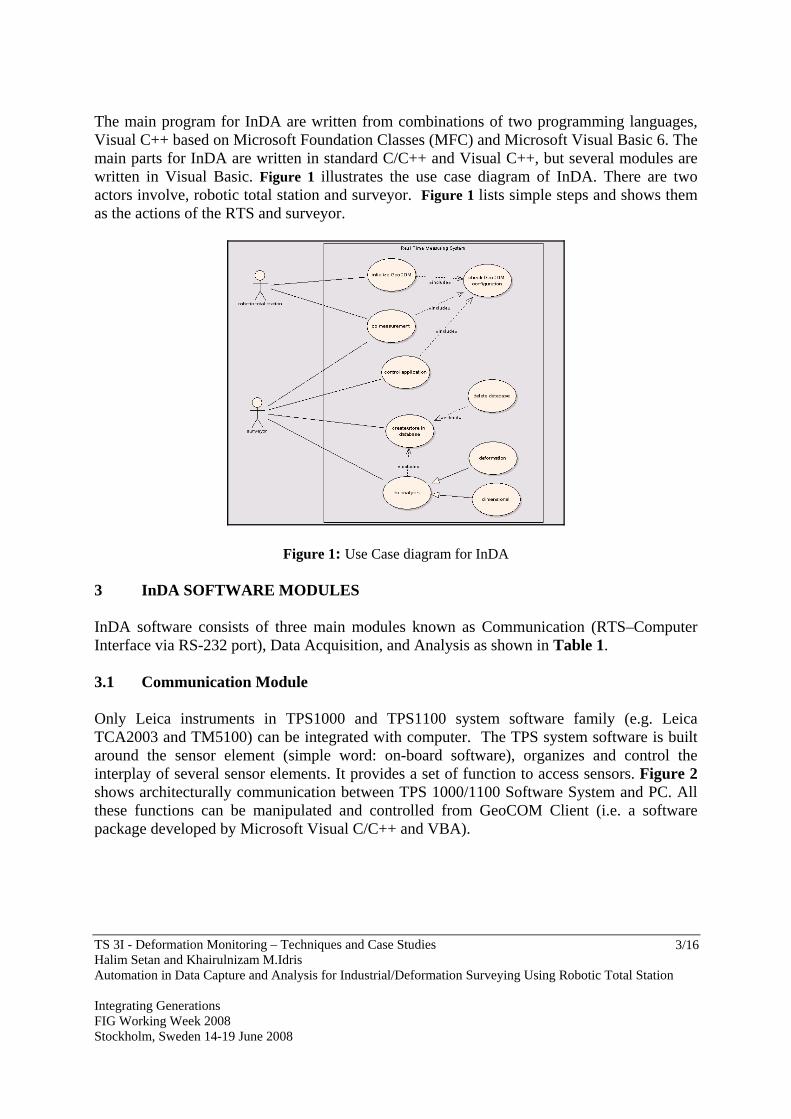
The main program for InDA are written from combinations of two programming languages, Visual C++ based on Microsoft Foundation Classes (MFC) and Microsoft Visual Basic 6. The main parts for InDA are written in standard C/C++ and Visual C++, but several modules are written in Visual Basic. Figure 1 illustrates the use case diagram of InDA. There are two actors involve, robotic total station and surveyor. Figure 1 lists simple steps and shows them as the actions of the RTS and surveyor.
Figure 1: Use Case diagram for InDA 3 InDA SOFTWARE MODULES InDA software consists of three main modules known as Communication (RTS–Computer Interface via RS-232 port), Data Acquisition, and Analysis as shown in Table 1. 3.1 Communication Module Only Leica instruments in TPS1000 and TPS1100 system software family (e.g. Leica TCA2003 and TM5100) can be integrated with computer. The TPS system software is built around the sensor element (simple word: on-board software), organizes and control the interplay of several sensor elements. It provides a set of function to access sensors. Figure 2 shows architecturally communication between TPS 1000/1100 Software System and PC. All these functions can be manipulated and controlled from GeoCOM Client (i.e. a software package developed by Microsoft Visual C/C++ and VBA).
TS 3I - Deformation Monitoring – Techniques and Case Studies Halim Setan and Khairulnizam M.Idris Automation in Data Capture and Analysis for Industrial/Deformation Surveying Using Robotic Total Station Integrating Generations FIG Working Week 2008 Stockholm, Sweden 14-19 June 2008
4/16
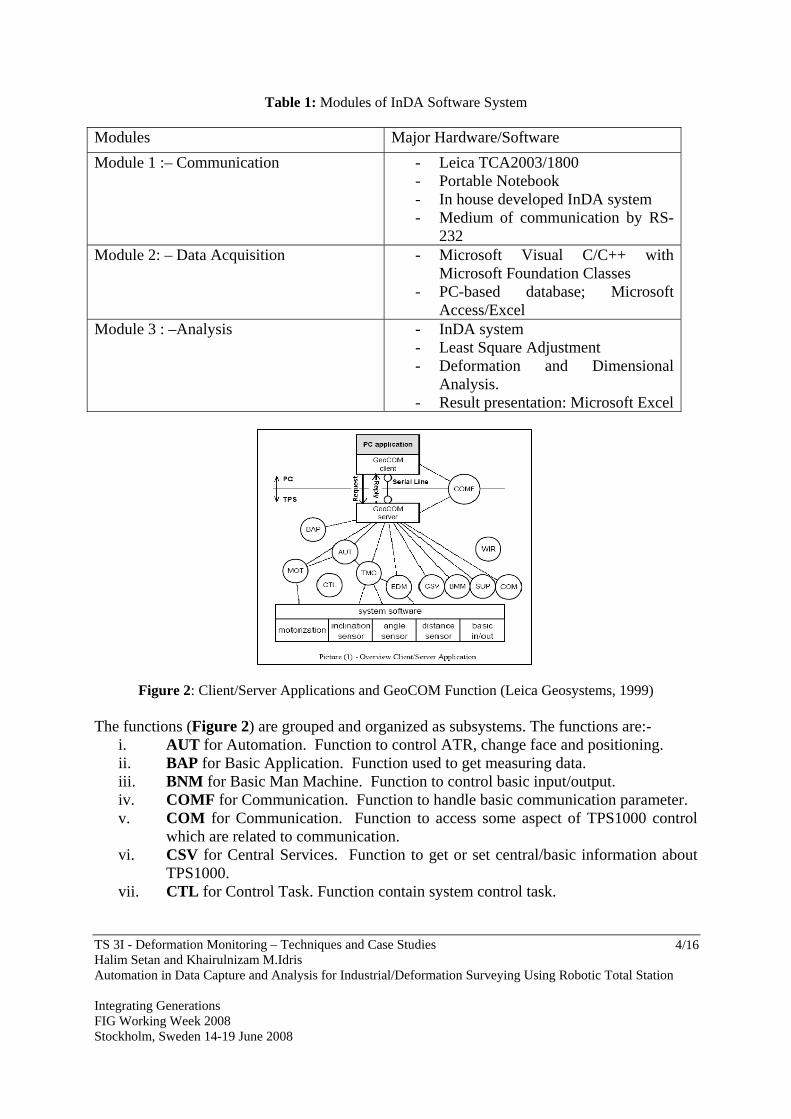
Table 1: Modules of InDA Software System
Modules Major Hardware/Software Module 1 :– Communication - Leica TCA2003/1800
- Portable Notebook - In house developed InDA system - Medium of communication by RS-
232 Module 2: – Data Acquisition - Microsoft Visual C/C++ with
Microsoft Foundation Classes - PC-based database; Microsoft
Access/Excel Module 3 : –Analysis - InDA system
- Least Square Adjustment - Deformation and Dimensional
Analysis. - Result presentation: Microsoft Excel
Figure 2: Client/Server Applications and GeoCOM Function (Leica Geosystems, 1999)
The functions (Figure 2) are grouped and organized as subsystems. The functions are:-
i. AUT for Automation. Function to control ATR, change face and positioning. ii. BAP for Basic Application. Function used to get measuring data. iii. BNM for Basic Man Machine. Function to control basic input/output. iv. COMF for Communication. Function to handle basic communication parameter. v. COM for Communication. Function to access some aspect of TPS1000 control
which are related to communication. vi. CSV for Central Services. Function to get or set central/basic information about
TPS1000. vii. CTL for Control Task. Function contain system control task.
TS 3I - Deformation Monitoring – Techniques and Case Studies Halim Setan and Khairulnizam M.Idris Automation in Data Capture and Analysis for Industrial/Deformation Surveying Using Robotic Total Station Integrating Generations FIG Working Week 2008 Stockholm, Sweden 14-19 June 2008
5/16
viii. EDM for Electronic Distance Measurement. Function module which measures distances.
ix. MOT for Motorization. Function to control movement and speed of movement of the instrument.
x. SUP for Supervisor. Function to control some of the general values of TPS1000. e.g. lower limit temperature.
xi. TMC for Theodolite Measurement and Calculation is a core module for getting measurement data.
xii. WIR for Windows Registration is a function for GSI recording. The communication module links the client and server, and the medium is serial communication line. The communication protocol is called GeoCOM command set. GeoCOM is based on SUN Microsystem’ Remote Procedure Call (RCPC) protocol. GeoCOM is able to recognize and act on certain sequences of character (commands) that are sent via the serial port. Here, GeoCOM means calling a function (Figure 2) The principle here is, on the low level of implementation, each procedure, which is executable on the remote instrument, is assigned a remote procedure call identification number. This number is used internally to associate a specific request, including the implicit parameter to a procedure on the remote device (Leica Geosystems, 1999). At this level, GeoCOM provides an ASCII interfaces. On the high level, GeoCOM provides normal function call interfaces for Microsoft Visual C/C++ and Microsoft VBA to these functions. Table 2 shows an example of request RPC syntax identification and a reply RPC syntax identification number. Example for syntax of an ASCII request and reply are given below:-
i. [%R1Q,5005: “New Instrument Name”^m] where, 5005: refers to Remote Procedure Call CSV_SetUserInstrumentName ^m: terminator ii. [%R1P, 0, 0 : 0, 1996, ‘07’, ‘19’, ‘10’, ‘13’, ‘2f’^m] where, 1st value of 0: Return code from GeoCOM. 0 means no error 2nd value of 0: The transaction ID of the request. 0 means no ID request 3rd value of 0: Return code from RPC. 0 means no error From value of ‘1996’ to ‘2f’: The value for month, day, hour, minute and second
GeoCOM employs synchronous communication. The request/reply pair may no be interrupted by another request/reply, and a communication task must be completed successfully before a new communication may be initiated. In a synchronous communication, both sender and receiver are synchronized to the same clock frequency (Miller, 1996). The type of GeoCOM communication is half-duplex. Half-duplex permits transmission in both directions but in only one direction at a time. Further details on data communication are given in Bayly (1989) and Miller (1996).
TS 3I - Deformation Monitoring – Techniques and Case Studies Halim Setan and Khairulnizam M.Idris Automation in Data Capture and Analysis for Industrial/Deformation Surveying Using Robotic Total Station Integrating Generations FIG Working Week 2008 Stockholm, Sweden 14-19 June 2008
6/16
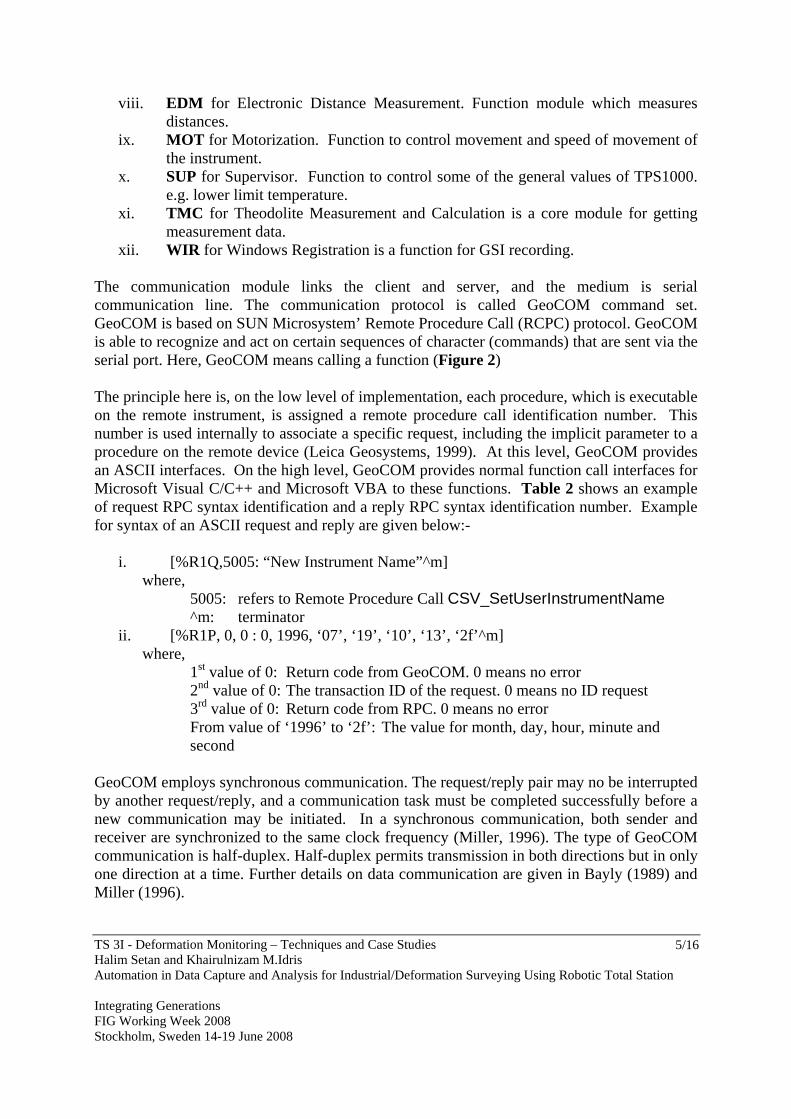
Table 2: Syntax of an ASCII request and reply
Syntax of an ASCII request [ ] [ ] ><><><><><>< TermPPTrIdRPCQRLF ,.......1][,0[:,,1%
Syntax of an ASCII reply ><><><<>< TermPRCTrIdGRCPR ,....]0[,:][,,1%
>< LF An initial line QR1% GeoCOM request type 1
QR1% GeoCOM request type 1 >< GRC GeoCOM return code >< RPC Remote Procedure Call
identification number in between 0 – 65535
>< TrId Transaction ID
>< TrId Optional transaction ID : Separator : Separator >< RC Return code from the
called RPC 1,0 ><>< PP
Parameter 0, Parameter 1,. ,..1,0 ><>< PP
Parameter 0, Parameter 1,.
>< Term Terminator string (default CR/LF, use COM_SetTerminator to change terminator)
>< Term Terminator string (default CR/LF, use COM_SetTerminator to change terminator)
3.2 Data Acquisition Module Programming in C/C++ or Visual C++ is based on the well-known Dynamic-Link Library (DLL) concept. The main communication component in InDA is GeoCOM protocol. To compile a software system successfully:-
i. A header file namely com_pub.hpp must be included. This header file contains all necessary constant, data type and function prototypes.
ii. Library file, geocom.lib has to be included in the software system. The library file enable the linker to resolve the DLL exported functions
iii. Dynamic-link library, geocom.dll file must be accessible for operating system. It must be located in a directory.
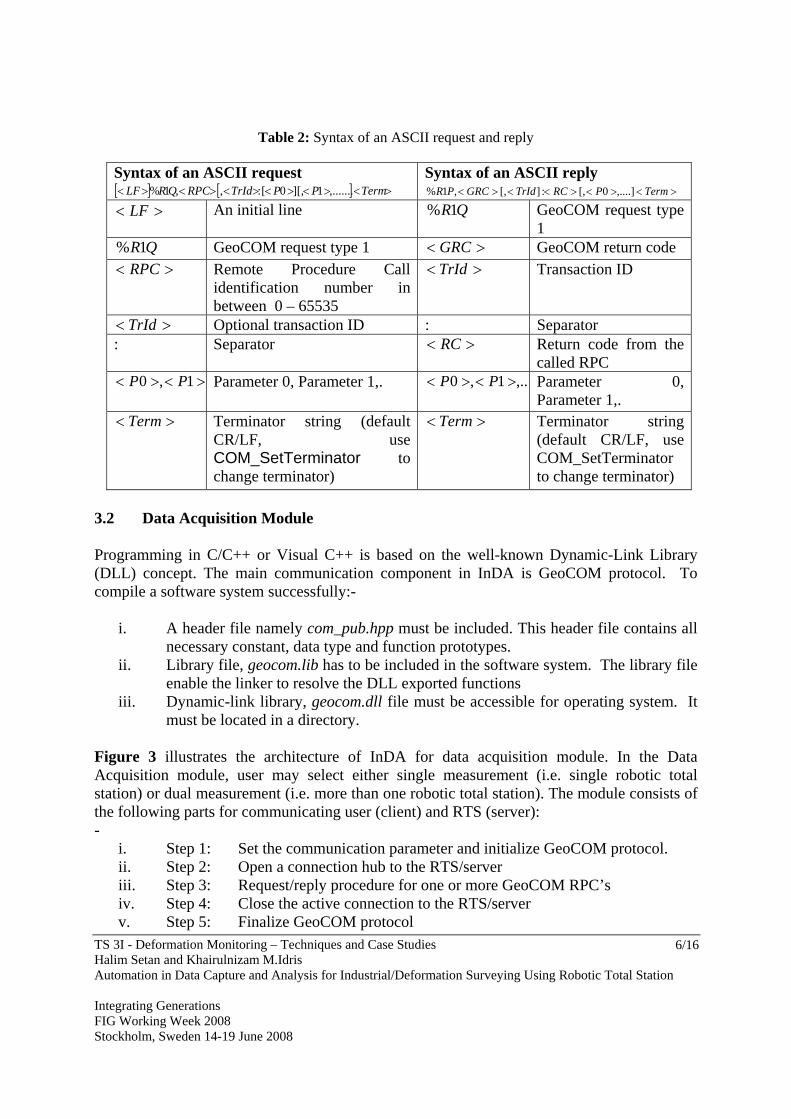
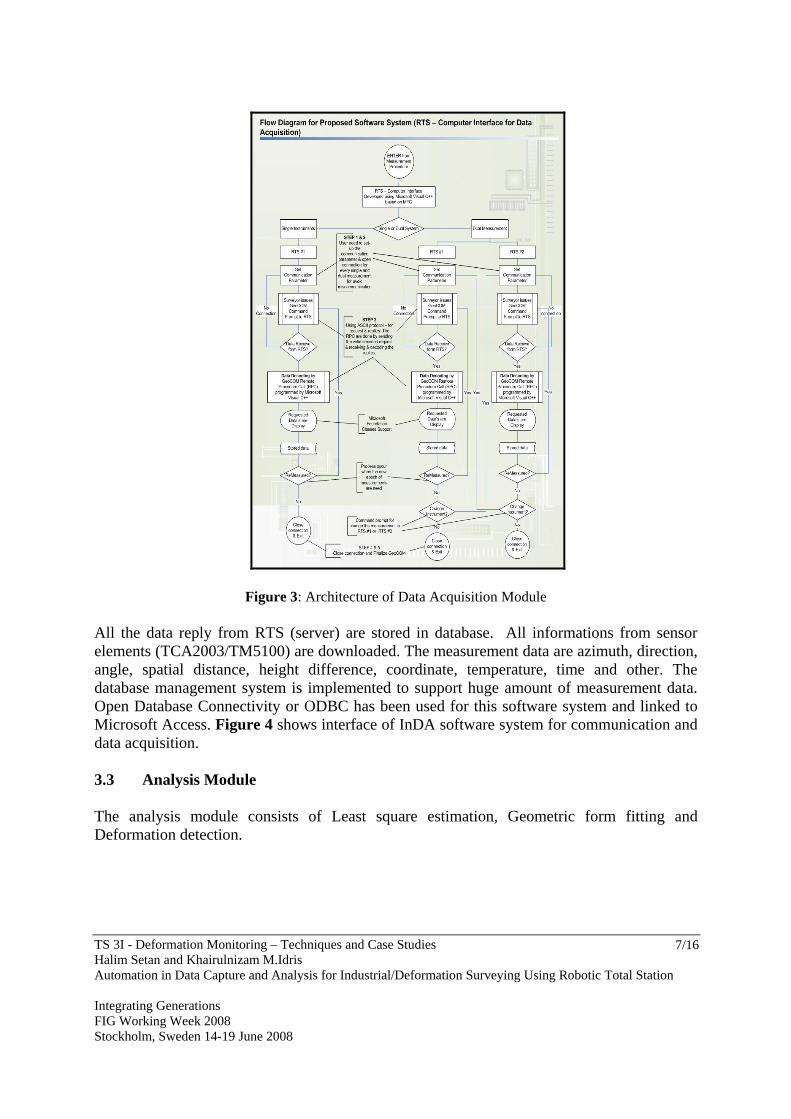
Figure 3 illustrates the architecture of InDA for data acquisition module. In the Data Acquisition module, user may select either single measurement (i.e. single robotic total station) or dual measurement (i.e. more than one robotic total station). The module consists of the following parts for communicating user (client) and RTS (server): -
i. Step 1: Set the communication parameter and initialize GeoCOM protocol. ii. Step 2: Open a connection hub to the RTS/server iii. Step 3: Request/reply procedure for one or more GeoCOM RPC’s iv. Step 4: Close the active connection to the RTS/server v. Step 5: Finalize GeoCOM protocol
TS 3I - Deformation Monitoring – Techniques and Case Studies Halim Setan and Khairulnizam M.Idris Automation in Data Capture and Analysis for Industrial/Deformation Surveying Using Robotic Total Station Integrating Generations FIG Working Week 2008 Stockholm, Sweden 14-19 June 2008
7/16
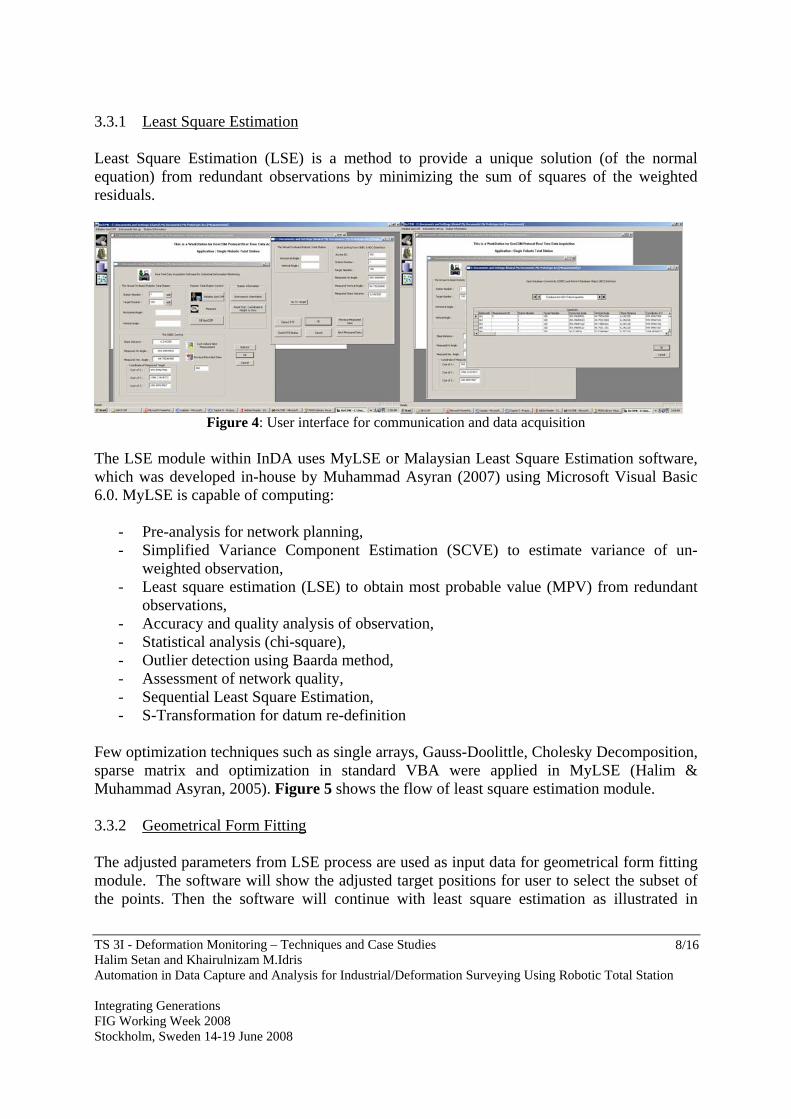
Figure 3: Architecture of Data Acquisition Module All the data reply from RTS (server) are stored in database. All informations from sensor elements (TCA2003/TM5100) are downloaded. The measurement data are azimuth, direction, angle, spatial distance, height difference, coordinate, temperature, time and other. The database management system is implemented to support huge amount of measurement data. Open Database Connectivity or ODBC has been used for this software system and linked to Microsoft Access. Figure 4 shows interface of InDA software system for communication and data acquisition. 3.3 Analysis Module The analysis module consists of Least square estimation, Geometric form fitting and Deformation detection.
TS 3I - Deformation Monitoring – Techniques and Case Studies Halim Setan and Khairulnizam M.Idris Automation in Data Capture and Analysis for Industrial/Deformation Surveying Using Robotic Total Station Integrating Generations FIG Working Week 2008 Stockholm, Sweden 14-19 June 2008
8/16
3.3.1 Least Square Estimation Least Square Estimation (LSE) is a method to provide a unique solution (of the normal equation) from redundant observations by minimizing the sum of squares of the weighted residuals.
Figure 4: User interface for communication and data acquisition
The LSE module within InDA uses MyLSE or Malaysian Least Square Estimation software, which was developed in-house by Muhammad Asyran (2007) using Microsoft Visual Basic 6.0. MyLSE is capable of computing:
- Pre-analysis for network planning, - Simplified Variance Component Estimation (SCVE) to estimate variance of un-
weighted observation, - Least square estimation (LSE) to obtain most probable value (MPV) from redundant
observations, - Accuracy and quality analysis of observation, - Statistical analysis (chi-square), - Outlier detection using Baarda method, - Assessment of network quality, - Sequential Least Square Estimation, - S-Transformation for datum re-definition
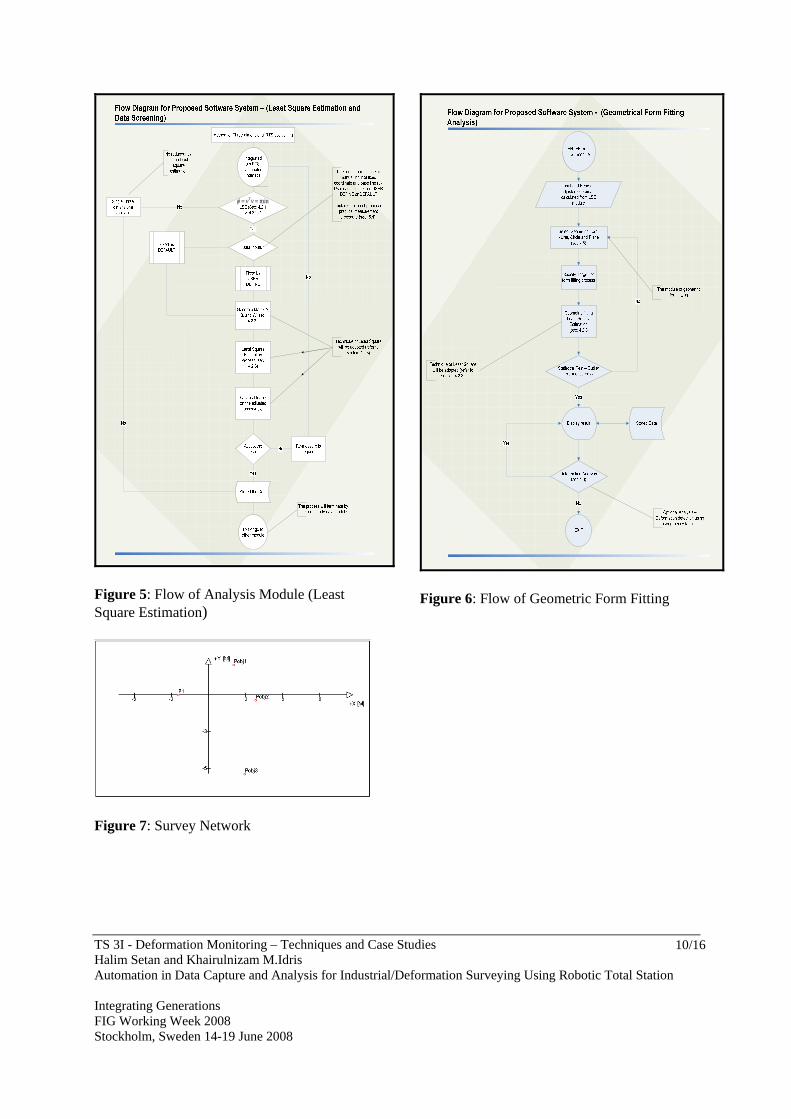
Few optimization techniques such as single arrays, Gauss-Doolittle, Cholesky Decomposition, sparse matrix and optimization in standard VBA were applied in MyLSE (Halim & Muhammad Asyran, 2005). Figure 5 shows the flow of least square estimation module. 3.3.2 Geometrical Form Fitting The adjusted parameters from LSE process are used as input data for geometrical form fitting module. The software will show the adjusted target positions for user to select the subset of the points. Then the software will continue with least square estimation as illustrated in

TS 3I - Deformation Monitoring – Techniques and Case Studies Halim Setan and Khairulnizam M.Idris Automation in Data Capture and Analysis for Industrial/Deformation Surveying Using Robotic Total Station Integrating Generations FIG Working Week 2008 Stockholm, Sweden 14-19 June 2008
9/16
Figure 6. As an option, the deformation analysis will support the geometric form fitting analysis. 3.3.3 Deformation Detection Deformation survey is one of the most important activities in engineering survey. The purpose is to determine trends of deformation between epochs. The deformation detection module uses the software called ADDS (Adjustment and Deformation Detection Software), and is capable of performing deformation analysis with multidimensional data. ADDS was developed in-house using Visual Basic 6.0 (VB6) language, and uses the robust method of Iterative Weighted Similarity Transformation (IWST) for deformation detection computation (Ernyza, 2007). ADDS consists of three main modules. The first module is Converter. It acts as a connection for STARNET (commercial LSE software) via OLE (Object Linking and Embedding). This module is also capable of converting LSE output of STARNET to the readable input format for the second module of ADDS. The second module is the deformation detection module. This module will give the results of deformation detection process in numerical result. The third module is the graphical interpretation module. A library consisting of graphical routines for VB6 objects named Vecad is used in this module. This module will display the deformation vectors and error ellipses of the deformation analysis. The graphical results from ADDS can be exported to the graphical commercial software, AutoCad. 4 VERIFICATION BETWEEN InDA SOFTWARE & LEICA APSWin This research used Leica APSWin software to check the reliability, ability and capability of InDA Communication and Data Acquisition Module. The simulation test was done at Surveying Engineering Research Group Laboratory. Three points are setup around the laboratory and TCA2003 single measurement (single robotic total station) was used. Leica TCA2003 is equipped with ATR function, which has capability to measure the targets in fully robotic control from Leica APSWin software. Operator still needed to aim the robotic total station telescope to the target, and then ATR function will be activated when the measure command is given. Figure 7 shows the schematic diagram of survey network (target: P1, Pobj1, Pobj2 and Pobj3). Two campaign of measurement were done using Leica APSWin and InDA. For Leica APSWin, one-hour observation campaign was setup and produced 36 cycles of observation. For InDA, the observation also collected 36 cycles within one and half-hour period. The first cycle was taken as reference cycle.
TS 3I - Deformation Monitoring – Techniques and Case Studies Halim Setan and Khairulnizam M.Idris Automation in Data Capture and Analysis for Industrial/Deformation Surveying Using Robotic Total Station Integrating Generations FIG Working Week 2008 Stockholm, Sweden 14-19 June 2008
10/16
min== vvTφ
Figure 5: Flow of Analysis Module (Least Square Estimation)
Figure 7: Survey Network
Figure 6: Flow of Geometric Form Fitting
TS 3I - Deformation Monitoring – Techniques and Case Studies Halim Setan and Khairulnizam M.Idris Automation in Data Capture and Analysis for Industrial/Deformation Surveying Using Robotic Total Station Integrating Generations FIG Working Week 2008 Stockholm, Sweden 14-19 June 2008
11/16
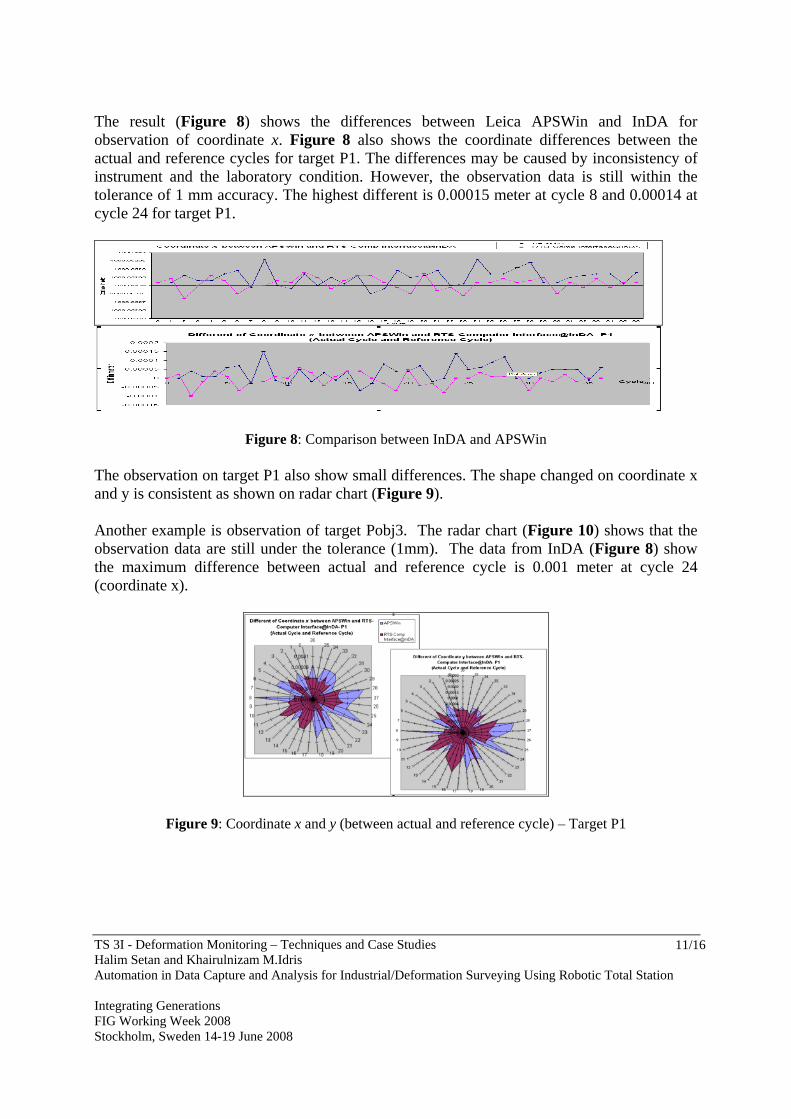
The result (Figure 8) shows the differences between Leica APSWin and InDA for observation of coordinate x. Figure 8 also shows the coordinate differences between the actual and reference cycles for target P1. The differences may be caused by inconsistency of instrument and the laboratory condition. However, the observation data is still within the tolerance of 1 mm accuracy. The highest different is 0.00015 meter at cycle 8 and 0.00014 at cycle 24 for target P1.
Figure 8: Comparison between InDA and APSWin The observation on target P1 also show small differences. The shape changed on coordinate x and y is consistent as shown on radar chart (Figure 9). Another example is observation of target Pobj3. The radar chart (Figure 10) shows that the observation data are still under the tolerance (1mm). The data from InDA (Figure 8) show the maximum difference between actual and reference cycle is 0.001 meter at cycle 24 (coordinate x).
Figure 9: Coordinate x and y (between actual and reference cycle) – Target P1

TS 3I - Deformation Monitoring – Techniques and Case Studies Halim Setan and Khairulnizam M.Idris Automation in Data Capture and Analysis for Industrial/Deformation Surveying Using Robotic Total Station Integrating Generations FIG Working Week 2008 Stockholm, Sweden 14-19 June 2008
12/16
Figure 10: Coordinate x and y (between actual and reference cycle) – Target Pobj3 5 REAL OBSERVATION CAMPAIGN Currently, Surveying Engineering Research Group Lab collaborates with Aeronautic Laboratory Universiti Teknologi Malaysia for dimensional measurement of a helicopter model (Figure 11). InDA software package is fully used and support the geodetic observation using RTS (via TCA 2003 and TM5100). InDA software is fully operated from automatic data acquisition and on site processing analysis. The observation campaign using TCA2003 and TM5100 with InDA software system determined several points on the body of helicopter model. The results of the measurements are compared to close range photogrametry, laser scanning, and manual measurement using caliper. Figure 11 shows the helicopter model and geodetic industrial measurement.
Figure 11: Helicopter Model & Industrial Measurent Campaign
TS 3I - Deformation Monitoring – Techniques and Case Studies Halim Setan and Khairulnizam M.Idris Automation in Data Capture and Analysis for Industrial/Deformation Surveying Using Robotic Total Station Integrating Generations FIG Working Week 2008 Stockholm, Sweden 14-19 June 2008
13/16
From Table 3, several points (or landmarks) on the body of helicopter model are selected and measured. For comparison purpose, the same points are used for laser scanning observation and photogrametry. The differences between RTS, laser scanning and photogrametry are within 1 mm for several landmarks (such as vertical tail, horizontal tail back, landing gear (front) and upper tail boom). For landmarks such as landing gear (back) and blade, the differences are between 2 mm to 3mm. The reason maybe caused by positional dilution of precision (PDOP). PDOP refer to intersection of target point from observation point (Allan, 1997).
Table 3: Comparison between several instrumentation
Landmark TCA2003/TM5100 (mm)
Laser Scanning (mm)
Photogrametry (mm)
Vertical Tail 221.00 221.086 221.930 Horizontal Tail Back 197.04 196.944 197.600 Landing Gear Front 310 309.691 310.080 Landing Gear Back 312 308.397 307.710 Blade 83.00 80.872 80.600 Upper Tail Boom 453 Not Available 454
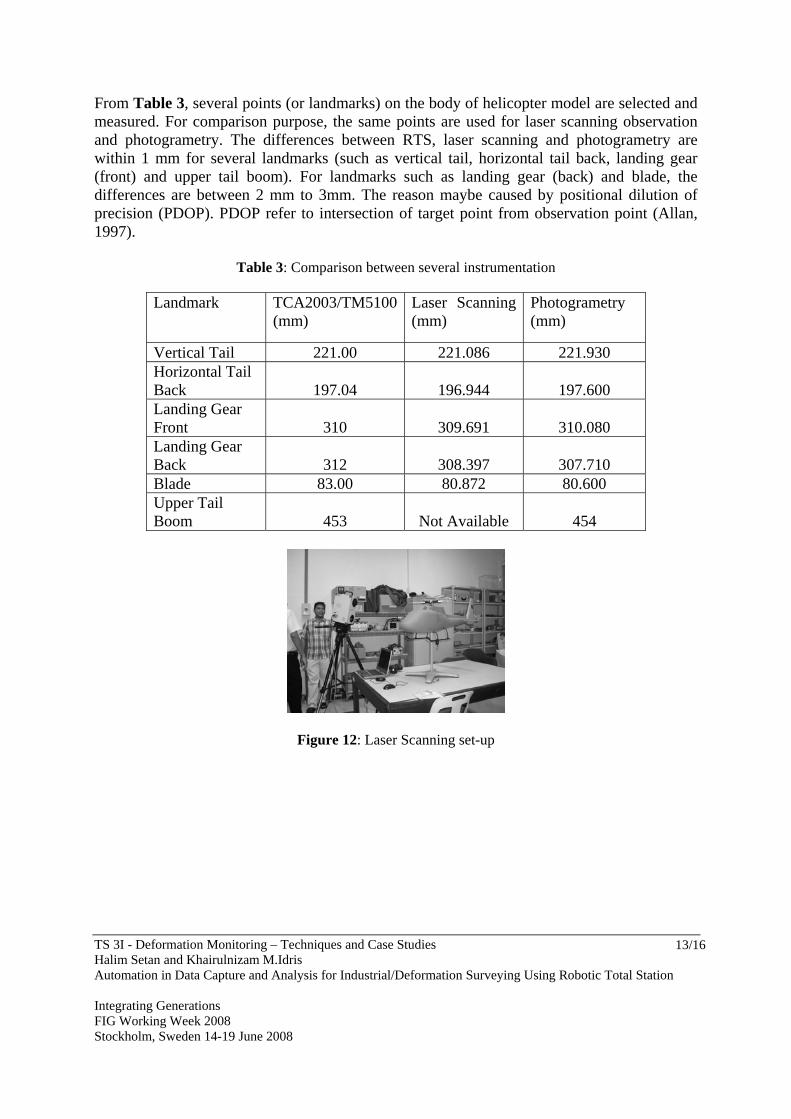
Figure 12: Laser Scanning set-up
TS 3I - Deformation Monitoring – Techniques and Case Studies Halim Setan and Khairulnizam M.Idris Automation in Data Capture and Analysis for Industrial/Deformation Surveying Using Robotic Total Station Integrating Generations FIG Working Week 2008 Stockholm, Sweden 14-19 June 2008
14/16
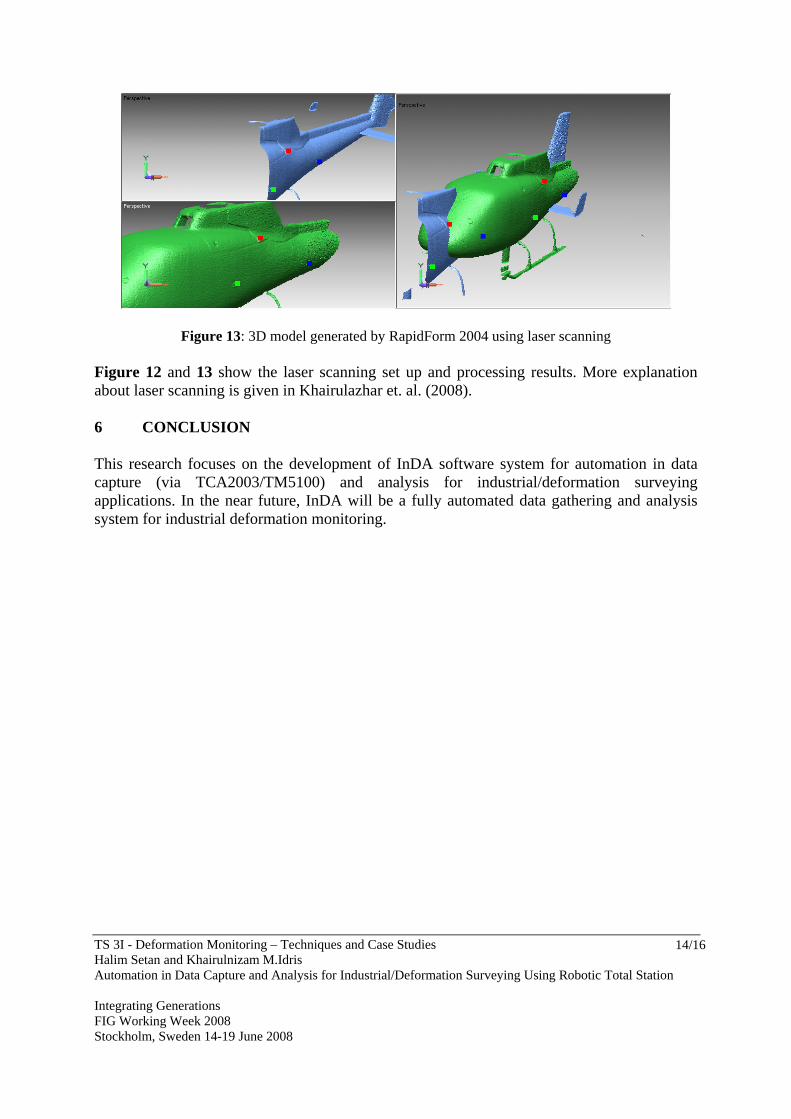
Figure 13: 3D model generated by RapidForm 2004 using laser scanning Figure 12 and 13 show the laser scanning set up and processing results. More explanation about laser scanning is given in Khairulazhar et. al. (2008). 6 CONCLUSION This research focuses on the development of InDA software system for automation in data capture (via TCA2003/TM5100) and analysis for industrial/deformation surveying applications. In the near future, InDA will be a fully automated data gathering and analysis system for industrial deformation monitoring.

TS 3I - Deformation Monitoring – Techniques and Case Studies Halim Setan and Khairulnizam M.Idris Automation in Data Capture and Analysis for Industrial/Deformation Surveying Using Robotic Total Station Integrating Generations FIG Working Week 2008 Stockholm, Sweden 14-19 June 2008
15/16
ACKNOWLEDGEMENT The authors acknowledge financial assistance for this research from Ministry of Science, Technology and Innovation (MOSTI) Malaysia for Scholarship of National Science Fellowship (NSF) and ESCIENCE research grant vote 79141. REFERENCES Allan, A.L. (1997). Practical Surveying and Computations (Revised Second Edition).
Amimprint of Butterworth-Heinemann, Linacre House, Jordan Hill, Oxford OX28DP: A division of Reed Educational and Professional Publishing Ltd
Bayly, D.A. (1991). Machinery Alignment Monitoring with an Electronic Theodolite System. University of Calgary: M.Sc. Thesis.
Ernyza Endot (2007). Implementasi Pengoptimuman Komputer Dalam Pembangunan Perisian Analisis Pelarasan Kuasa Dua Terkecil. MSc Thesis. Universiti Teknologi Malaysia.
Miller, G. M. (1996). Modern Electronic Communication. 5th Edition. New Jersey: Prentice-Hall.Halim Setan & Muhammad Asyran Che Amat (2005) Implementation of sparse matrix in Cholesky decomposition to solve normal equation. In: International Symposium & Exhibition on Geoinformation 2005 Geospatial Solutions for Managing the Borderless World, 27 – 29.9.05., Pulau Pinang.
Khairulazhar Zainuddin, Halim Setan, Zulkiflie Majid & Iskandar Shah Ishak (2008). First Experience on Using Laser Scanning Technology for Reverse Engineering Application. To be presented at International Conference on Civil Engineering, Hyatt Regency Kuantan Pahang Malaysia 12 – 14 May 2008.
Leica Geosystems (1999). GeoCOM Reference Manual. Switzerland: User Manual. Muhammad Asyran Che Amat (2007). Implementasi Pengoptimuman Komputer Dalam
Pembangunan Perisian Analisis Pelarasan Kuasa Dua Terkecil. MSc Thesis. Universiti Teknologi Malaysia.
BIOGRAPHICAL NOTES Prof. Dr. Halim Setan, born 1957. Graduated in 1984 with B.Sc. (Hons.) Surveying & Mapping Science from North East London Polytechnic, United Kingdom and master degree from Ohio State University, USA. Obtained doctoral degree in 1995 from City University, London. Professor at Department of Geomatic Engineering, Universiti Teknologi Malaysia (UTM). Khairulnizam M Idris, born 1977. Graduated in 1999 with Diploma in Surveying and obtained first degree in Engineering (Geomatic) in 2001 from UTM. Obtained M.Sc. in Industrial Surveying in 2004 also from UTM. Since August 2004, post graduate student for doctorate program and researcher at Surveying Engineering Research Group Laboratory, Department of Geomatic Engineering, UTM.

TS 3I - Deformation Monitoring – Techniques and Case Studies Halim Setan and Khairulnizam M.Idris Automation in Data Capture and Analysis for Industrial/Deformation Surveying Using Robotic Total Station Integrating Generations FIG Working Week 2008 Stockholm, Sweden 14-19 June 2008
16/16
CONTACTS Prof. Dr. Halim Setan Department of Geomatic Engineering Faculty of Geoinformation Science & Engineering Universiti Teknologi Malaysia 81310 UTM Skudai Johor Bahru Johor MALAYSIA Tel.+ 60-7-5530908 Fax.+ 60-7-5566163 Email : [email protected] WebSite : www.fksg.utm.my Khairulnizam M Idris Surveying Engineering Research Group (Post-Grad Laboratory) Department of Geomatic Engineering Faculty of Geoinformation Science & Engineering Universiti Teknologi Malaysia 81310 UTM Skudai Johor Bahru Johor MALAYSIA Tel.+ 60-7-5530787 Fax.+ 60-7-5566163 Email : [email protected]