Embed Size (px)
Citation preview
1 | P a g e
AUTOMOBILE INDUSTRY REPORT
December 11th, 2013
SECTORAL REPORTS
B. Anil Kumar
Equity Analyst
Equity Research Desk
Highlights
The India auto industry closed 2012-13 with a sales dip of 6.7%, the
first drop in 12 years. The outlook for 2013-14 isn't much brighter,
with expects a growth of 3-5%.
During April-November 2013, overall automobile exports grew by
5.52 percent. Passenger Vehicles, Three Wheelers and Two Wheelers
registered growth at 9.64 percent 16.98 percent and 3.41 percent
respectively, while Commercial Vehicles declined by 12.31 percent
during April-November 2013 compared to the same period last year.
The cumulative foreign direct investment (FDI) inflow into the Indian
automobile industry during April 2000 to July 2013 was recorded at
US$ 8,932 million, amounting to 4.5 per cent of the total FDI inflows.
Hero MotoCorp will plan to enter into 50 countries with 20
manufacturing facilities across the globe and 100 million cumulative
two-wheelers sold by 2020.
Nissan Motor India has entered into an agreement with Ennore Port
Ltd (EPL), to export at least 60,000 cars a year through the port for the
next 10 years.
HMIL has invested US$ 2 billion in two state-of-the-art passenger car
manufacturing facilities in India. Moreso, India contributes 25 per cent
of the firm’s global sales.
The Government of India plans to introduce fuel-efficiency ratings for
automobiles to encourage sale of cars that consume less petrol or
diesel.
Global suppliers are setting up R&D centers in India to increase local
content in vehicles and at the same time leverage it as a global hub for
design and technology.
Japanese auto-maker Isuzu Motors is setting up its first car plant in
South India at an investment of Rs 3,000 crore and is expected to
become operational by 2016.
The automotive sector’s contribution to the gross domestic product
(GDP) is expected to double reaching a turnover worth US$ 145 billion
in 2016, according to the Automotive Mission Plan (AMP) 2006-2016.

2 | P a g e
CONTENTS
1. Industry Overview 03
2. Performance of Automobile Industry in India 2013 03
3. Automobile Industry in India 07
4. Production in the Indian Automobile Industry 09
5. Trends in the Indian Automobile Industry 10
6. Growth drivers for Automobile Sector 11
7. Automobile Industry Companies in India 12
MARUTI SUZUKI INDIA LTD
TATA MOTORS LTD
MAHINDRA & MAHINDRA LTD
HERO MOTOCORP LTD
BAJAJ AUTO LTD
EICHER MOTORS LTD
TVS MOTOR COMPANY LTD
ATUL AUTO LTD
8. Advantages in India 54
9. Key Developments & Investments 55
10. Increasing investments by global car manufacturers 56
11. Government initiatives 56
12. Industry Challenges Industry 57
13. Key Opportunities 58
14. Conclusion 59
3 | P a g e
1. Industry Overview
With the increasing growth in demand on back of rising income, expanding middle class and young population
base, in addition to a large pool of skilled manpower and growing technology, will propel India to be among the
world's top five auto-producers by 2015. India is also one of the key markets for hybrid and electric medium-
heavy-duty trucks and buses.
Indian automobile industry contributes significantly to the overall GDP of the nation and also provides significant
business and employment opportunities. It is an engine of growth for the Indian economy. It is one of the key
industries whose well being is very important in our vision of improving the living standard of our population.
According to the Society for Indian Automobile Manufacturers (SIAM), the automobile industry has already
invested Rs. 70,000 crores in the past four years in building new factories, adding fresh capacity and bringing out
new products. It is driven by a sustained increase in vehicle population and an increasing preference towards
higher-end vehicles with rising consumer aspirations (Volvo registered 155% increased growth of its luxury
segment in 2012).
In Export business, during April-November 2013, overall automobile exports grew by 5.52 percent. Passenger
Vehicles, Three Wheelers and Two Wheelers registered growth at 9.64 percent 16.98 percent and 3.41 percent
respectively, while Commercial Vehicles declined by 12.31 percent during April-November 2013 compared to
the same period last year.
2. Performance of Automobile Industry in India 2013
Two-wheelers
Improved income prospects to drive two-wheeler sales in 2013-14
After a robust 2010-11, growth in total domestic two-wheeler sales slowed to 14.1 per cent in 2011-12. In
2012-13, growth in domestic two-wheeler sales slowed further to 2.9 per cent, as slow in incomes, especially
in rural areas, high fuel prices impacted consumer sentiment. Exports declined by 1 per cent y-o-y over a 27
per cent growth in 2011-12, mainly due to the drop in export incentives post the withdrawal of the DEPB
scheme, unfavorable policy actions in key Asian markets and higher competition in African markets.
In 2013-14, growth is expected to recover modestly to 6-8 per cent on expectations of normal monsoons
aiding healthy rural incomes, recovery urban incomes and lower fuel prices. However the growth will remain
in single digits. Over the long term, the under penetrated rural market will hold the key to the industry’s
growth.

4 | P a g e
Exports growth to remain robust with new launches by players
Two-wheeler exports grew by 27 per cent in 2011-12, as volumes remained buoyant despite the
discontinuation of the DEPB scheme during the year.
In 2012-13, however, two-wheeler exports fell by 1 per cent owing to the following reasons:
The withdrawal of the DEPB scheme and subsequent reductions in incentives under the Duty Drawback
scheme forced to players to hike prices across markets. Since most of these are price-sensitive segments
(economy motorcycles account for over 50 per cent of total exports), the price hikes directly impacted
demand.
Unfavorable policy actions in some major markets like Sri Lanka, wherein 100 per cent import duties
were imposed on two-wheelers.
Higher competition in African markets where Honda Motorcycles (Japan) and a number of Chinese
manufactures entered the market with aggressively priced products.
In 2013-14, growth is expected to recover to 11-13 per cent because of fewer policy-related disruptions and
new launches.
Commercial vehicles
CV Sales Volumes decline in 201-13, to revive in 2013-14 on higher GDP expectations
Key macroeconomic indicators such as IIP, rail freight loading, mining, road awarding and execution, and
growth in port traffic remained weak during 2012-13, thereby impacting CV sales. CV sales declined by 2 per
cent (y-o-y) in 2012-13, after growing by 28.5 per cent and 18 per cent respectively in 2010-11 and 2011-12.
Sales of medium and heavy commercial vehicles (MHCV’s), which are directly linked to the level of economic
activity, declined by 25.9 per cent in 2012-13 following deceleration in GDP growth to 5.0 per cent. Lower
Industrial and agricultural output, weak transporter sentiments – weighed down by increase in fuel prices,
high interest rates, inflation and higher vehicle prices – continued to impact MHCV sales. Other factors that
had a bearing on sales growth were availability of finance, and subdued freight rtes. In contrast, LCV sales
proved to be relatively resilient to the slowdown in GDP growth, and grew at 15.9 per cent.
5 | P a g e
Segment wise Short-term calls
Segments 2011-12
Growth (%) 2012-13
Growth (%)
MHCV's goods 8.8 (25.9)
LCV goods 30.2 15.9
Buses 6.5 (4.1)
MHCV vehicles
Weaker sentiments lower GDP growth dragged down MHCV sales in 2012-13
After recording c CAGR of 35.7 per cent in 2008-09 and 2009-10, growth in MHCV sale had moderated to 8.8
per cent in 2011-12 following the slowdown in GDP growth. After dipping to 3.9 per cent in 2011-12,
industrial GDP continued to slowdown in 2012-13 precipitating a 25.9 per cent fall in MHCV sales in 2012-
13.during the year 2012-13, the slowdown in GDP impacted freight availability and rates, where as the
continuing rise in fuel costs and high interest rates increased the cost of vehicle ownership, thus affecting
transporter sentiments.
We expect MHCV sales to see a modest recovery in 2013-14 based on expectations of higher GDP growth.
Recovery in MHCV sales will, however, lag revival in GDP growth. Fleet utilization levels of transporters and
spot freight will have to improve before a recovery is visible in MHCV sales.
LCV sales relatively less impacted by economic slowdown
Light commercial vehicles (LCV’s) grew by 15.9 per cent in 2012-13 enabled by a 21 per cent increase in the
sales of small commercial vehicles (SCVs). Growth in the SCV segment was led by sharp growth in the pick-up
segment and a corresponding moderation in growth in the sub-one tone category in 2012-13. The sub-one
tonne segment declined following a shift in demand from the mini truck (0.75 tonne payload category) to the
small pick-up category (about 1.25 tonne payload capacity) because of aggressive marketing and financing
initiatives undertaken by the OEMs for pick-ups. Sales of higher tonnage LCVs fell by 22.7 per cent in 2012-13
with slowdown in freight demand, and the shift in preference for SCV and ICVs.
Goods three-wheeler offtake is estimated to have declined by 9 per cent in 2012-13. However, in 2013-14,
three-wheeler sales expected to show a modest recovery led by a consumption-led revival GDP.
6 | P a g e
Small trucks continue to spur LCV sales
Small commercial vehicles (SCVs), comprising mini trucks and pick-ups, will remain the fastest growing
category in the light commercial vehicles (LCVs) segment. Led by player initiatives, pick-ups will continue to
outrun sub-one tonne sales in the near term. Sales of LCVs is expected to grow by 10-12 per cent in 2013-14.
While mini-trucks have almost entirely replaced the use of large three-wheelers, sales of micro-trucks will
drive sales growth.
Passenger vehicles
Bus sales growth fell in 2012-13
Bus sales declined by 4 percent in 2012-13, owing to slowdown in demand from State Transport
Undertakings (STUs) and cautious approach undertaken by private operators towards new investments.
Demand form private operators, particularly contract operators plying buses for school and corporate
segments, has been affected by the slowdown in the service sector (especially the IT/ITeS sector) and in
ability of these operators to pass on the continues increase in fuel cost. A revival in sales is, however, likely in
2013-14, with expected improvement in demand from contrast operators, following a recovery in the
services sector, as well as from STUs.
PV sales grew at sub-5 per cent levels for second consecutive year
Domestic sales of cars and utility vehicles (UVs) grew by merely 2 per cent in 2012-13 despite a low base in
2011-12. Domestic car sales, which had increased by 3 per cent in 2011-12, declined by 7 percent in 2012-13.
Growth was impacted due to weak macroeconomic growth, uncertainly over income growth, increasing
petrol prices, high interest rates and lower disposable income caused by high inflation. Additionally, a
lockout at market leader Maruti Suzuki India’s Ltd (MSIL) Manesar production facility, and the consequent
disruption in production, impacted growth marginally.
On the other hand, domestic utility vehicles (UVs) including vans, grew by 32 per cent during 2012-13
because of new model launches during the year and also due to increased preference for diesel vehicles.
Domestic car and UV sales to recover slowly in 2013-14
We expect passenger vehicle sales to grow by 5-7 per cent in 2013-14 over a 2 per cent growth in 2012-13.
Macroeconomic recovery and decline in petrol prices would aid a revival in small car sales. We expect utility
vehicle sales to continue to grow, led by new model launches. However, growth will be capped at 9-11 per
7 | P a g e
cent on account of diesel price hikes. Long term growth prospects will remain healthy until 2017-78, as
passenger vehicle penetration is currently at low levels.
Exports stage a recovery in 2012-13
Exports of cars & utility vehicles (UVs) grew by 9 per cent in 2012-13 after a marginal decline of 0.4 per cent
in 2011-12.weak global demand, especially in Europe, one of the largest export markets, had impacted
demand in 2011-12. In 2012-13, sluggish demand in Europe and increase in import and excise duty rates in
Sri Lanka, which accounts for nearly 5 per cent of the total exports like MSIL, restricted growth to single
digits.
3. Automobile Industry in India
The Indian automotive industry is currently going through one of its most challenging phases so far. Vehicle sales
are set to register a negative growth in 2013 – first time in more than a decade – compared with the previous
year. Official data shows that vehicle sales in India declined at a high single digit rate year on year in the first nine
months of 2013 compared to 2012. This downward spiral has prompted automakers and suppliers to cut
production to avoid excess inventory build-up. Besides, there's little respite on the cost front. Though there has
recently been some softening in raw materials prices, other costs such as wages, cost of power and finance
expenses, continue to erode suppliers' operating margins. Car sales in India are expected to fall in the current
financial year, marking a second straight year of decline, as high interest rates and a slowing economy force
consumers to delay purchases.
The weakness in the automotive market has taken its toll on the investment drive of many suppliers. While
international suppliers have continued their investments in India, citing the country's long-term growth
prospects, local suppliers have almost put their expansion plans on hold until there is a sustained recovery in
vehicles sales. The Indian automotive industry at the moment is facing multiple challenges such as slowing
economic growth, high inflation and high interest rates – compared with many of its peers. IHS however is
sanguine about the country's growth trend in the medium to long term and forecasts recovery in vehicle sales in
2014, and high single-digit growth in vehicle sales for the rest of this decade. IHS expects vehicle sales in India to
grow at an average rate of 12.2% annually between 2014 and 2020; sales are expected to reach 7.1 million units
by 2020 compared with 3.6 million in 2012.
Key Statistics
The Indian automobile industry produced a total 1.69 million vehicles including passenger vehicles, commercial
vehicles, three wheelers and two wheelers in August 2013 as against 1.56 million in August 2012, registering a
growth of 8.18 percent over the same month last year.
8 | P a g e
The cumulative foreign direct investment (FDI) inflow into the Indian automobile industry during April 2000 to
July 2013 was recorded at US$ 8,932 million, amounting to 4.5 per cent of the total FDI inflows (in terms of US$),
according to Department of Industrial Policy and Promotion (DIPP), Ministry of Commerce.
The overall automobile exports grew by 2.03 per cent during April-August 2013. Furthermore, the production of
passenger vehicles in India was recorded at 3.23 million in 2012-13 and is expected to grow at a compound
annual growth rate (CAGR) of 13 per cent during 2012-2021, according to Automotive Component
Manufacturers' Association of India (ACMA).
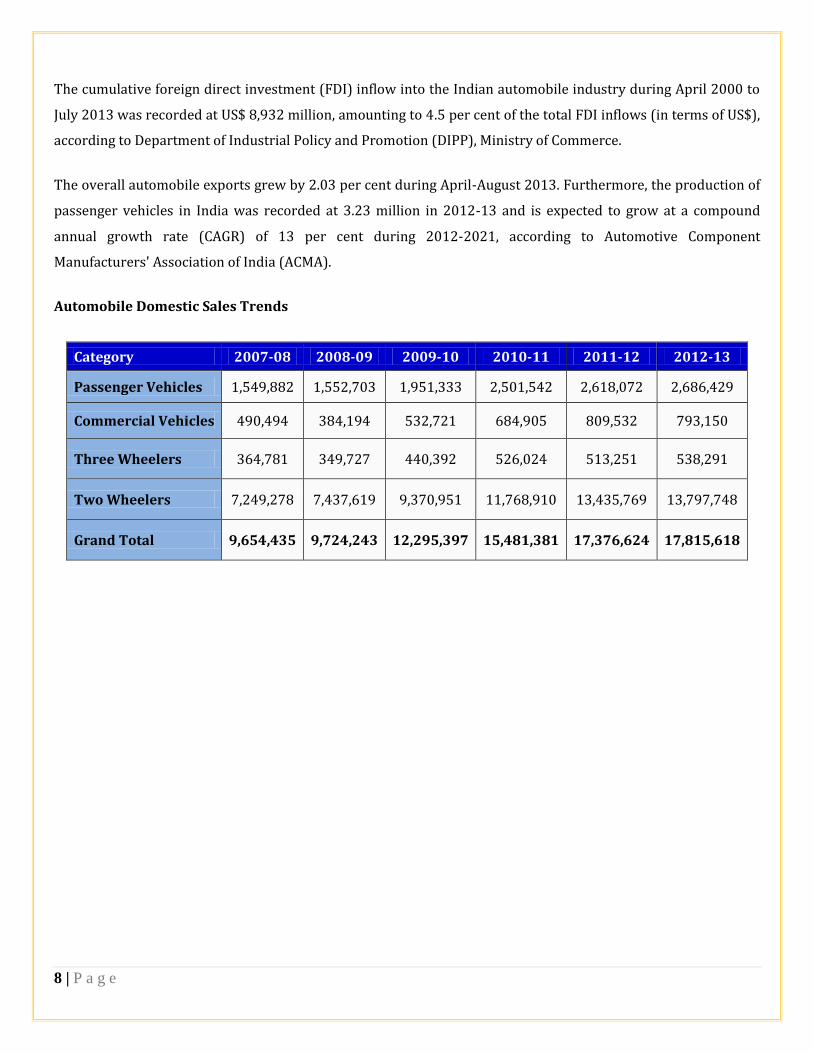
Automobile Domestic Sales Trends
Category 2007-08 2008-09 2009-10 2010-11 2011-12 2012-13
Passenger Vehicles 1,549,882 1,552,703 1,951,333 2,501,542 2,618,072 2,686,429
Commercial Vehicles 490,494 384,194 532,721 684,905 809,532 793,150
Three Wheelers 364,781 349,727 440,392 526,024 513,251 538,291
Two Wheelers 7,249,278 7,437,619 9,370,951 11,768,910 13,435,769 13,797,748
Grand Total 9,654,435 9,724,243 12,295,397 15,481,381 17,376,624 17,815,618
9 | P a g e
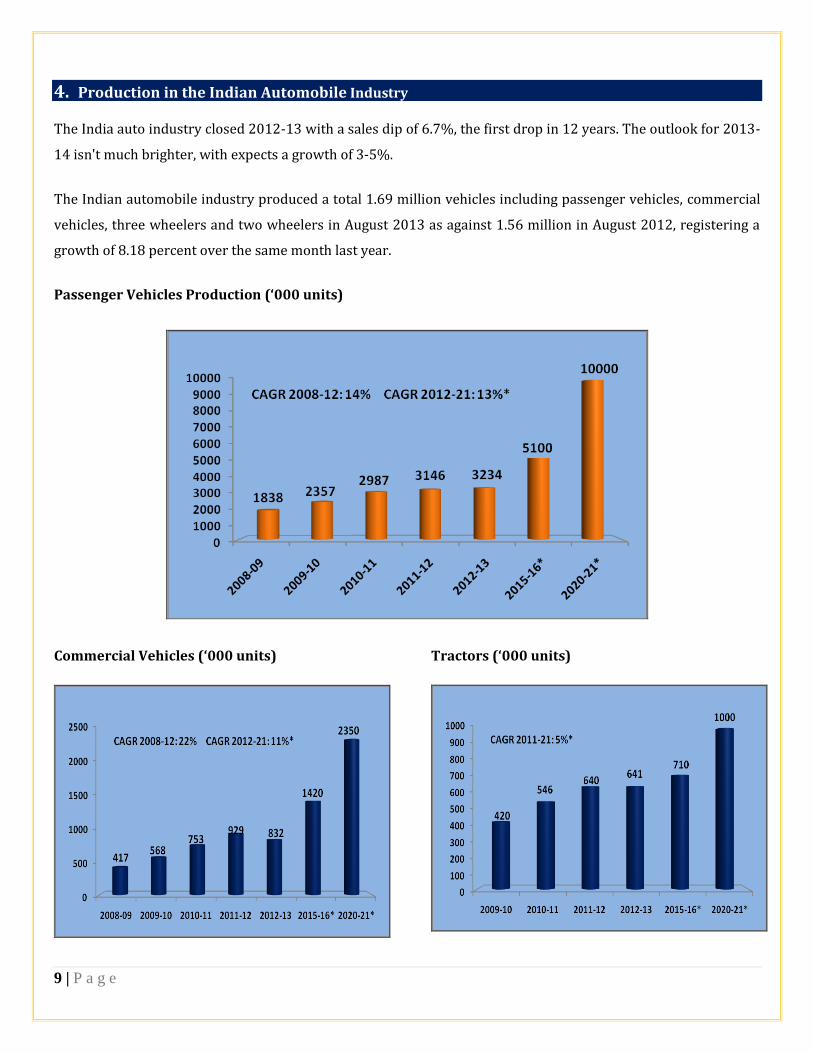
4. Production in the Indian Automobile Industry
The India auto industry closed 2012-13 with a sales dip of 6.7%, the first drop in 12 years. The outlook for 2013-
14 isn't much brighter, with expects a growth of 3-5%.
The Indian automobile industry produced a total 1.69 million vehicles including passenger vehicles, commercial
vehicles, three wheelers and two wheelers in August 2013 as against 1.56 million in August 2012, registering a
growth of 8.18 percent over the same month last year.
Passenger Vehicles Production (‘000 units)
Commercial Vehicles (‘000 units)
Tractors (‘000 units)
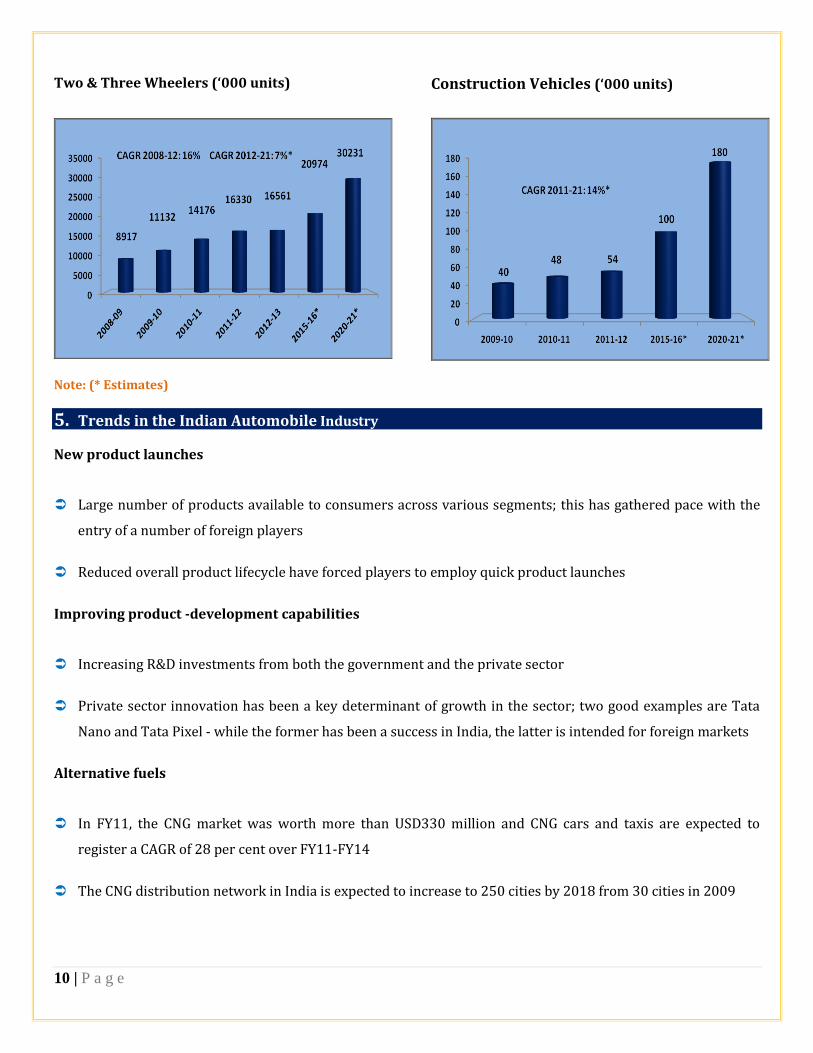
10 | P a g e
Two & Three Wheelers (‘000 units)
Construction Vehicles (‘000 units)
Note: (* Estimates)
5. Trends in the Indian Automobile Industry
New product launches
Large number of products available to consumers across various segments; this has gathered pace with the
entry of a number of foreign players
Reduced overall product lifecycle have forced players to employ quick product launches
Improving product -development capabilities
Increasing R&D investments from both the government and the private sector
Private sector innovation has been a key determinant of growth in the sector; two good examples are Tata
Nano and Tata Pixel - while the former has been a success in India, the latter is intended for foreign markets
Alternative fuels
In FY11, the CNG market was worth more than USD330 million and CNG cars and taxis are expected to
register a CAGR of 28 per cent over FY11-FY14
The CNG distribution network in India is expected to increase to 250 cities by 2018 from 30 cities in 2009
11 | P a g e
Upcoming trends
India is emerging as a strong automotive R&D hub with foreign players like Hyundai, Suzuki, and General
Motors setting up base in India. This move is further enhanced by Government’s support towards setting up
centres for development and innovation. Tata Nano’s successful entry in the Indian market has steamed up
the opportunities of growth available in alternative segments like electric cars, vehicles run on natural gas,
etc.
6. Growth drivers for Automobile Sector
Factors that will drive growth in the sector
Rising incomes among Indian population will lead to increased affordability, increasing domestic demand for
vehicles, especially in the small car segment.
Fuel economy and demand for greater fuel efficiency is a major factor that affects consumer purchase
decision that will bring leading companies across two-wheeler and four-wheeler segment to focus on
delivering performance-oriented products.
Product innovation and market segmentation will channelize growth. Vehicles based on alternative fuels will
be an area of interest for both consumers and auto makers.
Focus on establishing India as auto-manufacturing hub is reigning in policy support in form of Government’s
technology modernization fund.
Industry will seek to augment sales by tapping into rural markets, youth, women and luxury segments.
12 | P a g e
7. Automobile Industry Companies in India
MARUTI SUZUKI INDIA LTD
Maruti Suzuki India Limited (MSIL, formerly known as Maruti Udyog Limited) is a subsidiary of Suzuki Motor
Corporation, Japan. Maruti Suzuki has been the leader of the Indian car market for over two and a half decades.
The company has two manufacturing facilities located at Gurgaon and Manesar, south of New Delhi, India. Both
the facilities have a combined capability to produce over a 1.5 million (1,500,000) vehicles annually. The
company plans to expand its manufacturing capacity to 1.75 million by 2013. Maruti Suzuki is India’s largest
passenger vehicle company with a market share close to 40% which offers 14 models with over 200 variants
across the Industry segments like: Passenger cars, Utility vehicles and Vans.
Financial Highlights
Results updates- Q2 FY14,
Months SEP-13 SEP-12 % Change
Net Sales 104680.60 83054.30 26.04
PAT 6702.30 2274.50 194.67
EPS 22.19 7.87 181.83
EBITDA 14224.50 6648.70 113.94
The company’s net profit jumps to Rs.6702.30 million against Rs. 2274.50 million in the corresponding quarter
ending of previous year, an increase of 194.67%. Revenue for the quarter rose 26.04% to Rs. 104680.60 million
from Rs.83054.30 million, when compared with the prior year period. Reported earnings per share of the
company stood at Rs.22.19 a share during the quarter, registering 181.83% increase over previous year period.
Profit before interest, depreciation and tax is Rs.14224.50 millions as against Rs.6648.70 millions in the
corresponding period of the previous year. Higher localization and cost reduction initiatives by the Company also
contributed significantly to bottom-line growth during Q2. The overall impact of foreign exchange was positive
during the quarter.
Future plan of action
Maruti Suzuki India Limited (MSIL) will continue to introduce new range of products and variants in automobiles
to meet growing customers’ expectations. The company will take initiative step to introduce alternate fuel
options like LPG and CNG in the company’s vehicles. In the long term, the company will focus on enhancing the
capability in the field of EV-HEV (Electric Vehicle – Hybrid Electric Vehicle) and other environment friendly
initiatives.
13 | P a g e
Financial Highlight STANDALONE (A*- Actual, E* -Estimations & Rs. In Millions)
Balance Sheet as at March31, 2012-2015E
FY12A FY13A FY14E FY15E
EQUITY AND LIABILITIES: Shareholders’ Funds: Share Capital 1445.00 1510.40 1510.40 1510.40
Reserves and Surplus 150429.00 184279.00 213839.69 248396.83
a. Net worth 151874.00 185789.00 215349.69 249906.83
Non-Current Liabilities: Long-term borrowings 0.00 5429.00 6243.35 7117.42
Deferred Tax Liabilities [Net] 3023.00 4087.00 5313.10 6641.38
Other Long Term Liabilities 966.00 1036.00 1087.80 1136.75
Long Term Provisions 1683.00 2259.00 2620.44 2987.30
b. Long term liabilities 5672.00 12811.00 15264.69 17882.85
Current Liabilities: Short-term borrowings 10783.00 8463.00 10578.75 12588.71
Trade Payables 33499.00 41674.00 43757.70 46120.62
Other Current Liabilities 15892.00 11661.00 16325.40 20625.31
Short Term Provisions 5302.00 6482.00 6676.46 6876.75
c. Current Liabilities 65476.00 68280.00 77338.31 86211.39
Total (a+b+c) 223022.00 266880.00 307952.69 354001.06
ASSETS: Non-Current Assets: Fixed Assets: i. Tangible Assets 73108.00 95765.00 115875.65 133257.00
ii. Intangible Assets 2099.00 2227.00 2347.26 2464.62
iii. Capital work-in-progress 6114.00 19422.00 23500.62 27025.71
81321.00 117414.00 141723.53 162747.33
Other non-current assets 263.00 8946.00 4025.70 4226.99
Non Current Investments 13933.00 18485.00 4478.10 5149.82
Long Term Loans and Advances 16715.00 12787.00 12596.29 12218.40
d. Non-Current Assets 112232.00 157632.00 21100.09 21595.20
Current Assets: Current Investments 47541.00 52298.00 79492.96 95391.55
Inventories 17965.00 18407.00 23745.03 28494.04
Trade Receivables 9376.00 14237.00 13525.15 13930.90
Cash and Bank Balances 24361.00 7750.00 8525.00 9121.75
Short Term Loans and Advances 7783.00 11153.00 14275.84 16988.25
Other Current Assets 3764.00 5403.00 5565.09 5732.04
e. Current Assets 110790.00 109248.00 145129.07 169658.53
Total (d+e) 223022.00 266880.00 307952.69 354001.06
14 | P a g e
Annual Profit & Loss Statement for the period of 2012 to 2015E
Value(Rs.in.mn) FY12A FY13A FY14E FY15E
Description 12m 12m 12m 12m
Net Sales 355870.90 435879.30 462032.06 485133.66
Other Income 8268.60 8123.70 8367.41 8785.78
Total Income 364139.50 444003.00 470399.47 493919.44
Expenditure -330742.00 -393582.50 -406588.21 -419640.62
Operating Profit 33397.50 50420.50 63811.26 74278.83
Interest -552.10 -1898.20 -2277.84 -2733.41
Gross profit 32845.40 48522.30 61533.42 71545.42
Depreciation -11383.50 -18611.70 -22892.39 -27013.02
Profit Before Tax 21461.90 29910.60 38641.03 44532.40
Tax -5110.50 -5989.30 -9080.64 -9975.26
Net Profit 16351.40 23921.30 29560.39 34557.14
Equity capital 1444.60 1510.40 1510.40 1510.40
Reserves 150429.00 184279.30 213839.69 248396.83
Face value 5.00 5.00 5.00 5.00
EPS 56.59 79.19 97.86 114.40
Quarterly Profit & Loss Statement for the period of 31 MARCH, 2013 to 31 DEC, 2013E
Value(Rs.in.mn) 31-Mar-13 30-Jun-13 30-Sep-13 31-Dec-13E
Description 3m 3m 3m 3m
Net sales 133040.10 102373.40 104680.60 109914.63
Other income 3989.90 2043.00 1010.20 1060.71
Total Income 137030.00 104416.40 105690.80 110975.34
Expenditure -113044.00 -90711.80 -91466.30 -96109.35
Operating Profit 23986.00 13704.60 14224.50 14865.99
Interest -726.40 -442.30 -433.90 -455.60
Gross profit 23259.60 13262.30 13790.60 14410.39
Depreciation -8158.90 -4801.60 -4991.70 -5241.29
Profit Before Tax 15100.70 8460.70 8798.90 9169.11
Tax -2704.50 -2144.60 -2096.60 -2108.89
Net Profit 12396.20 6316.10 6702.30 7060.21
Equity capital 1510.40 1510.40 1510.40 1510.40
Face value 5.00 5.00 5.00 5.00
EPS 41.04 20.91 22.19 23.37

15 | P a g e
Ratio Analysis
Particulars FY12A FY13A FY14E FY15E
EPS (Rs.) 56.59 79.19 97.86 114.40
EBITDA Margin (%) 9.38% 11.57% 13.81% 15.31%
PBT Margin (%) 6.03% 6.86% 8.36% 9.18%
PAT Margin (%) 4.59% 5.49% 6.40% 7.12%
P/E Ratio (x) 28.25 20.19 16.34 13.98
ROE (%) 10.77% 12.88% 13.73% 13.83%
ROCE (%) 27.53% 34.57% 37.34% 37.57%
EV/EBITDA (x) 13.83 9.58 7.57 6.50
Book Value (Rs.) 525.66 615.03 712.89 827.29
P/BV 3.04 2.60 2.24 1.93
Outlook and Conclusion
At the current market price of Rs.1599.00, the stock P/E ratio is at 16.34 x FY14E and 13.98 x FY15E
respectively.
Earning per share (EPS) of the company for the earnings for FY14E and FY15E is seen at Rs.97.86 and
Rs.114.40 respectively.
Net Sales and Operating Profit of the company are expected to grow at a CAGR of 11% and 28% over 2012 to
2015E respectively.
On the basis of EV/EBITDA, the stock trades at 7.57 x for FY14E and 6.50 x for FY15E.
Price to Book Value of the stock is expected to be at 2.24 x and 1.93 x respectively for FY14E and FY15E.
16 | P a g e
TATA MOTORS LTD
Tata Motors Limited is India's largest automobile company, with consolidated revenues of INR 1,88,818 crores
(USD 34.7 billion) in 2012-13. Through subsidiaries and associate companies, Tata Motors has operations in the
UK, South Korea, Thailand, Spain, South Africa and Indonesia.
It is the leader in commercial vehicles in each segment, and among the top in passenger vehicles with winning
products in the compact, midsize car and utility vehicle segments. It is also the world's fifth largest truck
manufacturer and fourth largest bus manufacturer.
The Tata Motors Group's over 60,000 employees are guided by the mission "to be passionate in anticipating and
providing the best vehicles and experiences that excite their customers globally."
Financial Highlights
India's largest automobile company, Tata Motors reported consolidated revenues (net of excise) of Rs.
568822.80 million for the quarter ended September 30, 2013, a growth of 31.06% over Rs. 434028.80 million for
the corresponding quarter of the previous year, despite weak operating environment in the India business which
was more than offset by increase in wholesale volumes and richer product and market mix at Jaguar Land Rover
(JLR). The Consolidated Profit before tax for the quarter was Rs.47523.90 million, a growth of 53.87% over
Rs.30886.00 million for the corresponding quarter of the previous year. The Consolidated Profit after tax (post
minority interest and profit/loss in respect of associate companies) for the quarter was Rs. 35418.60 million, a
growth of 70.71% over Rs. 20747.30 million for the corresponding quarter of the previous year.
During the quarter, Jaguar Land Rover has reported revenues of GBP 4,612 million, represented a growth of
40.3% over GBP 3,288 million in the corresponding quarter last year. During Q2 FY14, Operating margins stood
at 17.8%. Operating profit (EBITDA) of GBP 823 million in the quarter, represented a growth of 69.3% over GBP
486 million in the corresponding quarter last year. Continued strong revenue growth and operating performance
were supported by increase in wholesale volume, richer product mix, launch of new Range Rover Sport, new
Range Rover and Jaguar F-TYPE. PAT for the quarter grew by 66.2% to GBP 507 million against GBP 305 million
in the corresponding quarter last year. During the quarter, Tata Daewoo Commercial Vehicles Co. Ltd. registered
net revenues of KRW 202 billion and Net profit of KRW 4.4 billion as compared to KRW 205 billion and KRW 0.5
billion, respectively, in Q2 FY13.
The standalone revenues (net of excise) for the quarter ended September 30, 2013 stood at Rs. 88680 million, as
compared to Rs. 124810 million in Q2 FY13. For the quarter Q2 FY14, the operating margin stood at 2.0%.
17 | P a g e
Continued slowdown in economic activity, low level of transport freight and infrastructure activity, frequent
diesel price increases and tight financing environment, have impacted the industry during the quarter.
Tata Motors has entered into an Australian market with a sale of Tata Xenon through distributor Fusion
Automotive and it is an important milestone in the continued expansion of Tata Motors global footprint. The
Company plans to launch the new Tata Aria, the Tata Prima KL3TXF 6X4 Truck Tractor and Tata Ultra 812 Truck
in South Africa in 2014. JLR performance to remain strong led by product actions and continued growth in
emerging markets, particularly China.
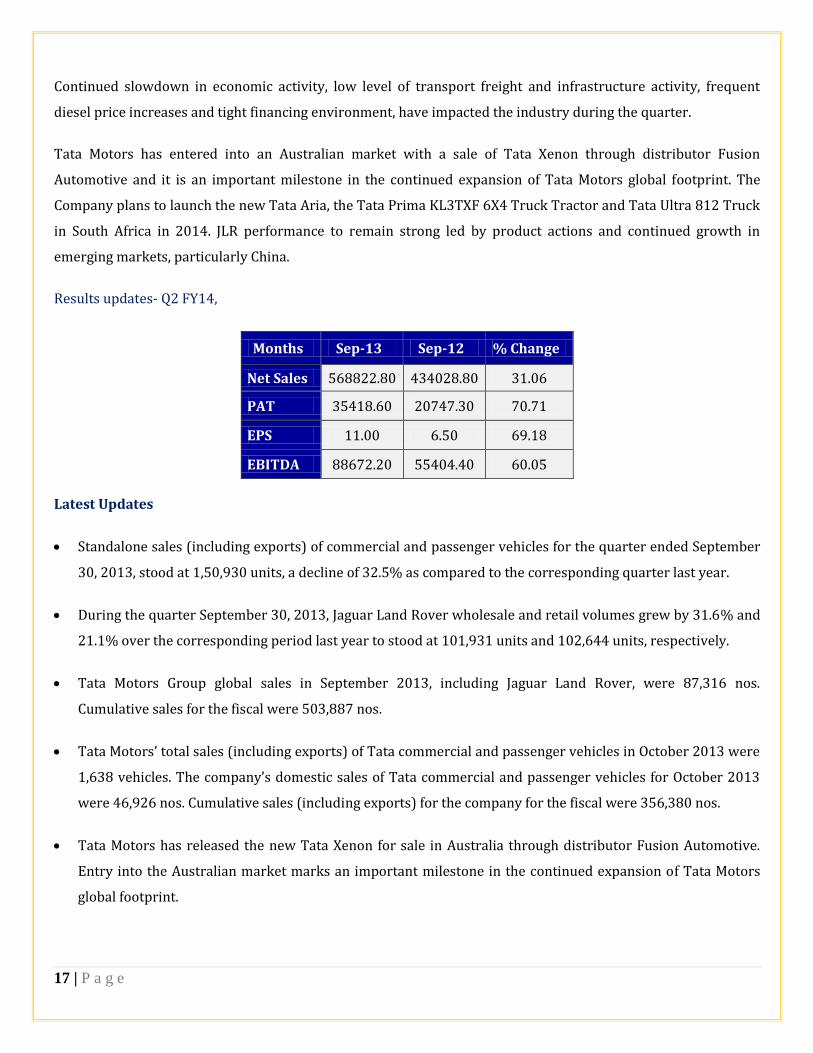
Results updates- Q2 FY14,
Months Sep-13 Sep-12 % Change
Net Sales 568822.80 434028.80 31.06
PAT 35418.60 20747.30 70.71
EPS 11.00 6.50 69.18
EBITDA 88672.20 55404.40 60.05
Latest Updates
Standalone sales (including exports) of commercial and passenger vehicles for the quarter ended September
30, 2013, stood at 1,50,930 units, a decline of 32.5% as compared to the corresponding quarter last year.
During the quarter September 30, 2013, Jaguar Land Rover wholesale and retail volumes grew by 31.6% and
21.1% over the corresponding period last year to stood at 101,931 units and 102,644 units, respectively.
Tata Motors Group global sales in September 2013, including Jaguar Land Rover, were 87,316 nos.
Cumulative sales for the fiscal were 503,887 nos.
Tata Motors’ total sales (including exports) of Tata commercial and passenger vehicles in October 2013 were
1,638 vehicles. The company’s domestic sales of Tata commercial and passenger vehicles for October 2013
were 46,926 nos. Cumulative sales (including exports) for the company for the fiscal were 356,380 nos.
Tata Motors has released the new Tata Xenon for sale in Australia through distributor Fusion Automotive.
Entry into the Australian market marks an important milestone in the continued expansion of Tata Motors
global footprint.
18 | P a g e
Tata Motors has launched of the new Tata Nano CNG emax. The Tata Nano CNG emax is powered by a fuel
efficient, state-of-the-art engine, with CNG and Petrol bi-fuel system options.
PT Tata Motors Distribusi Indonesia (TMDI), wholly owned subsidiary of Tata Motors Ltd forayed into the
Indonesian automotive industry with the launch of three new exciting Tata passenger vehicles - the Tata Aria,
the Tata Vista and the Tata Safari Storme.
Tata Motors has launched the Tata Xenon Pick-up with best-in-class looks, operating economics and fuel
efficiency in the Nepal market.
Tata Motors has entered into partnership with DRB-HICOM, Malaysia's biggest conglomerate, for the import,
distribution and assembly of Tata Motors Commercial Vehicles in Malaysia.
19 | P a g e
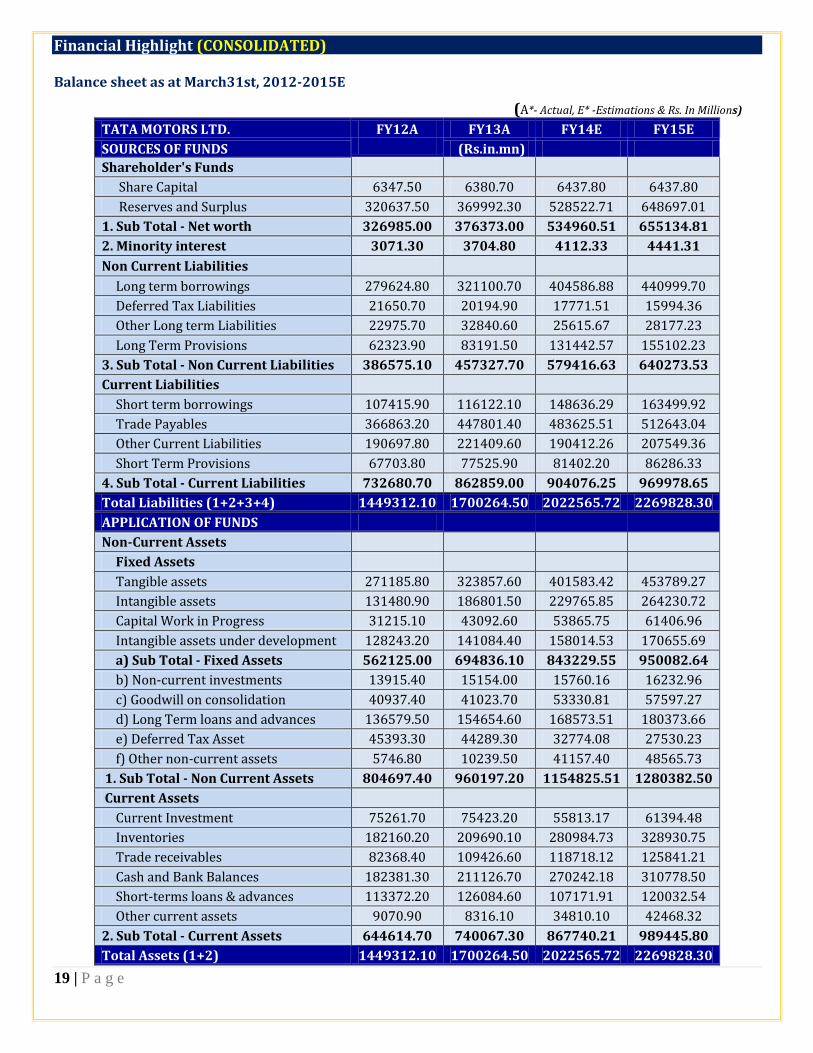
Financial Highlight (CONSOLIDATED)
Balance sheet as at March31st, 2012-2015E
(A*- Actual, E* -Estimations & Rs. In Millions)
TATA MOTORS LTD. FY12A FY13A FY14E FY15E
SOURCES OF FUNDS (Rs.in.mn)
Shareholder's Funds
Share Capital 6347.50 6380.70 6437.80 6437.80
Reserves and Surplus 320637.50 369992.30 528522.71 648697.01
1. Sub Total - Net worth 326985.00 376373.00 534960.51 655134.81
2. Minority interest 3071.30 3704.80 4112.33 4441.31
Non Current Liabilities
Long term borrowings 279624.80 321100.70 404586.88 440999.70
Deferred Tax Liabilities 21650.70 20194.90 17771.51 15994.36
Other Long term Liabilities 22975.70 32840.60 25615.67 28177.23
Long Term Provisions 62323.90 83191.50 131442.57 155102.23
3. Sub Total - Non Current Liabilities 386575.10 457327.70 579416.63 640273.53
Current Liabilities
Short term borrowings 107415.90 116122.10 148636.29 163499.92
Trade Payables 366863.20 447801.40 483625.51 512643.04
Other Current Liabilities 190697.80 221409.60 190412.26 207549.36
Short Term Provisions 67703.80 77525.90 81402.20 86286.33
4. Sub Total - Current Liabilities 732680.70 862859.00 904076.25 969978.65
Total Liabilities (1+2+3+4) 1449312.10 1700264.50 2022565.72 2269828.30
APPLICATION OF FUNDS
Non-Current Assets
Fixed Assets
Tangible assets 271185.80 323857.60 401583.42 453789.27
Intangible assets 131480.90 186801.50 229765.85 264230.72
Capital Work in Progress 31215.10 43092.60 53865.75 61406.96
Intangible assets under development 128243.20 141084.40 158014.53 170655.69
a) Sub Total - Fixed Assets 562125.00 694836.10 843229.55 950082.64
b) Non-current investments 13915.40 15154.00 15760.16 16232.96
c) Goodwill on consolidation 40937.40 41023.70 53330.81 57597.27
d) Long Term loans and advances 136579.50 154654.60 168573.51 180373.66
e) Deferred Tax Asset 45393.30 44289.30 32774.08 27530.23
f) Other non-current assets 5746.80 10239.50 41157.40 48565.73
1. Sub Total - Non Current Assets 804697.40 960197.20 1154825.51 1280382.50
Current Assets
Current Investment 75261.70 75423.20 55813.17 61394.48
Inventories 182160.20 209690.10 280984.73 328930.75
Trade receivables 82368.40 109426.60 118718.12 125841.21
Cash and Bank Balances 182381.30 211126.70 270242.18 310778.50
Short-terms loans & advances 113372.20 126084.60 107171.91 120032.54
Other current assets 9070.90 8316.10 34810.10 42468.32
2. Sub Total - Current Assets 644614.70 740067.30 867740.21 989445.80
Total Assets (1+2) 1449312.10 1700264.50 2022565.72 2269828.30
20 | P a g e
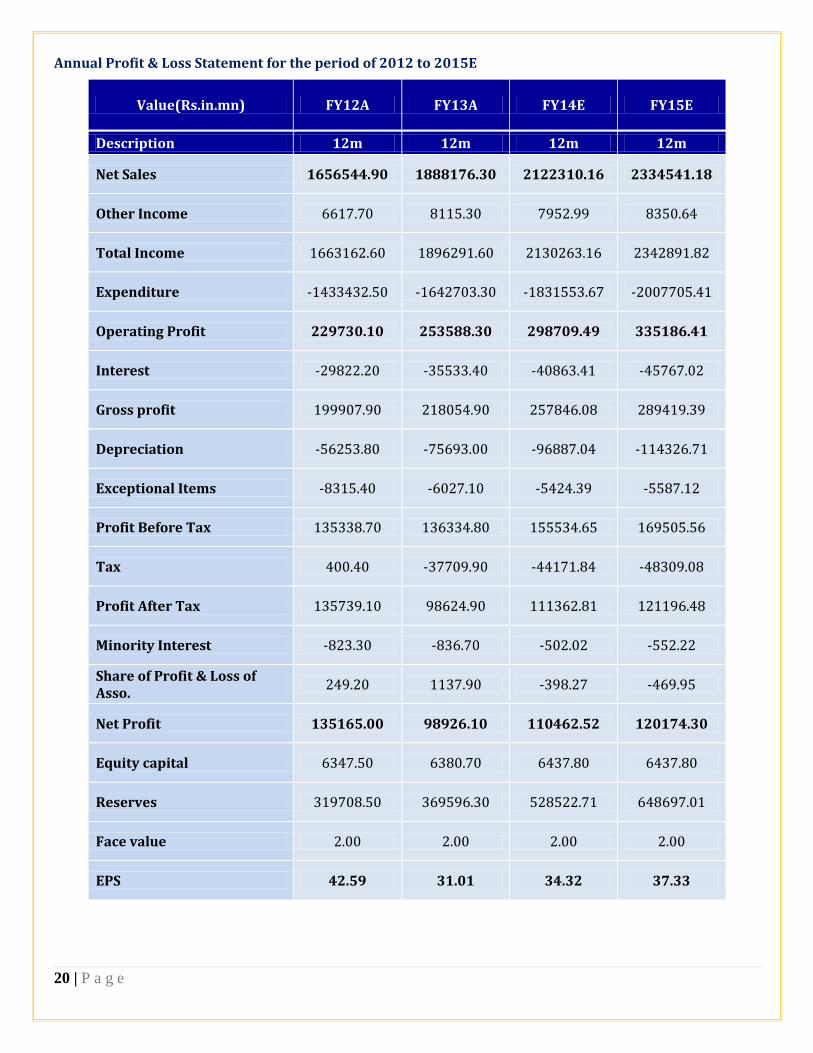
Annual Profit & Loss Statement for the period of 2012 to 2015E
Value(Rs.in.mn) FY12A FY13A FY14E FY15E
Description 12m 12m 12m 12m
Net Sales 1656544.90 1888176.30 2122310.16 2334541.18
Other Income 6617.70 8115.30 7952.99 8350.64
Total Income 1663162.60 1896291.60 2130263.16 2342891.82
Expenditure -1433432.50 -1642703.30 -1831553.67 -2007705.41
Operating Profit 229730.10 253588.30 298709.49 335186.41
Interest -29822.20 -35533.40 -40863.41 -45767.02
Gross profit 199907.90 218054.90 257846.08 289419.39
Depreciation -56253.80 -75693.00 -96887.04 -114326.71
Exceptional Items -8315.40 -6027.10 -5424.39 -5587.12
Profit Before Tax 135338.70 136334.80 155534.65 169505.56
Tax 400.40 -37709.90 -44171.84 -48309.08
Profit After Tax 135739.10 98624.90 111362.81 121196.48
Minority Interest -823.30 -836.70 -502.02 -552.22
Share of Profit & Loss of Asso.
249.20 1137.90 -398.27 -469.95
Net Profit 135165.00 98926.10 110462.52 120174.30
Equity capital 6347.50 6380.70 6437.80 6437.80
Reserves 319708.50 369596.30 528522.71 648697.01
Face value 2.00 2.00 2.00 2.00
EPS 42.59 31.01 34.32 37.33
21 | P a g e
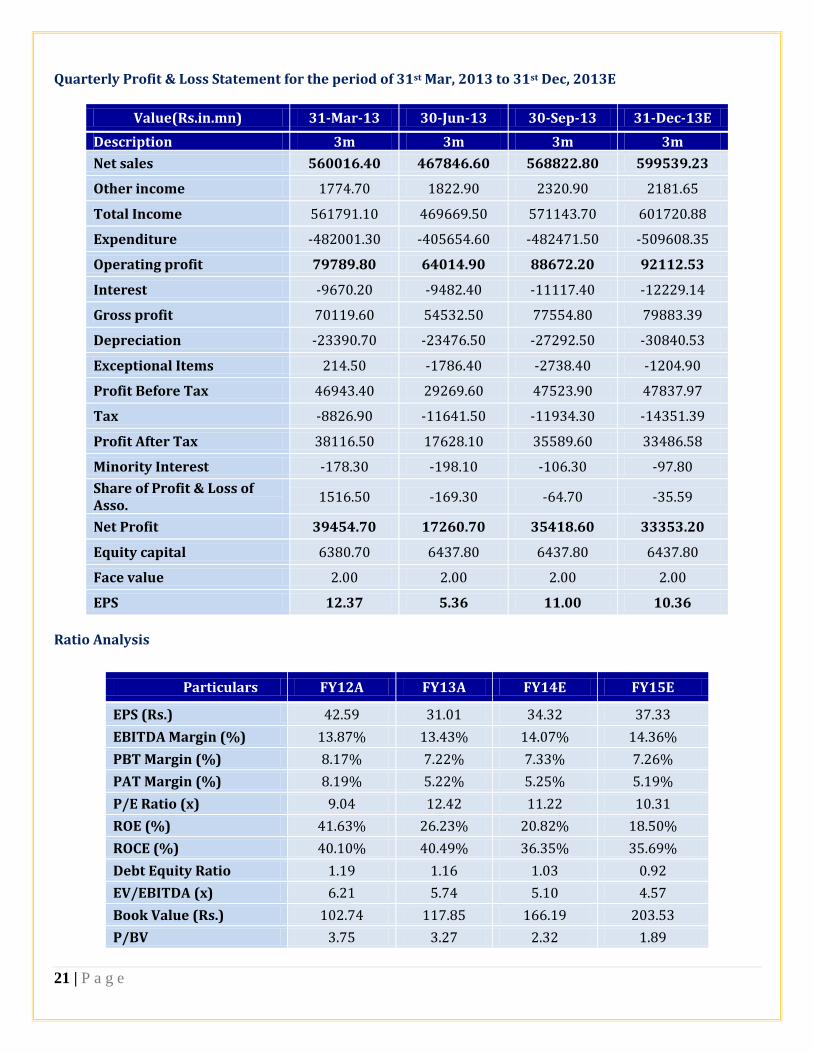
Quarterly Profit & Loss Statement for the period of 31st Mar, 2013 to 31st Dec, 2013E
Value(Rs.in.mn) 31-Mar-13 30-Jun-13 30-Sep-13 31-Dec-13E
Description 3m 3m 3m 3m
Net sales 560016.40 467846.60 568822.80 599539.23
Other income 1774.70 1822.90 2320.90 2181.65
Total Income 561791.10 469669.50 571143.70 601720.88
Expenditure -482001.30 -405654.60 -482471.50 -509608.35
Operating profit 79789.80 64014.90 88672.20 92112.53
Interest -9670.20 -9482.40 -11117.40 -12229.14
Gross profit 70119.60 54532.50 77554.80 79883.39
Depreciation -23390.70 -23476.50 -27292.50 -30840.53
Exceptional Items 214.50 -1786.40 -2738.40 -1204.90
Profit Before Tax 46943.40 29269.60 47523.90 47837.97
Tax -8826.90 -11641.50 -11934.30 -14351.39
Profit After Tax 38116.50 17628.10 35589.60 33486.58
Minority Interest -178.30 -198.10 -106.30 -97.80
Share of Profit & Loss of Asso.
1516.50 -169.30 -64.70 -35.59
Net Profit 39454.70 17260.70 35418.60 33353.20
Equity capital 6380.70 6437.80 6437.80 6437.80
Face value 2.00 2.00 2.00 2.00
EPS 12.37 5.36 11.00 10.36
Ratio Analysis
Particulars FY12A FY13A FY14E FY15E
EPS (Rs.) 42.59 31.01 34.32 37.33
EBITDA Margin (%) 13.87% 13.43% 14.07% 14.36%
PBT Margin (%) 8.17% 7.22% 7.33% 7.26%
PAT Margin (%) 8.19% 5.22% 5.25% 5.19%
P/E Ratio (x) 9.04 12.42 11.22 10.31
ROE (%) 41.63% 26.23% 20.82% 18.50%
ROCE (%) 40.10% 40.49% 36.35% 35.69%
Debt Equity Ratio 1.19 1.16 1.03 0.92
EV/EBITDA (x) 6.21 5.74 5.10 4.57
Book Value (Rs.) 102.74 117.85 166.19 203.53
P/BV 3.75 3.27 2.32 1.89
22 | P a g e
Outlook and Conclusion
At the current market price of Rs.385.00, the stock P/E ratio is at 11.22 x FY14E and 10.31 x FY15E
respectively.
Earning per share (EPS) of the company for the earnings for FY14E and FY15E is seen at Rs.34.32 and
Rs.37.33 respectively.
Net Sales and Operating Profit of the company are expected to grow at a CAGR of 12% and 13% over 2012 to
2015E respectively.
On the basis of EV/EBITDA, the stock trades at 5.10 x for FY14E and 4.57 x for FY15E.
Price to Book Value of the stock is expected to be at 2.32 x and 1.89 x respectively for FY14E and FY15E.
23 | P a g e
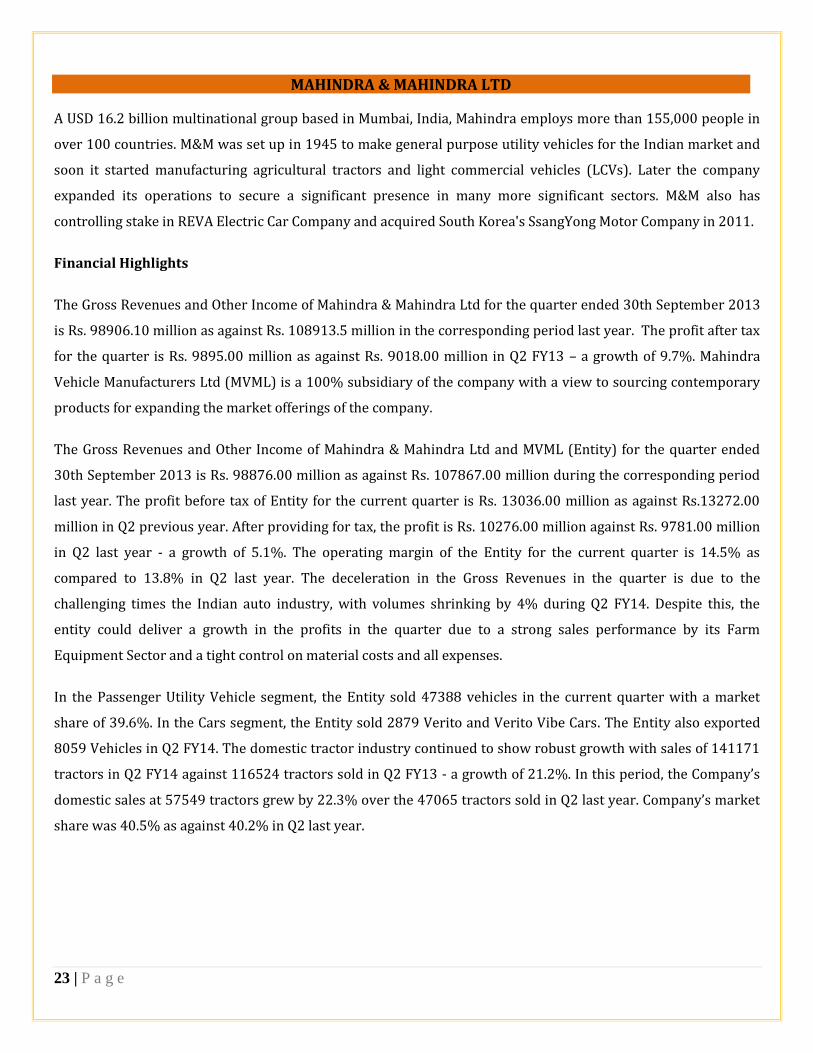
MAHINDRA & MAHINDRA LTD
A USD 16.2 billion multinational group based in Mumbai, India, Mahindra employs more than 155,000 people in
over 100 countries. M&M was set up in 1945 to make general purpose utility vehicles for the Indian market and
soon it started manufacturing agricultural tractors and light commercial vehicles (LCVs). Later the company
expanded its operations to secure a significant presence in many more significant sectors. M&M also has
controlling stake in REVA Electric Car Company and acquired South Korea's SsangYong Motor Company in 2011.
Financial Highlights
The Gross Revenues and Other Income of Mahindra & Mahindra Ltd for the quarter ended 30th September 2013
is Rs. 98906.10 million as against Rs. 108913.5 million in the corresponding period last year. The profit after tax
for the quarter is Rs. 9895.00 million as against Rs. 9018.00 million in Q2 FY13 – a growth of 9.7%. Mahindra
Vehicle Manufacturers Ltd (MVML) is a 100% subsidiary of the company with a view to sourcing contemporary
products for expanding the market offerings of the company.
The Gross Revenues and Other Income of Mahindra & Mahindra Ltd and MVML (Entity) for the quarter ended
30th September 2013 is Rs. 98876.00 million as against Rs. 107867.00 million during the corresponding period
last year. The profit before tax of Entity for the current quarter is Rs. 13036.00 million as against Rs.13272.00
million in Q2 previous year. After providing for tax, the profit is Rs. 10276.00 million against Rs. 9781.00 million
in Q2 last year - a growth of 5.1%. The operating margin of the Entity for the current quarter is 14.5% as
compared to 13.8% in Q2 last year. The deceleration in the Gross Revenues in the quarter is due to the
challenging times the Indian auto industry, with volumes shrinking by 4% during Q2 FY14. Despite this, the
entity could deliver a growth in the profits in the quarter due to a strong sales performance by its Farm
Equipment Sector and a tight control on material costs and all expenses.
In the Passenger Utility Vehicle segment, the Entity sold 47388 vehicles in the current quarter with a market
share of 39.6%. In the Cars segment, the Entity sold 2879 Verito and Verito Vibe Cars. The Entity also exported
8059 Vehicles in Q2 FY14. The domestic tractor industry continued to show robust growth with sales of 141171
tractors in Q2 FY14 against 116524 tractors sold in Q2 FY13 - a growth of 21.2%. In this period, the Company’s
domestic sales at 57549 tractors grew by 22.3% over the 47065 tractors sold in Q2 last year. Company’s market
share was 40.5% as against 40.2% in Q2 last year.
24 | P a g e
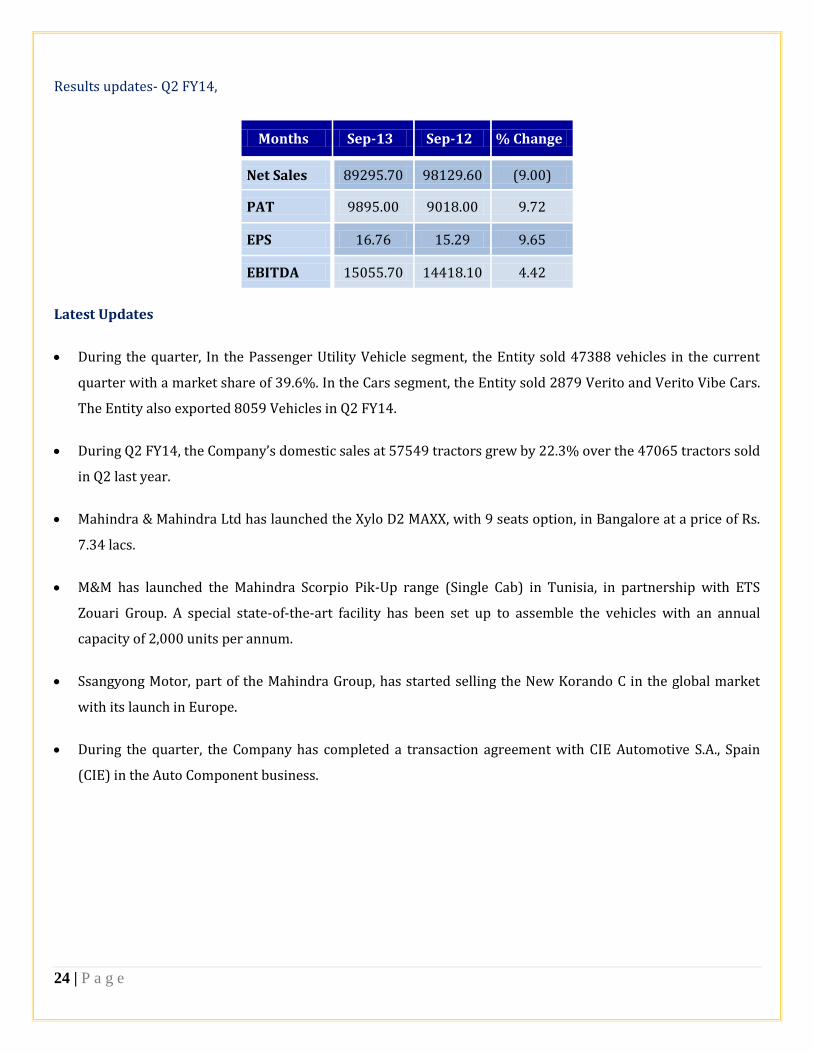
Results updates- Q2 FY14,
Months Sep-13 Sep-12 % Change
Net Sales 89295.70 98129.60 (9.00)
PAT 9895.00 9018.00 9.72
EPS 16.76 15.29 9.65
EBITDA 15055.70 14418.10 4.42
Latest Updates
During the quarter, In the Passenger Utility Vehicle segment, the Entity sold 47388 vehicles in the current
quarter with a market share of 39.6%. In the Cars segment, the Entity sold 2879 Verito and Verito Vibe Cars.
The Entity also exported 8059 Vehicles in Q2 FY14.
During Q2 FY14, the Company’s domestic sales at 57549 tractors grew by 22.3% over the 47065 tractors sold
in Q2 last year.
Mahindra & Mahindra Ltd has launched the Xylo D2 MAXX, with 9 seats option, in Bangalore at a price of Rs.
7.34 lacs.
M&M has launched the Mahindra Scorpio Pik-Up range (Single Cab) in Tunisia, in partnership with ETS
Zouari Group. A special state-of-the-art facility has been set up to assemble the vehicles with an annual
capacity of 2,000 units per annum.
Ssangyong Motor, part of the Mahindra Group, has started selling the New Korando C in the global market
with its launch in Europe.
During the quarter, the Company has completed a transaction agreement with CIE Automotive S.A., Spain
(CIE) in the Auto Component business.
25 | P a g e
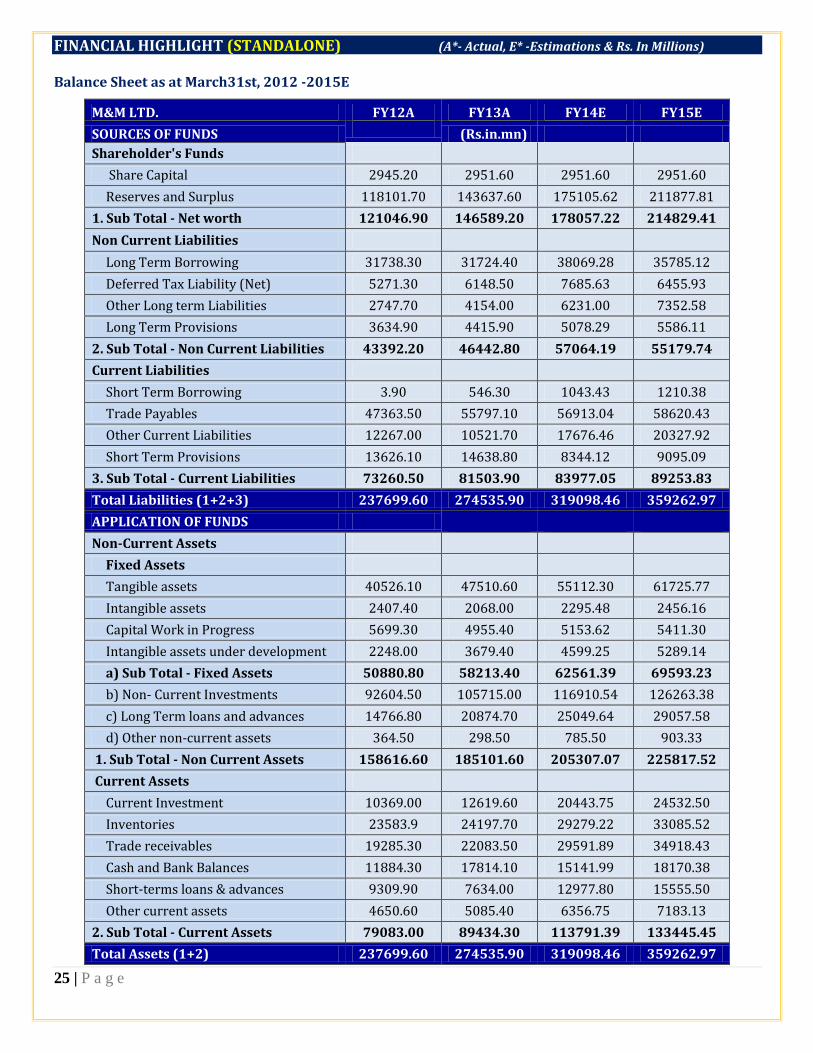
FINANCIAL HIGHLIGHT (STANDALONE) (A*- Actual, E* -Estimations & Rs. In Millions)
Balance Sheet as at March31st, 2012 -2015E
M&M LTD. FY12A FY13A FY14E FY15E
SOURCES OF FUNDS (Rs.in.mn)
Shareholder's Funds
Share Capital 2945.20 2951.60 2951.60 2951.60
Reserves and Surplus 118101.70 143637.60 175105.62 211877.81
1. Sub Total - Net worth 121046.90 146589.20 178057.22 214829.41
Non Current Liabilities
Long Term Borrowing 31738.30 31724.40 38069.28 35785.12
Deferred Tax Liability (Net) 5271.30 6148.50 7685.63 6455.93
Other Long term Liabilities 2747.70 4154.00 6231.00 7352.58
Long Term Provisions 3634.90 4415.90 5078.29 5586.11
2. Sub Total - Non Current Liabilities 43392.20 46442.80 57064.19 55179.74
Current Liabilities
Short Term Borrowing 3.90 546.30 1043.43 1210.38
Trade Payables 47363.50 55797.10 56913.04 58620.43
Other Current Liabilities 12267.00 10521.70 17676.46 20327.92
Short Term Provisions 13626.10 14638.80 8344.12 9095.09
3. Sub Total - Current Liabilities 73260.50 81503.90 83977.05 89253.83
Total Liabilities (1+2+3) 237699.60 274535.90 319098.46 359262.97
APPLICATION OF FUNDS
Non-Current Assets
Fixed Assets
Tangible assets 40526.10 47510.60 55112.30 61725.77
Intangible assets 2407.40 2068.00 2295.48 2456.16
Capital Work in Progress 5699.30 4955.40 5153.62 5411.30
Intangible assets under development 2248.00 3679.40 4599.25 5289.14
a) Sub Total - Fixed Assets 50880.80 58213.40 62561.39 69593.23
b) Non- Current Investments 92604.50 105715.00 116910.54 126263.38
c) Long Term loans and advances 14766.80 20874.70 25049.64 29057.58
d) Other non-current assets 364.50 298.50 785.50 903.33
1. Sub Total - Non Current Assets 158616.60 185101.60 205307.07 225817.52
Current Assets
Current Investment 10369.00 12619.60 20443.75 24532.50
Inventories 23583.9 24197.70 29279.22 33085.52
Trade receivables 19285.30 22083.50 29591.89 34918.43
Cash and Bank Balances 11884.30 17814.10 15141.99 18170.38
Short-terms loans & advances 9309.90 7634.00 12977.80 15555.50
Other current assets 4650.60 5085.40 6356.75 7183.13
2. Sub Total - Current Assets 79083.00 89434.30 113791.39 133445.45
Total Assets (1+2) 237699.60 274535.90 319098.46 359262.97

26 | P a g e
Annual Profit & Loss Statement for the period of 2012 to 2015E
Value(Rs.in.mn) FY12A FY13A FY14E FY15E
Description 12m 12m 12m 12m
Net Sales 318535.20 404411.60 436764.53 480440.98
Other Income 4657.90 5491.70 7413.80 7858.62
Total Income 323193.10 409903.30 444178.32 488299.60
Expenditure -279745.30 -356412.40 -384352.78 -422788.06
Operating Profit 43447.80 53490.90 59825.54 65511.54
Interest -1627.50 -1911.90 -2217.80 -2506.12
Gross profit 41820.30 51579.00 57607.73 63005.42
Depreciation -5761.40 -7108.10 -8174.32 -9155.23
Profit Before Tax 36058.90 44470.90 49433.42 53850.19
Tax -7270.00 -10942.70 -11369.69 -12385.54
Net Profit 28788.90 33528.20 38063.73 41464.65
Equity capital 2945.20 2951.60 2951.60 2951.60
Reserves 118656.60 143529.20 175105.62 211877.81
Face value 5.00 5.00 5.00 5.00
EPS 48.87 56.80 64.48 70.24
Quarterly Profit & Loss Statement for the period of 31st Mar, 2013 to 31st Dec, 2013E
Value(Rs.in.mn) 31-Mar-13 30-Jun-13 30-Sep-13 31-Dec-13E
Description 3m 3m 3m 3m
Net sales 104865.30 100225.20 89295.70 98225.27
Other income 921.90 1642.30 3606.30 1622.84
Total Income 105787.20 101867.50 92902.00 99848.11
Expenditure -91262.30 -87350.80 -77846.30 -85455.98
Operating profit 14524.90 14516.70 15055.70 14392.12
Interest -511.10 -493.30 -622.60 -653.73
Gross profit 14013.80 14023.40 14433.10 13738.39
Depreciation -1986.00 -1806.30 -1970.10 -2029.20
Profit Before Tax 12027.80 12217.10 12463.00 11709.19
Tax -3135.90 -2838.00 -2568.00 -2576.02
Net Profit 8891.90 9379.10 9895.00 9133.17
Equity capital 2951.60 2951.60 2951.60 2951.60
Face value 5.00 5.00 5.00 5.00
EPS 15.06 15.89 16.76 15.47
27 | P a g e
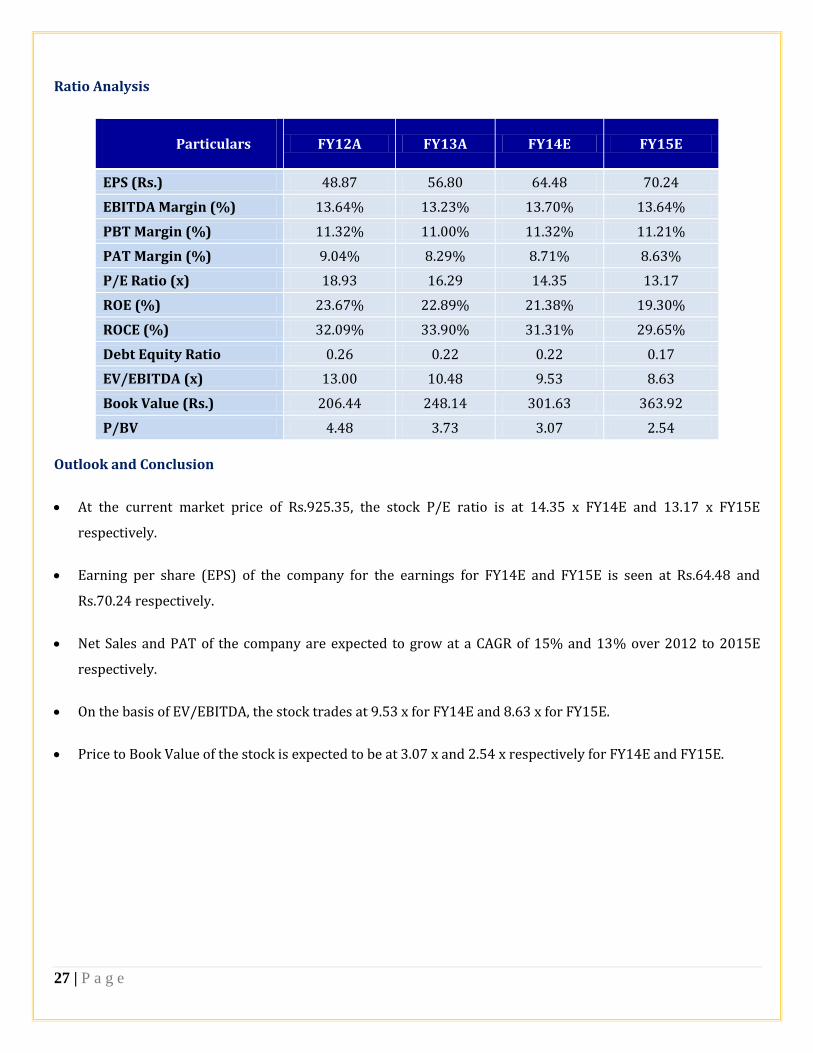
Ratio Analysis
Particulars FY12A FY13A FY14E FY15E
EPS (Rs.) 48.87 56.80 64.48 70.24
EBITDA Margin (%) 13.64% 13.23% 13.70% 13.64%
PBT Margin (%) 11.32% 11.00% 11.32% 11.21%
PAT Margin (%) 9.04% 8.29% 8.71% 8.63%
P/E Ratio (x) 18.93 16.29 14.35 13.17
ROE (%) 23.67% 22.89% 21.38% 19.30%
ROCE (%) 32.09% 33.90% 31.31% 29.65%
Debt Equity Ratio 0.26 0.22 0.22 0.17
EV/EBITDA (x) 13.00 10.48 9.53 8.63
Book Value (Rs.) 206.44 248.14 301.63 363.92
P/BV 4.48 3.73 3.07 2.54
Outlook and Conclusion
At the current market price of Rs.925.35, the stock P/E ratio is at 14.35 x FY14E and 13.17 x FY15E
respectively.
Earning per share (EPS) of the company for the earnings for FY14E and FY15E is seen at Rs.64.48 and
Rs.70.24 respectively.
Net Sales and PAT of the company are expected to grow at a CAGR of 15% and 13% over 2012 to 2015E
respectively.
On the basis of EV/EBITDA, the stock trades at 9.53 x for FY14E and 8.63 x for FY15E.
Price to Book Value of the stock is expected to be at 3.07 x and 2.54 x respectively for FY14E and FY15E.

28 | P a g e
HERO MOTOCORP LTD
Hero MotoCorp Ltd. (Formerly Hero Honda Motors Ltd.) is the world's largest manufacturer of two - wheelers,
based in India. HMCL offer one of the widest ranges of two wheelers with over 19 different products across the
100 cc, 125 cc, 150 cc, 225 cc and scooter categories. Hero MotoCorp Limited manufactures and sells motorized
two-wheelers and spare parts, as well as provides related services in India. The company provides motorcycles
and scooters.
Financial Highlights
With sales of 14,16,276 two-wheelers in Q2 FY’14, the company registered a total turnover of Rs. 57262.10 mn
and net profit after tax (PAT) of Rs 4814.10 mn. HMCL had reported a total turnover of Rs. Rs. 51874.60 mn and
PAT of Rs 4405.80 mn in the corresponding quarter in the previous fiscal. EBIDTA margin for the second quarter
of this financial year stood at 14.5 per cent. The cumulative sales for first half of the year (April-Sept’13) stands at
29,75,558 two-wheelers. The company registered a total turnover of Rs 118857.30 mn and net profit after tax of
Rs 10299.90 mn in this period. EBIDTA margin for the H1 FY14 stood at 14.7 per cent. HMCL recently
commenced construction of its Rs 450 Crore “Hero Centre of Global Innovation and Research & Design (R&D)” at
Kukas, Jaipur in Rajasthan.
In July 2013, Hero MotoCorp began its quest in Africa with the launch of brand Hero in Kenya, Burkina Faso and
Ivory Coast. HMCL has also set-up its first international assembly unit at Nairobi in Kenya. The company followed
it with the launch of operations in Peru in Latin America. As of today, Hero two-wheelers sell in 11 markets
across the globe. The Company has reached the historic milestone of 50 million unit’s production. Over the past
two years, it has been working hard to build a foundation to realize their aspirations of a New Hero. This New
Hero will plans to enter into 50 countries with 20 manufacturing facilities across the globe and 100 million
cumulative two-wheelers sold by 2020. In the short term, HMCL will plans to launch Brand Hero in 10 more
international markets by the end of this year. And by next year, it will plan to have six assembly facilities spread
across three continents.
Results updates- Q2 FY14,
Months Sep-13 Sep-12 % Change
Net Sales 57262.10 51874.60 10.39
PAT 4814.10 4405.80 9.27
EPS 24.11 22.06 9.27
EBITDA 9481.60 8185.30 15.84

29 | P a g e
A NEW vision for a NEW Hero
With HMCL fast augmenting its presence globally and further strengthening its leadership in the domestic
market, the company unveiled a global vision for brand ‘Hero’- to be achieved by year 2020:
Surpass 100 million units in cumulative production
Annual bike and scooter sales of 12 million
More than 20 manufacturing and assembly plants across the globe
Sales in more than 50 countries
Turnover of Rs 60,000 crore
Latest Updates
HMCL recently commenced construction of its Rs 450 Crore “Hero Centre of Global Innovation and Research
& Design (R&D)” at Kukas, Jaipur in Rajasthan.
HMCL has launched brand ‘Hero’ and its range of two-wheelers in Peru, marking the iconic brand’s foray into
the Latin American market. And also entered into a partnership with MOTOCORP S.A.C– a part of the reputed
EFE Group of Peru - to bring its two-wheelers to this market.
The Company has reached the historic milestone of 50 million unit’s production. Over the past two years, it
has been working hard to build a foundation to realize their aspirations of a New Hero. This New Hero will
plans to enter into 50 countries with 20 manufacturing facilities across the globe and 100 million cumulative
two-wheelers sold by 2020.
In the short term, HMCL will plans to launch Brand Hero in 10 more international markets by the end of this
year. And by next year, it will plan to have six assembly facilities spread across three continents.
HMCL has recently showcased next-gen features to be introduced in its new product line-up, namely, i3S
Technology (Idle Stop & Start System) for two-wheelers which will soon make its debut in the all-new
Splendor iSmart; Integrated Braking System (IBS) that is being introduced in the all-new Pleasure and
Electronic Immobilizer which will debut on the new 150cc Xtreme. Hero has filed for patents for these
technological innovations.
Hero MotoCorp Ltd is setting up two new plants at Neemrana, Rajasthan and Gujarat and it has integrated a
R&D Centre at Kukas, Jaipur with an investment of Rs. 2500 crore.
HMCL launched the country's first-ever warranty of 5 years on all its two-wheelers (5 years or 70,000 km on
motorcycles, whichever is earlier and 5 years or 50,000 km on scooters, whichever is earlier).
30 | P a g e
Investments
Hero MotoCorp’s newly-incorporated wholly-owned American subsidiary - HMCL (NA).
Hero MotoCorp is investing US$25 million for a total stake of 49.2% in the share capital of Erik Buell Racing
(EBR). The first tranche of US$15 million has already been invested by HMCL. The second tranche of US$10
million is proposed to be invested within the next nine months. The equity partnership with EBR is reflective
of its long-term vision of transforming Hero MotoCorp to a truly global two-wheeler major with footprints
spread across continents, offering a wide range of technologically-advanced two-wheelers.
Hero MotoCorp recently launched its own retail finance arm, Hero FinCorp, with a phase-wise expansion
plan. Having been launched in Delhi, the retail financing services will shortly be extended to the National
Capital Region and then to the rest of the northern market in the next phase. The initial plan is to make Hero
FinCorp services available at about 200 dealerships in various parts of the country by March 2014, and
extend it to as many as 450 dealerships by March 2015.
Expansion
Setting up a fourth plant at Neemrana in Rajasthan with an annual installed capacity of 750,000 units.
Setting up a fifth plant at Halol in Gujarat, with an annual installed capacity of 1.2 million in the initial phase,
which will grow to 1.8 million in the next phase.
Setting up a new state-of-the-art integrated R&D centre at Kukas, Rajasthan.
Consistent expansion across all three existing plants.
Setting up a Global Parts Centre (GPC) at Neemrana, Rajasthan.
31 | P a g e
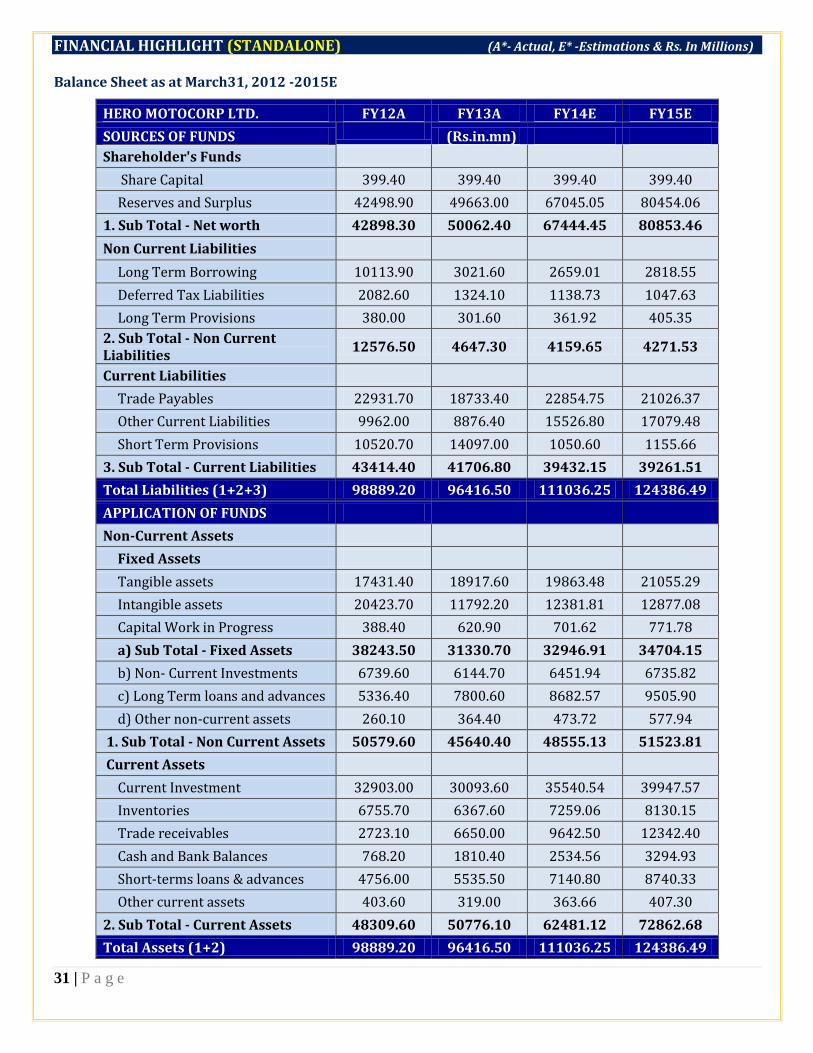
FINANCIAL HIGHLIGHT (STANDALONE) (A*- Actual, E* -Estimations & Rs. In Millions)
Balance Sheet as at March31, 2012 -2015E
HERO MOTOCORP LTD. FY12A FY13A FY14E FY15E
SOURCES OF FUNDS (Rs.in.mn)
Shareholder's Funds
Share Capital 399.40 399.40 399.40 399.40
Reserves and Surplus 42498.90 49663.00 67045.05 80454.06
1. Sub Total - Net worth 42898.30 50062.40 67444.45 80853.46
Non Current Liabilities
Long Term Borrowing 10113.90 3021.60 2659.01 2818.55
Deferred Tax Liabilities 2082.60 1324.10 1138.73 1047.63
Long Term Provisions 380.00 301.60 361.92 405.35
2. Sub Total - Non Current Liabilities
12576.50 4647.30 4159.65 4271.53
Current Liabilities
Trade Payables 22931.70 18733.40 22854.75 21026.37
Other Current Liabilities 9962.00 8876.40 15526.80 17079.48
Short Term Provisions 10520.70 14097.00 1050.60 1155.66
3. Sub Total - Current Liabilities 43414.40 41706.80 39432.15 39261.51
Total Liabilities (1+2+3) 98889.20 96416.50 111036.25 124386.49
APPLICATION OF FUNDS
Non-Current Assets
Fixed Assets
Tangible assets 17431.40 18917.60 19863.48 21055.29
Intangible assets 20423.70 11792.20 12381.81 12877.08
Capital Work in Progress 388.40 620.90 701.62 771.78
a) Sub Total - Fixed Assets 38243.50 31330.70 32946.91 34704.15
b) Non- Current Investments 6739.60 6144.70 6451.94 6735.82
c) Long Term loans and advances 5336.40 7800.60 8682.57 9505.90
d) Other non-current assets 260.10 364.40 473.72 577.94
1. Sub Total - Non Current Assets 50579.60 45640.40 48555.13 51523.81
Current Assets
Current Investment 32903.00 30093.60 35540.54 39947.57
Inventories 6755.70 6367.60 7259.06 8130.15
Trade receivables 2723.10 6650.00 9642.50 12342.40
Cash and Bank Balances 768.20 1810.40 2534.56 3294.93
Short-terms loans & advances 4756.00 5535.50 7140.80 8740.33
Other current assets 403.60 319.00 363.66 407.30
2. Sub Total - Current Assets 48309.60 50776.10 62481.12 72862.68
Total Assets (1+2) 98889.20 96416.50 111036.25 124386.49

32 | P a g e
Annual Profit & Loss Statement for the period of 2012 to 2015E
Value(Rs.in.mn) FY12A FY13A FY14E FY15E
Description 12m 12m 12m 12m
Net Sales 235790.30 237681.10 254318.78 272121.09
Other Income 3645.70 3983.80 4461.86 4729.57
Total Income 239436.00 241664.90 258780.63 276850.66
Expenditure -199602.50 -204836.30 -217696.87 -232663.53
Operating Profit 39833.50 36828.60 41083.76 44187.13
Interest -213.00 -119.10 -126.25 -133.82
Gross profit 39620.50 36709.50 40957.51 44053.30
Depreciation -10973.40 -11417.50 -11760.03 -12348.03
Profit Before Tax 28647.10 25292.00 29197.49 31705.28
Tax -4865.80 -4110.40 -6773.82 -7292.21
Net Profit 23781.30 21181.60 22423.67 24413.06
Equity capital 399.40 399.40 399.40 399.40
Reserves 42498.90 49663.00 67045.05 80454.06
Face value 2.00 2.00 2.00 2.00
EPS 119.09 106.07 112.29 122.25
Quarterly Profit & Loss Statement for the period of 31st Mar, 2013 to 31st Dec, 2013E
Value(Rs.in.mn) 31-Mar-13 30-Jun-13 30-Sep-13 31-Dec-13E
Description 3m 3m 3m 3m
Net sales 61457.50 61595.20 57262.10 63560.93
Other income 1045.10 1122.60 1154.60 1108.42
Total Income 62502.60 62717.80 58416.70 64669.35
Expenditure -52959.70 -52443.00 -48935.10 -54814.95
Operating profit 9542.90 10274.80 9481.60 9854.40
Interest -30.70 -29.50 -29.60 -28.42
Gross profit 9512.20 10245.30 9452.00 9825.98
Depreciation -2655.30 -2743.80 -2869.10 -2983.86
Profit Before Tax 6856.90 7501.50 6582.90 6842.12
Tax -1114.60 -2015.70 -1768.80 -1594.21
Net Profit 5742.30 5485.80 4814.10 5247.91
Equity capital 399.40 399.40 399.40 399.40
Face value 2.00 2.00 2.00 2.00
EPS 28.75 27.47 24.11 26.28

33 | P a g e
Ratio Analysis
Particulars FY12A FY13A FY14E FY15E
EPS (Rs.) 119.09 106.07 112.29 122.25
EBITDA Margin (%) 16.89% 15.49% 16.15% 16.24%
PBT Margin (%) 12.15% 10.64% 11.48% 11.65%
PAT Margin (%) 10.09% 8.91% 8.82% 8.97%
P/E Ratio (x) 17.51 19.66 18.57 17.06
ROE (%) 55.44% 42.31% 33.25% 30.19%
ROCE (%) 95.84% 90.89% 75.38% 67.57%
Debt Equity Ratio 0.24 0.06 0.04 0.03
EV/EBITDA (x) 10.69 11.34 10.14 9.41
Book Value (Rs.) 214.81 250.69 337.73 404.87
P/BV 9.71 8.32 6.17 5.15
Outlook and Conclusion
At the current market price of Rs.2085.00, the stock P/E ratio is at 18.57 x FY14E and 17.06 x FY15E
respectively.
Earning per share (EPS) of the company for the earnings for FY14E and FY15E is seen at Rs.112.29 and
Rs.122.25 respectively.
Net Sales and Operating Profit of the company are expected to grow at a CAGR of 5% and 4% over 2012 to
2015E respectively.
On the basis of EV/EBITDA, the stock trades at 10.14 x for FY14E and 9.41 x for FY15E.
Price to Book Value of the stock is expected to be at 6.17 x and 5.15 x respectively for FY14E and FY15E.

34 | P a g e
BAJAJ AUTO LTD
Bajaj Auto was founded in 1926. Bajaj Auto is world’s fourth largest two- and three-wheeler manufacturer. Bajaj
Auto is into manufacturing motorcycles, scooters and three wheelers. In India, Bajaj Auto has a distribution
network of 791 dealers and over 1,600 authorized services centers. It has total 3750 rural outlets in rural areas.
In FY2013, Bajaj Auto sold over 3.76 million motorcycles in India and abroad. The manufacturing units are
located in the Industrial estates of Waluj (Aurangabad) and Chakan (Pune) in Maharashtra and Pantnagar in
Uttarakhand.
Financial Highlights
Bajaj Auto posted net profit of Rs 8371.60 mn is the highest ever quarterly profit. The company recorded an all
time high operating EBITDA of Rs 12561.20 mn in Q2 FY14. During the quarter, EBITDA margin edged up to
23.1% from 21.3% in Q1 FY14 and 18.7% in Q2 FY13. After payment of dividend and cash thereon amounting to
Rs. 15180 mn during Q2 September 2013, as on 30 September 2013, surplus cash and cash equivalents stood at
Rs. 65160 mn. As on 30th June 2013, surplus cash and cash equivalents stood at Rs 63910 mn.
The company’s outperformance in margins can be attributed to factors including transforming itself into an
Indian multi national company with international business contributing 40% of total revenue. Over the last five
years, strategic initiatives taken to enter into difficult markets, like Africa, is yielding rich dividends. The benefits
are now further enhanced with rupee depreciation. The company has focused on high margin products with 75%
of Bajaj Auto's revenue generated by business verticles which operate on EBITDA margins in excess of 20%. The
company also operates on an essentially variable cost structure with fixed cost, including depreciation, interest
and even employee cost was under 8%. This protects the company from any slowdown in demand as being
witnessed in the domestic market over last few quarters.
Results updates- Q2 FY14,
Months Sep-13 Sep-12 % Change
Net Sales 51748.90 49724.00 4.07
PAT 8371.60 7406.70 13.03
EPS 28.93 25.60 13.03
EBITDA 12561.20 10819.30 16.10
35 | P a g e
Latets Updates
The Company’s current installed capacity is 5.4 million units per annum. The Company plans to increase the
installed capacity to 6.06 million units per annum by March 2014.
The 4 Wheeler project is going on as per plan and is being implemented at Waluj. Commercial production of
the four-wheeler RE 60 is slated for second half of 2013-14.
36 | P a g e
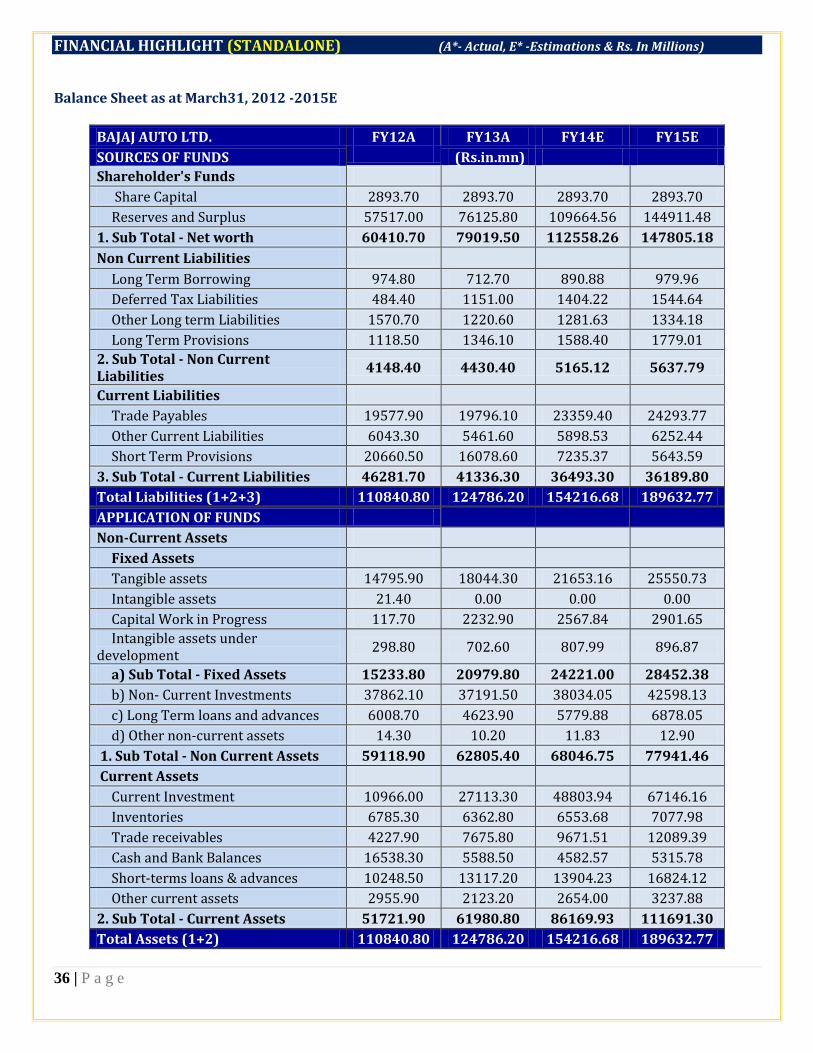
FINANCIAL HIGHLIGHT (STANDALONE) (A*- Actual, E* -Estimations & Rs. In Millions)
Balance Sheet as at March31, 2012 -2015E
BAJAJ AUTO LTD. FY12A FY13A FY14E FY15E
SOURCES OF FUNDS (Rs.in.mn)
Shareholder's Funds
Share Capital 2893.70 2893.70 2893.70 2893.70
Reserves and Surplus 57517.00 76125.80 109664.56 144911.48
1. Sub Total - Net worth 60410.70 79019.50 112558.26 147805.18
Non Current Liabilities
Long Term Borrowing 974.80 712.70 890.88 979.96
Deferred Tax Liabilities 484.40 1151.00 1404.22 1544.64
Other Long term Liabilities 1570.70 1220.60 1281.63 1334.18
Long Term Provisions 1118.50 1346.10 1588.40 1779.01
2. Sub Total - Non Current Liabilities
4148.40 4430.40 5165.12 5637.79
Current Liabilities
Trade Payables 19577.90 19796.10 23359.40 24293.77
Other Current Liabilities 6043.30 5461.60 5898.53 6252.44
Short Term Provisions 20660.50 16078.60 7235.37 5643.59
3. Sub Total - Current Liabilities 46281.70 41336.30 36493.30 36189.80
Total Liabilities (1+2+3) 110840.80 124786.20 154216.68 189632.77
APPLICATION OF FUNDS
Non-Current Assets
Fixed Assets
Tangible assets 14795.90 18044.30 21653.16 25550.73
Intangible assets 21.40 0.00 0.00 0.00
Capital Work in Progress 117.70 2232.90 2567.84 2901.65
Intangible assets under development
298.80 702.60 807.99 896.87
a) Sub Total - Fixed Assets 15233.80 20979.80 24221.00 28452.38
b) Non- Current Investments 37862.10 37191.50 38034.05 42598.13
c) Long Term loans and advances 6008.70 4623.90 5779.88 6878.05
d) Other non-current assets 14.30 10.20 11.83 12.90
1. Sub Total - Non Current Assets 59118.90 62805.40 68046.75 77941.46
Current Assets
Current Investment 10966.00 27113.30 48803.94 67146.16
Inventories 6785.30 6362.80 6553.68 7077.98
Trade receivables 4227.90 7675.80 9671.51 12089.39
Cash and Bank Balances 16538.30 5588.50 4582.57 5315.78
Short-terms loans & advances 10248.50 13117.20 13904.23 16824.12
Other current assets 2955.90 2123.20 2654.00 3237.88
2. Sub Total - Current Assets 51721.90 61980.80 86169.93 111691.30
Total Assets (1+2) 110840.80 124786.20 154216.68 189632.77
37 | P a g e
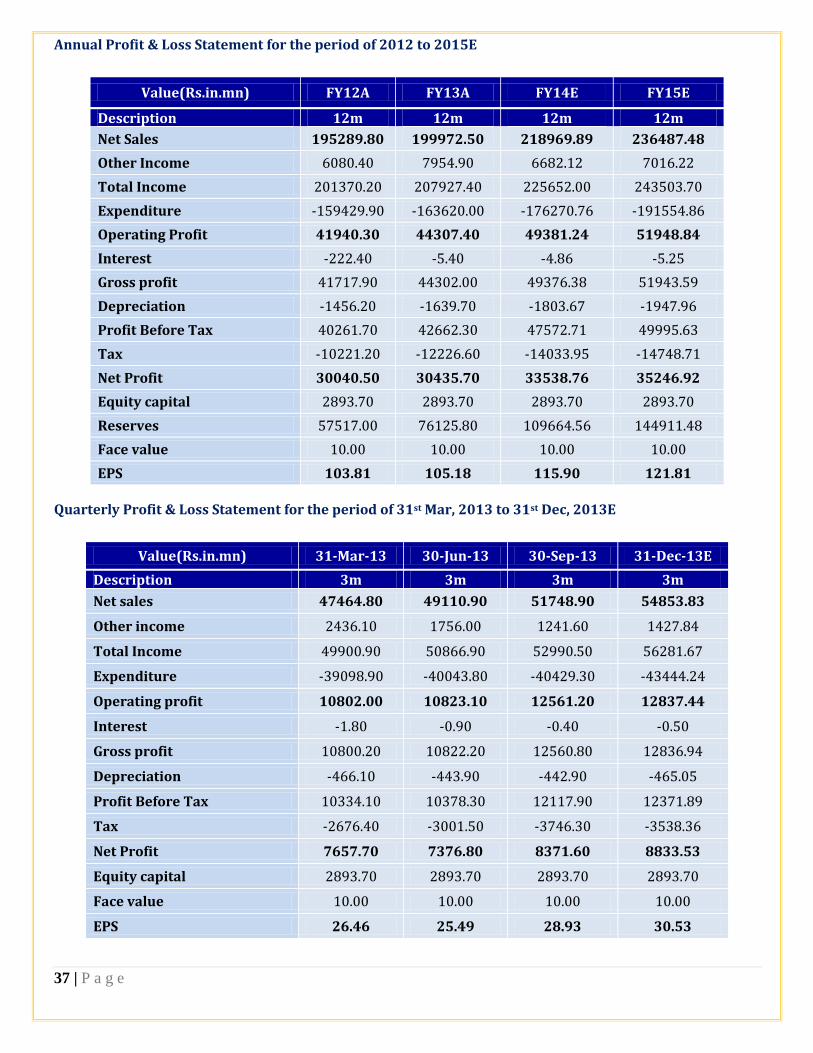
Annual Profit & Loss Statement for the period of 2012 to 2015E
Value(Rs.in.mn) FY12A FY13A FY14E FY15E
Description 12m 12m 12m 12m
Net Sales 195289.80 199972.50 218969.89 236487.48
Other Income 6080.40 7954.90 6682.12 7016.22
Total Income 201370.20 207927.40 225652.00 243503.70
Expenditure -159429.90 -163620.00 -176270.76 -191554.86
Operating Profit 41940.30 44307.40 49381.24 51948.84
Interest -222.40 -5.40 -4.86 -5.25
Gross profit 41717.90 44302.00 49376.38 51943.59
Depreciation -1456.20 -1639.70 -1803.67 -1947.96
Profit Before Tax 40261.70 42662.30 47572.71 49995.63
Tax -10221.20 -12226.60 -14033.95 -14748.71
Net Profit 30040.50 30435.70 33538.76 35246.92
Equity capital 2893.70 2893.70 2893.70 2893.70
Reserves 57517.00 76125.80 109664.56 144911.48
Face value 10.00 10.00 10.00 10.00
EPS 103.81 105.18 115.90 121.81
Quarterly Profit & Loss Statement for the period of 31st Mar, 2013 to 31st Dec, 2013E
Value(Rs.in.mn) 31-Mar-13 30-Jun-13 30-Sep-13 31-Dec-13E
Description 3m 3m 3m 3m
Net sales 47464.80 49110.90 51748.90 54853.83
Other income 2436.10 1756.00 1241.60 1427.84
Total Income 49900.90 50866.90 52990.50 56281.67
Expenditure -39098.90 -40043.80 -40429.30 -43444.24
Operating profit 10802.00 10823.10 12561.20 12837.44
Interest -1.80 -0.90 -0.40 -0.50
Gross profit 10800.20 10822.20 12560.80 12836.94
Depreciation -466.10 -443.90 -442.90 -465.05
Profit Before Tax 10334.10 10378.30 12117.90 12371.89
Tax -2676.40 -3001.50 -3746.30 -3538.36
Net Profit 7657.70 7376.80 8371.60 8833.53
Equity capital 2893.70 2893.70 2893.70 2893.70
Face value 10.00 10.00 10.00 10.00
EPS 26.46 25.49 28.93 30.53
38 | P a g e
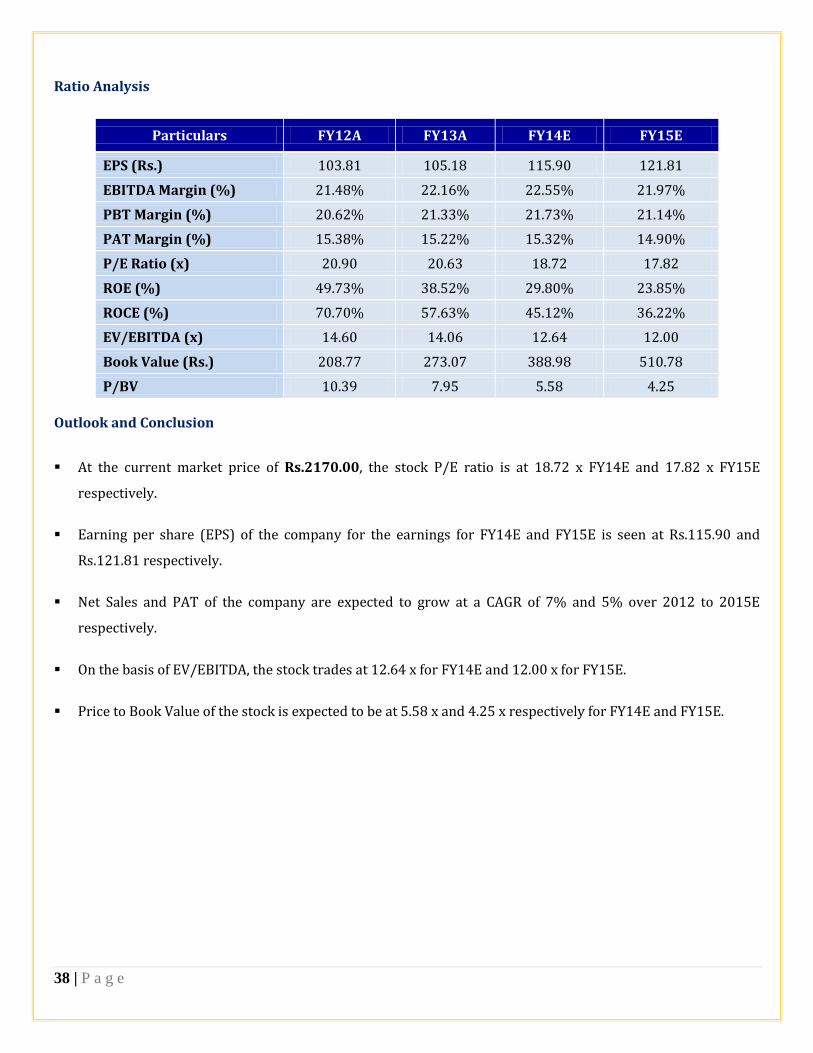
Ratio Analysis
Particulars FY12A FY13A FY14E FY15E
EPS (Rs.) 103.81 105.18 115.90 121.81
EBITDA Margin (%) 21.48% 22.16% 22.55% 21.97%
PBT Margin (%) 20.62% 21.33% 21.73% 21.14%
PAT Margin (%) 15.38% 15.22% 15.32% 14.90%
P/E Ratio (x) 20.90 20.63 18.72 17.82
ROE (%) 49.73% 38.52% 29.80% 23.85%
ROCE (%) 70.70% 57.63% 45.12% 36.22%
EV/EBITDA (x) 14.60 14.06 12.64 12.00
Book Value (Rs.) 208.77 273.07 388.98 510.78
P/BV 10.39 7.95 5.58 4.25
Outlook and Conclusion
At the current market price of Rs.2170.00, the stock P/E ratio is at 18.72 x FY14E and 17.82 x FY15E
respectively.
Earning per share (EPS) of the company for the earnings for FY14E and FY15E is seen at Rs.115.90 and
Rs.121.81 respectively.
Net Sales and PAT of the company are expected to grow at a CAGR of 7% and 5% over 2012 to 2015E
respectively.
On the basis of EV/EBITDA, the stock trades at 12.64 x for FY14E and 12.00 x for FY15E.
Price to Book Value of the stock is expected to be at 5.58 x and 4.25 x respectively for FY14E and FY15E.
39 | P a g e
EICHER MOTORS LTD
Eicher Motors Limited (EML) is the flagship company of the Eicher Group, which was a catalyst in the green
revolution in India with the production of India’s first agricultural tractor in 1959. EML is now a leading player in
the Indian automotive space. Its 50-50 joint venture with the Volvo group, VE Commercial Vehicles Limited,
designs, manufactures and markets reliable, fuel-efficient trucks and buses; and is leading the path in driving
modernization in commercial transportation in India and other developing markets. Eicher Motors also owns the
iconic Royal Enfield motorcycle business, which leads the premium motorcycle segment in India. The oldest
motorcycle company in continuous production world-wide, Royal Enfield has witnessed a huge surge in demand
in the recent past, and is charting its course to be the leading player in the mid-size motorcycle segment globally.
EML’s 50:50 strategic joint venture with US based Polaris Industries Inc., Eicher Polaris Private Ltd. is in start-up
phase, and is currently designing and developing, and will soon manufacture and sell a full new range of personal
vehicles. In 2012, Eicher Motors recorded its highest ever sales of INR 7,000 crores (USD 1.3 billion).
Royal Enfield has also substantially expanded and upgraded its network across the country. In 2012 it added 63
new dealerships taking the total dealership network to 249.
Financial Highlights
In Q3 2013, Eicher Motors Limited reported its best ever standalone results- relating entirely to Royal Enfield
motorcycle operations, with a quarterly total income from operations at Rs. 4589.70 million, an increase of
66.23% over Rs. 2761.10 million in Q3 2012. The quarterly operating profit (EBIT) recorded an increase of
116.9% at Rs. 805 million in Q3 2013 over Rs. 371 million in Q3, 2012. Royal Enfield has maintained its
phenomenal growth trajectory even in Q3 2013 registering the best ever quarter results. Royal Enfield has
registered year-on-year unit sales growth of 60.6% with record sales of 48,242 units as compared to 30,046 units
in Q3 2012. It is continuing to extract operating leverage from the business, thus improving the EBIT margin to
17.5% in Q3 2013 as compared to 13.4% in Q3 2012.
The Company continued to improve their overall market share in commercial vehicles through 50:50 joint
venture with the Volvo Group – VE Commercial Vehicles (VECV). For the nine month period ending September
30, 2013, the industry declined by 33.6%, but the Company Heavy Duty market share increased to 4.5% from
3.7% in the corresponding period last year. The products in the bus segment continue to do well. For the third
quarter ending September 30, 2013, the Company has reported a consolidated total income from operations at
Rs. 17361 million. Earnings before interest and tax (EBIT) are increased by 95.8% in Q3 2013.
VECV’s Eicher Trucks and Buses division is preparing to launch its full new range of trucks and buses. These are
absolutely world-class products that will completely renew ETB’s product portfolio. Royal Enfield has created

40 | P a g e
and been leading the premium category of motorcycles in India for all these years with evocative products such
as the Classic and the Thunderbird. In September 2013, Royal Enfield had its first successful global launch with
the all new Continental GT- a motorcycle that perfects the essential elements of the most influential idea in
motorcycling history – café racing.
Results updates- Q3 CY13
Months Sep-13 Sep-12 % Change
Net Sales 4589.70 2761.10 66.23
PAT 617.90 329.70 87.41
EPS 22.88 12.21 87.34
EBITDA 906.20 454.60 99.34
Latest Updates
Royal Enfield has registered year-on-year unit sales growth of 60.6% with record sales of 48,242 units as
compared to 30,046 units in Q3 2012.
The Company has sold 1858 buses in Q3 2013 compared to 2326 buses over same period last year,
registered a degrew of 20.12%
Eicher Motors has recently started production at VECV’s Medium Duty Engine Plant at Pithampur, Madhya
Pradesh. The plant has been set up with an initial capacity of 25,000 units per annum in Phase I, at an
investment of Rs 375 crores. The capacity will be increased in a phased manner to 100,000 units per annum
as per the market requirements with an additional investment of around Rs 125 crores.
Starting end 2013 till 2015, VECV’s Eicher Trucks and Buses division (ETB) will be renewing its entire
product portfolio by launching its new range of trucks and buses across light, medium and heavy duty. The
Company continues to invest in all their strategic projects in VECV. By end of CY 2014, it would have invested
Rs. 2500 crores since the creation of the joint venture in mid 2008.
During the quarter ended June, 2013, VE Commercial Vehicles has set up a wholly owned subsidiary V E C V
Lanka (Private) Ltd in Sri Lanka for the purpose of expanding its commercial vehicles operations in Sri Lanka
with an investment of Rs. 54.3 million.

41 | P a g e
Financial Highlight STANDALONE
Balance sheet as at December 31st, 2011-2014E
(A*- Actual, E* -Estimations & Rs. In Millions)
EICHER MOTORS LTD. CY11A CY12A CY13E CY14E
SOURCES OF FUNDS (Rs.in.mn)
Shareholder's Funds
Share Capital 269.90 270.00 270.10 270.10
Reserves and Surplus 5130.50 6020.50 8767.26 11927.00
1. Sub Total - Net worth 5400.40 6290.50 9037.36 12197.10
Non Current Liabilities
Long Term Borrowing 5.80 0.00 0.00 0.00
Deferred Tax Liability (net) 39.20 62.60 105.20 82.06
Other Long term Liabilities 27.30 32.30 38.11 42.69
Long Term Provisions 80.90 92.60 103.71 112.01
2. Sub Total - Non Current Liabilities 153.20 187.50 247.03 236.75
Current Liabilities
Short term borrowings 136.70 200.10 322.16 373.71
Trade Payables 1058.70 1775.00 2396.25 2731.73
Other Current Liabilities 595.10 1168.10 1366.68 1503.34
Short Term Provisions 479.70 621.20 93.18 102.50
3. Sub Total - Current Liabilities 2270.20 3764.40 4178.27 4711.27
Total Liabilities (1+2+3) 7823.80 10242.40 13462.65 17145.13
APPLICATION OF FUNDS
Non-Current Assets
Fixed Assets
Tangible assets 1097.50 1338.30 1900.39 2394.49
Intangible assets 25.50 38.70 50.31 62.38
Capital Work in Progress 42.10 603.30 868.75 1042.50
a) Sub Total - Fixed Assets 1165.10 1980.30 2819.45 3499.37
b) Non-current investments 54.40 109.40 114.87 119.46
c) Long Term loans and advances 348.10 613.00 472.01 528.65
d) Other non-current assets 57.60 61.80 77.87 89.55
1. Sub Total – Non Current Assets 1625.20 2764.50 3484.20 4237.04
Current Assets
Current Investments 5125.70 6384.50 8133.86 10483.55
Inventories 452.7 754.10 942.63 1150.00
Trade receivables 41.00 62.00 150.50 204.68
Cash and Bank Balances 29.80 35.00 96.00 126.72
Short-terms loans & advances 138.70 239.40 652.40 939.46
Other current assets 410.70 2.90 3.07 3.69
2. Sub Total - Current Assets 6198.60 7477.90 9978.46 12908.09
Total Assets (1+2) 7823.80 10242.40 13462.65 17145.13
42 | P a g e
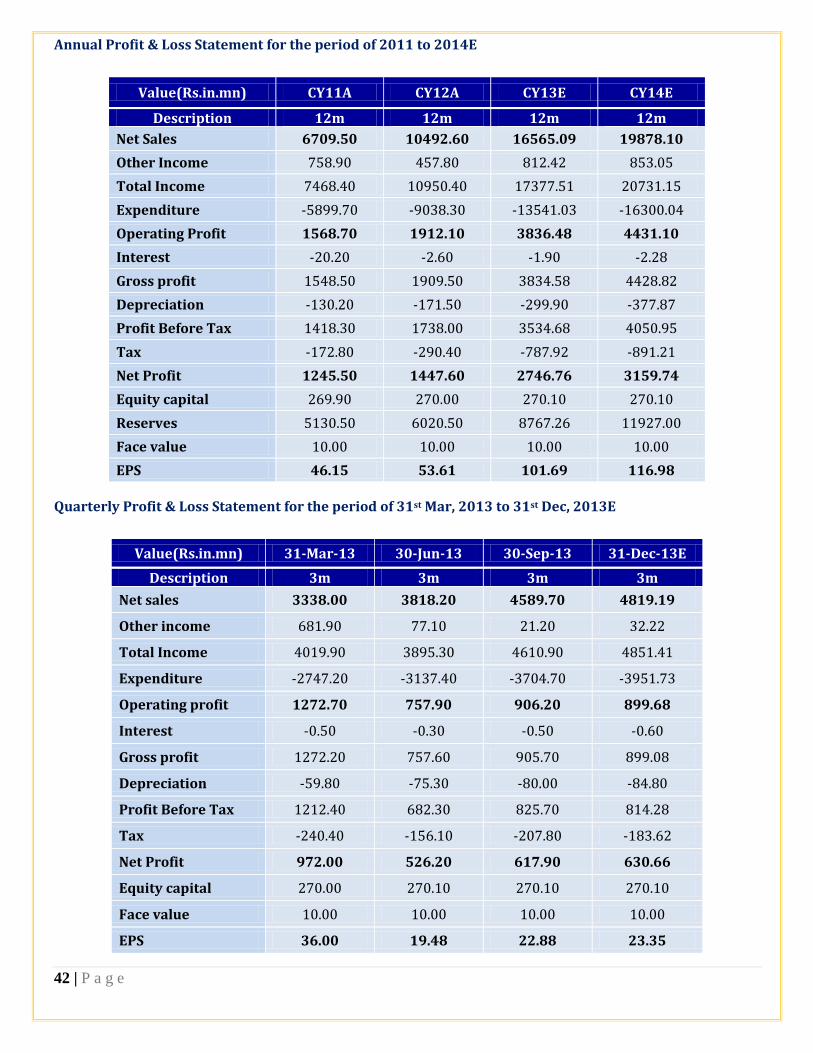
Annual Profit & Loss Statement for the period of 2011 to 2014E
Value(Rs.in.mn) CY11A CY12A CY13E CY14E
Description 12m 12m 12m 12m
Net Sales 6709.50 10492.60 16565.09 19878.10
Other Income 758.90 457.80 812.42 853.05
Total Income 7468.40 10950.40 17377.51 20731.15
Expenditure -5899.70 -9038.30 -13541.03 -16300.04
Operating Profit 1568.70 1912.10 3836.48 4431.10
Interest -20.20 -2.60 -1.90 -2.28
Gross profit 1548.50 1909.50 3834.58 4428.82
Depreciation -130.20 -171.50 -299.90 -377.87
Profit Before Tax 1418.30 1738.00 3534.68 4050.95
Tax -172.80 -290.40 -787.92 -891.21
Net Profit 1245.50 1447.60 2746.76 3159.74
Equity capital 269.90 270.00 270.10 270.10
Reserves 5130.50 6020.50 8767.26 11927.00
Face value 10.00 10.00 10.00 10.00
EPS 46.15 53.61 101.69 116.98
Quarterly Profit & Loss Statement for the period of 31st Mar, 2013 to 31st Dec, 2013E
Value(Rs.in.mn) 31-Mar-13 30-Jun-13 30-Sep-13 31-Dec-13E
Description 3m 3m 3m 3m
Net sales 3338.00 3818.20 4589.70 4819.19
Other income 681.90 77.10 21.20 32.22
Total Income 4019.90 3895.30 4610.90 4851.41
Expenditure -2747.20 -3137.40 -3704.70 -3951.73
Operating profit 1272.70 757.90 906.20 899.68
Interest -0.50 -0.30 -0.50 -0.60
Gross profit 1272.20 757.60 905.70 899.08
Depreciation -59.80 -75.30 -80.00 -84.80
Profit Before Tax 1212.40 682.30 825.70 814.28
Tax -240.40 -156.10 -207.80 -183.62
Net Profit 972.00 526.20 617.90 630.66
Equity capital 270.00 270.10 270.10 270.10
Face value 10.00 10.00 10.00 10.00
EPS 36.00 19.48 22.88 23.35
43 | P a g e
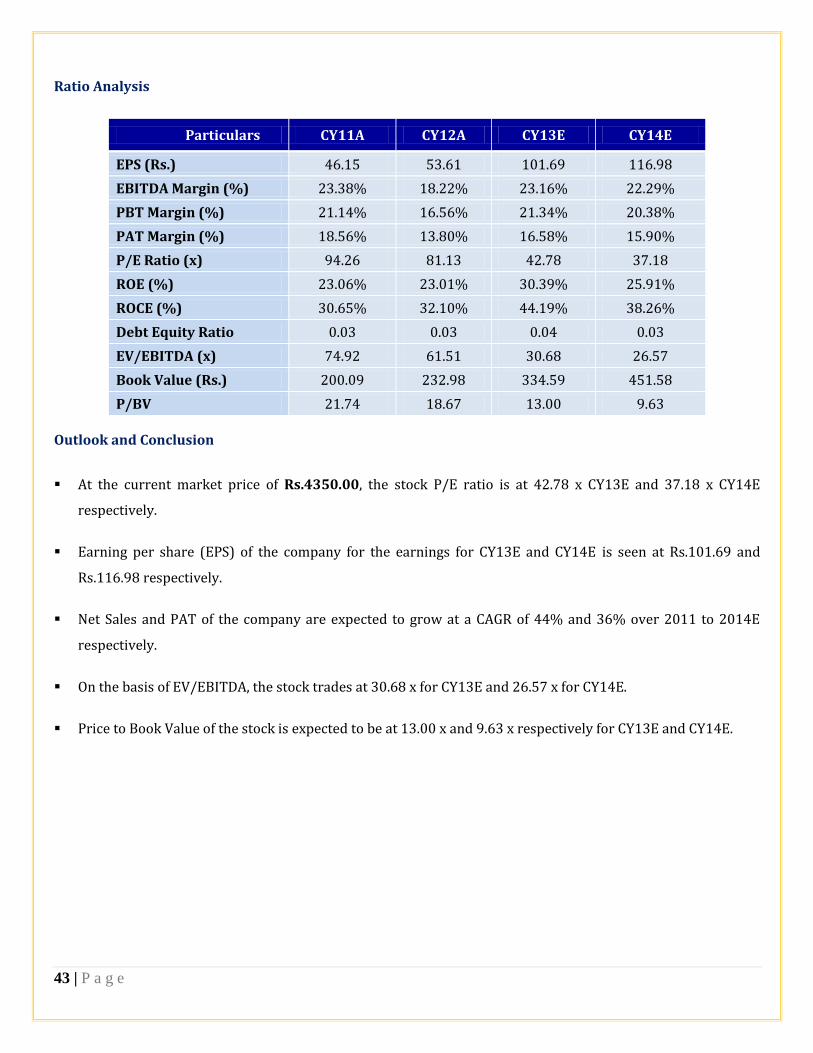
Ratio Analysis
Particulars CY11A CY12A CY13E CY14E
EPS (Rs.) 46.15 53.61 101.69 116.98
EBITDA Margin (%) 23.38% 18.22% 23.16% 22.29%
PBT Margin (%) 21.14% 16.56% 21.34% 20.38%
PAT Margin (%) 18.56% 13.80% 16.58% 15.90%
P/E Ratio (x) 94.26 81.13 42.78 37.18
ROE (%) 23.06% 23.01% 30.39% 25.91%
ROCE (%) 30.65% 32.10% 44.19% 38.26%
Debt Equity Ratio 0.03 0.03 0.04 0.03
EV/EBITDA (x) 74.92 61.51 30.68 26.57
Book Value (Rs.) 200.09 232.98 334.59 451.58
P/BV 21.74 18.67 13.00 9.63
Outlook and Conclusion
At the current market price of Rs.4350.00, the stock P/E ratio is at 42.78 x CY13E and 37.18 x CY14E
respectively.
Earning per share (EPS) of the company for the earnings for CY13E and CY14E is seen at Rs.101.69 and
Rs.116.98 respectively.
Net Sales and PAT of the company are expected to grow at a CAGR of 44% and 36% over 2011 to 2014E
respectively.
On the basis of EV/EBITDA, the stock trades at 30.68 x for CY13E and 26.57 x for CY14E.
Price to Book Value of the stock is expected to be at 13.00 x and 9.63 x respectively for CY13E and CY14E.
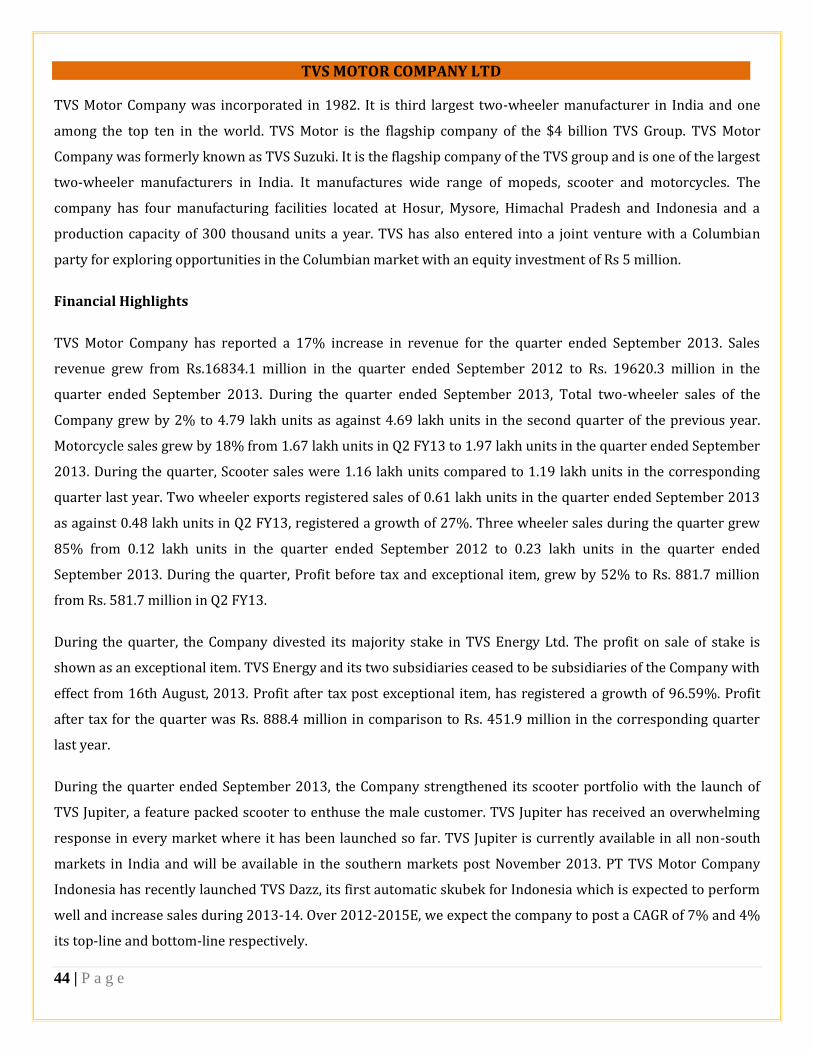
44 | P a g e
TVS MOTOR COMPANY LTD
TVS Motor Company was incorporated in 1982. It is third largest two-wheeler manufacturer in India and one
among the top ten in the world. TVS Motor is the flagship company of the $4 billion TVS Group. TVS Motor
Company was formerly known as TVS Suzuki. It is the flagship company of the TVS group and is one of the largest
two-wheeler manufacturers in India. It manufactures wide range of mopeds, scooter and motorcycles. The
company has four manufacturing facilities located at Hosur, Mysore, Himachal Pradesh and Indonesia and a
production capacity of 300 thousand units a year. TVS has also entered into a joint venture with a Columbian
party for exploring opportunities in the Columbian market with an equity investment of Rs 5 million.
Financial Highlights
TVS Motor Company has reported a 17% increase in revenue for the quarter ended September 2013. Sales
revenue grew from Rs.16834.1 million in the quarter ended September 2012 to Rs. 19620.3 million in the
quarter ended September 2013. During the quarter ended September 2013, Total two-wheeler sales of the
Company grew by 2% to 4.79 lakh units as against 4.69 lakh units in the second quarter of the previous year.
Motorcycle sales grew by 18% from 1.67 lakh units in Q2 FY13 to 1.97 lakh units in the quarter ended September
2013. During the quarter, Scooter sales were 1.16 lakh units compared to 1.19 lakh units in the corresponding
quarter last year. Two wheeler exports registered sales of 0.61 lakh units in the quarter ended September 2013
as against 0.48 lakh units in Q2 FY13, registered a growth of 27%. Three wheeler sales during the quarter grew
85% from 0.12 lakh units in the quarter ended September 2012 to 0.23 lakh units in the quarter ended
September 2013. During the quarter, Profit before tax and exceptional item, grew by 52% to Rs. 881.7 million
from Rs. 581.7 million in Q2 FY13.
During the quarter, the Company divested its majority stake in TVS Energy Ltd. The profit on sale of stake is
shown as an exceptional item. TVS Energy and its two subsidiaries ceased to be subsidiaries of the Company with
effect from 16th August, 2013. Profit after tax post exceptional item, has registered a growth of 96.59%. Profit
after tax for the quarter was Rs. 888.4 million in comparison to Rs. 451.9 million in the corresponding quarter
last year.
During the quarter ended September 2013, the Company strengthened its scooter portfolio with the launch of
TVS Jupiter, a feature packed scooter to enthuse the male customer. TVS Jupiter has received an overwhelming
response in every market where it has been launched so far. TVS Jupiter is currently available in all non-south
markets in India and will be available in the southern markets post November 2013. PT TVS Motor Company
Indonesia has recently launched TVS Dazz, its first automatic skubek for Indonesia which is expected to perform
well and increase sales during 2013-14. Over 2012-2015E, we expect the company to post a CAGR of 7% and 4%
its top-line and bottom-line respectively.
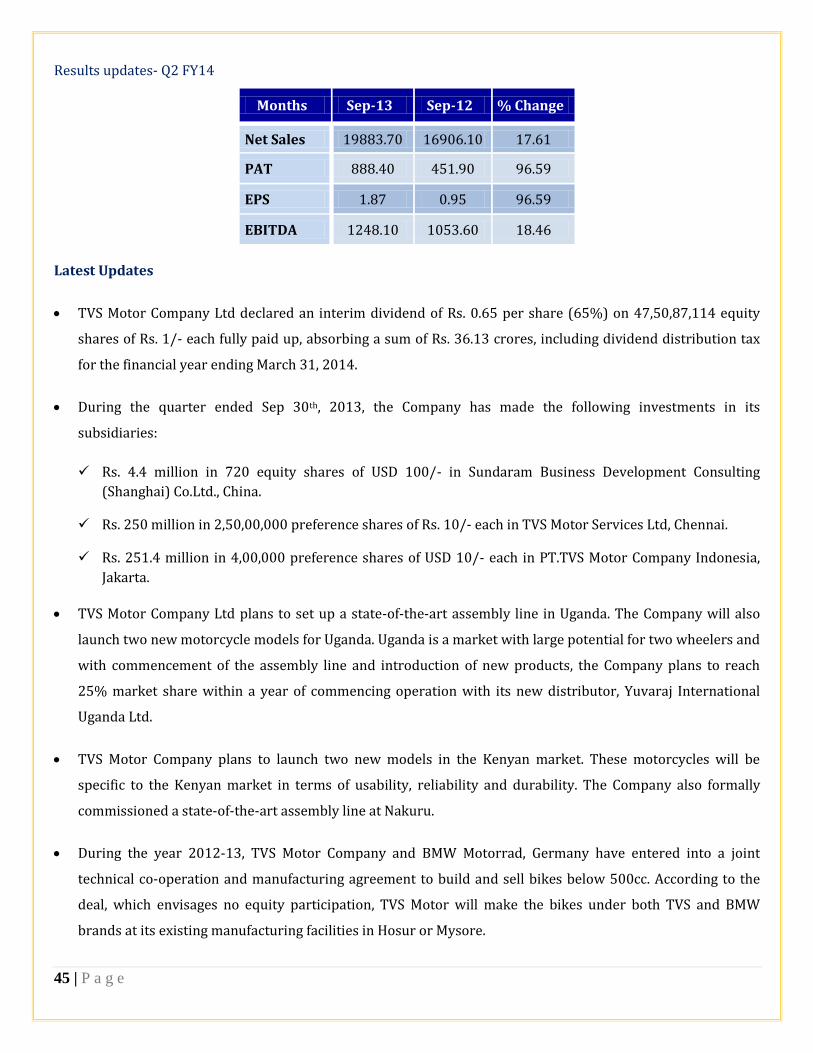
45 | P a g e
Results updates- Q2 FY14
Months Sep-13 Sep-12 % Change
Net Sales 19883.70 16906.10 17.61
PAT 888.40 451.90 96.59
EPS 1.87 0.95 96.59
EBITDA 1248.10 1053.60 18.46
Latest Updates
TVS Motor Company Ltd declared an interim dividend of Rs. 0.65 per share (65%) on 47,50,87,114 equity
shares of Rs. 1/- each fully paid up, absorbing a sum of Rs. 36.13 crores, including dividend distribution tax
for the financial year ending March 31, 2014.
During the quarter ended Sep 30th, 2013, the Company has made the following investments in its
subsidiaries:
Rs. 4.4 million in 720 equity shares of USD 100/- in Sundaram Business Development Consulting
(Shanghai) Co.Ltd., China.
Rs. 250 million in 2,50,00,000 preference shares of Rs. 10/- each in TVS Motor Services Ltd, Chennai.
Rs. 251.4 million in 4,00,000 preference shares of USD 10/- each in PT.TVS Motor Company Indonesia,
Jakarta.
TVS Motor Company Ltd plans to set up a state-of-the-art assembly line in Uganda. The Company will also
launch two new motorcycle models for Uganda. Uganda is a market with large potential for two wheelers and
with commencement of the assembly line and introduction of new products, the Company plans to reach
25% market share within a year of commencing operation with its new distributor, Yuvaraj International
Uganda Ltd.
TVS Motor Company plans to launch two new models in the Kenyan market. These motorcycles will be
specific to the Kenyan market in terms of usability, reliability and durability. The Company also formally
commissioned a state-of-the-art assembly line at Nakuru.
During the year 2012-13, TVS Motor Company and BMW Motorrad, Germany have entered into a joint
technical co-operation and manufacturing agreement to build and sell bikes below 500cc. According to the
deal, which envisages no equity participation, TVS Motor will make the bikes under both TVS and BMW
brands at its existing manufacturing facilities in Hosur or Mysore.

46 | P a g e
FINANCIAL HIGHLIGHT (STANDALONE) (A*- Actual, E* -Estimations & Rs. In Millions) Balance Sheet as at March31, 2012 -2015E
TVS Motor Company Ltd. FY12A FY13A FY14E FY15E
SOURCES OF FUNDS (Rs.in.mn)
Shareholder's Funds
Share Capital 475.10 475.10 475.10 475.10
Reserves and Surplus 11220.60 11771.60 14198.87 16982.35
1. Sub Total - Net worth 11695.70 12246.70 14673.97 17457.45
Non Current Liabilities
Long term borrowings 4799.30 4941.40 4990.81 5040.72
Deferred Tax Liabilities 975.50 931.20 1052.26 968.08
Long Term Provisions 485.40 531.70 616.77 678.45
2. Sub Total - Non Current Liabilities 6260.20 6404.30 6659.84 6687.25
Current Liabilities
Short Term Borrowings 2355.30 517.20 1100.20 1265.23
Trade Payables 7116.70 8228.00 8063.44 8224.71
Other Current Liabilities 3139.50 3262.30 5089.19 5598.11
Short Term Provisions 577.30 534.20 582.28 617.21
3. Sub Total - Current Liabilities 13188.80 12541.70 14835.11 15705.26
Total Liabilities (1+2+3) 31144.70 31192.70 36168.92 39849.96
APPLICATION OF FUNDS
Non-Current Assets
Fixed Assets
Tangible assets 10196.40 10068.50 11125.69 12015.75
Intangible assets 59.30 46.30 53.71 60.15
Capital Work in Progress 525.10 360.90 404.21 436.54
a) Sub Total - Fixed Assets 10780.80 10475.70 11583.61 12512.45
b) Non-current investments 9309.20 8688.40 9035.94 9433.52
c) Long Term loans and advances 573.30 733.50 821.52 903.67
1. Sub Total - Non Current Assets 20663.30 19897.60 21441.06 22849.63
Current Assets
Inventories 5845.60 5096.60 5708.19 6221.93
Trade receivables 2080.40 3005.20 3911.28 4849.98
Cash and Bank Balances 130.30 174.50 1524.20 1798.56
Short-terms loans & advances 1427.60 1784.40 2176.97 2553.78
Other current assets 997.50 1234.40 1407.22 1576.08
2. Sub Total - Current Assets 10481.40 11295.10 14727.85 17000.33
Total Assets (1+2) 31144.70 31192.70 36168.92 39849.96

47 | P a g e
Annual Profit & Loss Statement for the period of 2012 to 2015E
Value(Rs.in.mn) FY12A FY13A FY14E FY15E
Description 12m 12m 12m 12m
Net Sales 71262.00 71692.50 80295.60 88325.16
Other Income 217.10 238.40 274.16 287.87
Total Income 71479.10 71930.90 80569.76 88613.03
Expenditure -66568.30 -67602.20 -75477.86 -82937.33
Operating Profit 4910.80 4328.70 5091.90 5675.70
Interest -570.90 -480.40 -312.26 -343.49
Gross profit 4339.90 3848.30 4779.64 5332.22
Depreciation -1175.30 -1304.10 -1408.43 -1492.93
Exceptional Items 0.00 -916.30 0.00 0.00
Profit Before Tax 3164.60 1627.90 3371.21 3839.28
Tax -673.90 -475.60 -943.94 -1055.80
Profit After Tax 2490.70 1152.30 2427.27 2783.48
Extraordinary Items 0.00 7.90 0.00 0.00
Net Profit 2490.70 1160.20 2427.27 2783.48
Equity capital 475.10 475.10 475.10 475.10
Reserves 11217.90 11771.60 14198.87 16982.35
Face value 1.00 1.00 1.00 1.00
EPS 5.24 2.44 5.11 5.86
Quarterly Profit & Loss Statement for the period of 31st Mar, 2013 to 31st Dec, 2013E
Value(Rs.in.mn) 31-Mar-13 30-Jun-13 30-Sep-13 31-Dec-13E
Description 3m 3m 3m 3m
Net sales 17751.80 17601.80 19883.70 20679.05
Other income 96.30 86.00 77.00 72.38
Total Income 17848.10 17687.80 19960.70 20751.43
Expenditure -16814.20 -16617.60 -18712.60 -19521.02
Operating profit 1033.90 1070.20 1248.10 1230.41
Interest -55.60 -65.30 -52.10 -59.92
Gross profit 978.30 1004.90 1196.00 1170.49
Depreciation -346.90 -314.40 -314.30 -326.87
Exceptional Items -916.30 0.00 302.80 0.00
Profit Before Tax -284.90 690.50 1184.50 843.62
Tax -50.20 -171.80 -296.10 -210.90
Profit After Tax -335.10 518.70 888.40 632.71
Extraordinary Items 7.90 0.00 0.00 0.00
Net Profit -327.20 518.70 888.40 632.71
Equity capital 475.10 475.10 475.10 475.10
Face value 1.00 1.00 1.00 1.00
EPS -0.69 1.09 1.87 1.33
48 | P a g e
Ratio Analysis
Particulars FY12A FY13A FY14E FY15E
EPS (Rs.) 5.24 2.44 5.11 5.86
EBITDA Margin (%) 6.89% 6.04% 6.34% 6.43%
PBT Margin (%) 4.44% 2.27% 4.20% 4.35%
PAT Margin (%) 3.50% 1.61% 3.02% 3.15%
P/E Ratio (x) 9.46 20.31 9.71 8.47
ROE (%) 21.30% 9.41% 16.54% 15.94%
ROCE (%) 32.29% 31.81% 31.30% 30.17%
Debt Equity Ratio 0.61 0.45 0.42 0.36
EV/EBITDA (x) 6.23 6.66 5.52 4.95
Book Value (Rs.) 24.61 25.78 30.89 36.74
P/BV 2.02 1.92 1.61 1.35
Outlook and Conclusion
At the current market price of Rs.49.60, the stock P/E ratio is estimated 9.71 x FY14E and 8.47 x FY15E
respectively.
Earning per share (EPS) of the company for the earnings for FY14E and FY15E is seen at Rs. 5.11 and Rs. 5.86
respectively.
Net Sales and Operating Profit of the company are expected to grow at a CAGR of 7% and 5% over 2012 to
2015E respectively.
On the basis of EV/EBITDA, the stock trades at 5.52 x for FY14E and 4.95 x for FY15E.
Price to Book Value of the stock is expected to be at 1.61 x and 1.35 x respectively for FY14E and FY15E.
49 | P a g e
ATUL AUTO LTD
Atul Auto Ltd is one of the key three-wheeler manufacturing companies in the country, has its manufacturing
facility at Rajkot in the state of Gujarat. The company has production capacity of 48,000 units. Atul Auto has
defied all market hurdles & is growing consistently. The company launched various variants to its vehicle line,
thus by increasing its market share to over 7% from 2% in FY09. Atul Auto has aggressive expansion plans and
more variants are to be launched, which will boost the company top line, and being debt free strengthens the
bottom-line as well.
The company has 150 exclusive dealers, more than 100 sub-dealers, 14 regional offices and 3 training centres in
16 states of India. Atul Auto Ltd has started exporting its products range in Nigeria, Kenya, Egypt, Tanzania and
some of African countries. Company exports its 3 wheelers in CBU/SKD/CKD conditions, as per the requirement
of Importer.
Financial Highlights
Atul Auto Ltd is one of the key three-wheeler manufacturing companies in the country, has its manufacturing
facility at Rajkot in the state of Gujarat. The company has production capacity of 48,000 units. During the quarter
ended Q2 FY14, Net sales of the company was at Rs. 1090.00 million an increased by 26.82% from Rs. 859.50
millions in Q2 FY13. And net profit of the company was up by 18.84% at Rs. 73.80 million against Rs. 62.10
million in the corresponding quarter of the previous year. In the same quarter EBITDA has increased by 22.06%
at Rs. 120.60 million from Rs. 98.80 million in the corresponding quarter of the previous year. The Three
Wheeler Vehicles sales for quarter ended September 2013 was 9,576 units as compared to 7,578 units for
quarter ended September 2012.
Atul Auto has aggressive expansion plans and more variants are to be launched, which will boost the company
top line, and being debt free strengthens the bottom-line as well. Total sales performance of the company from
April 2013 to November 2013 was 24,398 vehicles as compared to 20,748 vehicles from April 2012 to November
2012, showing growth of 17.59%. The company has reported healthy performance for the second quarter of the
financial year ended September 30, 2013. We expect the company to post a CAGR of 18% and 28% in its top-line
and bottom-line respectively.

50 | P a g e
Results updates- Q2 FY14,
Latest Updates
The Company’s total sales for Three Wheeler Vehicles have increased by 26.82%. The Three Wheeler
Vehicles sales for quarter ended September 2013 was 9,576 units as compared to 7,578 units for quarter
ended September 2012.
During the quarter, the company has declared interim dividend of Rs. 4/- per equity share on face value of Rs.
10/- each for financial year 2013-14.
Total sales from April 2013 to November 2013 were 24,398 vehicles as compared to 20,748 vehicles from
April 2012 to November 2012, showing growth of 17.59%.
Months SEP-13 SEP-12 % Change
Net Sales 1090.00 859.50 26.82
PAT 73.80 62.10 18.84
EPS 6.59 5.54 18.84
EBITDA 120.60 98.80 22.06

51 | P a g e
FINANCIAL HIGHLIGHT (STANDALONE) (A*- Actual, E* -Estimations & Rs. In Millions)
Balance Sheet as at March31,2012-2015E
FY-12A FY-13A FY-14E FY-15E
I EQUITY AND LIABILITES
A) Shareholder's Funds
a) Share Capital 75.47 112.04 112.00 112.00
b) Reserves and Surplus 485.39 630.99 914.73 1239.04
Sub-Total Net worth 560.86 743.03 1026.73 1351.04
B) Non Current Liabilities
a) Deferred Tax Liability (net) 46.59 44.89 49.38 53.33
b) Other Long term liabilities 20.48 25.78 31.66 37.36
c) Long term Provisions 0.61 1.93 6.76 8.44
Sub-Total Non Current liabilities 67.68 72.60 87.79 99.13
C) Current Liabilities
a) Short term borrowings 38.86 0.00 0.00 0.00
b) Trade payables 156.80 237.44 280.18 319.40
c) Other Current liabilities 61.28 48.44 142.90 182.91
d) Short term Provisions 80.79 128.00 149.76 172.22
Sub-Total Current Liabilities 337.73 413.88 572.84 674.54
TOTAL EQUITY AND LIABILITIES (A + B +C)
966.27 1229.51 1687.35 2124.71
II ASSETS
D) Non-Current Assets
a) Fixed Assets
i. Tangible assets 384.18 420.51 538.25 665.78
ii. Intangible assets 15.54 10.15 10.66 11.08
iii. Capital Work in Progress 15.71 50.01 62.01 74.41
b) Non Current Investments 12.30 12.30 12.67 12.92
c) Long Term loans and advances 45.87 38.47 86.56 121.18
Sub-Total Non-Current Assets 473.60 531.44 710.15 885.38
E) Current Assets
a) Inventories 298.25 229.47 252.42 272.61
b) Trade receivables 60.81 71.52 82.96 94.58
c) Cash and Bank Balances 113.73 380.73 581.94 791.44
d) Short-terms loans & advances 19.36 15.60 58.97 79.61
e) Other current assets 0.52 0.75 0.92 1.10
Total Current Assets 492.67 698.07 977.21 1239.33
Total Assets ( D + E ) 966.27 1229.51 1687.35 2124.71
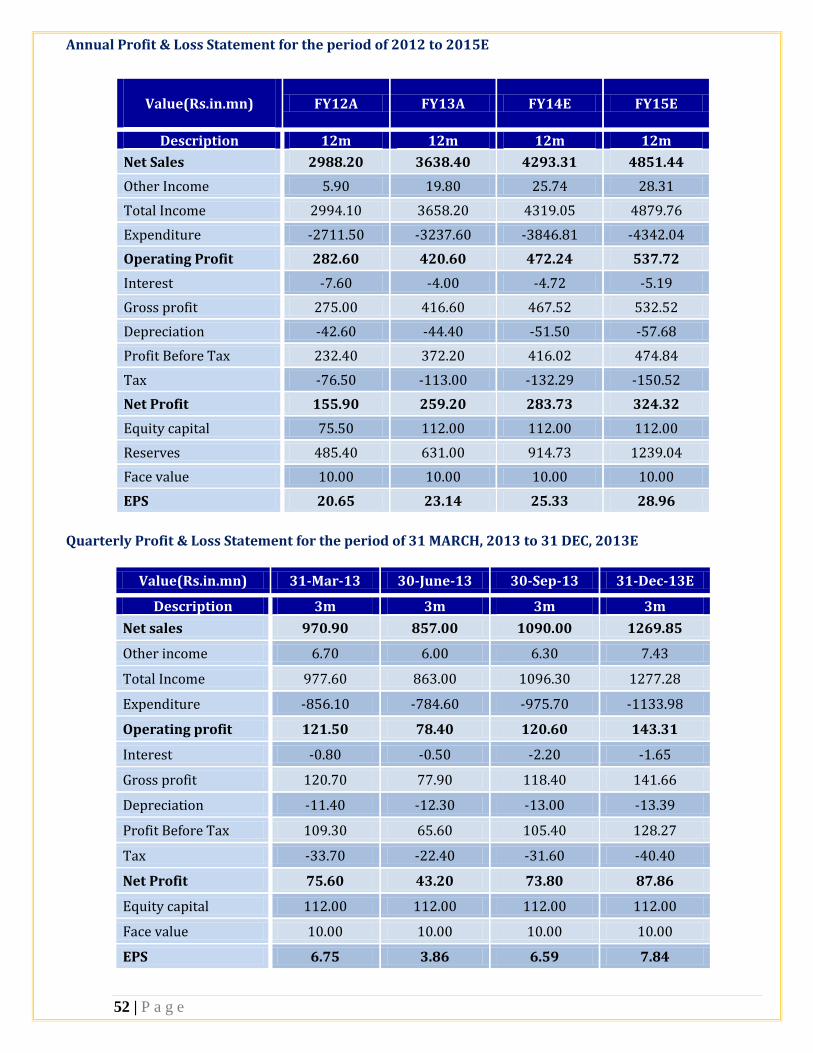
52 | P a g e
Annual Profit & Loss Statement for the period of 2012 to 2015E
Value(Rs.in.mn) FY12A FY13A FY14E FY15E
Description 12m 12m 12m 12m
Net Sales 2988.20 3638.40 4293.31 4851.44
Other Income 5.90 19.80 25.74 28.31
Total Income 2994.10 3658.20 4319.05 4879.76
Expenditure -2711.50 -3237.60 -3846.81 -4342.04
Operating Profit 282.60 420.60 472.24 537.72
Interest -7.60 -4.00 -4.72 -5.19
Gross profit 275.00 416.60 467.52 532.52
Depreciation -42.60 -44.40 -51.50 -57.68
Profit Before Tax 232.40 372.20 416.02 474.84
Tax -76.50 -113.00 -132.29 -150.52
Net Profit 155.90 259.20 283.73 324.32
Equity capital 75.50 112.00 112.00 112.00
Reserves 485.40 631.00 914.73 1239.04
Face value 10.00 10.00 10.00 10.00
EPS 20.65 23.14 25.33 28.96
Quarterly Profit & Loss Statement for the period of 31 MARCH, 2013 to 31 DEC, 2013E
Value(Rs.in.mn) 31-Mar-13 30-June-13 30-Sep-13 31-Dec-13E
Description 3m 3m 3m 3m
Net sales 970.90 857.00 1090.00 1269.85
Other income 6.70 6.00 6.30 7.43
Total Income 977.60 863.00 1096.30 1277.28
Expenditure -856.10 -784.60 -975.70 -1133.98
Operating profit 121.50 78.40 120.60 143.31
Interest -0.80 -0.50 -2.20 -1.65
Gross profit 120.70 77.90 118.40 141.66
Depreciation -11.40 -12.30 -13.00 -13.39
Profit Before Tax 109.30 65.60 105.40 128.27
Tax -33.70 -22.40 -31.60 -40.40
Net Profit 75.60 43.20 73.80 87.86
Equity capital 112.00 112.00 112.00 112.00
Face value 10.00 10.00 10.00 10.00
EPS 6.75 3.86 6.59 7.84
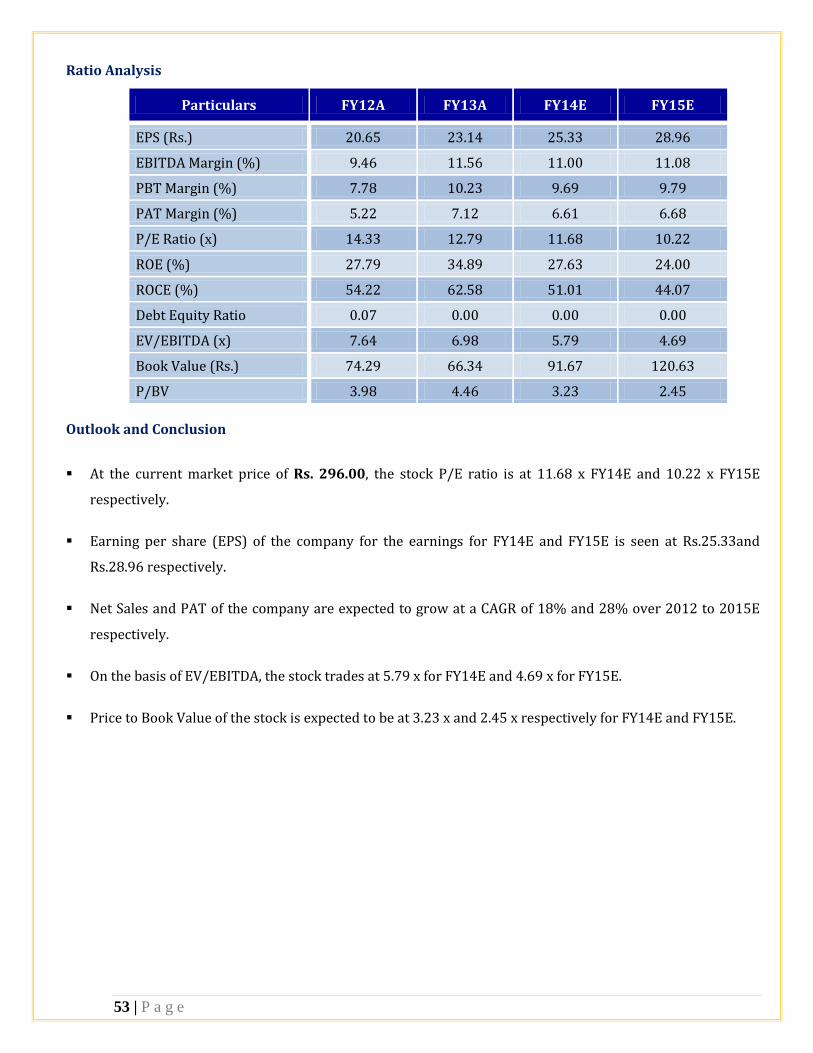
53 | P a g e
Ratio Analysis
Particulars FY12A FY13A FY14E FY15E
EPS (Rs.) 20.65 23.14 25.33 28.96
EBITDA Margin (%) 9.46 11.56 11.00 11.08
PBT Margin (%) 7.78 10.23 9.69 9.79
PAT Margin (%) 5.22 7.12 6.61 6.68
P/E Ratio (x) 14.33 12.79 11.68 10.22
ROE (%) 27.79 34.89 27.63 24.00
ROCE (%) 54.22 62.58 51.01 44.07
Debt Equity Ratio 0.07 0.00 0.00 0.00
EV/EBITDA (x) 7.64 6.98 5.79 4.69
Book Value (Rs.) 74.29 66.34 91.67 120.63
P/BV 3.98 4.46 3.23 2.45
Outlook and Conclusion
At the current market price of Rs. 296.00, the stock P/E ratio is at 11.68 x FY14E and 10.22 x FY15E
respectively.
Earning per share (EPS) of the company for the earnings for FY14E and FY15E is seen at Rs.25.33and
Rs.28.96 respectively.
Net Sales and PAT of the company are expected to grow at a CAGR of 18% and 28% over 2012 to 2015E
respectively.
On the basis of EV/EBITDA, the stock trades at 5.79 x for FY14E and 4.69 x for FY15E.
Price to Book Value of the stock is expected to be at 3.23 x and 2.45 x respectively for FY14E and FY15E.

54 | P a g e
8. Advantages in India
Growing demand
Strong demand growth due to rising incomes, growing middle class, and a young population is likely to
propel India among the world’s top five auto - producers by 2015
Growth in export demand is also set to accelerate
Rising investments
India has significant cost advantages; auto firms save 10-25 per cent on operations in India compared
to Europe and Latin America
A large pool of skilled manpower and a growing technology base will induce greater investments
Policy support
The government aims to develop India as a global manufacturing as well as R&D hub
There has been a wide array of policy support in the form of sops, taxes and FDI encouragement
Innovation opportunities
Tata Nano and the upcoming Pixel have opened up the potentially large ultra low cost car segment
Innovation is likely to intensify among engine technology and alternative fuels
The Government of India plans to introduce fuel-efficiency ratings for automobiles to encourage sale of
cars that consume less petrol or diesel
55 | P a g e
9. Key Developments & Investments
Hero MotoCorp plans to establish 20 manufacturing and assembly facilities to expand its presence across
50 countries by 2020
Nissan Motor India, the Indian unit of Japanese auto maker Nissan Motor Co Ltd, has entered into an
agreement with Ennore Port Ltd (EPL), to export at least 60,000 cars a year through the port for the next
10 years
Mahindra & Mahindra (M&M) plans capital expenditure and investments worth Rs 10,000 crore (US$ 1.63
billion) over the next two years
TVS Motor Co plans to launch two new motorcycle models in the Kenyan market. These motorcycles will be
specific to the Kenyan markets in terms of usability, reliability and durability. Moreover, the firm also plans
to set up a two-wheeler assembly line in Uganda and will also launch two motorcycle models in the African
nation
HMIL has invested US$ 2 billion in two state-of-the-art passenger car manufacturing facilities in India.
Moreso, India contributes 25 per cent of the firm’s global sales
Maruti Suzuki India Ltd (MSIL) is setting up an operational integrated research & development (R&D)
centre in Rohtak, Haryana. The test tracks at the new facility would be longer and considerably enhanced in
technical capabilities than the ones at the Suzuki Motor Corp (SMC) facility in Japan
Tech Mahindra has signed an agreement with Volvo Car Corporation. The IT company will provide Volvo
with a service to maintain and develop a range of applications that can increase efficiency and reduce costs
Isuzu Motors India plans to start contract manufacturing of its sports utility vehicles (SUV) and pick-up
trucks at Hindustan Motors' (HM) Chennai plant from December 2013
Daimler India Commercial Vehicles (DICV) has expanded its network across the country. The company
plans to establish dealership facilities in over 100 identified locations across India by 2014
56 | P a g e
10. Increasing investments by global car manufacturers
Nissan Chennai plant has nearly doubled production to 250,000 cars and the company has completed 80
per cent investment at Oragadam, a car plant near Chennai
Ford India has launched an automatic transmission variant in its petrol model of the sedan Fiesta and the
company has laid foundation for USD1 billion plant at Sanand in March 2012
BMW has increased its output annually for its Chennai plant to 11,000 units from 10,000 units
GM plans to launch series of cars designed at its Bengaluru based centres
Toyota plans to invest another USD163 million at Bidadi plant near Bengaluru and plans to increase
capacity to 310,000 units by 2013 with an investment of USD187 million
Hyundai has launched new version of the i20 premium model in both petrol and diesel variant and plans to
invest USD89.6 million for a diesel engine plant in India which will be operational from 2013
Chevrolet plans to invest USD71 million at its plant in Pune and will be launching five new compact cars
11. Government Initiatives
The Government of India plans to introduce fuel-efficiency ratings for automobiles to encourage sale of cars
that consume less petrol or diesel, according to Union Ministry of Petroleum and Natural Gas, Government of
India.
The Union Budget 2013-14 added some incentives to the industry as follows:
The period of concession available for specified part of electric and hybrid vehicles till April 2013 has been
extended upto March 31, 2015
The basic customs duty (BCD) on imported luxury goods such as high-end motor vehicles, motor cycles,
yachts and similar vessels was increased. The duty was raised from 75 per cent to 100 per cent on cars/
motor vehicles (irrespective of engine capacity) with CIF value more than US$ 40,000; from 60 per cent to
75 per cent on motorcycles with engine capacity of 800 cc or more and on yachts and similar vessels from
10 per cent to 25 per cent
In addition, an increase in excise duty from 27 to 30 per cent has been allowed for SUVs with engine
capacity exceeding 1,500 cc, while excise duty was decreased from 80 to 72 per cent, in case of SUVs
registered solely to be used for taxi purposes
57 | P a g e
An exemption from BCD on lithium ion automotive battery for manufacture of lithium ion battery packs for
supply to manufacturers of hybrid and electric vehicles
The excise duty on chassis of diesel motor vehicles for transport of goods reduced from 14 per cent to 13
per cent
The Government of India allows 100 per cent FDI in the automotive industry through automatic route. The
Government also plans to accelerate the supply of electric vehicles over the next eight years. It is expected that
there will be a demand for 5-7 million electricity-operated vehicles by 2020.
With special focus on exports of small cars, MUVs, two & three wheelers and auto components; the automotive
sector’s contribution to the gross domestic product (GDP) is expected to double reaching a turnover worth US$
145 billion in 2016, according to the Automotive Mission Plan (AMP) 2006-2016.
12. Industry Challenges
The Automobile industry in India is today caught in a vortex of rapid ramp-up of production, sales, lean
manufacturing and cost-cutting initiatives coupled with an unusual restlessness and churn in human assets. It
is passing through a critical phase of increasing complexities and quantum changes. Further, the need to align
with global best practices, while managing strategic priorities and uncertain government policies requires a
realignment of talent matrices.
The Indian automotive industry has bounced back very strongly after the recent economic crisis and has grown
25-30% across segments (passenger cars/ CVs/ two wheelers) in the last two years. Given, very low levels of
vehicle penetration in the country, robust growth of 15–20% is expected to continue for next ~5 years. The
challenges in India are also very different from the ones witnessed globally
Passenger cars: All major players are operating at full capacity due to which there is a growing need for
expansion and operational efficiencies. Global players, haven't been able to break the stronghold of Indian
incumbents and have continued to battle themselves
Commercial vehicles: Market, though dominated currently by Indian players may witness a shift towards
modern technologies which is likely to benefit the global players.
Two wheelers: Next wave of growth is likely to come from rural customers, due to which distribution
channels need to be strengthened
The weakness in the automotive market has taken its toll on the investment drive of many suppliers. While
international suppliers have continued their investments in India, citing the country's long-term growth
58 | P a g e
prospects, local suppliers have almost put their expansion plans on hold until there is a sustained recovery
in vehicles sales.
The Indian automotive industry at the moment is facing multiple challenges such as slowing economic
growth, high inflation and high interest rates – compared with many of its peers
Indian auto industry is expected to be short of 300,000 skilled personnel by 2020 across functions,
including R&D and manufacturing.
With logistics infrastructure lagging behind the pace of the auto industry's expansion, OEMs will need to
consider multi-plant strategies. They will look to cluster suppliers to be closer to regions with strong
demand potential and for better control of the supply chain.
13. Key Opportunities
By 2020, India's population is expected to increase by an estimated 200 million, piling further pressure on
the transport infrastructure. OEMs are therefore, likely to increase their offerings in terms of alternate fuel
variants (CNG, LPG and also hybrids) and advanced safety features across segments.
Global suppliers are setting up R&D centers in India to increase local content in vehicles and at the same
time leverage it as a global hub for design and technology.
India is fast emerging as a global R&D hub
Strong support from the government; setting up of NATRiP centres
Private players like Hyundai, Suzuki, GM are keen to set up their R&D base in India
Strong education base, large skilled English-speaking manpower
Comparative advantage in terms of cost as well
Opportunities for creating sizeable market segments through innovations
The world’s cheapest car (Tata Nano) has directed focus towards the low-income market
Bajaj Auto, Hero Honda and M&M jointly plan to develop a technology for two-wheelers to run on
natural gas
Electric cars are likely to be a sizeable market segment in the coming decade

59 | P a g e
Small-car manufacturing hub
General Motors, Nissan, Toyota have announced plans to make India their hub for new global small
car platforms
Strong export potential in ultra low cost cars segment (to developing and emerging markets)
14. Conclusion
The industrial scenario in general and the auto industry in particular have been going through tough and
troubled times. In fact, in FY2013 [financial year 2013, April 2012 to March 2013], seven out of 12 industry
sub-segments shrank and only 14 of the 32 auto original equipment manufacturers (OEMs) in India posted
volume growth. Today, the Indian auto industry is facing an extremely challenging situation in the form of a
prolonged slowdown. Sales for medium and heavy commercial vehicles have declined for 16 consecutive
months, while passenger car sales have declined for eight consecutive months, including the first quarter of
FY14.
These are very difficult times for the industry, but there is hope in the form of a good monsoon. Further, with
the festive season, we do expect some good news by end of the year. The sector is going to be further effective
with the launch of new policies and amendments to win the customers faith as this behold requires a lump sum
amount to boost this sector in urban and rural areas too. As India is agriculture-based country and the villagers
are paying the huge sum to increase their status and trying to win the heart of urban with new investments in
this sector and other sector.
______________ ____ ______________________________________________________________________ ____ Disclaimer:
This document prepared by our research analysts does not constitute an offer or solicitation for the purchase or
sale of any financial instrument or as an official confirmation of any transaction. The information contained
herein is from publicly available data or other sources believed to be reliable but we do not represent that it is
accurate or complete and it should not be relied on as such. Firstcall India Equity Advisors Pvt. Ltd. or any of it’s
affiliates shall not be in any way responsible for any loss or damage that may arise to any person from any
inadvertent error in the information contained in this report. This document is provide for assistance only and is
not intended to be and must not alone be taken as the basis for an investment decision.
______________________________________________________________________________
First call India Equity Advisors Pvt. Ltd
60
Firstcall India Equity Research: Email – [email protected]
C.V.S.L.Kameswari Pharma
U. Janaki Rao Capital Goods
B.Anil Kumar FMCG, Oil & Gas, Automobile
Ashish Kushwaha IT &Banking
Suhani Adilabadkar Diversified
M. Vinayak Rao Diversified
Firstcall India also provides
Firstcall India Equity Advisors Pvt.Ltd focuses on, IPO’s, QIP’s, F.P.O’s, Takeover
Offers, Offer for Sale and Buy Back Offerings.
Corporate Finance Offerings include Foreign Currency Loan Syndications,
Placement of Equity / Debt with multilateral organizations, Short Term Funds
Management Debt & Equity, Working Capital Limits, Equity & Debt
Syndications and Structured Deals.
Corporate Advisory Offerings include Mergers & Acquisitions(domestic and
cross-border), divestitures, spin-offs, valuation of business, corporate
restructuring-Capital and Debt, Turnkey Corporate Revival – Planning &
Execution, Project Financing, Venture capital, Private Equity and Financial
Joint Ventures
Firstcall India also provides Financial Advisory services with respect to raising
of capital through FCCBs, GDRs, ADRs and listing of the same on International
Stock Exchanges namely AIMs, Luxembourg, Singapore Stock Exchanges and
other international stock exchanges.
For Further Details Contact:
3rd Floor, Sankalp, The Bureau, Dr. R.C.Marg, Chembur, Mumbai 400 071
Tel. : 022-2527 2510/2527 6077/25276089 Telefax : 022-25276089
E-mail: [email protected]
www.firstcallindiaequity.com