Embed Size (px)
Citation preview
Automotive M&A reviewQ4 2018

Contents
Introduction 03
Highlights 04
Intelligence 06
Notable transactions 07
Statistics 08
M&A transactions 09
Equity offerings 10
Automotive trading multiples 11

Welcome to the Q4 2018 edition of Deloitte’s Automotive M&A review, the latest in a series of quarterly updates that provides an overview of relevant news and transaction activity in the Automotive sector.
We hope you enjoy the summary and find it both interesting and informative. If you have any questions, comments or would like to discuss the sector in more detail, please do not hesitate to get in touch.
Deloitte Financial Advisory - Industrials
Introduction
This roundup is an easy to digest summary of information in the public domain – all information contained in this overview has been sourced from publicly available third party sources and has not been checked or verified in any way
03
Automotive M&A review

¹ STOXX 600 Automobiles & Parts regional indices ² Multiples shown above are the median, current year (“CY”) EV/EBITDA multiples for a representative group of companies. Source: FactSet
Global automotive indices mirrored the decline in benchmark indices in Q4 2018, in part reflecting developing positions on international trade. Despite these concerns, there was a significant amount of transaction activity in Q4, including continued investment in new technologies
Highlights
Regional automotive index performance¹
M&A deal volume by region & subsector – Q4 2018
110
105
100
95
90
85
80Oct-18 Nov-18 Dec-18
Europe
Europe
N.America
N.America
OEMs
OEMs
Chassis
Chassis
Powertrain
Powertrain
Aftermarket
AftermarketTires
AsiaPac
AsiaPac
6
6
4
4
2
2
-
-
8
8
10
10
12
Controls
Controls
AutomativeSales
AutomativeSales
Interiors &Exteriors
Interiors &Exteriors
Diversified
Diversified
7.9x
6.9x6.3x
4.7x5.1x
4.0x
8.6x
7.2x
6.0x 5.9x 5.8x
4.8x
6.3x 6.6x
4.8x
6.2x 6.2x5.5x
4.8x5.6x
5.1x
10.4x
11.5x
10.4x10.9x 10.9x
10.2x
The performance of regional indices differed markedly during Q4 with North America outperforming its European and AsiaPac counterparts in November before realigning, to an extent, in December. All indices ended the quarter down, with Europe hardest hit.
Share prices declined by 4% on average across the quarter, with tire manufacturers being the worst performers (down 11%). Of the OEMs, only Tesla (7%) and Jiangling Motors (12%) enjoyed share price gains – the latter assisted by an investment into its EV arm from Renault.
Total announced M&A deal value in the period was $29.4bn, with China being the most active deal geography (12 deals). Controls & Electronics was the most active sub-sector (8 deals). By far the largest transaction was Johnson Controls’ disposal of its battery business for $13.2bn.
The IPOs of Aston Martin and Knorr-Bremse helped raise proceeds of $5.5bn in the quarter.
The table below provides quarter-on-quarter multiple trends for a variety of automotive sub-sectors. Trading multiples in all sub-sectors declined in the quarter, with an average reduction of 0.9x current year EBITDA.
Trading multiples²
CY
EV/E
BITD
A (ti
mes
)
Q218Q318Q418
Note: The multiples are derived from FactSet without adjustment and are dependent on FactSet’s analysis of the constituent companies’ financial performance. In the case of OEMs, FactSet’s approach can lead to artificially high multiples.
04
Automotive M&A review

OEMs
BMW increased its stake in its Chinese joint venture following the relaxation of foreign ownership rules, paying $4.2bn for an additional 25% in BMW Brilliance. A reported intention by Daimler to similarly increase its stake in the JV with BAIC from 49% to 65% was denied. In London, luxury brand Aston Martin successfully executed its IPO, raising proceeds for selling shareholders of $1.4bn. Meanwhile Geely decided to cancel the IPO of Volvo Cars due to volatile market conditions.
Powertrain
GGI launched a tender offer for Mexico-based Rassini, a producer of suspension and brake components. The implied equity value under the offer was $371m. In the US, Cooper-Standard acquired Hutchings Automotive Products for $42m. Hutchings provides products for the powertrain such as oil cooling lines. Knorr-Bremse raised $4bn of proceeds from its IPO in Frankfurt and used $196m to acquire Hitachi Automotive Systems’ commercial vehicle steering business.
Controls & Electronics
Johnson Controls disposed of its Power Solutions business (automotive batteries) to a Brookfield Business Partners-led consortium for $13.2bn, marking Johnson’s exit from the sector. Minebea Mitsumi acquired Japan-based U-Shin for $466m. U-Shin specialises in electronic systems including lock sets and steering column locks. French manufacturer Faurecia acquired Japan-based Clarion from Hitachi for $1.4bn. Private equity specialist EMZ Partners entered talks with Eurazeo to acquire Vignal Lighting for $134m. Vignal manufactures lighting products for commercial vehicles.
Interiors & Exteriors
Continental acquired Cooper-Standard’s anti-vibration business in the US for $266m at a valuation of 0.8x trailing revenue.
Chassis
Tenneco agreed to acquire Öhlins Racing, a Swedish technology company that develops premium suspension systems and components for the automotive and motorsports industries. Consideration of $160m equated to 1.2x trailing revenue.
Automotive Sales
CM Seven Star, a “blank cheque” company acquired Kaixin Auto Group, a Chinese premium used car dealership network for $285m from Renren.
M&A deal value by region & subsector
Aftermarket
Private equity firm Aurelius acquired Hellanor, the second largest Norwegian wholesaler of automotive parts. Terms were not disclosed.
Technology
There continued to be significant investments by OEMs in acquiring new technologies.
Volvo exited its telematics operations with the sale of a 75% stake in WirelessCar to Volkswagen for $121m.
Following BP’s move earlier in 2018, Siemens, Daimler Trucks and others gained exposure to the EV-charging sector through a $240m equity investment in ChargePoint, one of the world’s largest charging station networks. ChargePoint used a portion of the proceeds to acquire Kisensum, a US-based e-mobility software developer.
Artificial intelligence was in focus with Horizon Robotics undertaking a $1bn Series B funding round and WeRide.AI raising $150m from a variety of investors. Both companies specialise in AI for self-driving vehicles.
There were further fundraisings in the ride-hailing and car-sharing space with Southeast Asian operator Grab raising additional funds from investors including Yamaha.
Honda entered GM’s autonomous vehicle platform, Cruise, with a $750m initial investment plus a commitment to invest an additional $2bn over the life of the project. GM is targeting a launch of its ride-share pilot in 2019.
Source: FactSet, MergerMarket
6
4
2
-
8
10
12
14
16
18
OEMs Chassis Powertrain AftermarketControls &Elektronics
AutomativeSales
Interiors &Exteriors
Diversified
Europe N.America AsiaPac
$ bn
05
Automotive M&A review

M&A
In early 2019, Ford and Volkswagen are expected to announce a far-reaching alliance involving multiple global markets and technologies. Key elements of the deal are expected to include a cooperative effort to bring electrified and autonomous vehicles to market.
Osram Licht, the German lighting group and supplier of automotive lighting (such as LED lamps) is reportedly the subject of takeover interest from Bain Capital, Carlyle and others.
Motherson Sumi, an Indian automotive supplier, is in talks to acquire Leoni, the German manufacturer of wire systems, electric power distribution, modular cable harnesses and battery cables.
Alps Alpine Co, the Tokyo-based electronics company, is looking to spend $1.8bn on M&A over the next three years. Areas of focus include Internet of Things, next generation automobile technologies and AI solutions.
Tata Motors, the Indian automotive OEM denied press reports that it is planning to sell its stake in Jaguar Land Rover. Geely Automobile refuted suggestions that it had entered into discussions with Tata.
TomTom is receiving interest from a variety of strategic and private equity parties for its telematics unit. Names mentioned include Verizon, Bridgestone, Michelin and multiple private equity firms. Binding offers are due in early January 2019.
MWI, a Germany company focused on microwave vehicle-ignition technology, is in preliminary talks with strategic acquirers ahead of a Q1 2019 sale process. The company’s technology uses pulsed microwaves to ignite fuel in combustion engines, instead of the more traditional spark plugs or glow plugs.
Ford is closing its Bordeaux-based gearbox producer, Ford Aquitaine Industries, rather than selling to the French government-backed Punch Power Glide. There has been some reports that the French government is considering temporary nationalisation of FAI to help preserve jobs.
Japanese motorcycle OEM, Yamaha is planning investments, including M&A of $1.2bn over the next three years, in line with its new business plan.
Fiat Chrysler is carrying out a strategic review of Comau, its Italian robotics arm. A potential sale process could begin in early 2019.
Fersa Group, a Spanish manufacturer of bearing solutions is seeking manufacturers of bearings for the automotive and industrial sectors. Attractive targets would have revenues of around €30m.
Hella, the automotive lighting, electronics and aftermarket specialist, could make acquisitions from its Aftermarket and Special Applications segments. Favoured targets would broaden its geographic or product profile. The company has around €1bn of funding available.
IPOs
BYD, the Chinese EV and batteries specialist that counts Warren Buffett amongst its investors, is reportedly considering a share listing for its battery business by the end of 2022.
Both Lyft and rival Uber have filed confidential IPO paperwork in the US, putting them on track for an IPO early in 2019.
German automotive supplier Continental has appointed investment banks to advise on the IPO of its powertrain business. On completion of the transaction, scheduled for mid-2019, Continental will focus on acquiring software makers.
Following the ending of a dispute with a key investor, electric vehicle manufacturer Faraday Future is seeking additional capital with a view to an IPO in 2020.
Intelligence
Source: Mergermarket, Bloomberg
06
Automotive M&A review

Transaction Date Description Details
WirelessCarTarget
VolkswagenAcquirer
19-Dec Volkswagen acquired a 75% stake from Volvo in WirelessCar, a Sweden-based telematics services provider. The transaction allows Volvo to focus on its commercial vehicle offering. WirelessCar has 3m active connected cars globally
Value: $121mTrailing EV/Rev: n/dTrailing EV/EBITDA: n/d
GrabTaxiInvestee
YamahaInvestor
13-Dec Yamaha acquired an undisclosed stake in Grab, the Singapore-based company that offers ride-hailing and logistics services. The investment helps expand Yamaha’s presence in South-East Asia. Grab is now operational in eight countries
Investment: $150mImplied value: n/d
Hitachi Automotive SystemsTarget
Knorr-BremseAcquirer
7-Dec Yamaha acquired an undisclosed stake in Grab, the Singapore-based company that offers ride-hailing and logistics services. The investment helps expand Yamaha’s presence in South-East Asia. Grab is now operational in eight countries
Value: $196mTrailing EV/Rev: n/dTrailing EV/EBITDA: n/d
ChargePointInvestee
Multiple partiesInvestor
28-Nov A group of investors, including Siemens and Daimler Trucks has invested $240m in aggregate for an equity stake in ChargePoint, a manufacturer of electric vehicle charging systems
Investment: $240mImplied value: n/d
Horizon RoboticsInvestee
Multiple partiesInvestor
27-Nov Leading Chinese AI chip designer Horizon Robotics is seeking to raise $1bn in its Series B funding round. The company focuses on developing AI chips for self-driving vehicles and has a partnership with Audi for autonomous vehicle development
Investment: $1bnImplied value: $3-4bn
Infineon TechnologiesInvestee
DENSO CorporationInvestor
26-Nov DENSO invested a ‘mid-double-digit million’ € amount in Infineon Technologies, a manufacturer of in-vehicle semiconductor products. DENSO will seek to combine Infineon’s technologies with DENSO’s own product portfolio
Investment: n/dImplied value: n/d
Power Solutions business of Johnson ControlsInvestee
Brookfield Business PartnersInvestor
13-Nov Brookfield Business Partners acquired the Power Solutions business of Johnson Controls for $13.2bn. The business specialises in automotive batteries. The transaction ranks as one of the largest leveraged buyouts since the financial crisis in 2008
Value: $13.2bnTrailing EV/Rev: 1.7xTrailing EV/EBITDA: 7.9x
WeRide.AIInvestee
Multiple partiesInvestor
31-Oct A group of investors led by Alliance Ventures has agreed to acquire an undisclosed stake in WeRide.AI, the China-based company engaged in the development of artificial intelligence driving technology, for a cash consideration of $150m
Investment: $150mImplied value: n/d
Clarion CoTarget
FaureciaAcquirer
26-Oct Faurecia agreed to acquire Clarion for $1.3bn. Clarion, which was 60% owned by Hitachi, specialises in in-vehicle infotainment & audio systems, connected services and advance driver assistance. The acquisition gives Faurecia access to Japanese OEMs such as Honda
Value: $1.4bnTrailing EV/Rev: 0.9xTrailing EV/EBITDA: 9.6x
Magneti MarelliTarget
CK Holdings CoAcquirer
22-Oct KKR-backed Calsonic Kansei agreed to acquire fellow car parts operator Magneti Marelli from FCA. The combined business will have revenues of €15.2bn and become a global top-10 car parts business. FCA also entered into a multi-year supply agreement
Value: $7.1bnTrailing EV/Rev: n/d Trailing EV/EBITDA: n/d
BMW Brilliance AutomotiveTarget
BMW GroupAcquirer
11-Oct Following the removal of foreign ownership caps, BMW increased its stake in its Chinese joint venture from 50% to 75% for a consideration of $4.2bn. The contractual term of the JV with Brilliance was extended from 2028 to 2040
Value: $4.2bnTrailing EV/Rev: n/dTrailing EV/EBITDA: n/d
GM Cruise HoldingsInvestee
HondaInvestor
03-Oct Honda agreed to invest $750m into AV-specialist Cruise. The investment was at a 27% premium to an investment by Softbank Vision Fund just five months earlier. Honda plans to work with Cruise and GM to develop a purpose-built autonomous vehicle and its total commitment to Cruise was stated as $2.8bn
Investment: $750mImplied value: $14.6bn
Notable transactions
Source: FactSet, company announcements
07
Automotive M&A review

Statistics
08
Automotive M&A review

M&
A tr
ansa
ctio
nsD
ate
Targ
etCo
untr
yFo
cus
Acq
uire
r T
V $m
Impl
ied
EV
$mEV
/Rev
EV/
EBIT
DA
31-D
ec-1
8 U
rsus
Bus
S.A
. Po
land
O
EMs
Pg
Ener
gy C
apita
l Man
agem
ent
9.2
9
.2
--
20-D
ec-1
8 S
hang
hai S
achs
Pow
ertr
ain
Com
pone
nts
Syst
ems
Co.,
Ltd.
Ch
ina
Pow
ertr
ain
Hua
yu A
utom
otiv
e Sy
stem
s Co
., Lt
d.
9.4
1
8.9
--
18-D
ec-1
8Ch
ongq
ing
Lifa
n Au
tom
obile
Co.
Ltd
. Ch
ina
OEM
s C
hong
qing
Xin
fan
Mac
hine
ry E
quip
men
t Co.
Ltd
. 9
4.2
94.
2 -
-
18-D
ec-1
8 S
L Li
ghtin
g Co
rp.
Sout
h Ko
rea
Cont
rols
& E
lect
roni
cs
SL
Corp
. 2
47.8
3
72.3
0.
5x-
11-D
ec-1
8 G
alda
x AB
Sw
eden
Af
term
arke
t S
tock
wik
För
valtn
ing
AB
6.1
6
.1
--
7-D
ec-1
8 H
itach
i Aut
omot
ive
Syst
ems
Ltd.
/Ips
Bus
Ja
pan
Cont
rols
& E
lect
roni
cs
Kno
rr-B
rem
se A
G
195
.8
195
.8
--
3-D
ec-1
8 Q
ingd
ao H
uang
hai R
ubbe
r Co.
Ltd
. Ch
ina
Afte
rmar
ket
Gov
ernm
ent o
f Chi
na; Q
ingd
ao Y
ello
w S
ea R
ubbe
r Gro
up C
o. L
td.
56.
0 5
6.0
--
30-N
ov-1
8 H
yund
ai W
ia C
orp.
/Man
ual G
ear T
rans
mis
sion
Op
Sout
h Ko
rea
Pow
ertr
ain
Hyu
ndai
Dym
os, I
nc.
15.
7 1
5.7
--
29-N
ov-1
8 D
on K
yatt
Spa
re P
arts
Qld
Pty
Ltd
. Au
stra
lia
Afte
rmar
ket
Bap
cor L
td.
10.
8 1
0.8
--
22-N
ov-1
8 Z
heng
zhou
Luc
hang
Ele
ctro
nic
Tech
nolo
gy C
o. L
td.
Chin
a D
iver
sifie
d H
enan
Lon
gche
ng G
roup
Co.
Ltd
. 5
9.9
59.
9 -
-
22-N
ov-1
8 A
DM
21 C
o., L
td.
Sout
h Ko
rea
Cont
rols
& E
lect
roni
cs
SM
Che
mic
al C
orp.
1
6.2
16.
2 -
-
19-N
ov-1
8 D
FSK
Mot
or C
o. L
td.
Chin
a O
EMs
Cho
ngqi
ng S
okon
Indu
stry
Gro
up C
o, L
td.
803
.7
1,6
07.4
-
-
15-N
ov-1
8 Ö
hlin
s Ra
cing
AB
Swed
en
Chas
sis
Ten
neco
, Inc
. 1
60.0
1
60.0
1.
2x-
14-N
ov-1
8 P
arts
man
ufac
turin
g as
sets
of H
anw
ha C
orp
Sout
h Ko
rea
Div
ersi
fied
DO
NG
IL IN
DU
STRI
ES C
o. L
td.
32.
7 3
2.7
--
13-N
ov-1
8 P
ower
Sol
utio
ns b
usin
ess
of Jo
hnso
n Co
ntro
ls
Uni
ted
Stat
es
Cont
rols
& E
lect
roni
cs
Bro
okfie
ld B
usin
ess
Part
ners
LP
13,
244.
0 1
3,24
4.0
1.7x
7.9x
13-N
ov-1
8 V
igna
l Lig
htin
g G
roup
SAS
Fr
ance
Co
ntro
ls &
Ele
ctro
nics
E
MZ
Part
ners
SAS
1
33.9
1
33.9
-
-
7-N
ov-1
8 U
-Shi
n Lt
d.
Japa
n Co
ntro
ls &
Ele
ctro
nics
M
ineb
ea M
itsum
i, In
c.
466
.4
466
.4
0.3x
3.8x
6-N
ov-1
8 D
ualm
ools
an C
o. L
td.
Sout
h Ko
rea
Inte
riors
& E
xter
iors
D
UAL
IND
UST
RIAL
Co.
Ltd
. 1
1.1
11.
1 -
-
6-N
ov-1
8 K
aixi
n Au
to G
roup
Ch
ina
Auto
mot
ive
Sale
s C
M S
even
Sta
r Acq
uisi
tion
Corp
. 2
85.0
2
85.0
-
-
5-N
ov-1
8 Z
heng
zhou
Dak
aer C
ar R
enta
l Co.
Ltd
. Ch
ina
Auto
mot
ive
Sale
s C
TC S
ervi
ce C
o. L
td.
37.
6 4
7.0
--
2-N
ov-1
8 C
oope
r-St
anda
rd A
utom
otiv
e In
c. (a
nti-v
ibra
tion)
U
nite
d St
ates
In
terio
rs &
Ext
erio
rs
Con
tinen
tal A
G
266
.0
266
.0
0.8x
-
1-N
ov-1
8 H
utch
ings
Aut
omot
ive
Prod
ucts
LLC
U
nite
d St
ates
Po
wer
trai
n C
oope
r-St
anda
rd H
oldi
ngs,
Inc.
4
1.6
41.
6 -
-
31-O
ct-1
8 R
assi
ni S
AB d
e C
V M
exic
o Po
wer
trai
n G
GI I
NV
SPV
SAPI
de
CV
402
.2
706
.7
--
31-O
ct-1
8 C
oope
rSta
ndar
d Au
tom
otiv
e &
Indu
stria
l, In
c.
Sout
h Ko
rea
Div
ersi
fied
Coo
pers
tand
ard
25.
2 3
1.4
--
30-O
ct-1
8 K
umho
HT,
Inc.
So
uth
Kore
a Co
ntro
ls &
Ele
ctro
nics
F
eelu
x Co
., Lt
d.; L
UM
I MIC
RO C
o., L
td.;
Kum
ho H
T, In
c. /P
riva
te G
roup
3
5.0
134
.0
--
26-O
ct-1
8 C
lario
n Co
., Lt
d.
Japa
n C
ontr
ols
& E
lect
roni
cs
Fau
reci
a SA
1
,358
.1
1,3
58.1
0.
9x9.
6x
25-O
ct-1
8 M
aans
han
Pow
er T
rans
mis
sion
Mac
hine
ry C
o., L
td.
Chi
na
Pow
ertr
ain
Anh
ui T
aier
Hol
ding
Gro
up C
o., L
td.
12.
5 1
2.6
--
22-O
ct-1
8 M
agne
ti M
arel
li Sp
A It
aly
Div
ersi
fied
Koh
lber
g Kr
avis
Rob
erts
& C
o. L
P; C
also
nic
Kans
ei C
orp.
7
,127
.5
7,1
27.5
0.
8x-
Not
es: M
&A
Tran
sact
ions
cap
ture
s ann
ounc
ed (b
ut n
ot n
eces
saril
y co
mpl
eted
) tra
nsac
tions
with
disc
lose
d va
lues
gre
ater
than
$5m
. Tra
nsac
tion
valu
e di
ffers
to Im
plie
d En
terp
rise
Valu
e w
here
100
% c
ontr
ol n
ot a
cqui
red.
TV
= Tr
ansa
ctio
n Va
lue;
EV
= En
terp
rise
Valu
e; R
ev =
Rev
enue
; EV/
Rev
and
EV/E
BITD
A =
hist
oric
al m
ultip
les
Sour
ce: F
actS
et
09
Aut
omot
ive
M&
A re
view
Dat
eTa
rget
Coun
try
Focu
sA
cqui
rer
TV
$mIm
plie
d EV
$m
EV/R
evEV
/EB
ITD
A
22-O
ct-1
8 D
eutz
(Dal
ian)
Eng
ine
Co.,
Ltd.
C
hina
P
ower
trai
n F
aw G
roup
Cor
p.
11.
5 2
3.0
--
11-O
ct-1
8 B
MW
Bril
lianc
e Au
tom
otiv
e Lt
d.
Chi
na
OEM
s B
ayer
isch
e M
otor
en W
erke
AG
4
,191
.1
16,
764.
5 -
-
11-O
ct-1
8 H
unan
Boy
un A
utom
obile
Bra
ke M
ater
ials
Co.
Ltd
. C
hina
P
ower
trai
n P
rovi
nce
of H
unan
; Hun
an X
ingx
iang
Inve
stm
ent H
oldi
ng G
roup
Co.
Ltd
. 9
.6
11.
7 -
-
11-O
ct-1
8 T
ianj
in W
kw A
utom
otiv
e Pa
rts
Co.,
Ltd.
C
hina
In
terio
rs &
Ext
erio
rs
San
hua
Hol
ding
Gro
up C
o., L
td.
21.
9 2
1.9
--
1-O
ct-1
8 R
eago
r Dyk
es A
uto
Co. L
P U
nite
d St
ates
A
utom
otiv
e Sa
les
Kam
kad
Auto
mot
ives
Hol
ding
s LL
C 2
5.3
25.
3 0.
0x-
M&
A tr
ansa
ctio
ns (c
ont.)
Not
es: M
&A
Tran
sact
ions
cap
ture
s ann
ounc
ed (b
ut n
ot n
eces
saril
y co
mpl
eted
) tra
nsac
tions
with
disc
lose
d va
lues
gre
ater
than
$5m
. Tra
nsac
tion
valu
e di
ffers
to Im
plie
d En
terp
rise
Valu
e w
here
100
% c
ontr
ol n
ot a
cqui
red.
TV
= Tr
ansa
ctio
n Va
lue;
EV
= En
terp
rise
Valu
e; R
ev =
Rev
enue
; EV/
Rev
and
EV/E
BITD
A =
hist
oric
al m
ultip
les
Equi
ty o
fferin
gs c
aptu
res o
fferin
gs w
ith g
ross
pro
ceed
s gre
ater
than
$10
m
Sour
ce: F
actS
et
Off
er D
ate
Com
pany
Coun
try
Des
crip
tion
Stoc
k Ex
chan
geO
ffer
Typ
ePr
ocee
ds
($m
)
5-D
ec-1
8Sh
angh
ai S
inot
ec C
o., L
td.
Chin
a Au
to p
arts
Sh
angh
ai
IPO
7
7.3
10-O
ct-1
8Kn
orr-
Brem
se A
G
Ger
man
y Br
akin
g sy
stem
s Fr
ankf
urt
IPO
3
,986
.7
3-O
ct-1
8As
ton
Mar
tin L
agon
da G
loba
l Hol
ding
s Pl
c U
nite
d Ki
ngdo
m
Auto
mot
ive
OEM
Lo
ndon
Sto
ck E
xcha
nge
IPO
1
,415
.3
Equi
ty o
fferin
gs
10
Aut
omot
ive
M&
A re
view
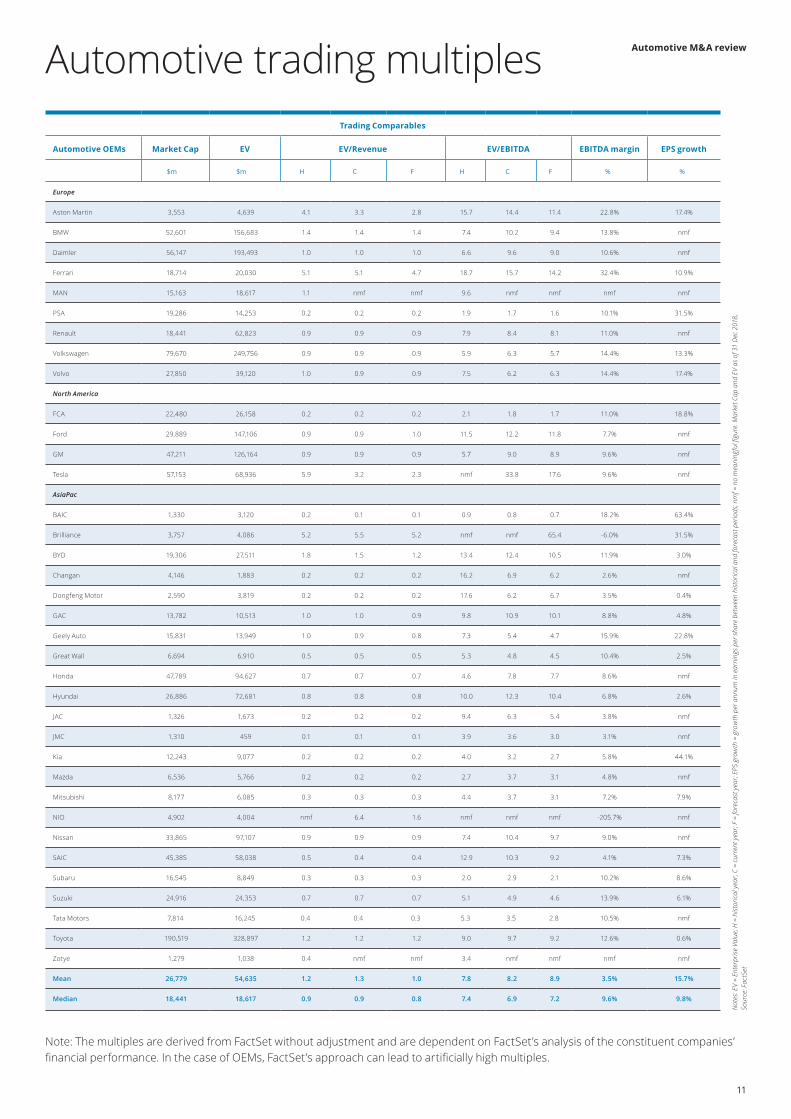
Trading Comparables
Automotive OEMs Market Cap EV EV/Revenue EV/EBITDA EBITDA margin EPS growth
$m $m H C F H C F % %
Europe
Aston Martin 3,553 4,639 4.1 3.3 2.8 15.7 14.4 11.4 22.8% 17.4%
BMW 52,601 156,683 1.4 1.4 1.4 7.4 10.2 9.4 13.8% nmf
Daimler 56,147 193,493 1.0 1.0 1.0 6.6 9.6 9.0 10.6% nmf
Ferrari 18,714 20,030 5.1 5.1 4.7 18.7 15.7 14.2 32.4% 10.9%
MAN 15,163 18,617 1.1 nmf nmf 9.6 nmf nmf nmf nmf
PSA 19,286 14,253 0.2 0.2 0.2 1.9 1.7 1.6 10.1% 31.5%
Renault 18,441 62,823 0.9 0.9 0.9 7.9 8.4 8.1 11.0% nmf
Volkswagen 79,670 249,756 0.9 0.9 0.9 5.9 6.3 5.7 14.4% 13.3%
Volvo 27,850 39,120 1.0 0.9 0.9 7.5 6.2 6.3 14.4% 17.4%
North America
FCA 22,480 26,158 0.2 0.2 0.2 2.1 1.8 1.7 11.0% 18.8%
Ford 29,889 147,106 0.9 0.9 1.0 11.5 12.2 11.8 7.7% nmf
GM 47,211 126,164 0.9 0.9 0.9 5.7 9.0 8.9 9.6% nmf
Tesla 57,153 68,936 5.9 3.2 2.3 nmf 33.8 17.6 9.6% nmf
AsiaPac
BAIC 1,330 3,120 0.2 0.1 0.1 0.9 0.8 0.7 18.2% 63.4%
Brilliance 3,757 4,086 5.2 5.5 5.2 nmf nmf 65.4 -6.0% 31.5%
BYD 19,306 27,511 1.8 1.5 1.2 13.4 12.4 10.5 11.9% 3.0%
Changan 4,146 1,883 0.2 0.2 0.2 16.2 6.9 6.2 2.6% nmf
Dongfeng Motor 2,590 3,819 0.2 0.2 0.2 17.6 6.2 6.7 3.5% 0.4%
GAC 13,782 10,513 1.0 1.0 0.9 9.8 10.9 10.1 8.8% 4.8%
Geely Auto 15,831 13,949 1.0 0.9 0.8 7.3 5.4 4.7 15.9% 22.8%
Great Wall 6,694 6,910 0.5 0.5 0.5 5.3 4.8 4.5 10.4% 2.5%
Honda 47,789 94,627 0.7 0.7 0.7 4.6 7.8 7.7 8.6% nmf
Hyundai 26,886 72,681 0.8 0.8 0.8 10.0 12.3 10.4 6.8% 2.6%
JAC 1,326 1,673 0.2 0.2 0.2 9.4 6.3 5.4 3.8% nmf
JMC 1,310 459 0.1 0.1 0.1 3.9 3.6 3.0 3.1% nmf
Kia 12,243 9,077 0.2 0.2 0.2 4.0 3.2 2.7 5.8% 44.1%
Mazda 6,536 5,766 0.2 0.2 0.2 2.7 3.7 3.1 4.8% nmf
Mitsubishi 8,177 6,085 0.3 0.3 0.3 4.4 3.7 3.1 7.2% 7.9%
NIO 4,902 4,004 nmf 6.4 1.6 nmf nmf nmf -205.7% nmf
Nissan 33,865 97,107 0.9 0.9 0.9 7.4 10.4 9.7 9.0% nmf
SAIC 45,385 58,038 0.5 0.4 0.4 12.9 10.3 9.2 4.1% 7.3%
Subaru 16,545 8,849 0.3 0.3 0.3 2.0 2.9 2.1 10.2% 8.6%
Suzuki 24,916 24,353 0.7 0.7 0.7 5.1 4.9 4.6 13.9% 6.1%
Tata Motors 7,814 16,245 0.4 0.4 0.3 5.3 3.5 2.8 10.5% nmf
Toyota 190,519 328,897 1.2 1.2 1.2 9.0 9.7 9.2 12.6% 0.6%
Zotye 1,279 1,038 0.4 nmf nmf 3.4 nmf nmf nmf nmf
Mean 26,779 54,635 1.2 1.3 1.0 7.8 8.2 8.9 3.5% 15.7%
Median 18,441 18,617 0.9 0.9 0.8 7.4 6.9 7.2 9.6% 9.8%
Automotive trading multiples
Not
es: E
V =
Ente
rpris
e Va
lue;
H =
his
toric
al y
ear;
C =
curr
ent y
ear;
F =
fore
cast
yea
r; EP
S gr
owth
= g
row
th p
er a
nnum
in e
arni
ngs p
er s
hare
bet
wee
n hi
stor
ical
and
fore
cast
per
iods
; nm
f = n
o m
eani
ngfu
l figu
re. M
arke
t Cap
and
EV
as o
f 31
Dec
201
8,
Sour
ce: F
actS
et
Note: The multiples are derived from FactSet without adjustment and are dependent on FactSet’s analysis of the constituent companies’ financial performance. In the case of OEMs, FactSet’s approach can lead to artificially high multiples.
11
Automotive M&A review

Trading Comparables
Automotive Suppliers Market Cap EV EV/Revenue EV/EBITDA EBITDA margin EPS growth
Controls & Electronics $m $m H C F H C F % %
Amara Raja 1,817 1,814 2.1 1.8 1.6 14.3 12.9 10.6 13.9% 15.6%
Aptiv 16,222 19,742 1.5 1.4 1.3 9.6 8.3 7.7 16.7% 4.8%
Autoliv 6,120 7,848 0.8 0.9 0.8 6.0 6.0 5.6 14.8% 27.8%
Autoneum Holding 699 1,068 0.5 0.5 0.5 3.7 5.0 4.6 9.4% nmf
CUB Elecparts 901 926 8.1 7.0 5.9 19.0 19.5 15.9 35.8% 14.0%
Exide Industries 3,251 3,059 1.7 2.0 1.7 7.7 14.5 12.3 13.6% 19.1%
Gentex 5,297 4,960 2.8 2.7 2.5 8.0 7.9 7.7 33.7% 11.8%
Hanon Systems 5,167 5,620 1.1 1.1 0.9 9.4 9.4 7.4 11.3% 12.2%
Hella 4,420 5,248 0.6 0.6 0.6 4.8 3.9 4.3 16.4% 5.7%
Gentherm 1,395 1,448 1.5 1.4 1.3 10.4 9.9 8.6 13.9% 62.8%
Hu Lane 260 273 2.1 2.0 1.9 5.9 8.8 8.2 22.9% nmf
Iron Force 192 162 1.2 1.2 1.1 6.1 4.3 4.3 27.2% nmf
Koito 8,324 6,536 0.8 0.9 0.8 5.2 5.2 4.5 16.6% nmf
Kongsberg Automotive 395 652 0.6 0.5 0.4 8.5 5.1 4.2 9.7% nmf
Leoni 1,131 2,001 0.4 0.3 0.3 5.3 5.0 4.7 6.8% nmf
Melexis 2,351 2,325 4.0 3.6 3.4 12.5 11.5 10.9 31.0% 4.1%
Motherson Sumi 7,542 9,585 1.2 1.0 0.9 13.2 10.9 8.8 9.4% 33.9%
NOK 2,424 2,808 0.4 0.4 0.4 3.5 3.8 3.4 11.8% nmf
Stanley Electric 4,934 4,182 1.0 1.0 1.0 5.2 5.0 4.5 20.4% 11.0%
Stoneridge 702 746 0.9 0.9 0.8 7.8 7.0 6.6 12.3% 16.8%
Sumitomo 10,580 15,882 0.6 0.6 0.5 5.6 5.3 5.0 10.5% 5.1%
Sumitomo Riko 864 1,640 0.4 0.4 0.4 4.4 4.4 4.1 8.6% 35.7%
Tenneco 1,564 2,986 0.3 0.3 0.2 4.1 2.8 1.6 9.1% 35.6%
Tokai Rika 1,567 1,139 0.3 0.2 0.2 2.4 2.3 2.2 10.7% 5.0%
Tung Thih Electronic 166 192 0.8 0.8 0.8 7.5 31.4 13.3 2.5% nmf
Mean 3,531 4,114 1.4 1.3 1.2 7.6 8.4 6.8 15.6% 18.9%
Median 1,817 2,325 0.9 0.9 0.8 6.1 6.0 5.6 13.6% 14.0%
Trading Comparables
Automotive Suppliers Market Cap EV EV/Revenue EV/EBITDA EBITDA margin EPS growth
Chassis $m $m H C F H C F % %
Aisin Seiki 10,260 16,207 0.5 0.4 0.4 3.9 3.8 3.5 11.8% 2.1%
American Axle 1,240 4,693 0.7 0.7 0.7 4.5 4.0 4.0 16.6% nmf
Dana 1,972 3,636 0.5 0.5 0.4 4.7 3.8 3.4 11.9% 113.2%
Georg Fischer 3,272 3,807 0.9 0.8 0.9 7.3 6.8 6.8 11.8% 7.7%
Gestamp 3,270 6,316 0.7 0.6 0.6 6.7 5.7 5.1 11.3% 14.7%
JOST Werke 450 578 0.7 0.7 0.7 5.7 5.4 5.1 12.5% nmf
Iochpe Maxion 925 1,637 0.9 0.7 0.6 7.1 5.9 5.3 11.5% 543.2%
NHK Spring 2,147 1,945 0.3 0.3 0.3 3.6 3.6 3.4 8.4% 8.9%
NSK 4,768 5,595 0.6 0.6 0.6 4.4 4.4 4.5 13.8% nmf
Showa 897 668 0.2 0.3 0.2 2.0 1.9 1.7 13.7% 15.7%
Unipres 813 785 0.3 0.3 0.3 1.9 2.0 1.9 13.1% 0.8%
Mean 2,728 4,170 0.6 0.5 0.5 4.7 4.3 4.1 12.4% 88.3%
Median 1,972 3,636 0.6 0.6 0.6 4.5 4.0 4.0 11.9% 11.8%
Notes: EV = Enterprise Value; H = historical year; C = current year; F = forecast year; EPS growth = growth per annum in earnings per share between historical and forecast periods; nmf = no meaningful figure. Market Cap and EV as of 31 Dec 2018Source: FactSet
12
Automotive M&A review

Trading Comparables
Automotive Suppliers Market Cap EV EV/Revenue EV/EBITDA EBITDA
margin
EPS growth
Diversified $m $m H C F H C F % %
CIE 3,162 4,905 1.1 1.4 1.3 6.8 8.0 7.3 17.3% 11.7%
Continental 27,608 31,672 0.6 0.6 0.6 4.3 4.5 4.1 13.9% nmf
Denso 35,140 35,469 0.8 0.7 0.7 5.6 5.6 5.3 12.7% 2.6%
Global PMX 291 357 2.7 2.5 2.2 9.6 9.3 8.2 26.5% 2.9%
Hyundai Mobis 16,576 10,440 0.3 0.3 0.3 4.3 4.2 3.8 7.9% 24.0%
Johnson Controls 27,398 39,481 1.3 1.4 1.4 9.1 9.7 10.0 14.8% 8.4%
Magna 15,155 19,273 0.5 0.5 0.5 4.7 4.4 4.5 10.8% 11.6%
Martinrea 682 1,159 0.4 0.4 0.4 3.9 3.4 3.2 12.5% 16.4%
Modine 548 999 0.5 0.4 0.4 5.2 4.8 4.3 9.2% 105.7%
Ningbo Joyson 3,230 5,572 1.4 0.7 0.6 15.5 9.7 7.5 7.3% 84.9%
Progress-Werk 88 245 0.5 0.4 0.4 3.9 4.9 4.4 9.0% 7.4%
S&T Motiv 355 285 0.3 0.3 0.3 2.5 3.5 3.1 8.5% 4.9%
SKF 6,903 9,087 1.0 0.9 0.9 7.2 6.4 6.5 14.8% 8.3%
Sogefi 196 556 0.3 0.3 0.3 2.6 2.4 2.3 12.1% 21.6%
Toyoda Gosei 2,577 2,875 0.4 0.4 0.4 3.7 4.5 3.8 8.5% 22.8%
Valeo 7,006 10,628 0.5 0.5 0.5 4.9 4.1 3.7 11.7% nmf
Visteon 1,743 1,796 0.6 0.6 0.6 4.8 5.5 5.6 10.9% 8.6%
Mean 8,744 10,282 0.8 0.7 0.7 5.8 5.6 5.2 12.3% 22.8%
Median 3,162 4,905 0.5 0.5 0.5 4.8 4.8 4.4 11.7% 11.6%
Notes: EV = Enterprise Value; H = historical year; C = current year; F = forecast year; EPS growth = growth per annum in earnings per share between historical and forecast periods; nmf = no meaningful figure. Market Cap and EV as of 31 Dec 2018Source: FactSet
Trading Comparables
Automotive Suppliers Market Cap EV EV/Revenue EV/EBITDA EBITDA
margin
EPS growth
Tires $m $m H C F H C F % %
Bridgestone 29,402 28,967 0.9 0.9 0.8 5.1 5.1 4.9 16.9% 4.1%
Cooper 1,619 1,781 0.6 0.6 0.6 4.0 5.2 4.8 12.1% 22.3%
Goodyear 4,756 10,514 0.7 0.7 0.7 4.8 5.1 4.8 13.1% 48.2%
Hankook 4,457 5,641 0.9 0.9 0.9 4.7 4.8 4.5 19.0% 5.7%
Michelin 17,815 22,701 0.9 0.9 0.9 4.8 4.9 4.4 18.8% 7.5%
Nokian 4,233 4,263 2.4 2.3 2.2 8.1 7.9 7.6 29.1% 15.6%
Pirelli 6,413 11,301 1.8 1.9 1.8 15.8 8.1 7.2 23.2% 70.5%
Mean 9,814 12,167 1.2 1.2 1.1 6.8 5.9 5.5 18.9% 24.8%
Median 4,756 10,514 0.9 0.9 0.9 4.8 5.1 4.8 18.8% 15.6%
13
Automotive M&A review

Trading Comparables
Automotive Suppliers Market Cap EV EV/Revenue EV/EBITDA EBITDA
margin
EPS growth
Interiors & Exteriors $m $m H C F H C F % %
Adient 1,407 4,522 0.3 0.3 0.3 6.6 4.3 3.8 6.1% nmf
Faurecia 5,218 6,190 0.3 0.3 0.3 3.3 2.6 2.4 11.5% 14.2%
Fuyao Glass 8,264 8,390 3.1 2.8 2.5 10.7 9.1 8.5 30.5% 15.2%
Grammer 543 736 0.4 0.3 0.3 5.8 6.0 4.1 5.8% 34.5%
Huayu Automotive 8,449 7,353 0.4 0.3 0.3 5.5 4.8 4.5 6.7% 8.0%
Lear 7,884 8,942 0.4 0.4 0.4 4.2 4.0 4.0 10.6% 0.2%
Macauto 193 201 1.1 1.0 1.0 6.1 7.4 6.6 14.0% nmf
Minth 3,694 3,610 2.2 1.9 1.7 9.6 8.0 6.8 24.2% 8.5%
Nifco 2,548 2,538 1.0 1.0 0.9 6.1 6.0 5.6 16.3% 3.9%
Nihon Flush 200 173 0.9 nmf nmf 5.4 nmf nmf nmf nmf
Ningbo Jifeng 713 649 2.4 1.9 1.6 11.2 10.1 8.7 19.1% 13.7%
Plastic Omnium 3,426 4,825 0.6 0.6 0.5 4.8 4.7 4.2 12.2% 0.3%
Polytec 214 344 0.4 0.5 0.4 3.2 4.4 3.9 10.4% nmf
Stabilus 1,549 1,748 1.6 1.5 1.4 8.2 7.5 7.1 19.8% 3.8%
Toyota Boshoku 2,807 2,429 0.2 0.2 0.2 2.5 2.6 2.4 7.1% nmf
TS Tech 1,872 989 0.2 0.2 0.2 1.9 2.0 1.9 12.3% nmf
Mean 3,061 3,352 1.0 0.9 0.8 5.9 5.6 5.0 13.8% 10.2%
Median 2,210 2,484 0.5 0.5 0.4 5.7 4.8 4.2 12.2% 8.3%
Notes: EV = Enterprise Value; H = historical year; C = current year; F = forecast year; EPS growth = growth per annum in earnings per share between historical and forecast periods; nmf = no meaningful figure. Market Cap and EV as of 31 Dec 2018Source: FactSet
14
Automotive M&A review

Trading Comparables
Automotive Suppliers Market Cap EV EV/Revenue EV/EBITDA EBITDA
margin
EPS growth
Powertrain $m $m H C F H C F % %
BorgWarner 7,235 9,114 0.9 0.9 0.8 5.6 5.2 5.0 16.6% 49.1%
Brembo 3,395 3,708 1.3 1.2 1.2 7.2 6.5 6.1 19.0% 2.4%
Cummins 21,457 23,384 1.1 1.0 1.0 9.3 6.5 6.1 15.1% 60.7%
Delphi 1,267 2,624 0.5 0.5 0.5 3.5 3.5 3.9 15.3% 2.6%
ElringKlinger 493 1,380 0.7 0.7 0.7 5.6 5.8 5.4 12.3% nmf
Exedy 1,192 1,307 0.5 0.5 0.5 3.5 3.3 3.1 14.5% 9.9%
Garrett Motion 913 2,419 0.8 0.7 0.7 4.2 4.2 4.1 17.2% nmf
Haldex 344 377 0.7 0.6 0.6 8.3 6.5 5.9 10.0% 88.0%
Hota Industrial 1,000 1,195 5.5 5.0 4.4 19.9 19.1 16.2 26.2% 11.4%
JTEKT 3,836 5,397 0.4 0.4 0.4 4.2 4.2 4.0 9.6% 4.9%
Keihin 1,243 1,048 0.3 0.3 0.3 2.5 2.6 2.4 12.3% nmf
Knorr Bremse 14,488 15,379 2.2 2.0 1.9 14.0 11.1 10.3 18.2% 3.0%
Linamar 2,167 3,765 0.8 0.7 0.6 4.8 4.3 4.0 15.3% 7.2%
Mando 1,218 2,607 0.5 0.5 0.5 8.8 5.9 5.4 8.5% 458.6%
Musashi 913 1,600 0.7 0.7 0.7 5.1 4.9 4.5 14.6% 9.7%
Nexteer 3,572 3,416 0.9 0.8 0.8 5.5 5.2 4.9 16.2% 5.9%
SAF-HOLLAND 581 904 0.7 0.6 0.6 7.4 7.4 6.2 8.2% 24.2%
Schaeffler 1,415 4,609 0.3 0.3 0.3 1.7 1.8 1.7 15.7% 1.1%
SHW 145 170 0.4 0.3 0.3 3.8 4.2 3.6 8.2% nmf
Toyota Industries 15,117 23,130 1.3 1.2 1.1 8.6 10.1 9.6 11.6% nmf
WABCO 5,600 5,849 1.8 1.5 1.5 11.0 8.9 8.6 16.9% 4.2%
Weifu High-Tech 2,451 2,226 1.7 1.7 1.7 12.2 13.4 7.1 12.5% nmf
Mean 4,093 5,255 1.1 1.0 1.0 7.1 6.6 5.8 14.3% 46.4%
Median 1,341 2,616 0.8 0.7 0.7 5.6 5.5 5.2 14.8% 8.4%
Notes: EV = Enterprise Value; H = historical year; C = current year; F = forecast year; EPS growth = growth per annum in earnings per share between historical and forecast periods; nmf = no meaningful figure. Market Cap and EV as of 31 Dec 2018Source: FactSet
15
Automotive M&A review

Trading Comparables
Automotive Aftermarket Market Cap EV EV/Revenue EV/EBITDA EBITDA
margin
EPS growth
$m $m H C F H C F % %
D'Ieteren 2,081 1,333 0.3 0.3 0.3 10.0 7.8 8.1 4.4% 17.7%
Dorman 2,975 2,922 3.2 3.0 2.8 14.7 14.4 13.4 21.1% 21.8%
Fox Factory 2,236 2,278 4.8 3.7 3.3 28.7 18.2 16.2 20.3% 48.8%
Genuine Parts 14,092 16,699 1.0 0.9 0.9 14.1 11.6 10.8 7.7% 19.4%
Halfords 647 741 0.5 0.5 0.5 5.2 5.3 5.2 9.4% 1.8%
Horizon Global 36 361 0.4 0.4 0.4 5.9 8.0 6.7 5.2% nmf
LKQ 7,551 11,635 1.2 1.0 0.9 10.6 9.2 8.2 10.6% 20.3%
Motorcar Parts 315 375 0.9 0.8 0.7 7.3 4.7 4.0 17.0% 69.7%
Standard Motor 1,086 1,110 1.0 1.0 1.0 8.7 11.6 9.4 8.7% 43.1%
Thule 1,887 2,064 3.1 2.8 2.6 16.1 14.7 13.1 19.3% 18.7%
Mean 3,291 3,952 1.6 1.4 1.3 12.1 10.5 9.5 12.4% 29.0%
Median 1,984 1,699 1.0 0.9 0.9 10.3 10.4 8.8 10.0% 20.3%
Trading Comparables
Automotive Sales Market Cap EV EV/Revenue EV/EBITDA EBITDA
margin
EPS growth
$m $m H C F H C F % %
AutoNation 3,210 9,328 0.4 0.4 0.4 10.1 10.3 10.2 4.2% 1.8%
BCA 2,198 2,692 0.9 0.8 0.7 13.2 12.3 11.3 6.2% 37.6%
CarMax 10,776 24,193 1.4 1.3 1.2 32.1 17.8 16.8 7.4% 18.7%
Carvana 1,271 1,806 2.1 0.9 0.5 nmf nmf nmf -9.5% nmf
Group 1 1,011 3,838 0.3 0.3 0.3 8.9 10.1 10.2 3.3% nmf
Inchcape 2,916 3,124 0.3 0.3 0.3 5.5 5.7 5.8 4.7% nmf
Lithia 1,720 4,965 0.5 0.4 0.4 10.3 10.6 10.3 3.9% 3.3%
Lookers 458 530 0.1 0.1 0.1 4.3 3.9 3.9 2.3% 6.3%
Pendragon 401 542 0.1 0.1 0.1 3.0 3.5 3.4 2.7% nmf
Penske 3,422 9,027 0.4 0.4 0.4 12.8 11.3 11.3 3.5% nmf
Sonic 423 2,813 0.3 0.3 0.3 9.1 10.2 9.7 2.8% nmf
Vertu 169 180 0.1 0.0 0.0 3.6 3.9 3.5 1.3% nmf
Mean 2,331 5,253 0.6 0.4 0.4 10.2 9.1 8.8 2.7% 13.5%
Median 1,495 2,968 0.4 0.4 0.4 9.1 10.2 10.2 3.4% 6.3%
Notes: EV = Enterprise Value; H = historical year; C = current year; F = forecast year; EPS growth = growth per annum in earnings per share between historical and forecast periods; nmf = no meaningful figure. Market Cap and EV as of 31 Dec 2018Source: FactSet
16
Automotive M&A review

• M&A Advisory
• Debt Advisory
• Equity Capital Markets
• Special Situations
• Valuations
• Modelling
• Economic Consulting
• Due Diligence
Deloitte Financial AdvisoryDeloitte Financial Advisory is a leading financial advisory practice providing a range of services to its clients:
For more information, please contact:
Mark Adams
Partner+44 (0) 20 7007 [email protected]
David Smith
Director+44 (0) 20 7007 [email protected]
Tom Frankum
Partner+44 (0)20 7303 [email protected]
17
Automotive M&A review

Notes
18
Automotive M&A review

Notes
19
Automotive M&A review

Important notice
Deloitte LLP is the United Kingdom affiliate of Deloitte NWE LLP, a member firm of Deloitte Touche Tohmatsu Limited, a UK private company limited by guarantee (“DTTL”). DTTL and each of its member firms are legally separate and independent entities. DTTL and Deloitte NWE LLP do not provide services to clients. Please see www.deloitte.co.uk/about to learn more about our global network of member firms.
This publication has been written in general terms and therefore cannot be relied on to cover specific situations; application of the principles set out will depend upon the particular circumstances involved and we recommend that you obtain professional advice before acting or refraining from acting on any of the contents of this publication. Deloitte LLP would be pleased to advise readers on how to apply the principles set out in this publication to their specific circumstances. Deloitte LLP accepts no duty of care or liability for any loss occasioned to any person acting or refraining from action as a result of any material in this publication.
© 2019 Deloitte LLP. All rights reserved.
Deloitte LLP is a limited liability partnership registered in England and Wales with registered number OC303675 and its registered office at 1 New Street Square, London EC4A 3HQ, United Kingdom.
Designed and produced by The CoRe Creative Services, Rzeszow. 218052