Embed Size (px)
Citation preview
Autonomous Ground-Based Tracking of Migrating
Raptors using Vision
Sana Sarfraz∗
Jack W. Langelaan†
The Pennsylvania State University, University Park, PA 16802, USA
The following paper presents the design and simulation of a system of ground-basedstereo cameras to enable the autonomous tracking of migratory raptors in order to facilitatethe study of their flight patterns. A number of stations consisting of a camera pair and aprocessor are set up along the ridge under observation. Each station computes an estimateof the position and velocity of the birds viewed by its cameras using an Unscented KalmanFilter. The estimates from each station are transmitted to a master computer that fusesall the independent estimates and transmits the resulting estimate back to all the stations.Results of Monte Carlo simulations show the convergence of the estimated error to thetrue error for estimates from one or more stations.
I. Introduction
Migration places extreme demands on birds asthey travel long distances.1 The ability to conserve
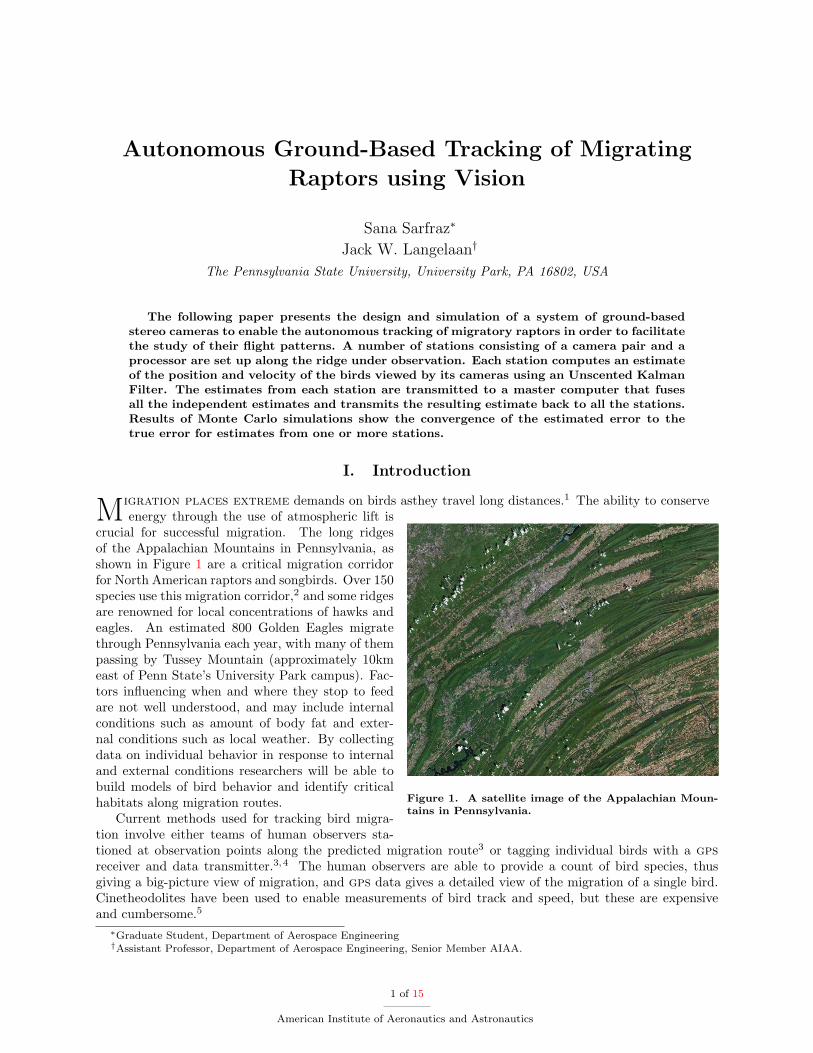
Figure 1. A satellite image of the Appalachian Moun-tains in Pennsylvania.
energy through the use of atmospheric lift iscrucial for successful migration. The long ridgesof the Appalachian Mountains in Pennsylvania, asshown in Figure 1 are a critical migration corridorfor North American raptors and songbirds. Over 150species use this migration corridor,2 and some ridgesare renowned for local concentrations of hawks andeagles. An estimated 800 Golden Eagles migratethrough Pennsylvania each year, with many of thempassing by Tussey Mountain (approximately 10kmeast of Penn State’s University Park campus). Fac-tors influencing when and where they stop to feedare not well understood, and may include internalconditions such as amount of body fat and exter-nal conditions such as local weather. By collectingdata on individual behavior in response to internaland external conditions researchers will be able tobuild models of bird behavior and identify criticalhabitats along migration routes.
Current methods used for tracking bird migra-tion involve either teams of human observers sta-tioned at observation points along the predicted migration route3 or tagging individual birds with a gpsreceiver and data transmitter.3,4 The human observers are able to provide a count of bird species, thusgiving a big-picture view of migration, and gps data gives a detailed view of the migration of a single bird.Cinetheodolites have been used to enable measurements of bird track and speed, but these are expensiveand cumbersome.5
∗Graduate Student, Department of Aerospace Engineering†Assistant Professor, Department of Aerospace Engineering, Senior Member AIAA.
1 of 15
American Institute of Aeronautics and Astronautics
This paper describes a vision-based system for autonomously tracking birds as they fly past an observationsite along the migratory route. In addition to migration studies, such a system can be used to examine changesin flight patterns caused by obstructions such as wind turbines. Wind power development and associated windturbines are increasing throughout the U.S., and there is great interest in establishing the infrastructure touse wind as a renewable energy source in Pennsylvania. Wind turbines are often established along mountainridges: in Pennsylvania these ridges are also prime migration routes. Biologists have expressed concerns thatwind turbines can result in direct mortality and avoidance behavior along migration routes.6,7
The remainder of this paper is organized as follows: Section II presents previous work in the field of birdmonitoring and tracking; Section III describes the bird tracking problem and the system designed to tackleit; Section IV presents the design of the estimator used to compute the state of the bird while addressing theproblem of data association and track initiation; Section V tabulates the simulation parameters and presentsthe results obtained for a Monte Carlo simulation that uses the stated values.
II. Previous and Related Work
The most popular method for studying hawk migration has been counting of birds by human observers,followed by trapping and banding.5 Counting is best for monitoring the population but it is not enough
to understand the flight patterns of raptors. Tagging gives additional information about geographic originsand approximate flight paths but the low recapture rates of banded birds makes it impossible to reliablyanswer important questions. Radiotelemetry, radar and visual techniques have provided the best data for thestudy of flight patterns but they can be prohibitively expensive.5 In the case of observing the effect of windfarms on the mortality of migrating hawks, periodic mortality surveys are carried out by teams of observersat the site specified. The mortality rate is observed by counting carcasses of birds at periodic intervals. Theeffect of scavenging by other predators also has to be accounted for in order to avoid the underestimation ofmortality rates. The effects of location, weather and flight behavior on collision possibilities have previouslybeen analyzed using generalized linear modelling.7 Although a valid concern, previous studies indicate thatavian collision mortality associated with wind plants is much lower than other sources of collision mortality.Using the annual avian collision mortality estimate of 200-500 million, it is estimated that wind turbinesconstitute 0.01 percent to 0.02 percent of the avian collision fatalities.8 The primary reason is the low relativenumbers of wind farms to other man made structures and the fact that many of the wind plants are locatedin areas with relatively low bird and raptor use.
An autonomous system to actively monitor the flight paths of raptors can add more insight to the availableinformation without incurring the cost associated with having human observers and expensive equipment.Cameras are inexpensive sensors that impart a wealth of information pertaining to color, prominent features,position and motion of filmed objects. Stereo camera systems also allow triangulation to add depth infor-mation and provide measurements from various viewing angles to significantly lower uncertainty about thestate of the subject under observation. Stereo vision has been used by Munoz-Salinas and Auirre to trackmoving people using a Kalman filter.9 The unique color information associated with each subject beingtracked has been used by the aforementioned, as well as Bahadori and Iocchi, to perform data associationand maintain the identities of people being tracked.9,10 Color histogram based tracking has been madepopular by Zivkovic and Krose,11 but it is computationally expensive to extract color information in everyframe. Using a Kalman filter for frame to frame tracking and color information over longer time intervals,to maintain data association, is more viable for real-time applications.
Distributed systems have received increasing attention due to the several advantages that they offerover centralized systems. These include: lowered computational dependence at any one node; the option ofincorporating any number of measurements or variety of sensors into the tracking process; the ability to coverlarge areas of observation. The theory and implementation algorithms of Distributed Sensor Networks(DSN)for tracking multiple targets is presented by Bar-Shalom and Li.12 Tracking of human subjects and mobilerobots in an indoor smart environment using has been achieved by Karuppiah and Zhu through a distributedvision system with heterogenous sensors of various processing rates, synchronized and fused to achieve real-time tracking.13
The following paper has built upon previous tracking methods to simulate the outdoor, long-distancetracking of raptors using stereo camera systems and distributed processors, implemented using various formsof the Kalman Filter.
2 of 15
American Institute of Aeronautics and Astronautics
III. The Bird Tracking Problem
A. Tracking Scenario
The problem considered here is estimating the positions and speeds of birds as they pass the ground-based observation platforms. For a single bird the vector of states to be estimated includes components
of position xo, yo and zo and velocity xo, yo and zo expressed in the local ned frame:
xob,i =
[xo
b,i yob,i zo
b,i xob,i yo
b,i zob,i
]T(1)
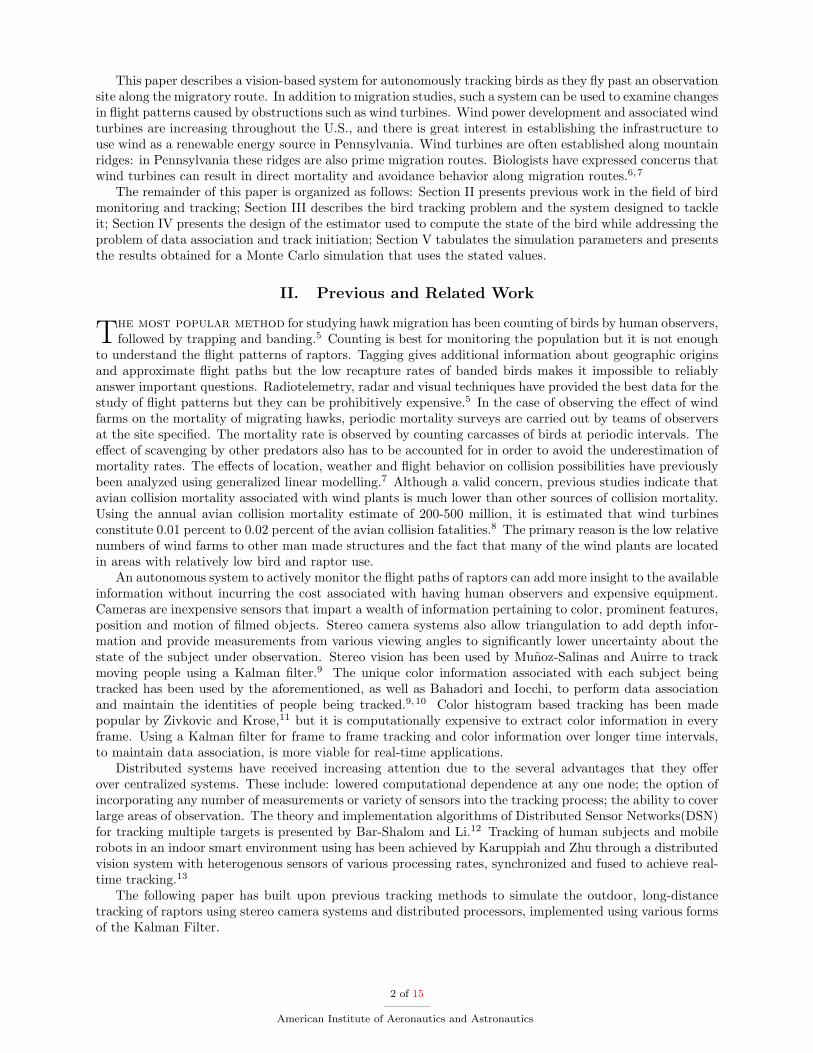
Available measurements are bearings obtained from an array of cameras placed at known positions andorientation. This is shown schematically in Figure 2.
xo
yo
zo
xb,i
xm
x1cL
o
xc
yc
zc
x1cR
x2cL
x2cR
xmcL
cR
Figure 2. Schematic of the bird tracking problem.
The flight path of a bird, b, is shown. The state of the bird, xob,i, must be estimated at every instant of
time, i. The coordinates (xoyozo) represent position in global ned coordinate system. The system of sensorsconsists of M camera stations. Each station has a stereo system of Mn cameras. Every camera in the systemis considered to have its own local coordinate system, with the x axis pointing outwards from the lens alongthe optical axis of the camera and the y and z determined by the pan or tilt of the camera about its origin.Each camera in the stereo system has its own origin and rotation angles. The coordinates (xcyczc) representthe position of the bird as seen in the local coordinates of the camera in which it is viewed. Availablemeasurements are bearings obtained from the array of cameras placed at known positions and orientation.
Computing position estimates from bearing measurements involves trigonometric functions. The trackingproblem is therefore a non-linear one. The Kalman Filter, which is the optimal linear filter, will not beable to provide a solution within the desirable limits of uncertainty. A tracking method that can producefairly accurate estimates despite the non-linearity of the system equations must be employed to achievethe results required. Tracking closely spaced, distant objects with a limited sensors can be difficult dueto the high degree of uncertainty introduced by Dilution of Precision. Having symmetrically spread outsensors over large distances can counter this problem since the ambiguity in opposite directions cancel out.Implementation details, however, dictate that the distance between cameras in a stereo pair, or the baseline,is not more than a few meters. It is difficult to transmit data to a central station over a large baseline. Havinga short baseline increases the Dilution of Precision (dop), especially when the bird is further away. However,merely spreading cameras to obtain widely dispersed bearing measurements introduces difficulties relatedto transmitting data over long distance. The designed system must therefore address the implementationissues presented by the terrain of observation site and the limitations of the hardware available to achieve asensor distribution that can counter dop to obtain reasonable estimates of the bird state.
3 of 15
American Institute of Aeronautics and Astronautics
B. System Description
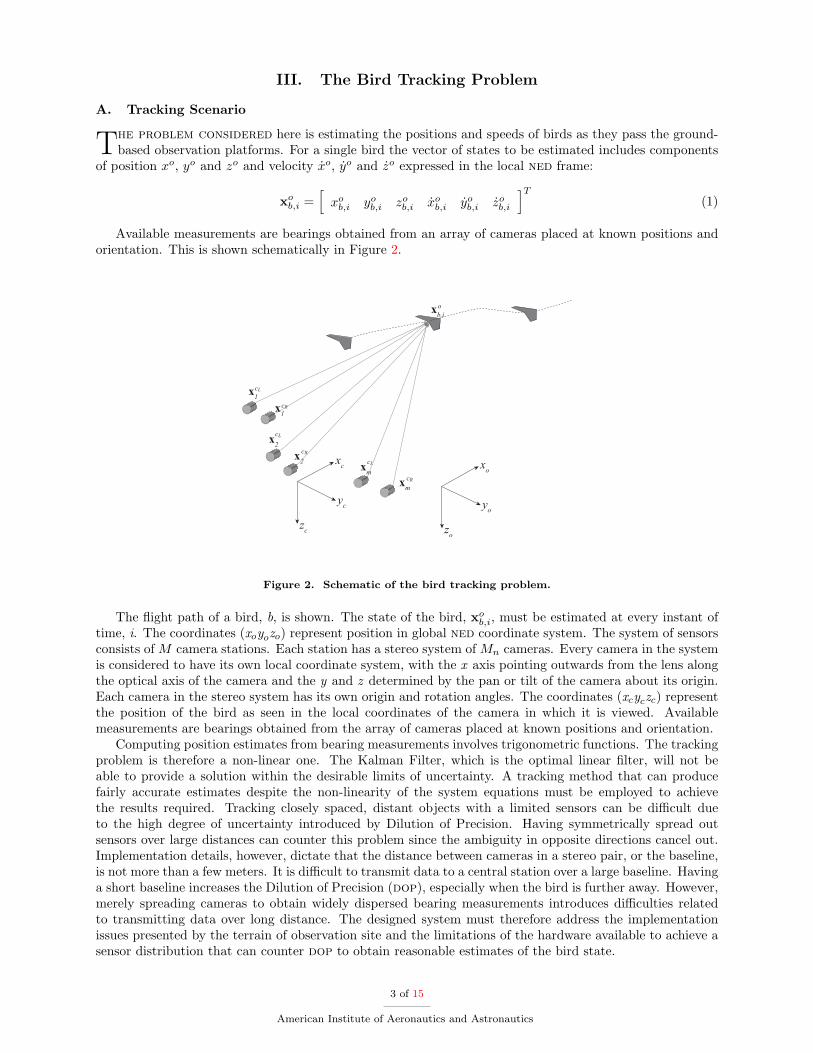
The requirement for a spatially spread out and robust system has been met by designing a DistributedSystem which has several processors, each connected to a stereo camera pair, independently tracking thebirds and a central processing unit that fuses all available estimates to compute a more accurate globalestimate of the states.
xo
yo
zo
xb,io
x2c
x1c
xc
yc
zc
x2cx1
c
xc
yc
zc
x2c
x1c
xc
yc
zc
local estimator local estimator
fused estimate
local estimator...
communications link
fusion centre
Figure 3. Schematic of the Distributed Hierarchical Estimation system.
A set of stations, each consisting of a camera pair, a processor and a two-way communication link formthe components of the distributed system to be employed for estimating the position and velocity of thebirds in view. The cameras are spread out along the ridge with overlapping fields of view to obtain multiple,simultaneous measurements of a bird. The dop is therefore reduced due to the geometry of the array ofcameras. Although a Sigma Point Kalman Filter may be used to fuse the available measurements at acentral processor to compute one estimate, this approach makes the operation of one processor critical to theperformance of the entire system. Therefore, a hierarchical approach is proposed for this project as shownin Figure 3, wherein bearings from pairs of cameras are fused using an Unscented Kalman Filter (ukf)14,15
to compute independent estimates at numerous stations. The prediction step is driven by bird kinematics(Equation 2) and the measurement update step is computed using bearings from the cameras (Equation 19).Since the state estimates for different birds are uncorrelated a separate ukf is initiated for each bird as itenters the field of view.
The local estimates are transmitted to a central processor that fuses all available estimates and transmitsa global estimate back to all stations, which is used by each station to correct its prediction for the consequenttime step. Although this approach still relies on the central processor for fusing the estimates, its operationis no longer critical to the estimation process. The load on the processor and communication link is reduced,and in the event of their failure, track is still maintained at each station.
C. Models for Measurements and Bird Flight
A constant velocity model will be used to model bird flight. The choice of states results in a linear modelfor bird kinematics:
xob,i =
[0 I0 0
]xo
b,i +
[0I
]v (2)
where I is the 3× 3 identity matrix and v is zero-mean Gaussian random noise.
4 of 15
American Institute of Aeronautics and Astronautics
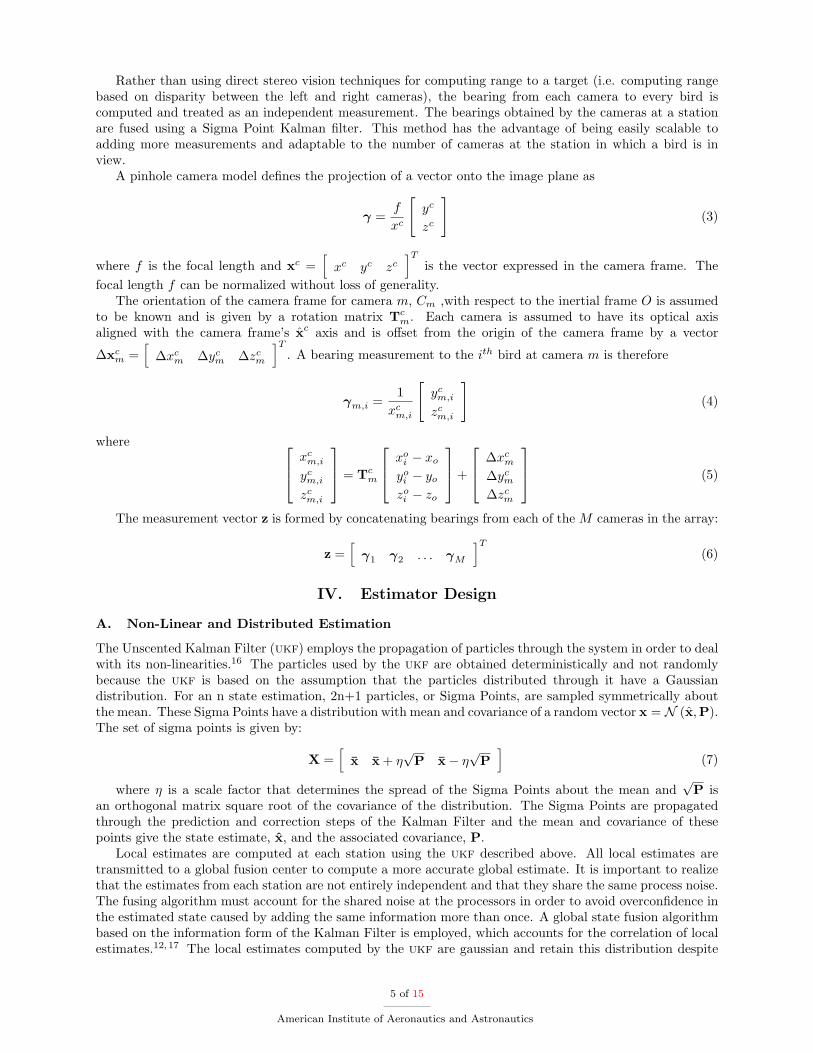
Rather than using direct stereo vision techniques for computing range to a target (i.e. computing rangebased on disparity between the left and right cameras), the bearing from each camera to every bird iscomputed and treated as an independent measurement. The bearings obtained by the cameras at a stationare fused using a Sigma Point Kalman filter. This method has the advantage of being easily scalable toadding more measurements and adaptable to the number of cameras at the station in which a bird is inview.
A pinhole camera model defines the projection of a vector onto the image plane as
γ =f
xc
[yc
zc
](3)
where f is the focal length and xc =[xc yc zc
]Tis the vector expressed in the camera frame. The
focal length f can be normalized without loss of generality.The orientation of the camera frame for camera m, Cm ,with respect to the inertial frame O is assumed
to be known and is given by a rotation matrix Tcm. Each camera is assumed to have its optical axis
aligned with the camera frame’s xc axis and is offset from the origin of the camera frame by a vector
∆xcm =
[∆xc
m ∆ycm ∆zc
m
]T. A bearing measurement to the ith bird at camera m is therefore
γm,i =1
xcm,i
[yc
m,i
zcm,i
](4)
where xcm,i
ycm,i
zcm,i
= Tcm
xoi − xo
yoi − yo
zoi − zo
+
∆xcm
∆ycm
∆zcm
(5)
The measurement vector z is formed by concatenating bearings from each of the M cameras in the array:
z =[
γ1 γ2 . . . γM
]T(6)
IV. Estimator Design
A. Non-Linear and Distributed Estimation
The Unscented Kalman Filter (ukf) employs the propagation of particles through the system in order to dealwith its non-linearities.16 The particles used by the ukf are obtained deterministically and not randomlybecause the ukf is based on the assumption that the particles distributed through it have a Gaussiandistribution. For an n state estimation, 2n+1 particles, or Sigma Points, are sampled symmetrically aboutthe mean. These Sigma Points have a distribution with mean and covariance of a random vector x = N (x,P).The set of sigma points is given by:
X =[
x x + η√
P x− η√
P]
(7)
where η is a scale factor that determines the spread of the Sigma Points about the mean and√
P isan orthogonal matrix square root of the covariance of the distribution. The Sigma Points are propagatedthrough the prediction and correction steps of the Kalman Filter and the mean and covariance of thesepoints give the state estimate, x, and the associated covariance, P.
Local estimates are computed at each station using the ukf described above. All local estimates aretransmitted to a global fusion center to compute a more accurate global estimate. It is important to realizethat the estimates from each station are not entirely independent and that they share the same process noise.The fusing algorithm must account for the shared noise at the processors in order to avoid overconfidence inthe estimated state caused by adding the same information more than once. A global state fusion algorithmbased on the information form of the Kalman Filter is employed, which accounts for the correlation of localestimates.12,17 The local estimates computed by the ukf are gaussian and retain this distribution despite
5 of 15
American Institute of Aeronautics and Astronautics
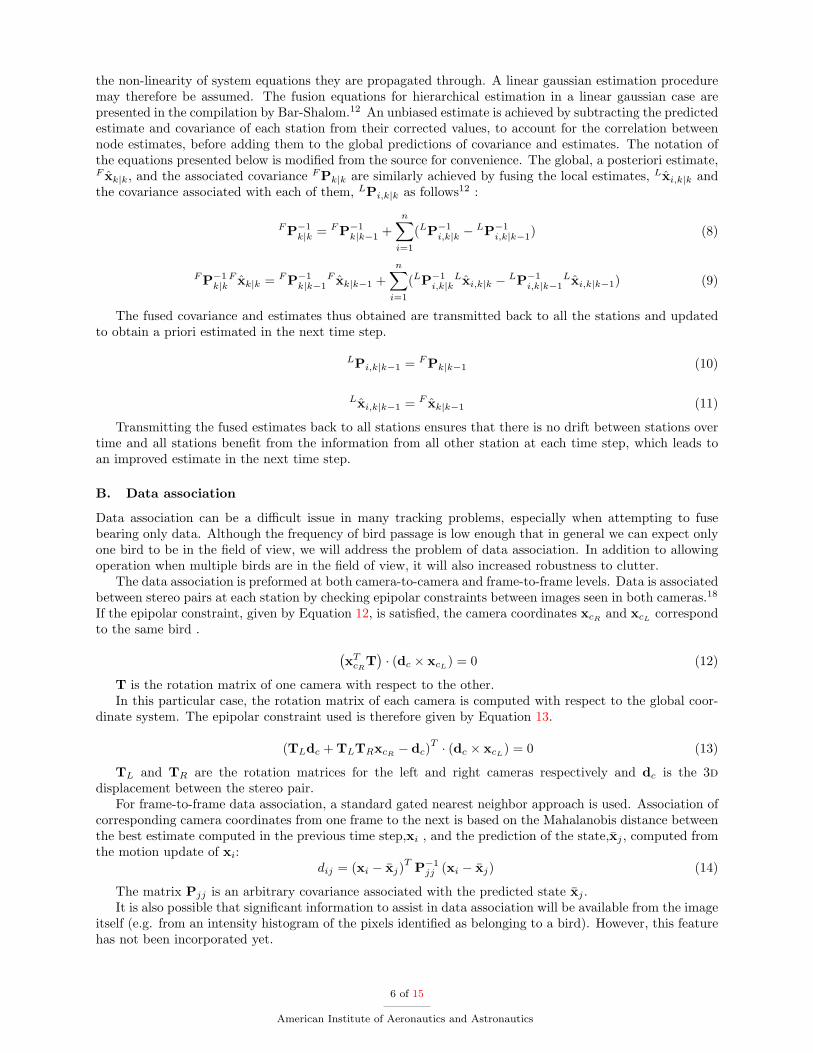
the non-linearity of system equations they are propagated through. A linear gaussian estimation proceduremay therefore be assumed. The fusion equations for hierarchical estimation in a linear gaussian case arepresented in the compilation by Bar-Shalom.12 An unbiased estimate is achieved by subtracting the predictedestimate and covariance of each station from their corrected values, to account for the correlation betweennode estimates, before adding them to the global predictions of covariance and estimates. The notation ofthe equations presented below is modified from the source for convenience. The global, a posteriori estimate,F xk|k, and the associated covariance F Pk|k are similarly achieved by fusing the local estimates, Lxi,k|k andthe covariance associated with each of them, LPi,k|k as follows12 :
F P−1k|k = F P−1
k|k−1 +n∑
i=1
(LP−1i,k|k −
LP−1i,k|k−1) (8)
F P−1k|k
F xk|k = F P−1k|k−1
F xk|k−1 +n∑
i=1
(LP−1i,k|k
Lxi,k|k − LP−1i,k|k−1
Lxi,k|k−1) (9)
The fused covariance and estimates thus obtained are transmitted back to all the stations and updatedto obtain a priori estimated in the next time step.
LPi,k|k−1 = F Pk|k−1 (10)
Lxi,k|k−1 = F xk|k−1 (11)
Transmitting the fused estimates back to all stations ensures that there is no drift between stations overtime and all stations benefit from the information from all other station at each time step, which leads toan improved estimate in the next time step.
B. Data association
Data association can be a difficult issue in many tracking problems, especially when attempting to fusebearing only data. Although the frequency of bird passage is low enough that in general we can expect onlyone bird to be in the field of view, we will address the problem of data association. In addition to allowingoperation when multiple birds are in the field of view, it will also increased robustness to clutter.
The data association is preformed at both camera-to-camera and frame-to-frame levels. Data is associatedbetween stereo pairs at each station by checking epipolar constraints between images seen in both cameras.18
If the epipolar constraint, given by Equation 12, is satisfied, the camera coordinates xcRand xcL
correspondto the same bird . (
xTcR
T)· (dc × xcL
) = 0 (12)
T is the rotation matrix of one camera with respect to the other.In this particular case, the rotation matrix of each camera is computed with respect to the global coor-
dinate system. The epipolar constraint used is therefore given by Equation 13.
(TLdc + TLTRxcR− dc)T · (dc × xcL
) = 0 (13)
TL and TR are the rotation matrices for the left and right cameras respectively and dc is the 3ddisplacement between the stereo pair.
For frame-to-frame data association, a standard gated nearest neighbor approach is used. Association ofcorresponding camera coordinates from one frame to the next is based on the Mahalanobis distance betweenthe best estimate computed in the previous time step,xi , and the prediction of the state,xj , computed fromthe motion update of xi:
dij = (xi − xj)T P−1jj (xi − xj) (14)
The matrix Pjj is an arbitrary covariance associated with the predicted state xj .It is also possible that significant information to assist in data association will be available from the image
itself (e.g. from an intensity histogram of the pixels identified as belonging to a bird). However, this featurehas not been incorporated yet.
6 of 15
American Institute of Aeronautics and Astronautics
C. Track Initiation
Track initiation can be a thorny problem, especially when range data is uncertain (which is the case forshort-baseline multiple camera systems). A closely related problem, feature initialization in SimultaneousLocalization and Mapping (slam), has the same difficulties. Feature initialization in bearings-only slam isespecially difficult, and has been the subject of a large amount of research. “Delayed approaches” collectseveral bearings over time and fuse them to compute an initial estimate of landmark position.19–21 “Un-delayed approaches” represent the conical probability distribution associated with a bearing measurementas a series of Gaussians which are then pruned as more measurements become available.22–24 These areessentially multiple hypothesis filters. The main issue which these methods attempt to address is ensuringthat the initial landmark position is “Gaussian” enough be incorporated into a Kalman filter (e.g. ekf orukf) without causing stability problems.
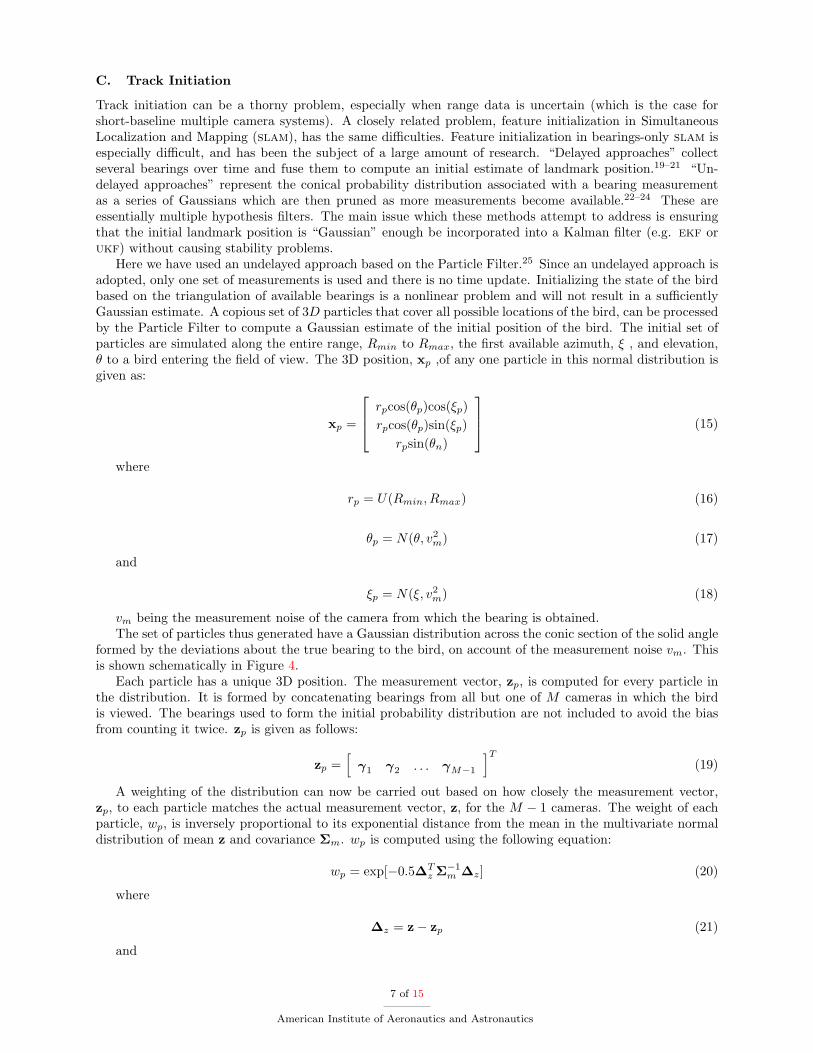
Here we have used an undelayed approach based on the Particle Filter.25 Since an undelayed approach isadopted, only one set of measurements is used and there is no time update. Initializing the state of the birdbased on the triangulation of available bearings is a nonlinear problem and will not result in a sufficientlyGaussian estimate. A copious set of 3D particles that cover all possible locations of the bird, can be processedby the Particle Filter to compute a Gaussian estimate of the initial position of the bird. The initial set ofparticles are simulated along the entire range, Rmin to Rmax, the first available azimuth, ξ , and elevation,θ to a bird entering the field of view. The 3D position, xp ,of any one particle in this normal distribution isgiven as:
xp =
rpcos(θp)cos(ξp)rpcos(θp)sin(ξp)
rpsin(θn)
(15)
where
rp = U(Rmin, Rmax) (16)
θp = N(θ, v2m) (17)
and
ξp = N(ξ, v2m) (18)
vm being the measurement noise of the camera from which the bearing is obtained.The set of particles thus generated have a Gaussian distribution across the conic section of the solid angle
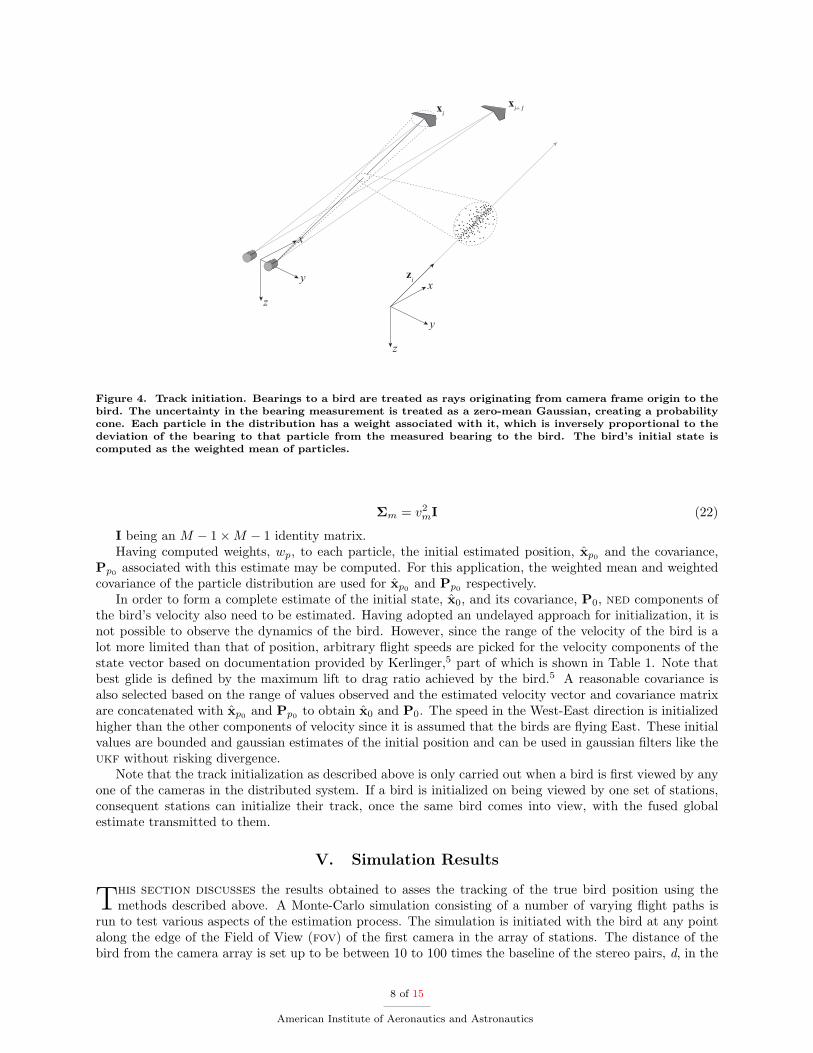
formed by the deviations about the true bearing to the bird, on account of the measurement noise vm. Thisis shown schematically in Figure 4.
Each particle has a unique 3D position. The measurement vector, zp, is computed for every particle inthe distribution. It is formed by concatenating bearings from all but one of M cameras in which the birdis viewed. The bearings used to form the initial probability distribution are not included to avoid the biasfrom counting it twice. zp is given as follows:
zp =[
γ1 γ2 . . . γM−1
]T(19)
A weighting of the distribution can now be carried out based on how closely the measurement vector,zp, to each particle matches the actual measurement vector, z, for the M − 1 cameras. The weight of eachparticle, wp, is inversely proportional to its exponential distance from the mean in the multivariate normaldistribution of mean z and covariance Σm. wp is computed using the following equation:
wp = exp[−0.5∆Tz Σ−1
m ∆z] (20)
where
∆z = z− zp (21)
and
7 of 15
American Institute of Aeronautics and Astronautics
x
y
z
xixi+1
zi x
y
z
Figure 4. Track initiation. Bearings to a bird are treated as rays originating from camera frame origin to thebird. The uncertainty in the bearing measurement is treated as a zero-mean Gaussian, creating a probabilitycone. Each particle in the distribution has a weight associated with it, which is inversely proportional to thedeviation of the bearing to that particle from the measured bearing to the bird. The bird’s initial state iscomputed as the weighted mean of particles.
Σm = v2mI (22)
I being an M − 1×M − 1 identity matrix.Having computed weights, wp, to each particle, the initial estimated position, xp0 and the covariance,
Pp0 associated with this estimate may be computed. For this application, the weighted mean and weightedcovariance of the particle distribution are used for xp0 and Pp0 respectively.
In order to form a complete estimate of the initial state, x0, and its covariance, P0, ned components ofthe bird’s velocity also need to be estimated. Having adopted an undelayed approach for initialization, it isnot possible to observe the dynamics of the bird. However, since the range of the velocity of the bird is alot more limited than that of position, arbitrary flight speeds are picked for the velocity components of thestate vector based on documentation provided by Kerlinger,5 part of which is shown in Table 1. Note thatbest glide is defined by the maximum lift to drag ratio achieved by the bird.5 A reasonable covariance isalso selected based on the range of values observed and the estimated velocity vector and covariance matrixare concatenated with xp0 and Pp0 to obtain x0 and P0. The speed in the West-East direction is initializedhigher than the other components of velocity since it is assumed that the birds are flying East. These initialvalues are bounded and gaussian estimates of the initial position and can be used in gaussian filters like theukf without risking divergence.
Note that the track initialization as described above is only carried out when a bird is first viewed by anyone of the cameras in the distributed system. If a bird is initialized on being viewed by one set of stations,consequent stations can initialize their track, once the same bird comes into view, with the fused globalestimate transmitted to them.
V. Simulation Results
This section discusses the results obtained to asses the tracking of the true bird position using themethods described above. A Monte-Carlo simulation consisting of a number of varying flight paths is
run to test various aspects of the estimation process. The simulation is initiated with the bird at any pointalong the edge of the Field of View (fov) of the first camera in the array of stations. The distance of thebird from the camera array is set up to be between 10 to 100 times the baseline of the stereo pairs, d, in the
8 of 15
American Institute of Aeronautics and Astronautics
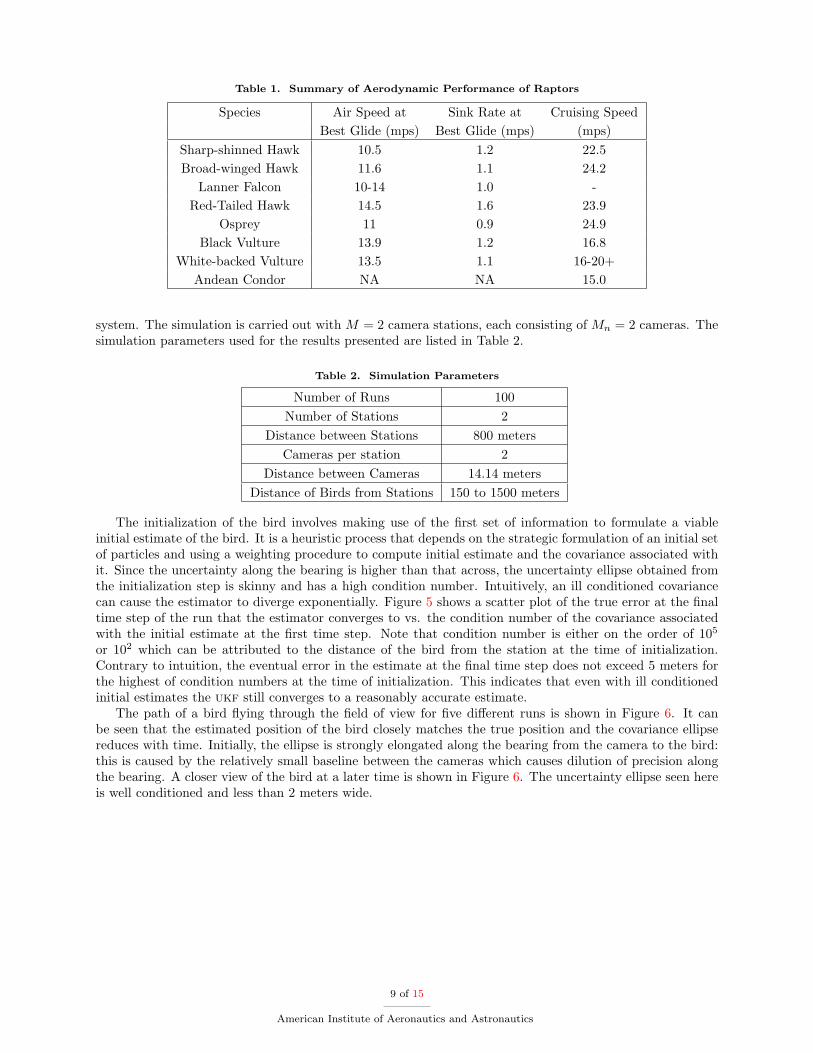
Table 1. Summary of Aerodynamic Performance of Raptors
Species Air Speed at Sink Rate at Cruising SpeedBest Glide (mps) Best Glide (mps) (mps)
Sharp-shinned Hawk 10.5 1.2 22.5Broad-winged Hawk 11.6 1.1 24.2
Lanner Falcon 10-14 1.0 -Red-Tailed Hawk 14.5 1.6 23.9
Osprey 11 0.9 24.9Black Vulture 13.9 1.2 16.8
White-backed Vulture 13.5 1.1 16-20+Andean Condor NA NA 15.0
system. The simulation is carried out with M = 2 camera stations, each consisting of Mn = 2 cameras. Thesimulation parameters used for the results presented are listed in Table 2.
Table 2. Simulation Parameters
Number of Runs 100Number of Stations 2
Distance between Stations 800 metersCameras per station 2
Distance between Cameras 14.14 metersDistance of Birds from Stations 150 to 1500 meters
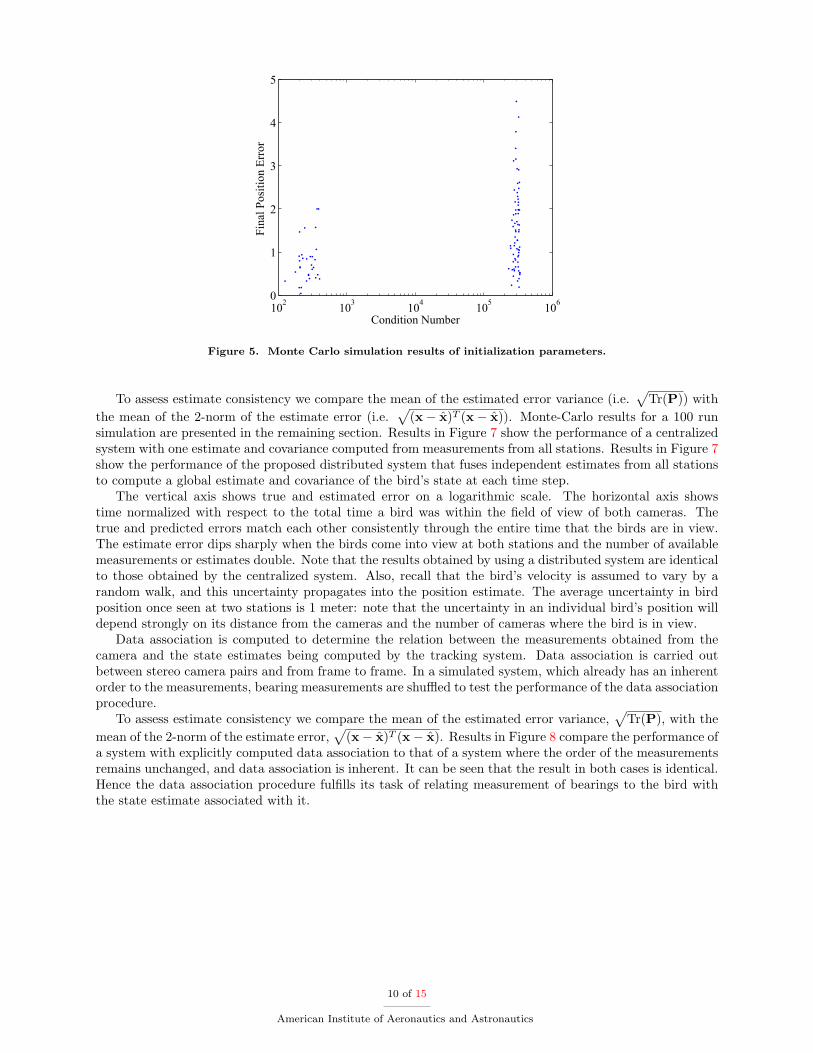
The initialization of the bird involves making use of the first set of information to formulate a viableinitial estimate of the bird. It is a heuristic process that depends on the strategic formulation of an initial setof particles and using a weighting procedure to compute initial estimate and the covariance associated withit. Since the uncertainty along the bearing is higher than that across, the uncertainty ellipse obtained fromthe initialization step is skinny and has a high condition number. Intuitively, an ill conditioned covariancecan cause the estimator to diverge exponentially. Figure 5 shows a scatter plot of the true error at the finaltime step of the run that the estimator converges to vs. the condition number of the covariance associatedwith the initial estimate at the first time step. Note that condition number is either on the order of 105
or 102 which can be attributed to the distance of the bird from the station at the time of initialization.Contrary to intuition, the eventual error in the estimate at the final time step does not exceed 5 meters forthe highest of condition numbers at the time of initialization. This indicates that even with ill conditionedinitial estimates the ukf still converges to a reasonably accurate estimate.
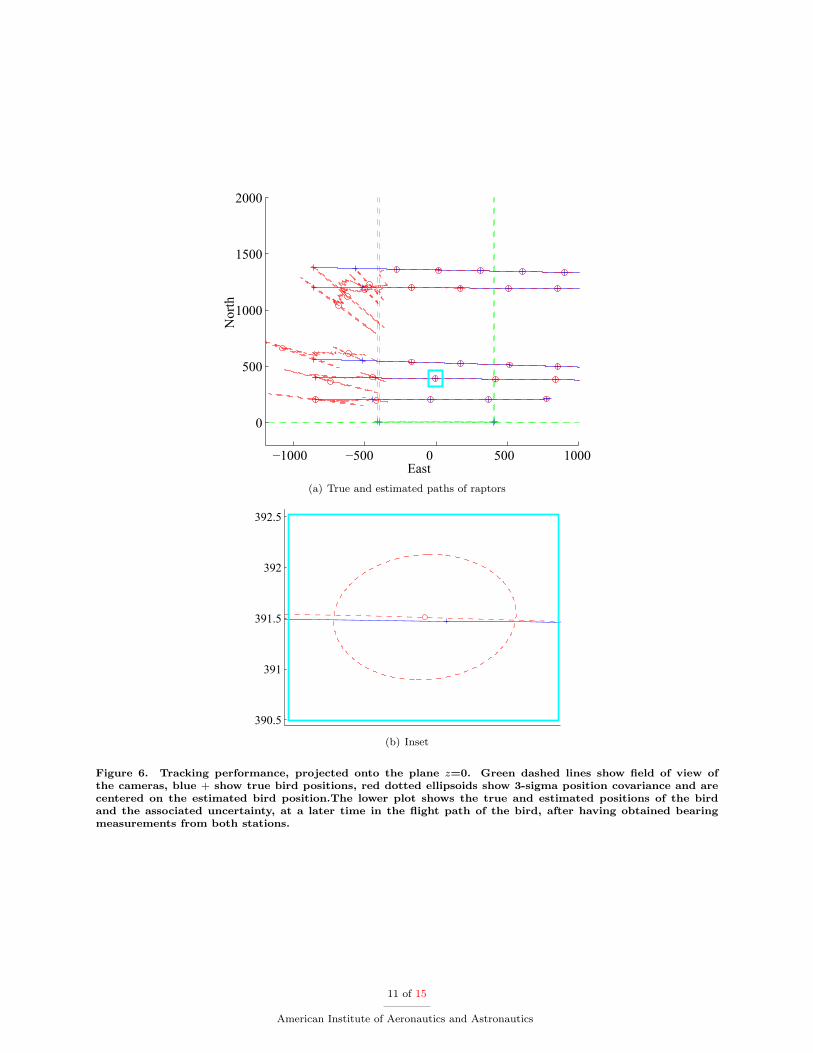
The path of a bird flying through the field of view for five different runs is shown in Figure 6. It canbe seen that the estimated position of the bird closely matches the true position and the covariance ellipsereduces with time. Initially, the ellipse is strongly elongated along the bearing from the camera to the bird:this is caused by the relatively small baseline between the cameras which causes dilution of precision alongthe bearing. A closer view of the bird at a later time is shown in Figure 6. The uncertainty ellipse seen hereis well conditioned and less than 2 meters wide.
9 of 15
American Institute of Aeronautics and Astronautics
102 103 104 105 1060
1
2
3
4
5
Condition Number
Fina
l Pos
ition
Err
or
Figure 5. Monte Carlo simulation results of initialization parameters.
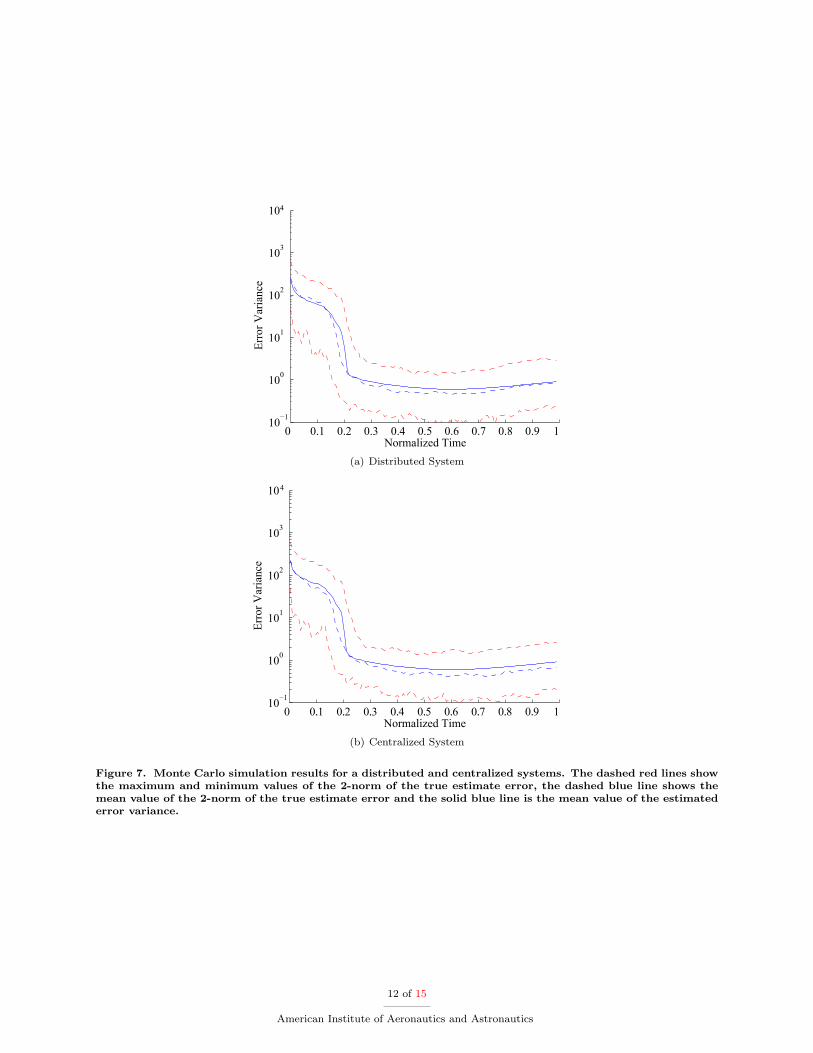
To assess estimate consistency we compare the mean of the estimated error variance (i.e.√
Tr(P)) withthe mean of the 2-norm of the estimate error (i.e.
√(x− x)T (x− x)). Monte-Carlo results for a 100 run
simulation are presented in the remaining section. Results in Figure 7 show the performance of a centralizedsystem with one estimate and covariance computed from measurements from all stations. Results in Figure 7show the performance of the proposed distributed system that fuses independent estimates from all stationsto compute a global estimate and covariance of the bird’s state at each time step.
The vertical axis shows true and estimated error on a logarithmic scale. The horizontal axis showstime normalized with respect to the total time a bird was within the field of view of both cameras. Thetrue and predicted errors match each other consistently through the entire time that the birds are in view.The estimate error dips sharply when the birds come into view at both stations and the number of availablemeasurements or estimates double. Note that the results obtained by using a distributed system are identicalto those obtained by the centralized system. Also, recall that the bird’s velocity is assumed to vary by arandom walk, and this uncertainty propagates into the position estimate. The average uncertainty in birdposition once seen at two stations is 1 meter: note that the uncertainty in an individual bird’s position willdepend strongly on its distance from the cameras and the number of cameras where the bird is in view.
Data association is computed to determine the relation between the measurements obtained from thecamera and the state estimates being computed by the tracking system. Data association is carried outbetween stereo camera pairs and from frame to frame. In a simulated system, which already has an inherentorder to the measurements, bearing measurements are shuffled to test the performance of the data associationprocedure.
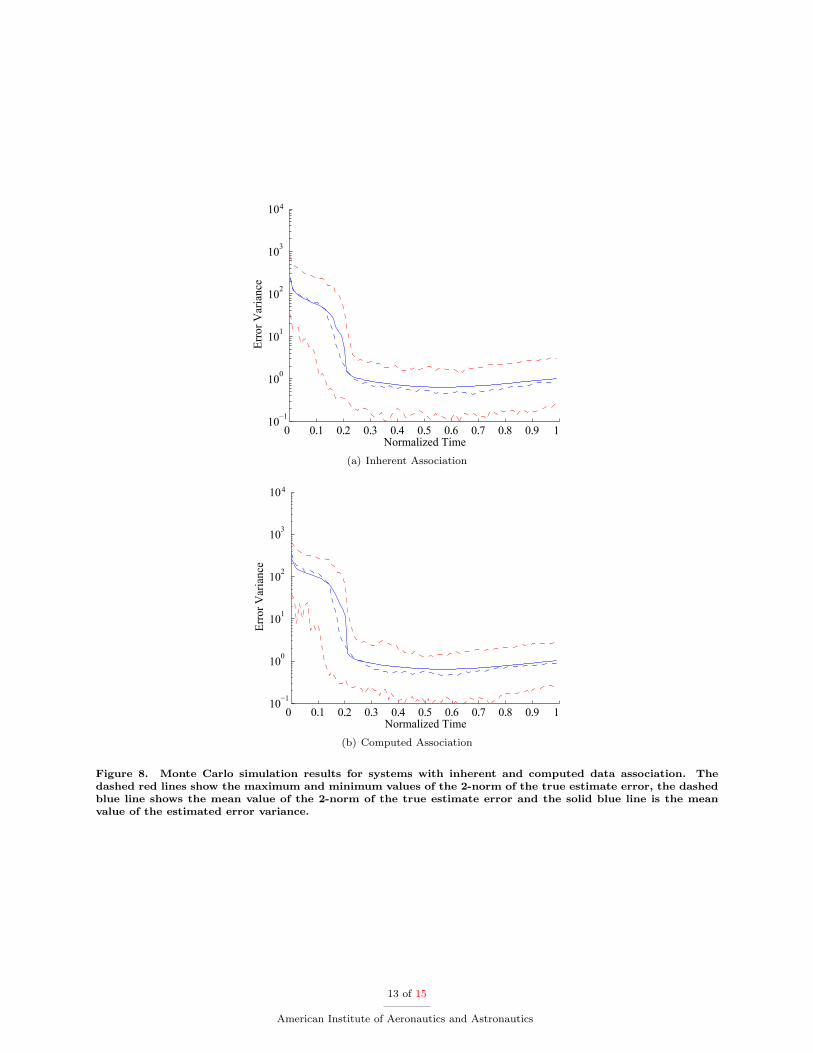
To assess estimate consistency we compare the mean of the estimated error variance,√
Tr(P), with themean of the 2-norm of the estimate error,
√(x− x)T (x− x). Results in Figure 8 compare the performance of
a system with explicitly computed data association to that of a system where the order of the measurementsremains unchanged, and data association is inherent. It can be seen that the result in both cases is identical.Hence the data association procedure fulfills its task of relating measurement of bearings to the bird withthe state estimate associated with it.
10 of 15
American Institute of Aeronautics and Astronautics
−1000 −500 0 500 1000
0
500
1000
1500
2000
East
Nor
th
(a) True and estimated paths of raptors
390.5
391
391.5
392
392.5
(b) Inset
Figure 6. Tracking performance, projected onto the plane z=0. Green dashed lines show field of view ofthe cameras, blue + show true bird positions, red dotted ellipsoids show 3-sigma position covariance and arecentered on the estimated bird position.The lower plot shows the true and estimated positions of the birdand the associated uncertainty, at a later time in the flight path of the bird, after having obtained bearingmeasurements from both stations.
11 of 15
American Institute of Aeronautics and Astronautics
0 0.1 0.2 0.3 0.4 0.5 0.6 0.7 0.8 0.9 1 10−1
100
101
102
103
104
Normalized Time
Erro
r Var
ianc
e
(a) Distributed System
0 0.1 0.2 0.3 0.4 0.5 0.6 0.7 0.8 0.9 1 10−1
100
101
102
103
104
Normalized Time
Erro
r Var
ianc
e
(b) Centralized System
Figure 7. Monte Carlo simulation results for a distributed and centralized systems. The dashed red lines showthe maximum and minimum values of the 2-norm of the true estimate error, the dashed blue line shows themean value of the 2-norm of the true estimate error and the solid blue line is the mean value of the estimatederror variance.
12 of 15
American Institute of Aeronautics and Astronautics
0 0.1 0.2 0.3 0.4 0.5 0.6 0.7 0.8 0.9 1 10−1
100
101
102
103
104
Normalized Time
Erro
r Var
ianc
e
(a) Inherent Association
0 0.1 0.2 0.3 0.4 0.5 0.6 0.7 0.8 0.9 1 10−1
100
101
102
103
104
Normalized Time
Erro
r Var
ianc
e
(b) Computed Association
Figure 8. Monte Carlo simulation results for systems with inherent and computed data association. Thedashed red lines show the maximum and minimum values of the 2-norm of the true estimate error, the dashedblue line shows the mean value of the 2-norm of the true estimate error and the solid blue line is the meanvalue of the estimated error variance.
13 of 15
American Institute of Aeronautics and Astronautics
VI. Conclusion
Adistributed system with stereo cameras for sensors was used to solve the inherently non-linear andnoise ridden problem of tracking multiple objects at long distances using bearing measurements. The
simulation of the system, which accounts for noise in the process as well as the sensors, and has realisticestimates of bird positions, flight speed and possible camera positions, shows that it is possible to trackmigratory raptors using this approach with a fair amount of accuracy. Further, the computation time of thistracking system is fast enough to allow it to track multiple birds in real-time. This is essential to the successof this procedure in studying the migratory paths of birds. The problems of data association as well asinitialization have been addressed and favorable results have been obtained for the ad hoc approach adoptedfor the initialization problem and the association of the measurement to the state estimate it pertains to.Future work involves the field testing of the proposed system. The use of color data for the purpose of dataassociation or even species recognition would greatly improve the performance of the system and make theapplication more versatile. To create a truly autonomous system to study the behavioral patters of migratoryspecies, learning algorithms like Hidden Markov Models could also be implemented to allow this system totrack, recognize as well as learn the migratory patterns of various avian species.
References
1Moore, F. R., editor, Stopover ecology of Nearctic-Neotropical landbird migrants: habitat relations and conservationimplications., No. 20 in Studies in Avian Biology, Cooper Ornithological Society, 496 Calle San Pablo, Camarillo, California,2000.
2Goodrich, L., “Unpublished Data,” .3“HawkWatch International,” http://www.hawkwatch.org/home/index.php.4“Southern Cross Peregrine Project,” http://www.frg.org/SC PEFA.htm.5Kerlinger, P., Flight Strategies of Migrating Hawks, University of Chicago Press, 1989.6Orloff, S. and Flannery, A., “Wind Turbine Effects on Avian Activity, Habitat Use, and Mortality in Altamont Pass and
Solan County Wind Resource Areas (1989-1991), Final Report,” Tech. rep., Planning Departments of Alameda, Contra Costaand Solano Counties and the California Energy Commision, Sacrameto, CA, 1992.
7Barrios, L. and Rodriguez, A., “Behavioural and Environmental Correlates of Soaring-Bird Mortality at On-Shore WindTurbines,” Journal of Applied Ecology, Vol. 41, No. 1, February 2004, pp. 72–81.
8Wallace Erickson, G. J., “Avian Collisions with Wind Turbines: A Summary of Existing Studies and Comparisons toOther Sources of Avian Collision Mortality in the United States,” Tech. rep., Washington,D.C, 2001.
9Rafael Munoz-Salinas, Eugenio Auirre, M. G.-S., “People Detection and Tracking using Stereo Vision and color,” Imageand Vision Computing, 2007.
10S. Bahadori, L. Iocchi, G. L. D. N. and Scozzafava, L., “Real-Time People Localization and Tracking Through FixedStereo Vision,” Lecture Notes in Computer Science, Vol. 3533/2005, 2005.
11Zivkovic, Z. and Krose, B., “An EM-Like Algorithm for Color-Histogram-Based Object Tracking,” cvpr , Vol. 01, 2004,pp. 798–803.
12Bar-Shalom, Y., Li, X. R., and Kirubarajan, T., Estimation with Applications to Tracking and Navigiation, WileyInterscience, 2001.
13Karuppiah, D. R., Zhu, Z., Shenoy, P., and Riseman, E. M., “A Fault-Tolerant Distributed Vision System Architecturefor Object Tracking in a Smart Room,” Lecture Notes in Computer Science, Vol. 2095, 2001.
14Julier, S., Uhlmann, J., and Durrant-Whyte, H. F., “A New Method for the Nonlinear Transformation of Means andCovariances in Filters and Estimators,” IEEE Transactions on Automatic Control , Vol. 45, No. 3, March 2000, pp. 477–482.
15van der Merwe, R. and Wan, E., “The Square-Root Unscented Kalman Filter for State and Parameter-Estimation,”IEEE International Conference on Acoustics, Speech and Signal Processing, IEEE, Salt Lake City, UT, 2001.
16Wan, E. and Van Der Merwe, R., “The unscented Kalman filter for nonlinear estimation,” Adaptive Systems for SignalProcessing, Communications, and Control Symposium 2000. AS-SPCC. The IEEE 2000 , 2000, pp. 153–158.
17Hashemipour, H., Roy, S., and Laub, A., “Decentralized Structures for Parallel Kalman Filtering,” IEEE Transactionson Automatic Control , Vol. 33, January 1988, pp. 88–94.
18Forsyth and Ponce.19Bailey, T., “Constrained Initialisation for Bearing-Only SLAM,” IEEE International Conference on Robotics and Au-
tomation (ICRA), IEEE, Taipei, Taiwan, 2003.20Fitzgibbons, T. and Nebot, E., “Bearing Only SLAM using Colour-based Feature Tracking,” 2002 Australasian Confer-
ence on Robotics and Automation, Auckland, New Zealand, 2002.21Montesano, L., Gaspar, J., Santos-Victor, J., and Montano, L., “Fusing Vision-Based Bearing Measurements and Motion
to Localize Pairs of Robots,” International Conference on Robotics and Automation, Barcelona, Spain, 2005.22Davison, A. J., “Real-Time Simultaneous Localisation and Mapping with a Single Camera,” International Conference
on Computer Vision, Nice, France, October 2003.23i Ortega, J. S., Lemaire, T., Decy, M., Lacroix, S., and Monin, A., “Delayed vs Undelayed Landmark Initialization
for Bearing Only SLAM,” Workshop on Simulateous Localisation and Mapping, International Conference on Robotics andAutomation, Barcelona, Spain, 2005.
14 of 15
American Institute of Aeronautics and Astronautics

24Kwok, N. M. and Dissanayake, G., “An Efficient Multiple Hypothesis Filter for Bearing-Only SLAM,” InterationalConference on Intelligent Robots and Systems, Sendai, Japan, 2004.
25Doucet, A., “On Sequential Monte Carlo Sampling Methods for Bayesian Filtering,” 1998.
15 of 15
American Institute of Aeronautics and Astronautics