Embed Size (px)
Citation preview

REPORT
Autosomal-Recessive CongenitalCerebellar Ataxia Is Caused by Mutationsin Metabotropic Glutamate Receptor 1
Velina Guergueltcheva,1,15 Dimitar N. Azmanov,2,15 Dora Angelicheva,2,16 Katherine R. Smith,3,13,16
Teodora Chamova,1 Laura Florez,2 Michael Bynevelt,4,5 Thai Nguyen,6 Sylvia Cherninkova,1
Veneta Bojinova,1 Ara Kaprelyan,7 Lyudmila Angelova,8 Bharti Morar,2 David Chandler,9
Radka Kaneva,10,11 Melanie Bahlo,3,14,* Ivailo Tournev,1,12,17 and Luba Kalaydjieva2,17,*
Autosomal-recessive congenital cerebellar ataxia was identified in Roma patients originating from a small subisolate with a known strong
founder effect. Patients presented with global developmental delay, moderate to severe stance and gait ataxia, dysarthria, mild dysdia-
dochokinesia, dysmetria and tremors, intellectual deficit, andmild pyramidal signs. Brain imaging revealed progressive generalized cere-
bellar atrophy, and inferior vermian hypoplasia and/or a constitutionally small brain were observed in some patients. Exome
sequencing, used for linkage analysis on extracted SNP genotypes and for mutation detection, identified two novel (i.e., not found in
any database) variants located 7 bp apart within a unique 6q24 linkage region. Both mutations cosegregated with the disease in five
affected families, in which all ten patients were homozygous. The mutated gene, GRM1, encodes metabotropic glutamate receptor
mGluR1, which is highly expressed in cerebellar Purkinje cells and plays an important role in cerebellar development and synaptic plas-
ticity. The twomutations affect a gene region critical for alternative splicing and the generation of receptor isoforms; they are a 3 bp exon
8 deletion and an intron 8 splicing mutation (c.2652_2654del and c.2660þ2T>G, respectively [RefSeq accession number
NM_000838.3]). The functional impact of the deletion is unclear and is overshadowed by the splicing defect. Although ataxia lympho-
blastoid cell lines expressed GRM1 at levels comparable to those of control cells, the aberrant transcripts skipped exon 8 or ended in
intron 8 and encoded various species of nonfunctional receptors either lacking the transmembrane domain and containing abnormal
intracellular tails or completelymissing the tail. The study implicatesmGluR1 in human hereditary ataxia. It also illustrates the potential
of the Roma founder populations for mutation identification by exome sequencing.
Autosomal-recessive cerebellar ataxias (ARCAs) are a clini-
cally and genetically heterogeneous group of disorders
whose clinical and genetic classifications are still evolving
as the field progresses and novel phenotypes and genes are
described.1,2 Congenital cerebellar ataxias are a relatively
small ARCA subset characterized by infantile onset of
motor incoordination, developmental delay, and variable
additional manifestations.3–10 Although a number of
genes have already been implicated in ARCAs, many rare
forms and their molecular basis remain to be discovered.
Here, we describe a form of congenital cerebellar ataxia
identified in patients of Roma ethnicity in Bulgaria. The
disorder was first encountered during our studies of
congenital cataracts facial dysmorphism neuropathy11,12
(CCFDN [MIM 604168]) in patients M II-1 and M II-2,
who belonged to an extended CCFDN-affected kindred.
A similar phenotype was observed recently in two children
(V III-1 and V III-2) from another Roma family, suggesting
1Department of Neurology, Medical University, Sofia 1431, Bulgaria; 2Labo
Australian Institute for Medical Research, The University of Western Australia,
tute of Medical Research, Melbourne 3052, Australia; 4Department of Surge
Australia; 5Neurological Intervention and Imaging Service of WA, Sir Charles G
Margaret Hospital for Children, Perth 6840, Australia; 7Department of Neurolo
Medical Genetics, Medical University, Varna 9002, Bulgaria; 9Australian Geno
Medical University, Sofia 1431, Bulgaria; 11Department of Medical Chemistry
of Cognitive Science and Psychology, New Bulgarian University, Sofia 1618,
Parkville, VIC 3010, Australia; 14Department of Mathematics and Statistics, Th15These authors contributed equally to this work16These authors contributed equally to this work17These authors contributed equally to this work
*Correspondence: [email protected] (M.B.), [email protected] (L
http://dx.doi.org/10.1016/j.ajhg.2012.07.019. �2012 by The American Societ
The American
a common founder mutation.13 A search of old hospital
records and field-trip notes identified three additional
families for a total of ten living patients and 14 unaffected
relatives participating in the study (Figure 1). All individ-
uals belonged to the same Roma group, the Bowlmakers,
a young population subisolate characterized by small
founding size, historically stagnant demographic regime,
and low genetic diversity.14,15 Parents were clinically
healthy; those deceased or unavailable were described as
symptom free, supporting autosomal-recessive inheri-
tance. Written informed consent was provided by all
participating subjects or guardians of minors. The study
complied with the guidelines of the institutions involved.
Eight patients were admitted to university hospitals for
detailed investigations, and two were examined during
homevisits. The clinicalfindings are summarized inTable1.
Collected from previous hospital records and parental
interviews, data on early manifestations and evolution of
ratory for Molecular Genetics, Centre for Medical Research and Western
Perth 6009, Australia; 3Bioinformatics Division, Walter and Eliza Hall Insti-
ry, School of Medicine, The University of Western Australia, Perth 6009,
airdner Hospital, Perth 6009, Australia; 6Department of Radiology, Princess
gy, Medical University, Varna 9002, Bulgaria; 8Department of Pediatrics and
me Research Facility, Perth 6000, Australia; 10Molecular Medicine Center,
and Biochemistry, Medical University, Sofia 1431, Bulgaria; 12Department
Bulgaria; 13Department of Medical Biology, The University of Melbourne,
e University of Melbourne, Parkville, VIC 3010, Australia
.K.)
y of Human Genetics. All rights reserved.
Journal of Human Genetics 91, 553–564, September 7, 2012 553

Figure 1. Pedigree Structure of theAtaxia-Affected Families Participating inthe StudyThe study included five unrelated Romafamilies, of which V, M, and B were re-cruited first and were included in theexome-sequencing analysis. ‘‘WES’’ desig-nates individuals selected for exome se-quencing. All participating subjects weregenotyped for the GRM1 mutations. Thefollowing abbreviations are used: del, pres-ence of c.2652_2654del; N, absence ofc.2652_2654del; T, normal allele; and G,mutant allele of c.2660þ2T>G.
the disorder pointed to impaired psychomotor develop-
ment. Three patients never walked, and five never learned
to talk, whereas developmental milestones were markedly
delayed in the remaining subjects (Table 1).
Upon current examination, height and weight were
within normal limits in the three affected children but
were markedly low in the adult patients.
Ataxia manifestations were evaluated with the Scale for
the Assessment and Rating of Ataxia (SARA).16 Moderate
to severe gait and stance ataxia were invariably present,
had a mean score of 11.9 (SARA items 1–3; maximum score
of 18), and tended to have higher values in older patients
(Table 1). Mild dysarthria was present in all who were
able to speak. Dysmetria, tremors, and dysdiadochokinesia
were also mild and had a mean score of 5.2 for limb kinetic
function (SARA items 5–8; maximum score of 16).
554 The American Journal of Human Genetics 91, 553–564, September 7, 2012
Pyramidal signs were relatively
mild and localized mostly to the
lower limbs.
Abnormalities revealed by oph-
thalmological examination included
gaze-induced horizontal nystagmus,
hypometric saccades, mild abduc-
tion deficits, strabismus, and ptosis
(Table 1).
Cognitive function was assessed
through interviews with the affected
subjects and care providers with the
use of the Diagnostic and Statistical
Manual of Mental Disorders17 criteria
targeting adaptive functioning. Intel-
lectual deficit, ranging in severity
from mild to profound, was present
in all patients.
Brain-imaging data were collected
on seven subjects, and spine imaging
was performed on two subjects;
magnetic resonance imaging (MRI
[1.5T imagers, Signa Excite HDxt, GE
Healthcare Milwaukee, USA]) was
used for all of these patients, and
additional computed tomography
(CT) scans were used for two of the
patients (Tables 2 and 3 and Figure 2). Generalized cere-
bellar atrophy was invariably present and was mostly
classified as moderate to severe. A constitutional small
inferior vermis was observed in three individuals, and
a small brain was observed in five of the seven subjects.
Themiddle cerebellar peduncle and brainstemweremostly
normal. Isolated findings included atrophy of the right
hippocampal body and bilateral-posterior-putamen signal
change and atrophy associated with prominent perivascu-
lar spaces. The spine was normal.
Reassessment of CT and MRI scans performed at
different ages in two patients (Table 3 and Figure 2) sug-
gested a progressive nature of the structural brain changes:
in V III-2, the findings were unremarkable at 1 year and
1 year and 8 months of age and became abnormal at
the age of 3 (volume loss in the cerebellum), whereas in

Table 1. Clinical Observations in the Ten Living Ataxia Patients
Patient
Li 1 V III-2 V III-1 B IV-2 P II-2 B IV-3 P II-1 P II-3 M II-2 M II-1
Age (years) atexamination
6 9 11 26 27 32 37 42 47 57
Sex female female male female male female male male male male
Pregnancy anddelivery
no data normal intranatalasphyxia
normal lungatelectasis
normal normal normal preterm preterm
Age (years) at walking 4 4 5 childhood never 1 never never 3 no data
Age (years) at simplesentences
4 2 3 no data never no data never never never never
Height (cm) 120 126 137 147 138 143 151 150 154 152
Weight (kg) 22 40 42 42.5 23 42.5 50 60 47.1 45.1
Cerebellar Ataxia (SARA Scores)
Gait (0–8) 4 5 5 5 8 4 7 8 6 7
Stance (0–6) 2 4 4 4 6 2 6 6 5 6
Sitting (0–4) 0 1 1 0 4 0 3 3 1 2
Speech disturbance(0–6)
2 2 2 2 no speech 2 nospeech
nospeech
nospeech
nospeech
Finger chase(R þ L)/2 (0–4)
1 1 2 1 not testeda 1 1 1 2 1
Nose-finger test(R þ L)/2 (0–4)
1 1 2 1 not testeda 1 1 2 1 0
Fast alternating handmovements (R þ L)/2(0–4)
1 2 2 1 not testeda 1 2 2 2 1
Heel-shin slide(R þ L)/2 (0–4)
1 2 2 2 not testeda 1 2 3 2 2
Total SARA score(0–40)b
13/40 18/40 20/40 16/40 18/18 12/40 22/34 25/34 19/34 19/34
Oculomotor Signs
Gaze-evoked horizontalnystagmus
no no no yes no yes yes no no no
Hypometric saccades no yes no no yes no yes no no yes
Abduction deficit yes no no yes yes no no yes no no
Esotropia no yes yes no yes no no no no yes
Ptosis no no no yes no no no no yes yes
Additional
Intellectual deficit mild mild mild moderate profound moderate moderate severe severe severe
Hyperreflexia yes yes yes yes no yes yes yes yes yes
Spasticity no no no no no no no yes no no
Polyneuropathy no no no no mild no no no data no data no data
Seizures no at 2years
at 5months
no one abnormalEEG
no no no no no
The scoring of the eight SARA16 items is shown in the first column; 0 indicates a lack of impairment, and higher scores indicate increasing severity. The followingabbreviations are used: R, right; L, left; SARA, Scale for the Assessment and Rating of Ataxia; and EEG, electroencephalography.aProfound intellectual deficit precluded these assessments in patient P II-2.bThe second figure is the maximal possible total SARA score, which can be lower than the theoretical maximum of 40 if some assessments were not possible (e.g.,a dysarthria score is missing in patients who never learned to speak).
The American Journal of Human Genetics 91, 553–564, September 7, 2012 555
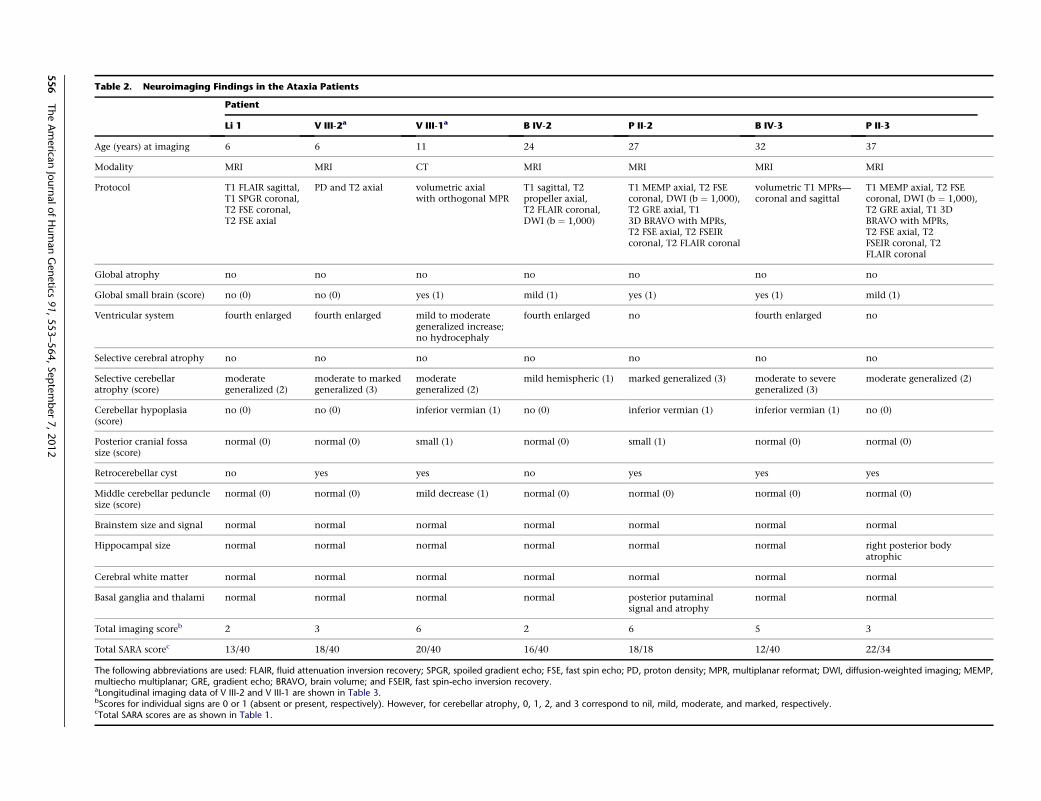
Table 2. Neuroimaging Findings in the Ataxia Patients
Patient
Li 1 V III-2a V III-1a B IV-2 P II-2 B IV-3 P II-3
Age (years) at imaging 6 6 11 24 27 32 37
Modality MRI MRI CT MRI MRI MRI MRI
Protocol T1 FLAIR sagittal,T1 SPGR coronal,T2 FSE coronal,T2 FSE axial
PD and T2 axial volumetric axialwith orthogonal MPR
T1 sagittal, T2propeller axial,T2 FLAIR coronal,DWI (b ¼ 1,000)
T1 MEMP axial, T2 FSEcoronal, DWI (b ¼ 1,000),T2 GRE axial, T13D BRAVO with MPRs,T2 FSE axial, T2 FSEIRcoronal, T2 FLAIR coronal
volumetric T1 MPRs—coronal and sagittal
T1 MEMP axial, T2 FSEcoronal, DWI (b ¼ 1,000),T2 GRE axial, T1 3DBRAVO with MPRs,T2 FSE axial, T2FSEIR coronal, T2FLAIR coronal
Global atrophy no no no no no no no
Global small brain (score) no (0) no (0) yes (1) mild (1) yes (1) yes (1) mild (1)
Ventricular system fourth enlarged fourth enlarged mild to moderategeneralized increase;no hydrocephaly
fourth enlarged no fourth enlarged no
Selective cerebral atrophy no no no no no no no
Selective cerebellaratrophy (score)
moderategeneralized (2)
moderate to markedgeneralized (3)
moderategeneralized (2)
mild hemispheric (1) marked generalized (3) moderate to severegeneralized (3)
moderate generalized (2)
Cerebellar hypoplasia(score)
no (0) no (0) inferior vermian (1) no (0) inferior vermian (1) inferior vermian (1) no (0)
Posterior cranial fossasize (score)
normal (0) normal (0) small (1) normal (0) small (1) normal (0) normal (0)
Retrocerebellar cyst no yes yes no yes yes yes
Middle cerebellar pedunclesize (score)
normal (0) normal (0) mild decrease (1) normal (0) normal (0) normal (0) normal (0)
Brainstem size and signal normal normal normal normal normal normal normal
Hippocampal size normal normal normal normal normal normal right posterior bodyatrophic
Cerebral white matter normal normal normal normal normal normal normal
Basal ganglia and thalami normal normal normal normal posterior putaminalsignal and atrophy
normal normal
Total imaging scoreb 2 3 6 2 6 5 3
Total SARA scorec 13/40 18/40 20/40 16/40 18/18 12/40 22/34
The following abbreviations are used: FLAIR, fluid attenuation inversion recovery; SPGR, spoiled gradient echo; FSE, fast spin echo; PD, proton density; MPR, multiplanar reformat; DWI, diffusion-weighted imaging; MEMP,multiecho multiplanar; GRE, gradient echo; BRAVO, brain volume; and FSEIR, fast spin-echo inversion recovery.aLongitudinal imaging data of V III-2 and V III-1 are shown in Table 3.bScores for individual signs are 0 or 1 (absent or present, respectively). However, for cerebellar atrophy, 0, 1, 2, and 3 correspond to nil, mild, moderate, and marked, respectively.cTotal SARA scores are as shown in Table 1.
556
TheAmerica
nJournalofHumanGenetics
91,553–564,September7,2012

Table 3. Reassessment of CT and MRI Scans Performed at Different Ages in the Affected Siblings of Family V
Patient
V III-2 V III-1
Age (years) atimaging
1 1 year,8 months
3 6 9 9 5 5 8 8 11
Body region head head head head head T-spine head head head L-spine head
Modality CT MRI CT MRI CT MRI CT MRI CT MRI CT
nonvolumetricaxial (8 mmslices)
T1 midlinesagittal, PD,and T2 axial
nonvolumetricaxial (5 mmslices)
PD andT2 axial
nonvolumetricaxial (3 mmslices)
T2 frFSE sagittal,T1 FLAIR sagittal,T2 STIR sagittal,2D MERGE axial
nonvolumetricaxial (5 mmslices)
PD and T2axial
nonvolumetricaxial (3 mmslices)
T1 FSE sagittal,T2 IR-STIR sagittal,2D MERGE axial,T1 FSE axial,T2 FSE coronal
volumetricaxial withorthogonalMPR
Ventricularsystem
no no fourthenlarged
fourthenlarged
fourthenlarged
� mildgeneralizedincrease
mild tomoderategeneralizedincrease (nohydrocephalus)
mild tomoderategeneralizedincrease (nohydrocephalus)
� mild tomoderategeneralizedincrease (nohydrocephalus)
Selectivecerebellaratrophy
no no moderategeneralized
moderate tomarkedgeneralized
moderategeneralized
� mild tomoderategeneralized
moderategeneralized
moderategeneralized
� moderategeneralized
Cerebellarhypoplasia
no no no no no � inferiorvermian
inferiorvermian
inferiorvermian
� inferiorvermian
Posteriorcranialfossa size
normal normal normal normal normal � small small small � small
Retrocerebellarcyst
no no yes yes yes � yes yes yes � yes
Middlecerebellarpeduncle
normal normal normal normal normal � milddecrease
mild decrease mild decrease � mild decrease
Comparison new—cellebellaratrophy
slight increasein ventricularsize andcerebellaratrophy
Spine normal small lowerspinal cord syrinx
The following abbreviations are used: CT, computed tomography; MRI, magnetic resonance image; PD, proton density; frFSE, fast-recovery fast spin echo; FLAIR, fluid attenuation inversion recovery; STIR, short-tau inversionrecovery; MERGE, multiple-echo recombined gradient echo; FSE, fast spin echo; IR-STIR, inversion-recovery short-tau inversion recovery; and MPR, multiplanar reformat.
TheAmerica
nJournalofHumanGenetics
91,553–564,September7,2012
557

Figure 2. Brain Imaging of the Patientswith Congenital Cerebellar AtaxiaThe MRI data were obtained with 1.5Tmagnetic resonance imagers.(A) Generalized cerebellar atrophy andinferior vermian hypoplasia in patient PII-2 (T1 3D brain volume [BRAVO] withmultiplanar reformats [MPRs], coronalT2, and axial T2 sequences).(B) Moderate to severe cerebellar atrophyand inferior vermian hypoplasia in patientB IV-3 (volumetric coronal and sagittalT1 MPR).(C) Evolution of MRI changes in patient VIII-2. The left panel shows normal findingsat age 1 year and 8 months, and the rightpanel shows moderate to marked cere-bellar atrophy (T1 midline sagittal, T2sagittal) evident at 6 years of age.
V III-1, the cerebellar atrophy became more prominent at
11 years of age compared to 8 years of age.
Nerve-conduction studies and needle electromyography
(Dantec–Keypoint portable electromyograph [Natus, Co-
penhagen, Denmark]) were mostly normal.
Routine blood counts and biochemistry and blood and
urine metabolites were within reference limits.
We sequenced the exomes of 11 individuals—six patients
and five parents from families V,M, and B (Figure 1). Exome
capture (Illumina TruSeq) and sequencing (Illumina HiSeq
2000) were performed by Axeq Technologies (Seoul, South
Korea). The 101 bp paired-end reads were aligned to UCSC
hg19 with Novoalign version 2.0.7. Reads mapping to
multiple locations and presumed PCR duplicates were dis-
carded with the Picard utility MarkDuplicates. Variants
were detected with the mpileup and bcftools view com-
mands from SAMtools 0.1.1818,19 with parameters -C50
and -q13. Variant filtering was performed with the vcfu-
tils.pl varFilter script from the same program. Variants
were annotated with the UCSC KnownGene annotation
and ANNOVAR.20 The functional effects of coding nonsy-
nonymous variants were assessed with SIFT21 and Hum-
Var-trained PolyPhen2 version 2.1.0.22
We used SAMtools to infer from the exome sequence
data genotypes at the location of HapMap Phase II
558 The American Journal of Human Genetics 91, 553–564, September 7, 2012
SNPs.23 From 40,464 SNPs with in-
ferred genotypes, we selected a subset
of 6,855 that were in approximate
linkage equilibrium, spaced at least
0.15 cM apart, and chosen for maxi-
mizing heterozygosity (average of
0.40) according to HapMap CEU
(Utah residents with ancestry from
northern and western Europe from
the CEPH collection) genotypes. We
used this subset to estimate related-
ness between affected families and
inbreeding within each family. The
proportion of alleles shared identi-
cally by descent between every pair of the 11 individuals
was assessed with PLINK.24 The findings (Table S1, avail-
able online) validated the known relationships within
each of the three families. No sharing was detected
between individuals from different families, indicating
that although the affected families belonged to the same
Roma group, they were not closely related. Inbreeding
coefficients (F) were estimated with FEstim;25 we used
CEU allele frequencies and starting values of 0.05 for the
parameters F and A. All six patients were estimated to be
inbred; F ranged from 0.023 to 0.113 (Table S2). Inbreeding
was also detected in four of the five unaffected parents; the
exception, mother V II-2, was known to have a non-Roma
mother. Inbreeding and relatedness detection appeared to
be robust to potential misspecification of allele frequencies
as a result of the usage of CEU frequencies; known relation-
ships were estimated accurately by both PLINK and FEstim.
Parametric multipoint linkage analysis was performed
on the same subset of 6,855 SNPs with MERLIN26 under
a fully penetrant autosomal-recessive model with a 0%
phenocopy rate, a disease allele frequency of 0.00001,
and CEU SNP allele frequencies. We added hypothetical
consanguinity loops to the pedigrees to approximate the
estimated inbreeding coefficients (Figure S1). Genome-
wide linkage analysis identified in chromosomal region

6q24 a unique peak with a maximum heterogeneity LOD
score of 6.009 (Figure S2). This was the only genomic
region in which all three families showed linkage. The
contribution of each family to the overall result is shown
in Figure S3.
Examination of inferred 6q24 haplotypes with the use of
HaploPainter27 showed a stretch of 11 SNPs (147.86–
151.16 cM) homozygous in all patients (Figure S4). Inspec-
tion of all polymorphic SNPs in the region showed homo-
zygosity extending over 59 SNPs spanning 3.3 cM (3.8
Mb). The flanking (nonhomozygous) SNPs rs2073214 at
147.86 cM and rs2272998 at 152.38 cM defined an interval
containing 32 genes (including nine pseudogenes), of
which 12 have associated OMIM entries.
Of the total 565,618 sequence variants detected in at
least one of the 11 exomes, 352,599 survived filtering.
Of these, 294 (including 88 rare or novel [not found in
any database] variants) were located within the linkage
interval. Five were coding (one synonymous, two non-
synonymous, a nonframeshift deletion, and a stop-gain
change), and one was within 2 bp of a predicted splice
site. All six were within the shared homozygous haplotype.
Only two of the six followed the expected segregation
pattern, which is that all patients and parents are homozy-
gous and heterozygous, respectively, for the mutant allele
(illustrated for family V in Figure S5).
The two homozygous variants segregating with
the disease are located in GRM1, the gene encoding
metabotropic glutamate receptor 1 (mGluR1) and are
c.2652_2654del and c.2660þ2T>G (RefSeq accession
number NM_000838.3). Database and literature searches
identified multiple mutant animal models showing
severe motor incoordination (Table S3), making GRM1
a highly plausible candidate in human ataxia. One
mutation (c.2652_2654del [p.Asn885del]) (hg19, chr6:
146,720,827–146,720,829; RefSeq NM_000838.3) is a
3 bp deletion close to the 30 end of exon 8. Seven base pairs
downstream, the second mutation (c.2660þ2T>G; hg19,
chr6: 146,720,837) affects the second nucleotide of the
canonical splice donor site of intron 8. The presence of
the mutations was verified by Sanger sequencing (Fig-
ure S5); analysis of the 11 original samples, additional
members of families V, M, and B, and two newly recruited
families showed that genotypes for the two mutations pre-
dicted disease perfectly under the autosomal-recessive
inheritance model (Figure 1).
Neither c.2652_2654del nor c.2660þ2T>G is listed in
the 1000 Genomes database release May 2011 (1,092 indi-
viduals) or the National Heart, Lung, and Blood Institute
(NHLBI) Exome Sequencing Project Exome Variant Server
(5,379 individuals). Neither was detected in our sequenc-
ing analysis of 1,050 schizophrenia cases and controls28
or in a study of 1,300 schizophrenia and bipolar patients
and controls.29 Thus, the overall number of control indi-
viduals negative for these mutations is 8,821.
Next, we examined carrier rates among 289 control indi-
viduals from three historically, linguistically, and geneti-
The American
cally related Roma groups, which share ancestral mtDNA,
Y chromosome lineages, and disease-causing muta-
tions.13,30 The panel included 80 Bowlmakers, and the re-
maining individuals belonged to the Lom and Kalderash
groups. In addition to assessing the spread of the GRM1
mutations, we aimed at understanding their simultaneous
occurrence on the same chromosome and hypothesized
that some control subjects might carry only one of the
two variants. We used PCR-based restriction-fragment-
length-polymorphism assays for the independent detec-
tion of the c.2652_2654del and c.2660þ2T>G mutations
(Figure S6) and used pyrosequencing as a confirmatory
test (Figure S7). The screening identified two Bowlmakers
heterozygous for both changes—a carrier rate of 2.5%
(a 95% exact binomial confidence interval of 0.3%–8.7%)
for this Roma group. No heterozygotes were detected
among the Lom and Kalderash groups. Compared to the
carrier rates of other disease-causing mutations in the
Roma population,30 this carrier rate is relatively low.
The fact that the mutations were confined to the Bowl-
makers and were not found in the related groups (despite
the fact that recent population fissions have given rise to
the three subisolates) and the unusually large size of the
conserved haplotype suggest a recent origin of the muta-
tions. The events leading to the coexistence of these tightly
linked variants on the same ancestral chromosome remain
unexplained.
mGluR1, the protein product of GRM1, is a family C G
protein-coupled receptor (GPCR). Class C GPCRs possess
a large bilobed ligand-binding domain followed by a
cysteine-rich domain, a highly conserved seven transmem-
brane (7TM) helical structure, and a large intracellular
C-terminal tail.31 The 7TM domain, encoded by GRM1
exon 8, is essential for selective receptor coupling to G
proteins and to allosteric modulators.32,33 The intracellular
tail is encoded by the 30 end of exon 8 and by exons 9 and
10, whose alternative splicing (Figure 3) generates mGluR1
isoforms with different lengths and amino acid com-
positions of the tail.34–36 Intracellular targeting, receptor
activity, desensitization, and internalization of mGluR1
isoforms are largely dependent on protein-protein interac-
tions involving the intracellular tail.34,36,37 A 4 aa sequence
(Arg-Arg-Lys-Lys) at positions 876–879, exposed in the
‘‘short’’ isoforms, has been proposed to act as a signal for
retention in the endoplasmic reticulum and to inhibit
G protein coupling and agonist-independent receptor
activity.38,39 Its masking by the long mGluR1a tail
accounts for the membrane exposure, dendritic targeting,
and higher activity of this isoform.34,38,39 The modulating
effects on Ca2þ levels and neuronal activity require interac-
tions of the tail with Homer proteins, ion channels, other
receptors, protein kinases, and scaffolding and trafficking
proteins.34,37
The mutations described here are located in the
GRM1 region encoding the cytoplasmic tail (Figure 3).
c.2652_2654del is predicted to result in the deletion of an
asparagine residue at position 885, whereas c.2660þ2T>G
Journal of Human Genetics 91, 553–564, September 7, 2012 559

Figure 3. Genomic Organization ofGRM1 and Location of the Ataxia Muta-tionsThe upper panel (adapted from Ferragutiet al.34) shows alternative transcripts en-coding the most abundant receptor iso-forms, mGluR1a and mGluR1b1. Exons1–8 are invariably included in all GRM1transcripts, whereas downstream differ-ences—inclusion or skipping of exon 9and the usage of alternative splice acceptorsites in exon 10—are used for produc-ing the receptor isoforms.34–36 Thec.2660þ2T>G mutation affects the intron8 donor splice site, involved in generatingall alternative transcripts. The lower panelshows potential consequences of thec.2660þ2T>G mutation. In the sur-rounding sequence, alternative sites that
are identified by the Human Splicing Finder tool as donor splice sites and that could be utilized in the absence of the normal signalare indicated in bold lowercase letters. The c.2652_2654del deletion and the novel splice site created as a result are shownwith a bracket.In the absence of the normal splice signal, aberrant transcripts could also extend into intron 8 and use a downstream in-frame stopcodon (underlined).
is expected to abolish the intron 8 donor splice site and
have potential effects including exon 8 skipping, usage of
alternative splice sites, and/or of an in-frame termination
codon 10 nt into intron 8 (Figure 3).
We examined GRM1 transcripts in RNA extracted from
lymphoblastoid cell lines (LCLs) of ataxia patients V III-2
and P II-2 and controls, which we selected to allow
identification based on the presence of rare GRM1 SNPs.
Brain RNA (Clontech, Mountain View, CA, USA) was
used for comparison. RT-PCR reactions were performed as
described,40 and product identity was verified by Sanger
sequencing (primers are shown in Table S4). An initial
RT-PCR experiment with primers targeting invariable
upstream exons 3 and 4 confirmed GRM1 expression in
LCLs from both controls and ataxia patients (Figure S8).
extended from exon 7 into exons 9 and 10. Fragments resulting fro824 bp and 909 bp) or of the novel splice site created by the deletio
560 The American Journal of Human Genetics 91, 553–564, Septemb
Quantification of transcript abundance (Figure S8) indi-
cated that, although its levels were lower in LCLs than in
the brain, they were comparable in normal and mutant
cells. Next, we used RT-PCR with primers in exons 7 and
10 to check the splicing patterns in normal LCLs and to
examine the effects of the c.2660þ2T>G mutation in
ataxia cells. In normal LCLs, this primer pair generated
the expected transcripts encoding the most abundant
mGluR1a and mGluR1b1 isoforms (Figure 4). In ataxia
cells, the normal products were replaced by much smaller
fragments in which exon 8 was missing and the exon 7
sequence extended into exons 9 or 10 (Figure 4). Finally,
RT-PCR with primers (in exon 7 and intron 8) targeting
transcripts that continued from exon 8 into intron 8
generated a product in all cells tested (Figure 5). DNA
Figure 4. GRM1 Alternative Transcriptsin Normal and Ataxia CellsThe left panel shows agarose gel electro-phoresis of RT-PCR products. Primers inGRM1 exons 7 and 10 targeted the mostabundant alternative transcripts encodingisoforms mGluR1a (skipping exon 9; ex-pected fragment size is 1,030 bp) andmGluR1b (including exon 9; expectedsize is 1,115 bp). In ataxia cells, the ex-pected fragments are replaced by productsless than 200 bp in size. The right panelshows Sanger sequencing of the RT-PCRproducts in normal and ataxia LCLs.Sequencing was performed on purifiedproducts excised from the gel; the forwardRT-PCR primer in exon 7 was used forataxia LCLs, and a nested primer in exon8 was used for controls. Transcript identitywas confirmed in the control cells (derivedfrom a subject heterozygous for the rareSNP rs362936 [G>A]). In ataxia cells,exon 8 was skipped and the transcripts
m the use of the cryptic splice site in exon 8 (expected sizes aren (expected sizes are 1,020 bp and 1,105 bp) were not detected.
er 7, 2012

Figure 5. GRM1 Transcripts Extendingfrom Exon 8 into Intron 8The left panel shows gel electrophoresis ofRT-PCR products with the use of primersin exon 7 and intron 8. Fragments of theexpected size (1,144 bp) were observed inall cells. The right panel shows Sangersequencing of the gel-purified fragmentswith a nested primer close to the normaljunction of exon 8 and intron 8. Theproduct observed in control LCLs and thebrain could be identical to a previouslydescribed GRM1 transcript and its protein
product,41 where the donor splice site of intron 8 is ignored and the immediately following termination codon (boxed) is utilized. Inataxia cells, a downstream in-frame termination codon (shaded) might be used for producing truncated receptor molecules.
contamination was ruled out in a parallel experiment with
primers in exon 7 and intron 7 (Figure S9). The product in
normal LCLs and the brain is likely to be identical to
a previously described rare GRM1 transcript in cerebellar
granule cells, confirmed at the protein level.41
GRM1 extraneural expression is limited by two con-
served silencing elements, the neuronal restrictive silenc-
ing and the regulatory factor for X-box elements.42
Therefore, our LCL data, relying on low-level illegitimate
transcription, should be interpreted as a general indication
of the events potentially occurring in the affected brain.
Our findings suggest that as a result of the c.2660þ2T>G
splicing mutation, ataxia cells produce two types of aber-
rant transcript that, if translated, would encode multiple
species of abnormal, nonfunctional mGluR1 receptor
molecules (Figure S10). Exon 8 skipping would lead to
the absence of the 7TM domain; by itself, this absence
would be equivalent to a lack of functional receptors. In
addition, the out-of-frame 931 bp deletion caused by the
skipping of exon 8 would produce a variety of C-terminal
protein sequences, none of which correspond to the
normal intracellular tails. In parallel, the transcripts
ending in intron 8 would translate into truncated receptor
molecules that have intact transmembrane domains but
that are missing almost the entire intracellular tail. It is
of interest to note that progressive cerebellar degeneration,
a major feature of the human phenotype, is not observed
in any of the animal models (Table S3). A degeneration
mechanism that is worth exploring in future studies could
involve impaired intracellular trafficking due to protein
misfolding and/or exposure of the Arg-Arg-Lys-Lys se-
quence in the truncated mGluR1 receptors.
ThemGluR1 receptormodulates intracellular Ca2þ levels
and neuronal excitability through a signaling cascade
involving phospholipase C (PLCb4), second messengers
inositol triphosphate (IP3) and diacylglycerol (DAG), and
protein kinase C (PKCg).34–36,43 It is most abundantly ex-
pressed in the cerebellar cortex and olfactory bulb, and
it is also highly expressed in the hippocampus, lateral
septum, globus pallidus, ventral pallidum, substantia
nigra, and thalamic nuclei.34,36 Cerebellar expression of
the ‘‘long’’ mGluR1 is localized to Purkinje cells, which
integrate multiple input signals to provide the output of
The American
the entire vestibulocerebellum.34,36 The receptor is essen-
tial for the early postnatal development of the cerebellar
cortex and plays a critical role in cerebellar and hippo-
campal synaptic plasticity, memory, and learning.43–45
Animal models with spontaneous or induced Grm1 muta-
tions (Table S3) develop early-onset ataxia, impaired
synaptic plasticity (cerebellar long-term depression and
hippocampal long-term potentiation), and deficits in
spatial and associative learning.34,43–45 In the Coton de
Toulear dog model, which involves an insertion and pos-
sible frameshift in exon 8, saccadic dysmetria has been
noted.46 Failure to establish the normal one-to-one rela-
tionship between Purkinje cells and climbing fibers leads
to the persistent innervation of Purkinje cells by multiple
climbing fibers; this abnormal innervation is an important
neuropathological hallmark in Grm1-null mice.34,43
The clinical features in our patients can be summed up as
global developmental delay, infantile onset of moderate to
severe gait and stance ataxia, dysarthria, mild dysdiado-
chokinesia, dysmetria and tremor, intellectual deficit of
variable severity, and mild pyramidal signs. The predomi-
nant brain-imaging findings were of moderate to marked
generalized cerebellar atrophy with or without inferior
vermian hypoplasia and/or a constitutionally small brain.
In this small patient cohort, we found no clear-cut correla-
tion between clinical severity and neuroimaging findings
(Table 2). Although the disorder was perceived as nonpro-
gressive by long-term care providers, our limited longitu-
dinal imaging data pointed to a progressive nature of the
cerebellar atrophy, and our clinical observations showed
a trend to increasing severity of the ataxia (higher SARA
scores) and of the intellectual deficit in older patients.
A comparison of this phenotype to other forms of congen-
ital ataxia (Table S5) highlighted the difficulties of clinical
differential diagnosis. The same conclusion applied to the
radiological findings: a spectrum of cerebellar hypoplasia
and/or atrophy with selective involvement of the hemi-
spheres and/or vermis are the most common ARCA find-
ings and highlight the importance of genetic diagnosis.
Thus far, support for the contribution of mGluR1 to
human cerebellar ataxia has come from rare patients
with paraneoplastic or primary autoimmune reactions
against the receptor protein.47,48 Sequencing GRM1 in 41
Journal of Human Genetics 91, 553–564, September 7, 2012 561

sporadic cases of early-onset cerebellar ataxia49 failed to
identify any mutants. The present study is an example of
a geneticGRM1 defect leading to human congenital ataxia.
Identification of additional GRM1 mutations in human
patients, as well as the development of a mouse model
of the mutations we describe, will promote the under-
standing of pathogenetic mechanisms and interspecies
differences. Our study also highlights the potential
of linkage analysis, applied to genotypes inferred from
exome-sequence data, to expedite mutation discovery. In
addition, it illustrates the power of the Roma population,
where the effects of long-term inbreeding in conjunction
with close consanguinity are complemented by the shar-
ing of founder mutations between distantly related
affected families, for the identification of disease-associ-
ated genes.
Supplemental Data
Supplemental Data include ten figures and five tables and can be
found with this article online at http://www.cell.com/AJHG.
Acknowledgments
We are grateful to the affected families participating in this study.
D.N.A. is supported by National Health and Medical Research
Council (NHMRC) Training Fellowship 634551; K.R.S. is sup-
ported by a PhD scholarship funded by the Pratt Foundation;
and M.B. is supported by Australian Research Council Future
Fellowship FT100100764 and NHMRC Program Grant 490037.
The work of K.R.S. and M.B. is supported by Victorian State
Government Operational Infrastructure Support and the
Australian Government NHMRC Independent Research Institute
Infrastructure Support Scheme. The Molecular Medicine Center
is supported by grants from the National Science Fund; the
Ministry of Education, Youth, and Science (DUNK01-2/2009);
and the Science Fund of the Medical University of Sofia (grant
8I/2009). We thank Daniela Dacheva and Reni Tzveova for
technical assistance.
Received: April 3, 2012
Revised: June 19, 2012
Accepted: July 18, 2012
Published online: August 16, 2012
Web Resources
The URLs for data presented herein are as follows:
1000 Genomes Project, http://www.1000genomes.org/
ExPASy Translate Tool, http://web.expasy.org/translate/
Human Splicing Finder, http://www.umd.be/HSF/
Integrative Genomics Viewer, http://www.broadinstitute.org/igv/
Jackson Laboratory, http://www.jax.org/
NHLBI Exome Sequencing Project Exome Variant Server, http://
evs.gs.washington.edu/EVS/
Novoalign, http://www.novocraft.com
Online Mendelian Inheritance in Man (OMIM), http://www.
omim.org/
Picard, http://picard.sourceforge.net/
PolyPhen 2, http://genetics.bwh.harvard.edu/pph2/
562 The American Journal of Human Genetics 91, 553–564, Septemb
SAMtools, http://samtools.sourceforge.net/
SIFT, http://sift.jcvi.org/
UniProt, http://www.uniprot.org/
Accession Numbers
The dbSNP accession numbers for theGRM1 sequences reported in
this paper are ss534880213 and ss534880217.
References
1. Palau, F., and Espinos, C. (2006). Autosomal recessive cere-
bellar ataxias. Orphanet J. Rare Dis. 1, 47.
2. Fogel, B.L., and Perlman, S. (2007). Clinical features and
molecular genetics of autosomal recessive cerebellar ataxias.
Lancet Neurol. 6, 245–257.
3. Norman, R.M. (1940). Primary degeneration of the granular
layer of the cerebellum: An unusual form of familial cerebellar
atrophy occurring in early life. Brain 63, 365–379.
4. Steinlin, M. (1998). Non-progressive congenital ataxias. Brain
Dev. 20, 199–208.
5. Megarbane, A., Delague, V., Ruchoux, M.M., Rizkallah, E.,
Maurage, C.A., Viollet, L., Rouaix-Emery, N., and Urtizberea, A.
(2001). New autosomal recessive cerebellar ataxia disorder
in a large inbred Lebanese family. Am. J. Med. Genet. 101,
135–141.
6. Bomar, J.M., Benke, P.J., Slattery, E.L., Puttagunta, R., Taylor,
L.P., Seong, E., Nystuen, A., Chen, W., Albin, R.L., Patel, P.D.,
et al. (2003). Mutations in a novel gene encoding a CRAL-
TRIO domain cause human Cayman ataxia and ataxia/
dystonia in the jittery mouse. Nat. Genet. 35, 264–269.
7. Glass, H.C., Boycott, K.M., Adams, C., Barlow, K., Scott, J.N.,
Chudley, A.E., Fujiwara, T.M., Morgan, K., Wirrell, E., and
McLeod, D.R. (2005). Autosomal recessive cerebellar hypo-
plasia in the Hutterite population. Dev. Med. Child Neurol.
47, 691–695.
8. Lagier-Tourenne, C., Tazir, M., Lopez, L.C., Quinzii, C.M.,
Assoum, M., Drouot, N., Busso, C., Makri, S., Ali-Pacha, L.,
Benhassine, T., et al. (2008). ADCK3, an ancestral kinase, is
mutated in a form of recessive ataxia associated with coen-
zyme Q10 deficiency. Am. J. Hum. Genet. 82, 661–672.
9. Turkmen, S., Hoffmann, K., Demirhan, O., Aruoba, D., Hum-
phrey, N., and Mundlos, S. (2008). Cerebellar hypoplasia,
with quadrupedal locomotion, caused by mutations in the
very low-density lipoprotein receptor gene. Eur. J. Hum.
Genet. 16, 1070–1074.
10. Turkmen, S., Guo, G., Garshasbi, M., Hoffmann, K., Alshalah,
A.J., Mischung, C., Kuss, A., Humphrey, N., Mundlos, S., and
Robinson, P.N. (2009). CA8mutations cause a novel syndrome
characterized by ataxia and mild mental retardation with
predisposition to quadrupedal gait. PLoS Genet. 5, e1000487.
11. Angelicheva, D., Turnev, I., Dye, D., Chandler, D., Thomas,
P.K., and Kalaydjieva, L. (1999). Congenital cataracts facial
dysmorphism neuropathy (CCFDN) syndrome: A novel devel-
opmental disorder in Gypsies maps to 18qter. Eur. J. Hum.
Genet. 7, 560–566.
12. Varon, R., Gooding, R., Steglich, C., Marns, L., Tang, H., Angel-
icheva, D., Yong, K.K., Ambrugger, P., Reinhold, A., Morar, B.,
et al. (2003). Partial deficiency of the C-terminal-domain
phosphatase of RNA polymerase II is associated with con-
genital cataracts facial dysmorphism neuropathy syndrome.
Nat. Genet. 35, 185–189.
er 7, 2012

13. Kalaydjieva, L., Morar, B., Chaix, R., and Tang, H. (2005). A
newly discovered founder population: The Roma/Gypsies.
Bioessays 27, 1084–1094.
14. Kalaydjieva, L., Calafell, F., Jobling, M.A., Angelicheva, D., de
Knijff, P., Rosser, Z.H., Hurles, M.E., Underhill, P., Tournev, I.,
Marushiakova, E., and Popov, V. (2001). Patterns of inter- and
intra-group genetic diversity in the Vlax Roma as revealed by
Y chromosome and mitochondrial DNA lineages. Eur. J. Hum.
Genet. 9, 97–104.
15. Gresham, D., Morar, B., Underhill, P.A., Passarino, G., Lin,
A.A., Wise, C., Angelicheva, D., Calafell, F., Oefner, P.J.,
Shen, P., et al. (2001). Origins and divergence of the Roma
(gypsies). Am. J. Hum. Genet. 69, 1314–1331.
16. Schmitz-Hubsch, T., du Montcel, S.T., Baliko, L., Berciano, J.,
Boesch, S., Depondt, C., Giunti, P., Globas, C., Infante, J.,
Kang, J.S., et al. (2006). Scale for the assessment and rating
of ataxia: Development of a new clinical scale. Neurology
66, 1717–1720.
17. American Psychiatric Association. (2000). Diagnostic and
Statistical Manual of Mental Disorders, Fourth Edition (Wash-
ington, DC: American Psychiatric Association).
18. Li, H., Ruan, J., and Durbin, R. (2008). Mapping short DNA
sequencing reads and calling variants using mapping quality
scores. Genome Res. 18, 1851–1858.
19. Li, H. (2011). Improving SNP discovery by base alignment
quality. Bioinformatics 27, 1157–1158.
20. Wang, K., Li, M., and Hakonarson, H. (2010). ANNOVAR:
Functional annotation of genetic variants from high-
throughput sequencing data. Nucleic Acids Res. 38, e164.
21. Kumar, P., Henikoff, S., and Ng, P.C. (2009). Predicting
the effects of coding non-synonymous variants on pro-
tein function using the SIFT algorithm. Nat. Protoc. 4, 1073–
1081.
22. Adzhubei, I.A., Schmidt, S., Peshkin, L., Ramensky, V.E.,
Gerasimova, A., Bork, P., Kondrashov, A.S., and Sunyaev, S.R.
(2010). A method and server for predicting damaging mis-
sense mutations. Nat. Methods 7, 248–249.
23. Smith, K.R., Bromhead, C.J., Hildebrand, M.S., Shearer, A.E.,
Lockhart, P.J., Najmabadi, H., Leventer, R.J., McGillivray, G.,
Amor, D.J., Smith, R.J., and Bahlo, M. (2011). Reducing
the exome search space for mendelian diseases using
genetic linkage analysis of exome genotypes. Genome Biol.
12, R85.
24. Purcell, S., Neale, B., Todd-Brown, K., Thomas, L., Ferreira,
M.A., Bender, D., Maller, J., Sklar, P., de Bakker, P.I., Daly,
M.J., and Sham, P.C. (2007). PLINK: A tool set for whole-
genome association and population-based linkage analyses.
Am. J. Hum. Genet. 81, 559–575.
25. Leutenegger, A.L., Prum, B., Genin, E., Verny, C., Lemainque,
A., Clerget-Darpoux, F., and Thompson, E.A. (2003). Estima-
tion of the inbreeding coefficient through use of genomic
data. Am. J. Hum. Genet. 73, 516–523.
26. Abecasis, G.R., Cherny, S.S., Cookson, W.O., and Cardon, L.R.
(2002). Merlin—rapid analysis of dense genetic maps using
sparse gene flow trees. Nat. Genet. 30, 97–101.
27. Thiele, H., and Nurnberg, P. (2005). HaploPainter: A tool for
drawing pedigrees with complex haplotypes. Bioinformatics
21, 1730–1732.
28. Ayoub, M.A., Angelicheva, D., Vile, D., Chandler, D., Morar,
B., Cavanaugh, J.A., Visscher, P.M., Jablensky, A., Pfleger,
K.D., and Kalaydjieva, L. (2012). Deleterious GRM1mutations
in schizophrenia. PLoS ONE 7, e32849.
The American
29. Frank, R.A., McRae, A.F., Pocklington, A.J., van de Lagemaat,
L.N., Navarro, P., Croning, M.D., Komiyama, N.H., Bradley,
S.J., Challiss, R.A., Armstrong, J.D., et al. (2011). Clustered
coding variants in the glutamate receptor complexes of indi-
viduals with schizophrenia and bipolar disorder. PLoS ONE 6,
e19011.
30. Morar, B., Gresham, D., Angelicheva, D., Tournev, I., Gooding,
R., Guergueltcheva, V., Schmidt, C., Abicht, A., Lochmuller,
H., Tordai, A., et al. (2004). Mutation history of the roma/
gypsies. Am. J. Hum. Genet. 75, 596–609.
31. Kunishima, N., Shimada, Y., Tsuji, Y., Sato, T., Yamamoto, M.,
Kumasaka, T., Nakanishi, S., Jingami, H., and Morikawa, K.
(2000). Structural basis of glutamate recognition by a dimeric
metabotropic glutamate receptor. Nature 407, 971–977.
32. Pin, J.P., Joly, C., Heinemann, S.F., and Bockaert, J. (1994).
Domains involved in the specificity of G protein activation
in phospholipase C-coupled metabotropic glutamate recep-
tors. EMBO J. 13, 342–348.
33. Knoflach, F., Mutel, V., Jolidon, S., Kew, J.N., Malherbe, P.,
Vieira, E., Wichmann, J., and Kemp, J.A. (2001). Positive allo-
steric modulators of metabotropic glutamate 1 receptor: Char-
acterization, mechanism of action, and binding site. Proc.
Natl. Acad. Sci. USA 98, 13402–13407.
34. Ferraguti, F., Crepaldi, L., and Nicoletti, F. (2008). Metabo-
tropic glutamate 1 receptor: Current concepts and perspec-
tives. Pharmacol. Rev. 60, 536–581.
35. Pin, J.P., Waeber, C., Prezeau, L., Bockaert, J., and Heinemann,
S.F. (1992). Alternative splicing generates metabotropic gluta-
mate receptors inducing different patterns of calcium release
in Xenopus oocytes. Proc. Natl. Acad. Sci. USA 89, 10331–
10335.
36. Nicoletti, F., Bockaert, J., Collingridge, G.L., Conn, P.J., Ferra-
guti, F., Schoepp, D.D., Wroblewski, J.T., and Pin, J.P. (2011).
Metabotropic glutamate receptors: From the workbench to
the bedside. Neuropharmacology 60, 1017–1041.
37. Enz, R. (2007). The trickof the tail: Protein-protein interactions
of metabotropic glutamate receptors. Bioessays 29, 60–73.
38. Mary, S., Gomeza, J., Prezeau, L., Bockaert, J., and Pin, J.P.
(1998). A cluster of basic residues in the carboxyl-terminal
tail of the short metabotropic glutamate receptor 1 variants
impairs their coupling to phospholipase C. J. Biol. Chem.
273, 425–432.
39. Francesconi, A., and Duvoisin, R.M. (2002). Alternative
splicing unmasks dendritic and axonal targeting signals in
metabotropic glutamate receptor 1. J. Neurosci. 22, 2196–
2205.
40. Pacheco, R., Ciruela, F., Casado, V., Mallol, J., Gallart, T., Lluis,
C., and Franco, R. (2004). Group I metabotropic glutamate
receptors mediate a dual role of glutamate in T cell activation.
J. Biol. Chem. 279, 33352–33358.
41. Makoff, A.J., Phillips, T., Pilling, C., and Emson, P. (1997).
Expression of a novel splice variant of human mGluR1 in
the cerebellum. Neuroreport 8, 2943–2947.
42. Crepaldi, L., Lackner, C., Corti, C., and Ferraguti, F. (2007).
Transcriptional activators and repressors for the neuron-
specific expression of a metabotropic glutamate receptor. J.
Biol. Chem. 282, 17877–17889.
43. Kano,M., Hashimoto, K., and Tabata, T. (2008). Type-1metab-
otropic glutamate receptor in cerebellar Purkinje cells: A key
molecule responsible for long-term depression, endocannabi-
noid signalling and synapse elimination. Philos. Trans. R. Soc.
Lond. B Biol. Sci. 363, 2173–2186.
Journal of Human Genetics 91, 553–564, September 7, 2012 563
44. Luscher, C., and Huber, K.M. (2010). Group 1 mGluR-
dependent synaptic long-term depression: Mechanisms
and implications for circuitry and disease. Neuron 65,
445–459.
45. Gil-Sanz, C., Delgado-Garcıa, J.M., Fairen, A., and Gruart, A.
(2008). Involvement of the mGluR1 receptor in hippocampal
synaptic plasticity and associative learning in behaving mice.
Cereb. Cortex 18, 1653–1663.
46. Coates, J.R., O’Brien, D.P., Kline, K.L., Storts, R.W., Johnson,
G.C., Shelton, G.D., Patterson, E.E., and Abbott, L.C. (2002).
Neonatal cerebellar ataxia in Coton de Tulear dogs. J. Vet.
Intern. Med. 16, 680–689.
47. Sillevis Smitt, P., Kinoshita, A., De Leeuw, B., Moll, W.,
Coesmans, M., Jaarsma, D., Henzen-Logmans, S., Vecht, C.,
564 The American Journal of Human Genetics 91, 553–564, Septemb
De Zeeuw, C., Sekiyama, N., et al. (2000). Paraneoplastic
cerebellar ataxia due to autoantibodies against a glutamate
receptor. N. Engl. J. Med. 342, 21–27.
48. Marignier, R., Chenevier, F., Rogemond, V., Sillevis Smitt, P.,
Renoux, C., Cavillon, G., Androdias, G., Vukusic, S., Graus,
F., Honnorat, J., and Confavreux, C. (2010). Metabotropic
glutamate receptor type 1 autoantibody-associated cere-
bellitis: a primary autoimmune disease? Arch. Neurol. 67,
627–630.
49. Rossi, P.I., Vaccari, C.M., Terracciano, A., Doria-Lamba, L.,
Facchinetti, S., Priolo, M., Ayuso, C., De Jorge, L., Gimelli, S.,
Santorelli, F.M., et al. (2010). The metabotropic glutamate
receptor 1, GRM1: Evaluation as a candidate gene for in-
herited forms of cerebellar ataxia. J. Neurol. 257, 598–602.
er 7, 2012


![Ataxia telangiectasia: a reviewataxia, oculocutaneous telangiectasia and frequent pul-monary infection [1]. Definition A-T is an autosomal recessive cerebellar ataxia [2]. It has also](https://img.pdfslide.net/doc/110x75/60c0274fdc425b48211dfd10/ataxia-telangiectasia-a-review-ataxia-oculocutaneous-telangiectasia-and-frequent.jpg)