Embed Size (px)
Citation preview
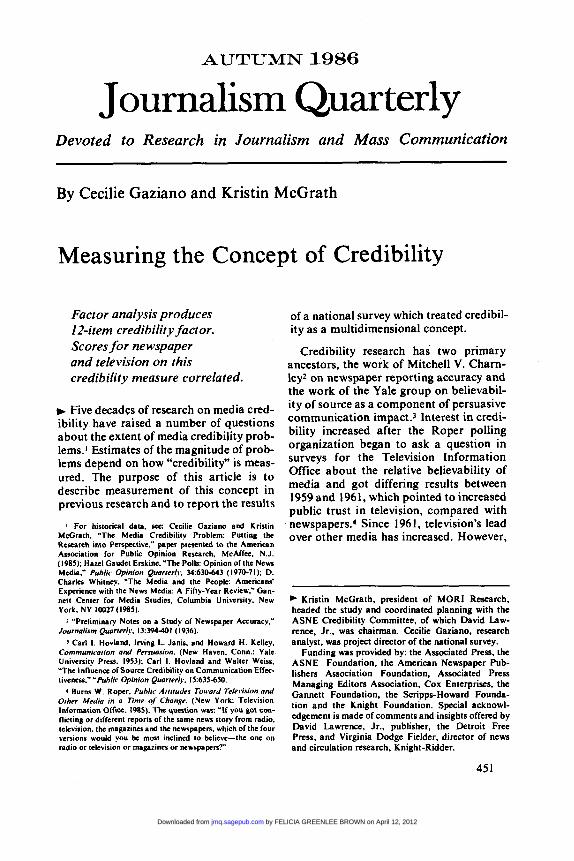
AUTUMN 1986
Journalism Quarterly Devoted to Research in Journalism and Mass Communicatiorz
~~
By C e d e Gaziano and Kristin McGrath
Measuring the Concept of Credibility
Factor analysis produces 12-item credibility factor. Scores for newspaper and television on this credibility measure correlated.
+ Five decades of research on media cred- ibility have raised a number of questions about the extent of media credibility prob- lems.1 Estimates of the magnitude of prob- lems depend on how "credibility" is meas- ured. The purpose of this article is to describe measurement of this concept in previous research and to report the results
I For historical data. see: Cecilie Gaziano and Kristin McGrath. "The Media Credibility Problem: Putting the Research into Perspective." paper presented to the American Association for Public Opinion Research. McAffcc. N.J. (1985): Hazel Caudet Erskine. 'The Polls: Opinion of the News Media." Public Opinion Quartrrl?.. 34:63043 (1970-71); D. Charles Whitney. 'The Media and the People: Americans' Experience with the News Media: A Fifty-Year Review." Gan- nett Center for Media Studies. Columbia University. New York. NY 10027 (1985).
2 'Preliminary Not- on a Study of Newspapcr Accuracy." Journalism Quarterlr. 13394-401 (1936).
1 Carl 1. Hovland. Irving L. Janis. and Howard H. Kelley. Communication and Persuasion. (New Haven, Conn.: Yale University Press. 1953): Carl 1. Hovland and Walter Weiss. 7 h e Influence of Source Credibility on Communication Ell=- tivencls," 'Public Opinion Quarterly. 15635dSO.
4 Burns W. Roper. Public. Attitudes Toward Television a d Othrr Media in a Time of ChanKe. (New York: Television Information OW=. 198s). The question was: 'I( you 801 con- flicting or different reports of the same news story from radio. televirion. the mapzines and the newspapers. which of the four versions would you be most inclined to believe-the one on radio or television or magazines or newspapers?"
of a national survey which treated credibil- ity as a multidimensional concept.
Credibility research has two primary ancestors, the work of Mitchell V. Charn- ley2 on newspaper reporting accuracy and the work of the Yale group on believabil- ity of source as a component of persuasive communication impact.3 Interest in credi- bility increased after the Roper polling organization began to ask a question in surveys for the Television Information Office about the relative believability of media and got differing results between 1959 and 1961, which pointed to increased public trust in television, compared with newspapers.4 Since 196 I , television's lead over other media has increased. However,
Kristin McGrath, president of MORl Research, headed the study and coordinated planning with the ASNE Credibility Committee, of which David Law- rence, Jr.. was chairman. Cccilie Gaziano, research analyst, was project director of the national survey.
Funding was provided by: the Associated Press. the ASNE Foundation. the American Newspaper Pub- lishers Association Foundation, Associated Press Managing Editors Association, Cox Enterprises. the Gannett Foundation, the Scripps-Howard Founda- tion and the Knight Foundation. Special acknowl- edgement is made of comments and insights offered by David Lawrence, Jr.. publisher, the Detroit Frce Press, and Virginia Dodge Fielder, director of news and circulation research, Knight-Ridder.
45 1
by FELICIA GREENLEE BROWN on April 12, 2012jmq.sagepub.comDownloaded from
452 J O U R N A L I S M
the margin over newspapers has remained relatively stable.5
The Roper question has been the most frequently used operational definition of credibility in published research. At least 14 reports have used some version of this question.6 Some of these studies have found that whether the question specifies "local" news stories or "national" news can influence results on the relative credi- bility of television and newspapers. In some studies, newspapers have been per- ceived as more believable than television for local news? but this has not always been so.8 Although this question has been pursued for about a quarter of a century, apparently no researchers have asked people if they ever actually have received conflicting news stories about different
Q U A R T E R L Y
different approach to study and each of which varied in definitions of credibility.13 A national survey by the Los Angeles Times Poll concerned perceptions of polit- ical bias in newspaper reporting and evalu- ations of media in performance, accuracy,
5 In 1959.32% said they would believe newspapers. and 29% said they would believe television. In 1%1,24% said they would believe newspapers. and 39% said television. In 1984.24% said newspapers and 53% said tekvision.
6 For example. rce: Lalie A. h x t e r and John R. Bittncr. 'High School and Colkgc Perccptiona of Media Credibility." Journalism Quarrrrly. 51:517dM (1974); Ronald Mulder, 'Mdb Credibility: A Usc-Gratification Approach," Journal- ism Quarrrrly. 57474476 (1980); J a y Reagan and Jayne Zen- aty. 'Local News Credibility: Newspapers vs. TV Revisited." Journalism QuarIrr/v. %I68472 (1979); David Shaw.'Public Finds News Media More Fair than Accurate." Lor Angela Timrs.pp. I,MZI (&I. II. I98l)ind"PublicRclinonTVfor N e w of World. Papers for Local Covcnge. Survey Finds." Lor Angelcs Timrs. pp. 3, 22 (&I. 13. 1981. Ldte Final Edition); Eugene Shaw. 'Media Credibility: Taking the Measure of a Measure." Journalism Quarrrrlv. 50306-31 I (1973).
media. When researchers' interest in credibility
began to mushroom in the 196Os, interest also grew in developing the concept more fully. Hovland and his colleagues identi- fied two main components of source cred- ibility as "trustworthiness" and "exper- tise.'- This led some scholars to be interested in identifying through factor analysis, underlying dimensions of credi- bility such as "safety," "qualification," "dy- namism," "knowledgeability," "accuracy," "fairness,'' and "completeness," as well as differences between media and people as communication sources.IO
The degree to which people differentiate among different criteria for media per- formance, concepts implying credibility, different kinds of media and various media functions has not been clear. Sev- eral researchers have concluded that cred- ibility is a multidimensional concept, although the dimensions identified vary from study to study."
Concern that the public distrusts the news media and that this distrust may be increasing led the American Society of Newspaper Editors (ASNE) to commis- sion a more comprehensive look at credi- bility than any previous research, with a special focus on newspapers.12 It was fol- lowed in 1985 by at least three other com- prehensive surveys of the public on credi- bility, each of which chose a somewhat
3
7 James 8. Lemcrt. "News Media Competition Under Condi- tions Favorable to Newspapers." Journalism Quarrrrly, 47272- 280 (1970); Guido Stempel. 111. 'Effects on R l l o r m m of a Cross-Media Monopoly." Journalism Monographs. No. 29 (June 1973).
John D. Abel and Michael 0. Wirth. 'Newspaper vs. TV Credibility for Local News." Journalism Quarrrrly. W371-375 (1977); Walter Gantz. 'The lnflucna of Research Methods on Television and Newspaper News Credibility Evaluations," Journalo/I*Wdcasting. 25:155--169 (1981); Stempel, op. rir.
9 Hovland. rt al. op. rif.; Hovhnd and Weiss. op. rir. 10 Harwy K. Jacobson. "Mass Media Believability: A Study
of Receiver Judgments." Journalism Quartrrly. 46:M28 (1969); Raymond S. H. Lee. "Credibility of Newspaper and TV News," Journalism Quorrrr/v, 55282-287 (1978); David K. Berlo. James B. Lemert. and Robert J. Mertz. "Dimensions for Evalu- ating the Acceptability of Message Sources." hblir Opinion Quartrr!i*, 33563-576 (1969-70).
11 Timothy J. Meyer. 'Media Credibility: The State of the Research." Fublir Trlrrommunirarions Rrvirn: 2(4):48-52 (1974); Michael Burgoon. J u d a K. Burgoon, and Miriam Wil- kinson, "Newspaper Image and Evaluation." Journalism Quar- rrr/v, 5841 1419,433 (1981); Gantz. op. rir.
82 American Society of Newspaper Editors. Nrwspapr Crrd- ibiliry: Building Rradrr Trust. American Society of Newspaper Editors. conducted by MORl Research. Inc.. P.O. Box 17004, Washington. D. C. 20041 (1985). Other ASNE publications from this study include: 'Focus Groups on Newspaper Credibil- ity" and "Technical Appendix/ Newspaper Credibility: Building Reader Trust" (both 1985).
An annotated bibliography on media credibility is included in the technical appendix. The data tapes for the study have been deposited with the Roper Center at the University of Connecti- cut. Inquiries may be addressed In the Center at Box U164. Univerity of Connecticut. Storrs. CN 06268. Tekphone (203) 4864441.
13 David Shew, 'The Times Poll: Media: High Ratings Arc Tempered," Los Angeles Timrs. pp. I . 8 (Aug. 12, 1985) (LOS Angelcs Timrs Poll No. 94); D. Charles Whitney, "The Media and the People: Soundings from Two Communities." Gannett Center for Media Studies. Columbia University. New York. NY 10027 (1985); The Proplr & rhr firsst A Timrs-Mirror Investi- gation of Public Attitudes Toward the News Media, conducted by the Gallup Organization in collaboration with Michael J . Robinson of George Washington University and the American Enterprise Institute ( 1986).
by FELICIA GREENLEE BROWN on April 12, 2012jmq.sagepub.comDownloaded from
Measuring the Concept of Credibility 453
fairness, responsibility, and role in criti- cism of government. The Gannett Center conducted studies in two communities, focusing on the role of public knowledge, media use, and personal experience with media and news in perceptions of credibil- ity, including variation in opinions by community. The Times Mirror study used both cross-sectional and panel national surveys, scrutinizing public knowledge of media, ratings of accuracy and believabil- ity, press criticism with regard to press behavior and practice, political bias, inde- pendence, freedoms, libel law and govern- ment criticism.
The national study sponsored by the ASNE and conducted by MORI Research, Inc., took the broadest approach to defini- tions of credibility among these four sur- veys, highlighting areas in which credibil- ity concerns seemed to be greatest.l4 Primary research questions included the following:
I ) What are the dimensions of credibility and how are they related to one another?
2) How well do people differentiate between news in newspapers and news in other media?
3) Are credibility problems concentrated in particular coverage areas? Do credibility problems increase or decrease as the loca- tion of the news event gets closer to home?
4) How do people feel about First Amendment issues, such as those dealing with revealing sources and gaining access to news evente
Method The study had two phases, a series of
focus group discussions and a national survey of adults aged 18 and older living in the contiguous United States. The quan- titative phase of the project had two parts.
An initial telephone sample was selected through random digit dialing to allow
'4 The ASNE and Lor Anpln ?imrs Poll surveys also had companion surveys of ncwpapcrjoumalirts on credibility. SCC: Associated Prns MaMging Editors. lournrrlists and Rraders: Bridging the Credibility Cap, cmducled by MORI Research. Inc.. c / o R o k n W. Ritter. Executive Editor, l lw Sun, 399 North D Street. San Bcnurdino. CA 92401; David Sbaw. m e Times Poll: Public and Pmr-Two Viewpoints." Lo6 Angles 77mes. pp. IA, 12-13 (Aug. 11. 1985).
unlisted numbers to be included. Up to four attempts were made to reach respon- dents determined to be eligible for the sur- vey. Respondents were selected within households by a random method with a quota for sex. Interviews, lasting 20 min- utes on the average, were completed with 1,600 adults between December 7, 1984 and January 19, 1985. The statistical mar- gin of error for a random sample of this size is plus or minus 3%. Error margins are larger for sub-groups.
During the initial telephone interviews, respondents were asked to give their names and addresses so a second question- naire, could be mailed to them. Those who agreed received a 12-page questionnaire, a cover letter and a $1 incentive. After about a week, these people were re-contacted by telephone so they could read back numbers corresponding to their answers on the mail questionnaire. Final telephone interviews were completed with 1,002 respondents during this second phase (December 14 to January 30). The completion rate was 58% of contacts with eligible respondents, and those taking part in the second phase were 63% of those completing the first part. The mail sub-sample somewhat underrepre- sented people aged 18 to 24 and 65 or older, people with lower education and income, blacks, men, and widowed peo- ple. It slightly overrepresented people aged 25 to 44, those with higher education and income, women, married people, and those who read a newspaper the day before.
For the analysis, results were weighted by sex, education, household size and race to match national figures from the US. Bureau of the Census. The weighted total of respondents participating in Part 1 was 1,469. The data reported in this article are based on responses from the mail sub- sample, whose weighted total was 875 persons.
The Concept of Credibility The ASNE survey used a variety of
operational definitions of credibility, in- cluding broad and narrow measures. In order to provide a standard against which
by FELICIA GREENLEE BROWN on April 12, 2012jmq.sagepub.comDownloaded from
4 54 J O U R N A L I S M
responses to different types of questions about the media could be compared, cred- ibility scores for newspapers and television were constructed. People were then divided into groups that were high, medium and low on credibility.
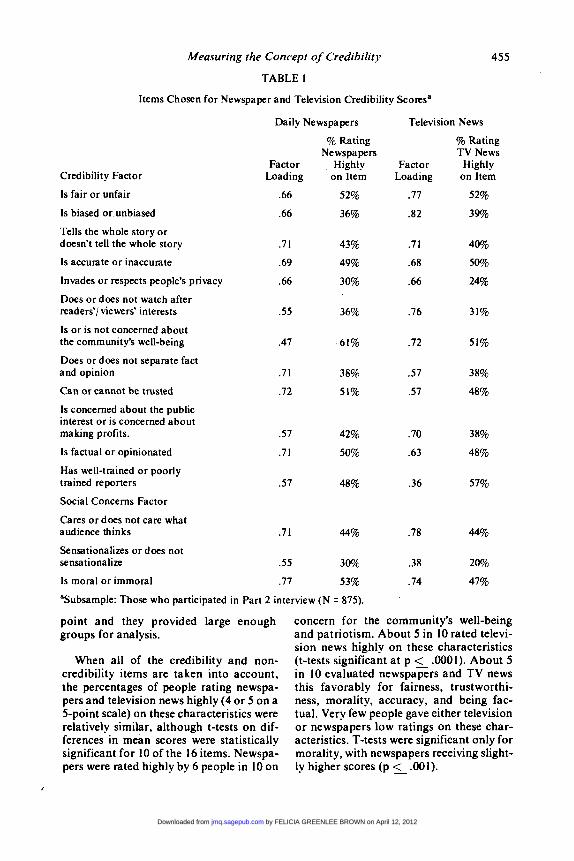
The first step in constructing a n overall credibility score was a factor analysis of 16 items measuring people’s attitudes toward newspapers on a number of dimensions. People were asked to rate these character- istics from 1 to 5 on a 5-point scale. Items were coded or recoded so that they were scaled in the same direction with 5 as the highest possible rating and I the lowest possible rating. The question for news- papers asked people to rate the daily newspaper with which they were most familiar.15 The television question ap- peared in a later section of the question- naire and concerned television news.
The factor analysis showed that 12 of these items grouped together. The items concerned whether newspapers and televi- sion news are fair, are unbiased, tell the whole story, are accurate, respect people’s privacy, watch out after people’s interests, are concerned about the community’s well-being, separate fact and opinion, can be trusted, are concerned about the public interest, are factual, and have well-trained reporters. Because most of these concepts have been treated as indicators of credibil- ity in previous research, this factor was termed “credibility.” Some previous re- search suggested that some of these items would separate into several factors such as fairness, trustworthiness and accuracy, but that did not happen in this case.16
Table 1 shows the factor loadings (the higher the loading, the greater the rela- tionship) of the aspects of the credibility problem that were combined to create the overall credibility score. The table also shows the proportion of respondents rat- ing newspapers or television highly on each characteristic (4 or 5 on the 5-point scales).
Items which grouped into a second fac- tor, termed “social concerns,” included caring what readers or viewers think, sen-
Q U A R T E R L Y
sationalizing, and being moral. Being patriotic (rated highly for newspapers by 62% and highly for TV news by 54%) grouped only with concern for the com- munity as a third factor for newspapers, and it grouped with sensationalism and reporter training items as a TV news fac- tor. The method was principal compo- nents with a varimax rotation.”
Television and newspaper credibility scores were correlated moderately with each other (r = .40, p = .0001), suggesting that people’s attitudes toward these media are similar t o a certain degree. About 61% of respondents scored either medium or high on the two media, and about 13% were low on both. Another 26% scored low on one but higher on the other.
Respondent ratings were translated into a score by adding up their ratings on each of the 12 credibility items. The lowest pos- sible credibility score was 12 (less if re- spondents did not give a n answer for each item), and the highest possible score was 60. Respondents were divided into high, medium and low credibility groups. Score distributions were skewed toward higher ratings, with about one-fourth of respon- dents giving low ratings to each medium (scores of 20 or less), and about one-third giving high ratings (scores higher than 30). Most respondents (43% in each case) bunched into a middle group with a nar- row range of scores from 21 to 30. Cut-off points were selected at 10-point intervals because these breaks were a logical cutting
I’ The question wording was: ”Now. we’d like you to think about the daily newspaper you are the most familiar with . . . Please circle the number in between each pair (of words and phrases with opposite meanings) that best represents how you feel about the daily newspaper you have in mind.” This wording was repeated for ‘television news.”
I* Television news items separated into two factors. contain- ing the same items as the newspaper credibility factor. No new items grouped with these. There appeared to be no reason not to use the same I2 items in a television credibility score.
I’ The Eigenvalue of the newspaper credibility factor (first factor) was 5.97. and the final communality estimate was 8.46. Eigenvalues for the television credibility factor (first and second factors) were 6.12 and 1.38, and the final communality estimate was 9.73. The proportion of total variarrc explained by the newspaper factor was .37. and the proportion of interpreted variance was .7 I. The proportion of total variance explained by the first and second TV credibility factors was .38 and .09. respectively: the proportion of interpreted variance was .38 and .32. respectively.
by FELICIA GREENLEE BROWN on April 12, 2012jmq.sagepub.comDownloaded from
Measuring the Concept of Credibility
TABLE 1
Items Chosen for Newspaper and Television Credibility Scoresa
455
Credibility Factor
Is fair or unfair
Is biased or unbiased
Tells the whole story or doesn't tell the whole story
Is accurate or inaccurate
Invades or respects people's privacy
Does or does not watch after readers'/ viewers' interests
Is or is not concerned about the community's well-being
Does or does not separate fact and opinion
Can or cannot be trusted
Is concerned about the public interest or is concerned about making profits.
Is factual or opinionated
Has well-trained or poorly trained reporters
Social Concerns Factor
Cares or does not care what audience thinks
Sensationalizes or does not sensationalize
Is moral or immoral
Daily Newspapers Television News
% Rating % Rating Newspapers TV News
Factor Highly Factor Highly Loading on Item Loading on Item
.66 52% .77 52%
.66 36% .82 39%
.71 43% .7 1 40%
.69 49% .68 50%
.66 30% .66 24%
.55 36% .76 31%
.47 61% .72 51%
. ? I 38% .57 38%
.72 51% .57 48%
.57 42% .70 3 8%
.7 I 50% .63 48%
.57 48% .36 57%
.7 I 44% .78 44%
.55 30% .38 2%
.77 53% .74 47%
aSubsample: Those who participated in Part 2 interview (N = 875).
point and they provided large enough groups for analysis.
When all of the credibility and non- credibility items are taken into account, the percentages of people rating newspa- pers and television news highly (4 or 5 on a 5-point scale) on these characteristics were relatively similar, although t-tests on dif- ferences in mean scores were statistically significant for 10 of the 16 items. Newspa- pers were rated highly by 6 people in 10 on
concern for the community's well-being and patriotism. About 5 in 10 rated televi- sion news highly on these characteristics (t-tests significant a t p < .0001). About 5 in 10 evaluated newspapers and TV news this favorably for fairness, trustworthi- ness, morality, accuracy, and being fac- tual. Very few people gave either television or newspapers low ratings on these char- acteristics. T-tests were significant only for morality, with newspapers receiving slight- ly higher scores (p <_ .001).
by FELICIA GREENLEE BROWN on April 12, 2012jmq.sagepub.comDownloaded from
456 J O U R N A L I S M
TV news and newspapers did relatively less well (high ratings by about 4 in 10) on being unbiased, caring what the audience thinks, separating fact and opinion, watch- ing out for their audiences’ interests, tell- ing the whole story, and being concerned for the public interest. T-tests were signifi- cant for higher newspaper scores in the last three areas mentioned, as well as for a higher television score on lack of bias. Areas in which TV news and newspapers were especially likely to receive low ratings were respecting people’s privacy and sen- sationalism, with newspapers receiving slightly higher scores (p < .0001).
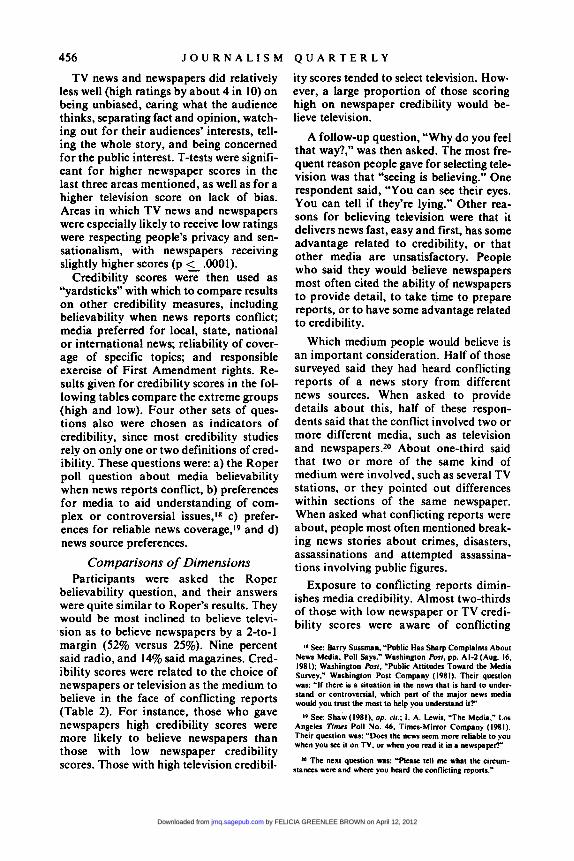
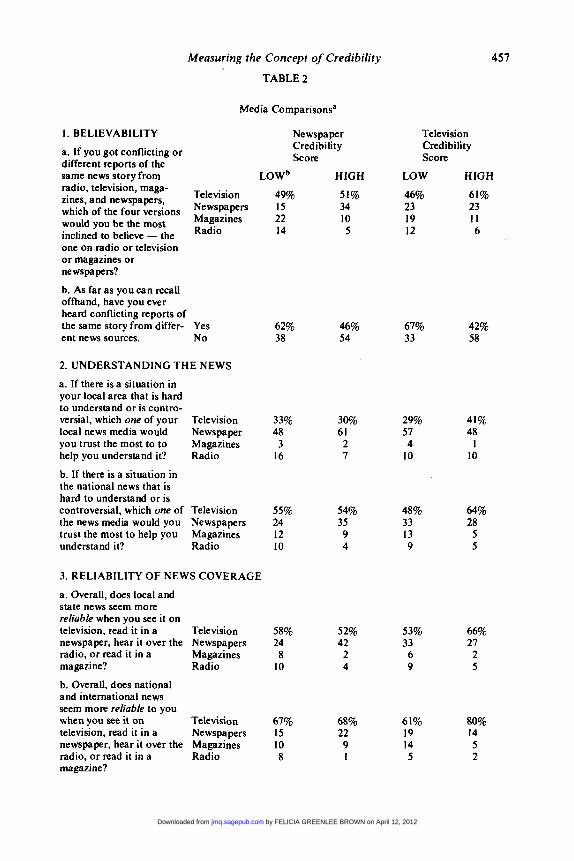
Credibility scores were then used as “yardsticks” with which to compare results on other credibility measures, including believability when news reports conflict; media preferred for local, state, national or international news; reliability of cover- age of specific topics; and responsible exercise of First Amendment rights. Re- sults given for credibility scores in the fol- lowing tables compare the extreme groups (high and low). Four other sets of ques- tions also were chosen as indicators of credibility, since most credibility studies rely on only one or two definitions of cred- ibility. These questions were: a) the Roper poll question about media believability when news reports conflict, b) preferences for media to aid understanding of com- plex or controversial issues.18 c) prefer- ences for reliable news coverage,l9 and d) news source preferences.
Comparisons of Dimensions Participants were asked the Roper
believability question, and their answers were quite similar to Roper’s results. They would be most inclined to believe televi- sion as to believe newspapers by a 2-to-I margin (52% versus 25%). Nine percent said radio, and 14% said magazines. Cred- ibility scores were related to the choice of newspapers or television as the medium to believe in the face of conflicting reports (Table 2). For instance, those who gave newspapers high credibility scores were more likely to believe newspapers than those with low newspaper credibility scores. Those with high television credibil-
Q U A R T E R L Y
ity scores tended to select television. How- ever, a large proportion of those scoring high on newspaper credibility would be- lieve television.
A follow-up question, “Why do you feel that way?,” was then asked. The most fre- quent reason people gave for selecting tele- vision was that “seeing is believing.” One respondent said, “You can see their eyes. You can tell if they’re lying.” Other rea- sons for believing television were that it delivers news fast, easy and first, has some advantage related to credibility, or that other media are unsatisfactory. People who said they would believe newspapers most often cited the ability of newspapers to provide detail, to take time to prepare reports, or to have some advantage related to credibility.
Which medium people would believe is an important consideration. Half of those surveyed said they had heard conflicting reports of a news story from different news sources. When asked to provide details about this, half of these respon- dents said that the conflict involved two or more different media, such as television and newspapers.20 About one-third said that two or more of the same kind of medium were involved, such as several TV stations, or they pointed out differences within sections of the same newspaper. When asked what conflicting reports were about, people most often mentioned break- ing news stones about crimes, disasters, assassinations and attempted assassina- tions involving public figures.
Exposure to conflicting reports dimin- ishes media credibility. Almost two-thirds of those with low newspaper or TV credi- bility scores were aware of conflicting
“Sn: Barry Sussman. ‘Public Has Sharp Complaints About News Media. Poll Says,” Washington Posr, pp. Al-2 (Aug. 16. 1981); Washington Posr. ‘Public Attitudes Toward the Media Survey.” Washington Post Company (1981). Their question was: ‘If there is a situation in thc news that is hard to under- stand or controversial. which pan of the major news medm would you trust the most to help you understand it?”
I* See: Shaw (1981). op. cil.; 1. A. Lewis. ‘The Media,“ Los Angela rims Poll No. 46. Times-Mirror Company (1981). Their question was: ”Doer the new seem more reliable to you when you yc it on TV. or when you read it in a newspapcfT
The next question was: ‘Please tell mc what the circum- stances were and whert you heard thc conflicting reports.”
by FELICIA GREENLEE BROWN on April 12, 2012jmq.sagepub.comDownloaded from
I. BELIEVABILITY
a. If you got conflicting or different reports of the same news stow from
Measuring the Concept of Credibility
Media Comparisonsa
Newspaper Credibility score
radio, television, maga- zines, and newspapers, which of the four versions would you be the most inclined to believe - the
Television Newspapers Magazines Radio
one on radio or television or magazines or newspapers?
b. As far as you can recall offhand, have you ever heard conflicting reports of the same story from differ- Yes ent news sources. No
2. UNDERSTANDING THE NEWS
a. If there is a situation in your local area that is hard to understand or is contro- versial, which one of your local news media would you trust the most to to help you understand it?
b. If there is a situation in the national news that is hard to understand or is controversial, which one of the news media would you trust the most to help you understand it?
TABLE 2
Television Newspaper Magazines Radio
Television Newspapers Magazines Radio
3. RELIABILITY OF NEWS COVERAGE
a. Overall, does local and state news seem more reliable when you see it on television, read it in a Television newspaper, hear it over the Newspapers radio, or read it in a Magazines magazine? Radio
b. Overall, does national and international news seem more reliable to you when you see it on Television television, read it in a Newspapers newspaper, hear it over the Magazines radio, or read it in a Radio magazine?
LOWb HIGH
49% 51% 15 34 22 10 14 5
62% 46% 38 54
33% 48
3 16
55% 24 12 10
58% 24
8 10
67% 15 10 8
30% 61 2 7
54% 35 9 4
52% 42
2 4
68% 22 9 I
457
Television Credibility score
LOW HIGH
46% 61% 23 23 19 I 1 12 6
67% 42% 33 58
29% 41% 57 48 4 1
10 10
48% 64% 33 28 13 5 9 5
53% 66% 33 21 6 2 9 5
61% 80% 19 14 14 5 5 2
by FELICIA GREENLEE BROWN on April 12, 2012jmq.sagepub.comDownloaded from
458 J O U R N A L I S M Q U A R T E R L Y
TABLE 2 continued 4. NEWS SOURCE PREFERENCES
a. If you had to choose one Television 45%
which source would you Magazines 2 choose - newspapers, Radio 20 television, radio, or magazines?
b. If you had to choose one Television source for state news, Newspapers 29 which source would you Magazines 3 choose - newspapers, Radio 10 television, radio, or magazines?
c. If you had to choose one Television 69% source for national and Newspapers 14 international news, which Magazines 8 source would you choose Radio 9 - newspapers, television, radio, or magazines?
source for local news, Newspapers 33
58%
46% 43
I 10
53% 41
I 5
69% 25
5 1
47% 54% 36 33
2 1 15 12
51% 62% 38 33
2 I 9 5
64% 78% 21 17
8 4 6 I
aSubsample: Those who participated in Part 2 interview -newspaper credibility, N 862 with 13 observations missing; TV credibility, N 850.25 observations missing).
bOnly the extreme groups are compared here (newspapers: low, N = 213; high, N = 275; TV: low, N 232; high, N 256).
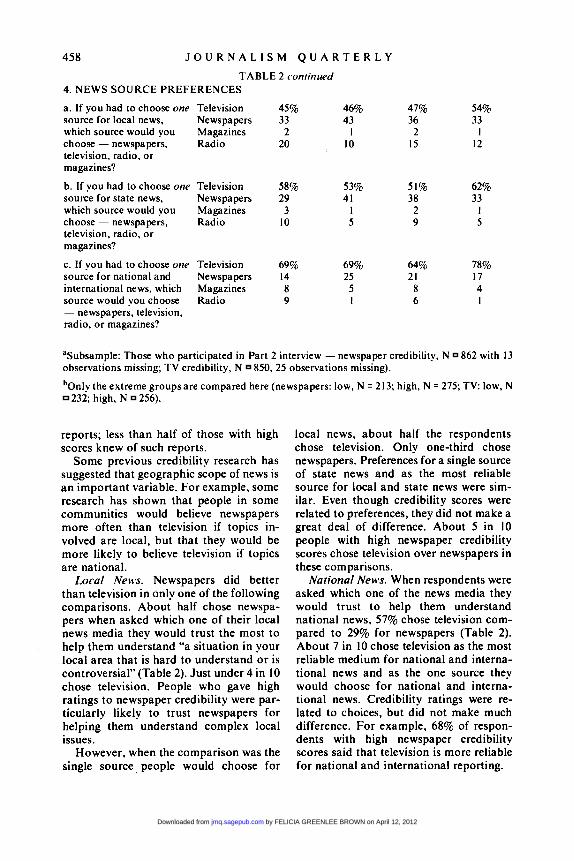
reports; less than half of those with high scores knew of such reports.
Some previous credibility research has suggested that geographic scope of news is a n important variable. For example, some research has shown that people in some communities would believe newspapers more often than television if topics in- volved are local, but that they would be more likely to believe television if topics are national.
Local News. Newspapers did better than television in only one of the following comparisons. About half chose newspa- pers when asked which one of their local news media they would trust the most to help them understand “a situation in your local area that is hard to understand or is controversial” (Table 2). Just under 4 in 10 chose television. People who gave high ratings t o newspaper credibility were par- ticularly likely to trust newspapers for helping them understand complex local issues.
However, when the comparison was the single source people would choose for
local news, about half the respondents chose television. Only one-third chose newspapers. Preferences for a single source of state news and as the most reliable source for local and state news were sim- ilar. Even though credibility scores were related to preferences, they did not make a great deal of difference. About 5 in 10 people with high newspaper credibility scores chose television over newspapers in these comparisons.
National News. When respondents were asked which one of the news media they would trust to help them understand national news, 57% chose television com- pared to 29% for newspapers (Table 2). About 7 in 10 chose television as the most reliable medium for national and interna- tional news and as the one source they would choose for national and interna- tional news. Credibility ratings were re- lated to choices, but did not make much difference. For example, 68% of respon- dents with high newspaper credibility scores said that television is more reliable for national and international reporting.
by FELICIA GREENLEE BROWN on April 12, 2012jmq.sagepub.comDownloaded from
Measuring the Concept of Credibility
It is noteworthy that the credibility of television increases as the focus moves from local to state to national and interna- tional for each of these measures.
Overall, if respondents had to choose just one way of getting news and informa- tion, 64% would rather get it on T V or radio and 36% would rather read it in print. Even a majority of frequent news- paper readers preferred broadcast. Giving high credibility scores to newspapers did not have much influence on preferences for newspapers or magazines, but giving high scores to television did affect prefer- ences for television or radio. Even among people who rated newspaper credibility high, 59% preferred broadcast media. This is almost as high a proportion as those rating newspaper credibility low who pre- ferred broadcast (64%).
Coverage of Specific Topics Survey respondents gave daily newspa-
pers and television high marks for their reliability overall, the quality of their reporting and their coverage of controver- sial issues. However, evaluations differed among specific topics.
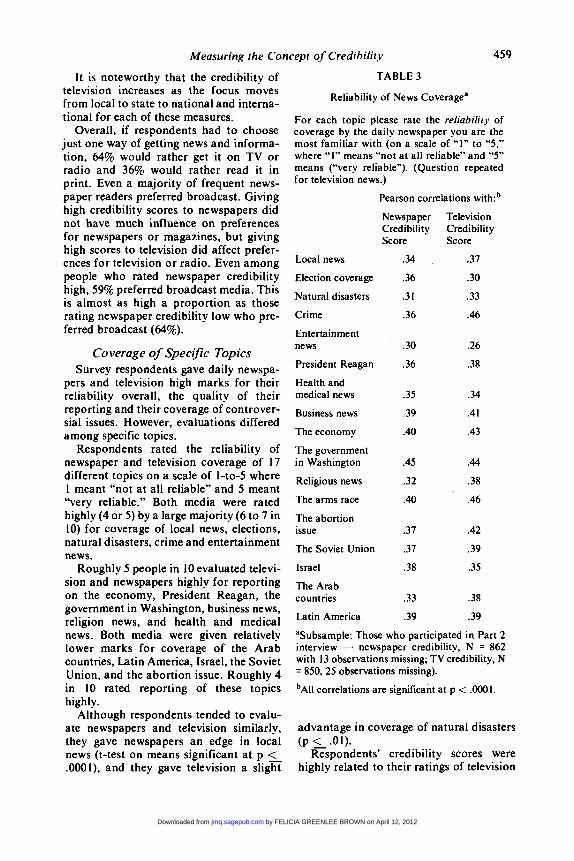
Respondents rated the reliability of newspaper and television coverage of 17 different topics on a scale of I-to-5 where I meant “not a t all reliable” and 5 meant “very reliable.” Both media were rated highly (4 or 5) by a large majority (6 to 7 in 10) for coverage of local news, elections, natural disasters, crime and entertainment news.
Roughly 5 people in 10 evaluated televi- sion and newspapers highly for reporting on the economy, President Reagan, the government in Washington, business news, religion news, and health and medical news. Both media were given relatively lower marks for coverage of the Arab countries, Latin America, Israel, the Soviet Union, and the abortion issue. Roughly 4 in 10 rated reporting of these topics highly.
Although respondents tended to evalu- ate newspapers and television similarly, they gave newspapers a n edge in local news (t-test on means significant a t p <_ .OOOl), and they gave television a slight
459
TABLE 3
Reliability of News Coveragea
For each topic please rate the reliabiliry of coverage by the daily newspaper you are the most familiar with (on a scale of “1’ to “5,” where “ I ” means “not at all reliable” and “5” means (“very reliable”). (Question repeated for television news.)
Pearson correlations with:b
Local news
Election coverage
Natural disasters
Crime
Entertainment news
President Reagan
Health and medical news
Business news
The economy
The government in Washington
Religious news
The arms race
The abortion issue
The Soviet Union
Israel
The Arab countries
Latin America
Newspaper Credibility Score
.34
.36
.3 I
.36
.30
.36
.35
.39
.40
.45
.32
.40
.37
.37
.38
.33
.39
Television Credibility score
.31
.30
.33
.46
.26
.38
.34
.4 I
.43
.44
.38
.46
.42
.39
.35
.38
.39
aSubsarnple: Those who participated in Part 2 interview - newspaper credibility, N = 862 with 13 observations missing; TV credibility, N = 850, 25 observations missing).
b~~~ correlations are significant at p < .OOOI.
advantage in coverage of natural disasters
Respondents’ credibility scores were highly related to their ratings of television
(P <_ .01).
by FELICIA GREENLEE BROWN on April 12, 2012jmq.sagepub.comDownloaded from
460 J O U R N A L I S M and newspaper coverage of these topics. Correlations between television and news- paper credibility scores and evaluations ranged between .26 and .46, all of which were statistically significant at p 2 .0001 (Table 3).
Responsible Exercise of Rights Respondents appeared to be the most
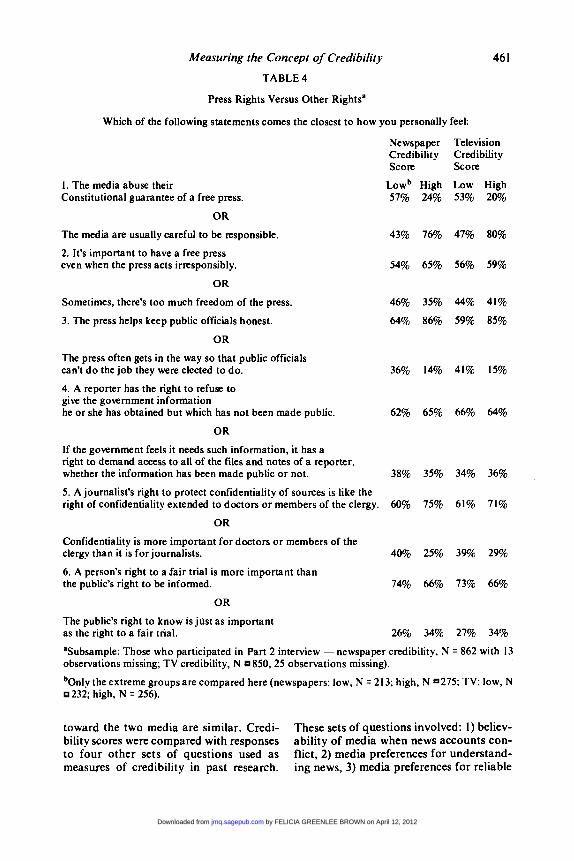
supportive of press freedoms when the press was seen as a watchdog over government. They took the strongest posi- tions on limiting freedom of the press when the press was seen as an institution which tramples on other people’s rights and takes advantage of the ordinary citi- zen. A substantial minority, 4 in 10 respondents, showed a desire for curbs on freedom of the press. This minority dis- agreed that the media exercise their right to freedom of expression responsibly and that it is important to maintain a free press. A similar number agreed that the government has a right to demand access to all of the files and notes of a reporter, whether the information has been made public or not.
Newspaper credibility ratings were neg- atively related to agreement with the statement that “sometimes, there’s too much freedom of the press,’’ but television credibility ratings were not. Both newspa- per and television credibility ratings were negatively correlated with agreement with the statement that “the media abuse their Constitutional guarantee of a free press” (Table 4). However, there was no relation- ship between credibility scores and atti- tudes toward a reporter’s right to maintain confidentiality of information not yet made public.
The minority who took a critical view of press rights was smallest when the issue was whether or not the press oversteps bounds in its role as a watchdog over pub- lic officials. One-fourth said that the press often gets in the way so that public offi- cials cannot do the job they were elected to do. All the others subscribed to the view that the press helps keep public officials honest. Television and newspaper credibil- ity ratings were negatively related to press criticism.
Q U A R T E R L Y More than two-thirds of people inter-
viewed agreed that a journalist’s right to protect confidentiality of sources is like the right of confidentiality extended to doctors or members of the clergy. News- paper and television credibility scores were related to holding this view.
When the issue was the rights of ordi- nary people versus the rights of the press, people surveyed were much less likely to favor the press. Seven in 10 said that a person’s right to a fair trial outweighed the public’s right to be informed. Further, 7 in 10 agreed with a more strongly worded statement: “The news media often make people accused of crimes look guilty before they are tried in court.”
People giving high credibility scores to television and newspapers were almost as likely as those giving low scores to support the right to a fair trial over the public’s right to be informed and to agree that the news media often make people accused of crimes look guilty before trial.
Summary and Conclusions This article highlighted research ques-
tions in four areas: I ) insights into dimen- sions of credibility, 2) people’s ability to differentiate well between news in news- papers and news in other media, especially television, with regard to credibility, 3) credibility problems in particular coverage areas, and 4) the relationship between credibility and attitudes toward First Amendment issues.
Dimensions of Credibility: First, a fac- tor analysis showed that 12 items grouped together in a credibility factor (for exam- ple, being fair, unbiased, trustworthy, complete, factual, and accurate). News- paper and television credibility scores were created, based on scores on the 12 items. (The Gannett Center asked these same questions for newspapers, replicat- ing evaluations in all but one. Respon- dents in the two communities surveyed rated their newspapers lower on being fac- tual. The Times Mirror also replicated the morality finding for ”news organizations.”)
Since the two scores were correlated, this suggests that many people’s attitudes
by FELICIA GREENLEE BROWN on April 12, 2012jmq.sagepub.comDownloaded from
Measuring the Concept of Credibility
TABLE 4
Press Rights Versus Other Rightsa
Which of the following statements comes the closest to how you personally feel
46 I
1. The media abuse their Constitutional guarantee of a free press.
OR
The media are usually careful to be responsible.
2. It’s important to have a free press even when the press acts irresponsibly.
OR
Sometimes, there’s too much freedom of the press.
3. The press helps keep public officials honest.
OR
The press often gets in the way so that public officials can’t do the job they were elected to do.
4. A reporter has the right to refuse to give the government information he or she has obtained but which has not been made public.
OR
If the government feels it needs such information, it has a right to demand access to all of the files and notes of a reporter, whether the information has been made public or not.
Newspaper Television Credibility Credibility score score
Lowb High Low High 57% 24% 53% 20%
43% 76% 47% 80%
54% 65% 56% 59%
46% 35% 44% 41%
64% 86% 59% 85%
36% 14% 41% 15%
62% 65% 66% 64%
38% 35% 34% 36%
5. A journalist’s right to protect confidentiality of sources is like the right of confidentiality extended to doctors or members of the clergy. 60% 75% 61% 71%
OR
Confidentiality is more important for doctors or members of the clergy than it is forjournalists. 40% 25% 39% 29%
6. A person’s right to afair trial is more important than the public’s right to be informed. 74% 66% 73% 66%
OR
The public’s right to know is just as important as the right to a fair trial. 26% 34% 27% 34%
aSubsample: Those who participated in Part 2 interview - newspaper credibility, N observations missing; TV credibility, N 850, 25 observations missing).
232; high, N = 256).
862 with 13
the extreme groups are compared here (newspapers: low, N = 213; high, N 275; TV: low, N
toward the two media are similar. Credi- bility scores were compared with responses to four other sets of questions used as measures of credibility in past research.
These sets of questions involved: 1) believ- ability of media when news accounts con- flict, 2) media preferences for understand- ing news, 3) media preferences for reliable
by FELICIA GREENLEE BROWN on April 12, 2012jmq.sagepub.comDownloaded from
462 J O U R N A L I S M
coverage, and 4) news source preferences for local, state, and national news.
Differentiating Among Media: In every comparison, high credibility scores were related to choice of newspapers over other media. Similarly, high television credibil- ity scores were related to selection of tele- vision over other media. However, in
(every comparison except one, television tdid better than other media, and prefer- lence for television increased as geographic scope moved from local to state to nation- a l / international news. Despite high news- paper credibility scores, many respondents were more likely to choose television when forced to choose among media. The exceptional comparison was media prefer- ence for understanding a complex or con- troversial local topic. In that case, half the sample chose newspapers.
Particular Coverage Areas: Although respondents evaluated daily newspapers and television highly for overall reliability, reporting quality, and coverage of contro- versial issues, evaluations varied with regard to 17 topics. Both media received similar marks except that newspapers did
Q U A R T E R L Y
slightly better on local news and television did slightly better on coverage of natural disasters. Credibility scores were highly correlated with ratings of newspaper and television coverage of all I7 topics.
First Amendment Issues: Respondents were most likely t o support press freedoms when media serve as watchdogs over government. They were least likely to sup- port First Amendment rights when the rights of ordinary people are a t stake. These results are supported by findings of the Gannett Center studies and the Times Mirror study. (The Los Angeles Times Poll found lower belief that the press exer- cises its privileges responsibly than the ASNE study did.)
Although people’s stands on newspaper and television credibility frequently were related to their attitudes toward press freedoms, this was not so with regard to the rights of ordinary citizens to receive a fair trial. People’s strong support of the press when it needs to keep information and sources confidential also did not depend on credibility ratings.
Third Class Mail Does Well Low-cost third-class mail sorted by postal carrier route is delivered
nearly as quickly as more expensive first-class mail nationwide, accord- ing to research conducted for the American Newspaper Publishers Association (ANPA).
The results were obtained from a five-city test completed for the ANPA in Wilmington, Del.; Oakland, Calif.; Sherman, Texas; Law- rence, Kan., and Madison, Wis. by Ruder Finn & Rotman, a n indepen- dent communications and research firm.
Nationally, it took two days after mailing to achieve delivery of 97.5% of the first-class mail, compared to three days for delivery of 97% of third-class mail sorted by carrier route.
The first-class envelopes required nearly seven times the postage as the identical materials in the third-class envelopes.
“Third-class rates d o not reflect fairly the cost of delivering third-class presorted mail. A first-class letter weighing three ounces sent by a pri- vate citizen or a business costs 56 cents for virtually the same service that costs a direct-mail marketing firm just over eight cents to send third- class,” said Sandra C. Hardy, chairman of ANPA’s Postal Committee. Hardy is vice president, Calkins Newspapers, Levittown, Pa.
“The Postal Service should be congratulated for its performance in these tests. It got the mail delivered on time in nearly every case. Our question is why it chooses to underprice its good work in third-class mail,” Hardy said.
by FELICIA GREENLEE BROWN on April 12, 2012jmq.sagepub.comDownloaded from