Embed Size (px)
Citation preview
Aviation CIP | Commission Study Session
October 13, 2020
1

Strategic Process
Aviation CIP Funding Plan
Recently Proposed Projects
Peer Review Recommendations
2
Agenda

Strategic Process
Lance Lyttle, Aviation Managing Director
3

Strategy To Budget ProcessCentury Agenda
Vision/Goals
SWOT
Gap
Objectives & KPIs
2021 Business Plan
2021 Budget
2021 Performance Plans
4
Stra
tegi
c Pl
anni
ngIm
plem
enta
tion
Annual
3 – 5 Years
5- 10 Years

SEA Strategic Priorities: Vision/Goals
5
AV Priorities Vision/Long-term Goals1. Health and Safety Annually reduce major ground incidents by 5%
100% of employees go home safely, achieve 95% safety evaluation score annually2. Security Zero discrepancies on TSA audit
Zero breaches, zero discovery of prohibited items in sterile area, zero incidents of intentional harm3. Employees 75% of Aviation employees measure high engagement scores4. Community All Part 150 commitments met, additional noise reduction measures explored and implemented5. Innovation Lean and process improvements are ingrained in Port's culture6. Social Responsibility Sustainable share of Port economic opportunities go to disadvantaged businesses7. Customer Skytrax 5-Star ranking; Top 10 ASQ U.S. mega-hub airports (25 in pool) Experience 45 minutes from clocktower through security checkpoint
Reduce international to domestic minimum connect times to 75 minutes30 year-round int'l services over 2,000 miles by 2025
8. Environment & Achieve Port goals for green house gas emissions for 2030 and 2050 Sustainability Sustainable Aviation Fuel 10% of jet fuel used at SEA by 20289. Financial Port can operate, maintain and upgrade facilities to accommodate regional demand while Sustainability maintaining competitive CPE, manageable debt levels, and adequate debt service coverage 10. Asset Management Provide facilities to meet demand for passenger and cargo service Capital Development Achieve critical asset uptime of 99% & Delivery Provide optimum level of service (at peak times)

6
Terminal Industry Level of Service Metrics• International Air Transport Association (IATA) service standards used to
determine many terminal requirements

7
Terminal Industry Level of Service MetricsRequirements Development

8Slide added on 10/12/2020

Funding
Borgan Anderson, Director Aviation Finance & Budget
9
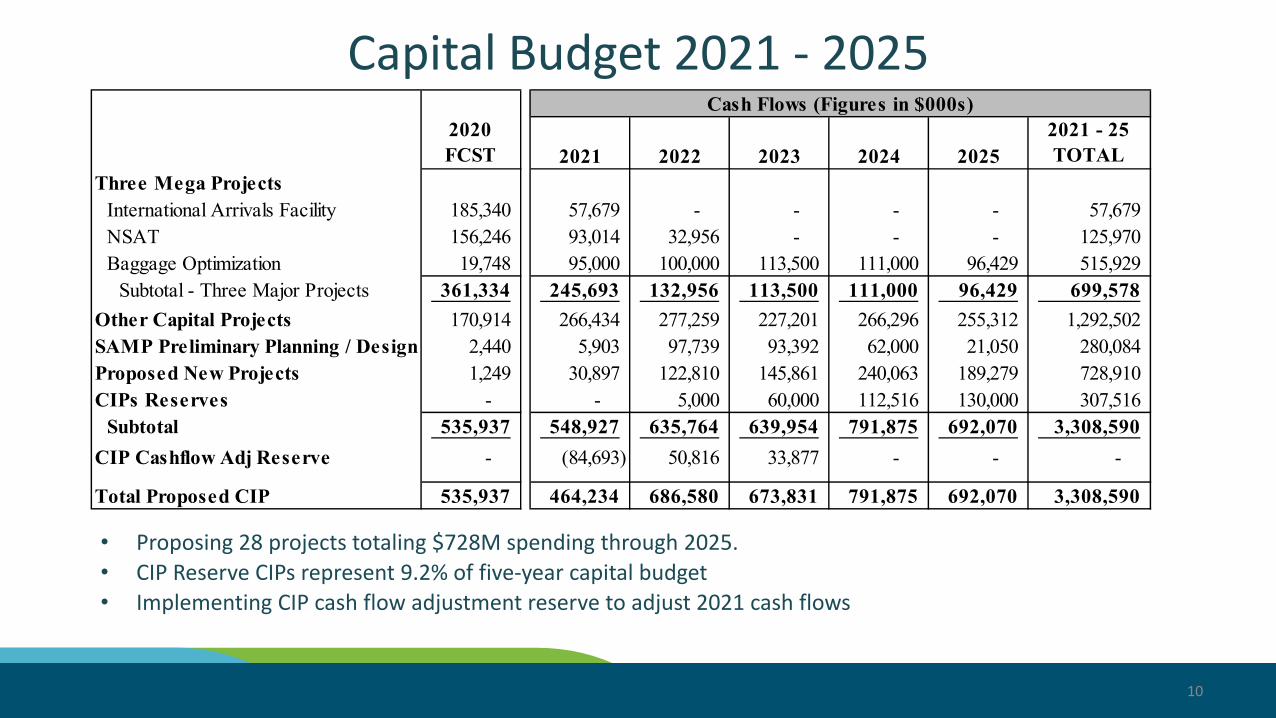
Capital Budget 2021 - 2025
• Proposing 28 projects totaling $728M spending through 2025. • CIP Reserve CIPs represent 9.2% of five-year capital budget• Implementing CIP cash flow adjustment reserve to adjust 2021 cash flows
10
2020FCST 2021 2022 2023 2024 2025
2021 - 25 TOTAL
Three Mega ProjectsInternational Arrivals Facility 185,340 57,679 - - - - 57,679 NSAT 156,246 93,014 32,956 - - - 125,970 Baggage Optimization 19,748 95,000 100,000 113,500 111,000 96,429 515,929
Subtotal - Three Major Projects 361,334 245,693 132,956 113,500 111,000 96,429 699,578 Other Capital Projects 170,914 266,434 277,259 227,201 266,296 255,312 1,292,502 SAMP Preliminary Planning / Design 2,440 5,903 97,739 93,392 62,000 21,050 280,084 Proposed New Projects 1,249 30,897 122,810 145,861 240,063 189,279 728,910 CIPs Reserves - - 5,000 60,000 112,516 130,000 307,516
Subtotal 535,937 548,927 635,764 639,954 791,875 692,070 3,308,590 CIP Cashflow Adj Reserve - (84,693) 50,816 33,877 - - -
Total Proposed CIP 535,937 464,234 686,580 673,831 791,875 692,070 3,308,590
Cash Flows (Figures in $000s)
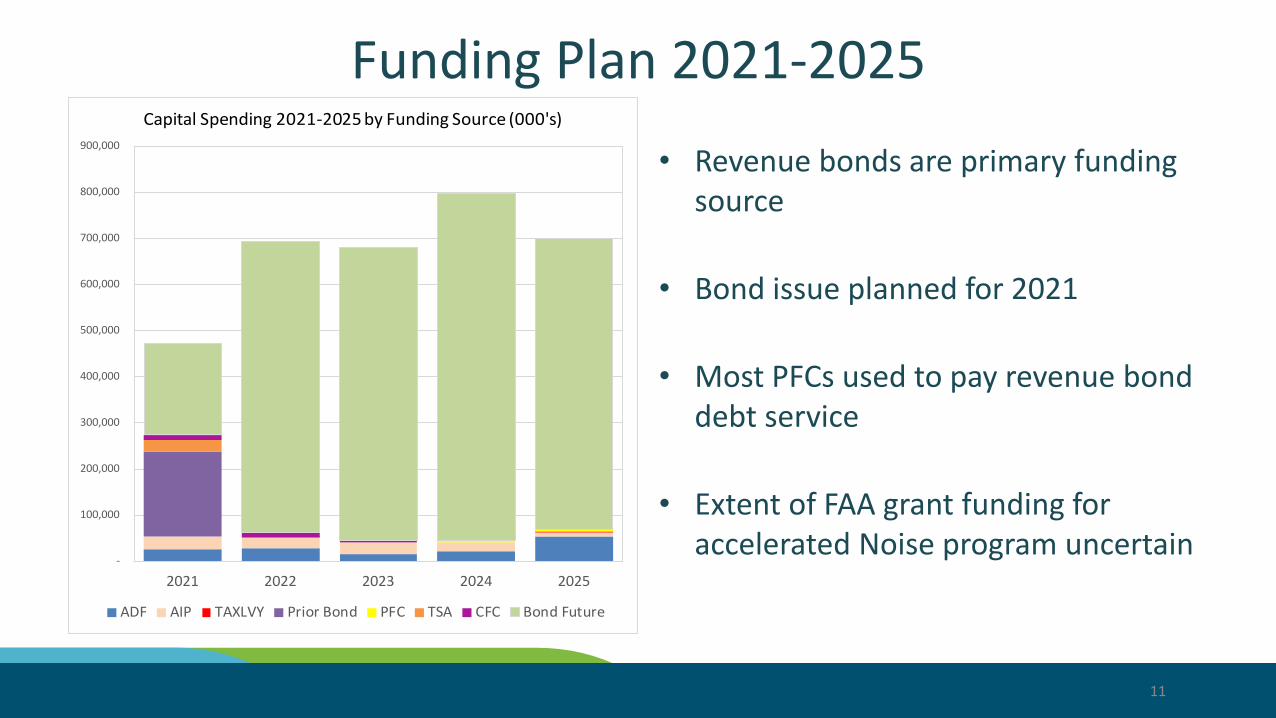
Funding Plan 2021-2025
• Revenue bonds are primary funding source
• Bond issue planned for 2021
• Most PFCs used to pay revenue bond debt service
• Extent of FAA grant funding for accelerated Noise program uncertain
11
-
100,000
200,000
300,000
400,000
500,000
600,000
700,000
800,000
900,000
2021 2022 2023 2024 2025
Capital Spending 2021-2025 by Funding Source (000's)
ADF AIP TAXLVY Prior Bond PFC TSA CFC Bond Future

MII Provisions of Airline Lease Agreement• Signatory Lease and Operating Agreement (SLOA) IV defines majority-in-interest
(MII) as airlines with 55% of number and 55% of revenues by aeronautical cost center (meeting eligibility criterion of minimum annual landed weight)
• SLOA IV allows airlines to vote to disapprove a project (negative MII) with aeronautical rate base cost ≥ $10 million.
• Negative vote (disapproval) cannot stop a project but can delay a project by 12 months
• If cost of project grows by more than 10% prior to Port electing to proceed with construction, another MII vote may be required
• Projects meeting certain criteria are exempt from MII vote
12
CIP Recently Proposed Projects
Keri Stephens, Aviation Capital Programs Manager
13

Zones 6&7 Renovation
14

Airline Realignment
15

Lounges
16

Peer Review
Jeffrey Brown, Aviation Chief Operating Officer
17

Peer Review Participating Airports
18
• Airport Authority Jamaica (AAJ)• Hartsfield Jackson Atlanta Intl Airport (ATL)• Denver International Airport (DEN)• Dallas/Fort Worth International Airport (DFW)• Fort Lauderdale/Hollywood Intl Airport (FLL)• Greater Orlando Airport Authority (MCO)• Los Angeles World Airports (LAX)• Port Authority New York/New Jersey (LGA)• Portland International Airport (PDX)• San Francisco International Airport (SFO)• San Diego Airport Authority (SAN)• Executive Review Panel (ERP)

Peer Review Recommendations• Present the Vision• Organizational Structure• CIP Delivery Methods• Process Improvements• Improve program controls
– Reporting and information flow– Cost estimating– Scheduling
19

Peer Review – Next Steps• Engage Port HR and ERP
• Implementation
20

APPENDIX
21
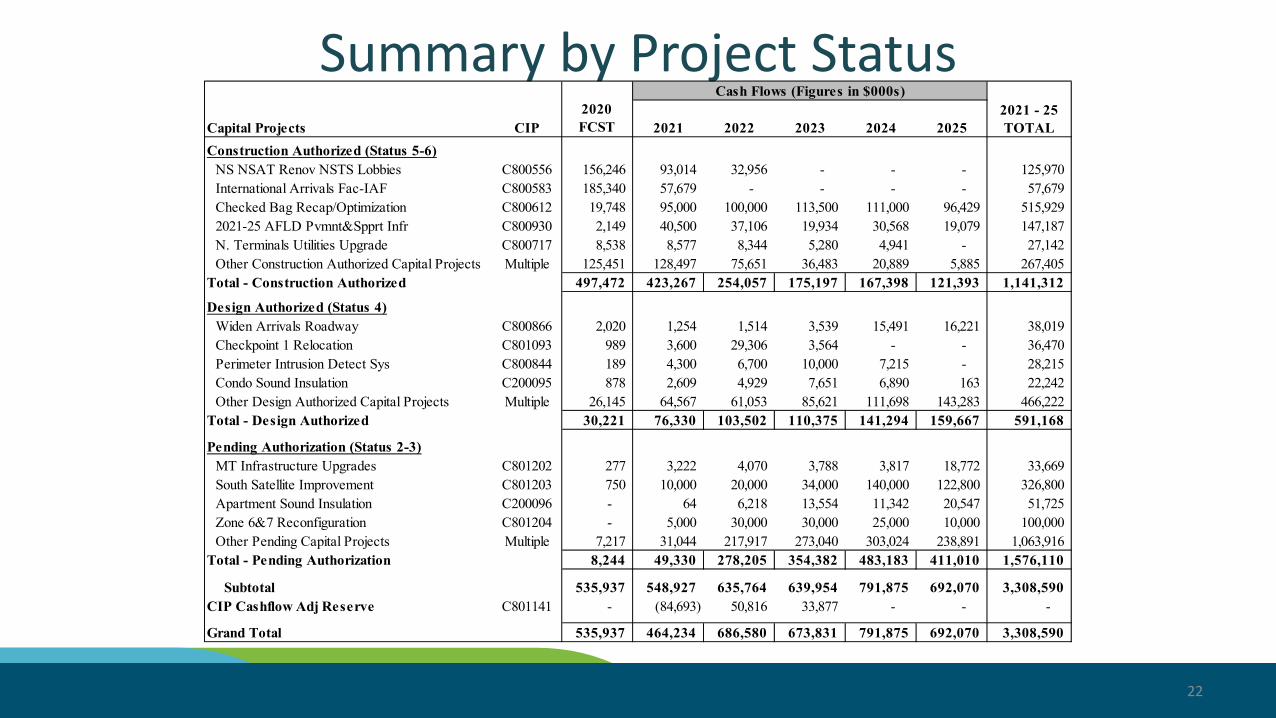
Summary by Project Status
22
Capital Projects CIP2020FCST 2021 2022 2023 2024 2025
Construction Authorized (Status 5-6)NS NSAT Renov NSTS Lobbies C800556 156,246 93,014 32,956 - - - 125,970 International Arrivals Fac-IAF C800583 185,340 57,679 - - - - 57,679 Checked Bag Recap/Optimization C800612 19,748 95,000 100,000 113,500 111,000 96,429 515,929 2021-25 AFLD Pvmnt&Spprt Infr C800930 2,149 40,500 37,106 19,934 30,568 19,079 147,187 N. Terminals Utilities Upgrade C800717 8,538 8,577 8,344 5,280 4,941 - 27,142 Other Construction Authorized Capital Projects Multiple 125,451 128,497 75,651 36,483 20,889 5,885 267,405
Total - Construction Authorized 497,472 423,267 254,057 175,197 167,398 121,393 1,141,312
Design Authorized (Status 4)Widen Arrivals Roadway C800866 2,020 1,254 1,514 3,539 15,491 16,221 38,019 Checkpoint 1 Relocation C801093 989 3,600 29,306 3,564 - - 36,470 Perimeter Intrusion Detect Sys C800844 189 4,300 6,700 10,000 7,215 - 28,215 Condo Sound Insulation C200095 878 2,609 4,929 7,651 6,890 163 22,242 Other Design Authorized Capital Projects Multiple 26,145 64,567 61,053 85,621 111,698 143,283 466,222
Total - Design Authorized 30,221 76,330 103,502 110,375 141,294 159,667 591,168
Pending Authorization (Status 2-3)MT Infrastructure Upgrades C801202 277 3,222 4,070 3,788 3,817 18,772 33,669 South Satellite Improvement C801203 750 10,000 20,000 34,000 140,000 122,800 326,800 Apartment Sound Insulation C200096 - 64 6,218 13,554 11,342 20,547 51,725 Zone 6&7 Reconfiguration C801204 - 5,000 30,000 30,000 25,000 10,000 100,000 Other Pending Capital Projects Multiple 7,217 31,044 217,917 273,040 303,024 238,891 1,063,916
Total - Pending Authorization 8,244 49,330 278,205 354,382 483,183 411,010 1,576,110
Subtotal 535,937 548,927 635,764 639,954 791,875 692,070 3,308,590 CIP Cashflow Adj Reserve C801141 - (84,693) 50,816 33,877 - - -
Grand Total 535,937 464,234 686,580 673,831 791,875 692,070 3,308,590
Cash Flows (Figures in $000s)2021 - 25 TOTAL

Major Projects
23
Estimated Cost 2021 2022 2023 2024 2025
2021 - 25 TOTAL
SSAT Renovation/Renewal 1,000,000 10,000 20,000 34,000 140,000 122,800 326,800 IAF 931,445 57,679 - - - - 57,679 Baggage Optimization 839,584 95,000 100,000 113,500 111,000 96,429 515,929 NSAT 691,916 93,014 32,956 - - - 125,970 MT Infrastructure Upgrades 350,000 3,222 4,070 3,788 3,817 18,772 33,669 Noise Programs 344,055 10,322 13,409 26,075 27,376 30,340 107,522 C1 Building 340,000 8,798 9,637 20,705 60,814 118,449 218,403 SAMP Planning 300,000 5,903 97,739 93,392 62,000 21,050 280,084 Airfield pavement 153,500 40,500 37,106 19,934 30,568 21,050 149,158 Zone 6&7 Reconfiguration 100,000 5,000 30,000 30,000 25,000 10,000 100,000 MT Low Voltage 86,760 7,258 12,372 21,814 22,608 16,152 80,204 Upgrade STS 76,000 4,494 10,238 26,084 27,326 7,157 75,299 CIPs Reserves - 5,000 60,000 112,516 130,000 307,516 Other Capital Projects 123,044 314,053 224,539 168,850 99,871 930,357 Total 5,213,260 464,234 686,580 673,831 791,875 692,070 3,308,590
Cash Flows (Figures in $000s)
Major Projects
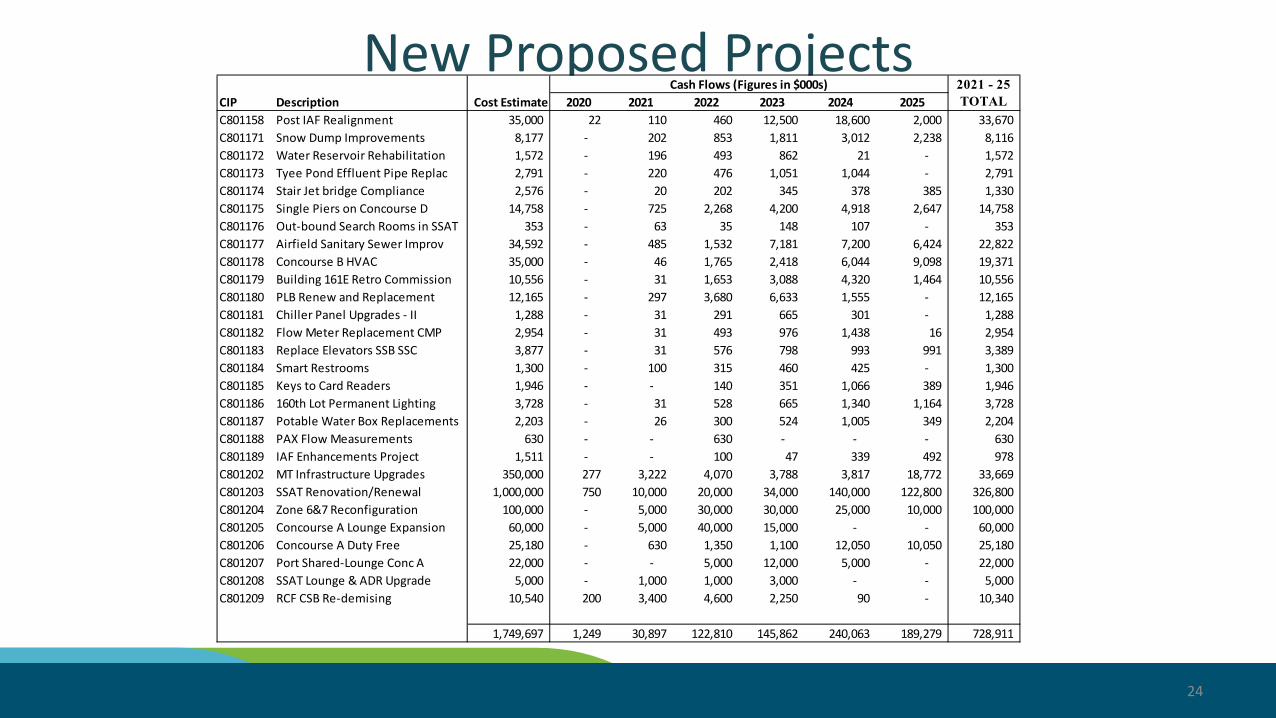
New Proposed Projects
24
CIP Description Cost Estimate 2020 2021 2022 2023 2024 2025C801158 Post IAF Realignment 35,000 22 110 460 12,500 18,600 2,000 33,670 C801171 Snow Dump Improvements 8,177 - 202 853 1,811 3,012 2,238 8,116 C801172 Water Reservoir Rehabilitation 1,572 - 196 493 862 21 - 1,572 C801173 Tyee Pond Effluent Pipe Replac 2,791 - 220 476 1,051 1,044 - 2,791 C801174 Stair Jet bridge Compliance 2,576 - 20 202 345 378 385 1,330 C801175 Single Piers on Concourse D 14,758 - 725 2,268 4,200 4,918 2,647 14,758 C801176 Out-bound Search Rooms in SSAT 353 - 63 35 148 107 - 353 C801177 Airfield Sanitary Sewer Improv 34,592 - 485 1,532 7,181 7,200 6,424 22,822 C801178 Concourse B HVAC 35,000 - 46 1,765 2,418 6,044 9,098 19,371 C801179 Building 161E Retro Commission 10,556 - 31 1,653 3,088 4,320 1,464 10,556 C801180 PLB Renew and Replacement 12,165 - 297 3,680 6,633 1,555 - 12,165 C801181 Chiller Panel Upgrades - II 1,288 - 31 291 665 301 - 1,288 C801182 Flow Meter Replacement CMP 2,954 - 31 493 976 1,438 16 2,954 C801183 Replace Elevators SSB SSC 3,877 - 31 576 798 993 991 3,389 C801184 Smart Restrooms 1,300 - 100 315 460 425 - 1,300 C801185 Keys to Card Readers 1,946 - - 140 351 1,066 389 1,946 C801186 160th Lot Permanent Lighting 3,728 - 31 528 665 1,340 1,164 3,728 C801187 Potable Water Box Replacements 2,203 - 26 300 524 1,005 349 2,204 C801188 PAX Flow Measurements 630 - - 630 - - - 630 C801189 IAF Enhancements Project 1,511 - - 100 47 339 492 978 C801202 MT Infrastructure Upgrades 350,000 277 3,222 4,070 3,788 3,817 18,772 33,669 C801203 SSAT Renovation/Renewal 1,000,000 750 10,000 20,000 34,000 140,000 122,800 326,800 C801204 Zone 6&7 Reconfiguration 100,000 - 5,000 30,000 30,000 25,000 10,000 100,000 C801205 Concourse A Lounge Expansion 60,000 - 5,000 40,000 15,000 - - 60,000 C801206 Concourse A Duty Free 25,180 - 630 1,350 1,100 12,050 10,050 25,180 C801207 Port Shared-Lounge Conc A 22,000 - - 5,000 12,000 5,000 - 22,000 C801208 SSAT Lounge & ADR Upgrade 5,000 - 1,000 1,000 3,000 - - 5,000 C801209 RCF CSB Re-demising 10,540 200 3,400 4,600 2,250 90 - 10,340
1,749,697 1,249 30,897 122,810 145,862 240,063 189,279 728,911
Cash Flows (Figures in $000s) 2021 - 25 TOTAL

Proposed New Projects
25
# of CostProjects Description Estimate 2021 2022 2023 2024 2025
9 Renewal and replacement 1,102,635 10,978 30,290 56,283 162,856 141,142 401,549 10 Business Need 254,349 11,871 79,383 74,772 62,754 23,706 252,486 8 Regulatory and Contractual 390,767 8,048 12,997 14,455 13,387 24,042 72,929 1 Safety/Security 1,946 - 140 351 1,066 389 1,946
28 TOTAL 1,749,697 30,897 122,810 145,861 240,063 189,279 728,910
Cash Flows (Figures in $000s) 2021 - 25 TOTAL
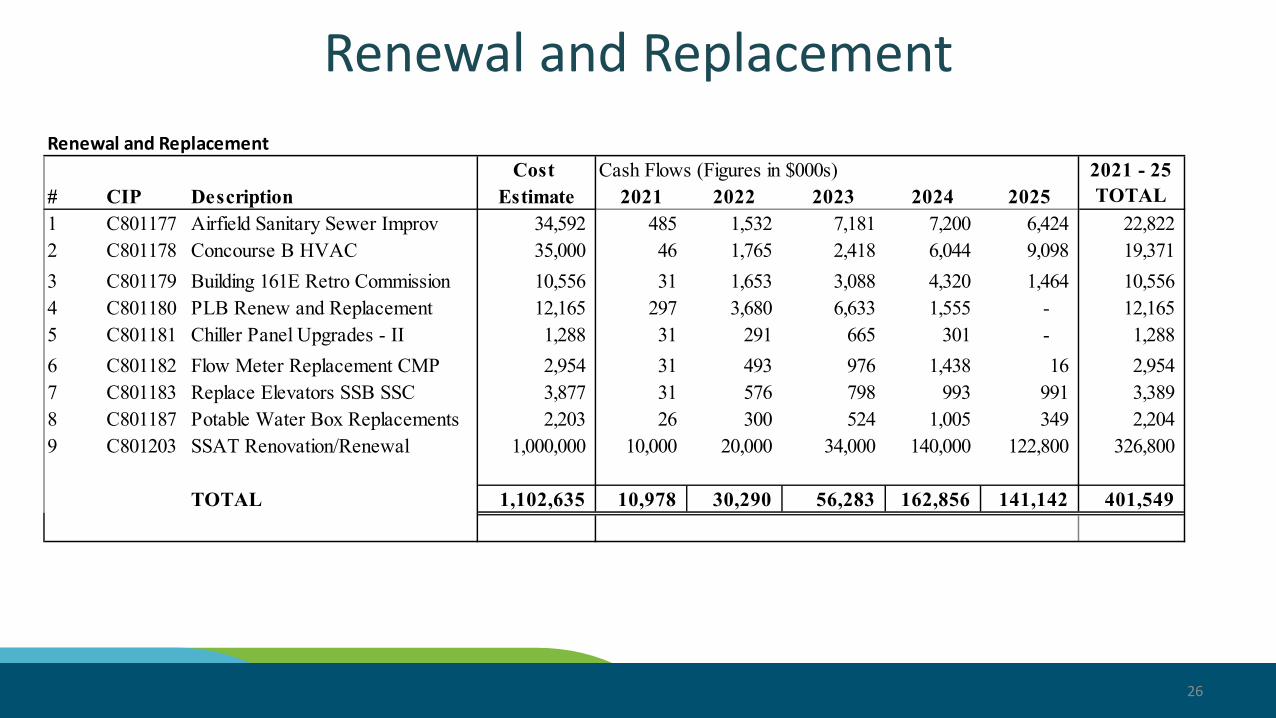
Renewal and Replacement
26
Renewal and ReplacementCost
# CIP Description Estimate 2021 2022 2023 2024 20251 C801177 Airfield Sanitary Sewer Improv 34,592 485 1,532 7,181 7,200 6,424 22,822 2 C801178 Concourse B HVAC 35,000 46 1,765 2,418 6,044 9,098 19,371 3 C801179 Building 161E Retro Commission 10,556 31 1,653 3,088 4,320 1,464 10,556 4 C801180 PLB Renew and Replacement 12,165 297 3,680 6,633 1,555 - 12,165 5 C801181 Chiller Panel Upgrades - II 1,288 31 291 665 301 - 1,288 6 C801182 Flow Meter Replacement CMP 2,954 31 493 976 1,438 16 2,954 7 C801183 Replace Elevators SSB SSC 3,877 31 576 798 993 991 3,389 8 C801187 Potable Water Box Replacements 2,203 26 300 524 1,005 349 2,204 9 C801203 SSAT Renovation/Renewal 1,000,000 10,000 20,000 34,000 140,000 122,800 326,800
TOTAL 1,102,635 10,978 30,290 56,283 162,856 141,142 401,549
Cash Flows (Figures in $000s) 2021 - 25 TOTAL

Business Need
27
Business NeedCost
# CIP Description Estimate 2021 2022 2023 2024 20251 C801184 Smart Restrooms 1,300 100 315 460 425 - 1,300 2 C801188 PAX Flow Measurements 630 - 630 - - - 630 3 C801189 IAF Enhancements Project 1,511 - 100 47 339 492 978 4 C801158 Post IAF Realignment 35,000 110 460 12,500 18,600 2,000 33,670 5 C801204 Zone 6&7 Reconfiguration 100,000 5,000 30,000 30,000 25,000 10,000 100,000 6 C801205 Concourse A Lounge Expansion 60,000 5,000 40,000 15,000 - - 60,000 7 C801206 Concourse A Duty Free 25,180 630 1,350 1,100 12,050 10,050 25,180 8 C801207 Port Shared-Lounge Conc A 22,000 - 5,000 12,000 5,000 - 22,000 9 C801208 SSAT Lounge & ADR Upgrade 5,000 1,000 1,000 3,000 - - 5,000 10 C801186 160th Lot Permanent Lighting 3,728 31 528 665 1,340 1,164 3,728
TOTAL 254,349 11,871 79,383 74,772 62,754 23,706 252,486
Cash Flows (Figures in $000s) 2021 - 25 TOTAL

Regulatory and Contractual
28
Regulatory and ContractualCost
# CIP Description Estimate 2021 2022 2023 2024 20251 C801171 Snow Dump Improvements 8,177 202 853 1,811 3,012 2,238 8,116 2 C801172 Water Reservoir Rehabilitation 1,572 196 493 862 21 - 1,572 3 C801173 Tyee Pond Effluent Pipe Replac 2,791 220 476 1,051 1,044 - 2,791 4 C801174 Stair Jet bridge Compliance 2,576 20 202 345 378 385 1,330 5 C801175 Single Piers on Concourse D 14,758 725 2,268 4,200 4,918 2,647 14,758 6 C801176 Out-bound Search Rooms in SSAT 353 63 35 148 107 - 353 7 C801209 RCF CSB Re-demising 10,540 3,400 4,600 2,250 90 - 10,340
8 C801202 MT Infrastructure Upgrades 350,000 3,222 4,070 3,788 3,817 18,772 33,669
TOTAL 390,767 8,048 12,997 14,455 13,387 24,042 72,929
Cash Flows (Figures in $000s) 2021 - 25 TOTAL

Safety
29
SafetyCost
# CIP Description Estimate 2021 2022 2023 2024 20251 C801185 Keys to Card Readers 1,946 - 140 351 1,066 389 1,946
TOTAL 1,946 - 140 351 1,066 389 1,946
Cash Flows (Figures in $000s) 2021 - 25 TOTAL

Projects Deferred
30