Embed Size (px)
Citation preview

Avago HDJD-JD02Development Kit
ICM Program User Guide
WARNING: This product is non RoHS compliant
2
Table of Contents
Disclaimer, Warning, Credits 2
1.0 Introduction 3
2.0 Startup 4
3.0 Color Sensor Module 5
4.0 Hardware Setup & Configuration 9
5.0 PC Software Description 11
6.0 PC Software Operation – For Transmissive Only 12
7.0 PC Software Operation – For Reflective Only 14
8.0 Appendix - Transmissive sensing kit gain selection guide 25
Copyright © 2005 Avago Technologies, Inc. All Rights Reserved.Avago grants you (“Licensee”) a non-exclusive, royalty free,license to use this software in binary code form.
Disclaimer, Warning & Credits
DisclaimerTO THE EXTENT ALLOWED BY LOCAL LAW, THIS SOFTWARE ISPROVIDED TO YOU ‘AS IS’ WITHOUT WARRANTIES ORCONDITIONS OF ANY KIND, WHETHER ORAL OR WRITTEN,EXPRESS OR IMPLIED. AVAGO SPECIFICALLY DISCLAIMS ANYIMPLIED WARRANTIES OR CONDITIONS OF MERCHANT-ABILITY, SATISFACTORY QUALITY, NON-INFRINGEMENT ANDFITNESS FOR A PARTICULAR PURPOSE. SOME JURISDICTIONSDO NOT ALLOW EXCLUSIONS OF IMPLIED WARRANTIES ORCONDITIONS, SO THE ABOVE EXCLUSION MAY NOT APPLY TOYOU. YOU MAY HAVE OTHER RIGHTS THAT VARY ACCORDINGTO LOCAL LAW.
TO THE EXTENT ALLOWED BY LOCAL LAW, IN NO EVENT WILLAVAGO OR ITS SUBSIDIARIES, AFFILIATES OR SUPPLIERS BELIABLE FOR DIRECT, SPECIAL, INCIDENTAL, CONSEQUENTIALOR OTHER DAMAGES (INCLUDING LOST PROFIT, LOST DATA, ORDOWNTIME COSTS), ARISING OUT OF THE USE, INABILITY TOUSE, OR THE RESULTS OF USE OF THE SOFTWARE, WHETHERBASED IN WARRANTY, CONTRACT, TORT OR OTHER LEGALTHEORY, AND WHETHER OR NOT ADVISED OF THE POSSIBILITYOF SUCH DAMAGES. YOUR USE OF THE SOFTWARE IS ENTIRELYAT YOUR OWN RISK. SOME JURISDICTIONS DO NOT ALLOW
THE EXCLUSION OR LIMITATION OF LIABILITY FOR DAMAGES,SO THE ABOVE LIMITATION MAY NOT APPLY TO YOU.
THIS DEVELOPMENT KIT IS A FAMILIARIZATION KIT AND IT ISFOR EVALUATION PURPOSE ONLY. IT IS NOT SUBJECT TORELIABILITY ASSESSMENT AND AVAGO IS NOT LIABLE.
WarningBy connecting the HDJD-JD02 development kit to the parallelport using the I2C adapter, you are operating these two circuitstogether WITHOUT GALVANIC ISOLATION. DO NOTCONNECT OR DISCONNECT ANYTHING WHILE THE HDJD-JD02 DEVELOPMENT KIT OR THE PC IS SWITCHED ON!!!Doing so anyway may damage your PC and/or the HDJD-JD02Development Kit permanently. Make sure power is off whileinterfacing with the Color Reader Board. DO NOT & neverswitch off power from color reader board while program isrunning.
CreditsCIE xy chart – Prof. Geoff Hoffman (http://www.fho-emden.de/~hoffmann/)HunterLab application note, “CIE L*a*b* Color Scale.”Windows™ is a trademark of Microsoft Corporation.I2C is a trademark of Royal Philips Electronics.Other trademarks are the property of their respective ownersand are hereby acknowledged.
3
1.0 Introduction
Being able to accurately and consistently ‘name’ a color, the Avago color sensor opens up opportunitiesto manipulate and control color. It is ideal for color detection, differentiation and control in both openand closed loop systems. Potential areas of application are office automation, quality control and colorcoding in such industries as food, textile, paint, assembly and packaging, environmental lighting,consumer good, pharmaceutical, medical and research and automotive.
The Avago sensor development kit is used to demonstrate the principle of color sensing in reflective andtransmissive context.
A reflective color sensing system comprises of three main elements namely illuminant, non-emissiveobject and observer/sensor. The illuminant, as the name implies, will illuminate the object underobservation and reflected light will be captured by the system’s sensor. The resultant color informationwill be governed by the illuminant spectrum, object surface reflectance and sensor/observer spectralresponse.
The 45°/0° directional measurement method is adopted in Avago sensor development kit. Avago whitephosphor LED is used as the illuminant at the incident angle of approximately 45° while sensor at 0° . Ata distance of 20mm along the surface orthogonal, diffusely reflected light is detected by Avago colorsensor and digitized by A/D board. The development kit program reads the digitized sensor data fromA/D board via parallel interface and performs various color information computation.
Unlike reflective color sensing system, a transmissive color sensing system only comprises of twoelements namely observer/sensor and emissive object. The light emitted from the object will be capturedby the system’s sensor. The resultant color information will be governed by the emission spectrum andsensor/observer spectral response.
Avago sensor development kit serves an exemplary circuit application for composing other simplereflective and transmissive color detection system with Avago color sensors.
4
2.0 Startup
Included in Delivery
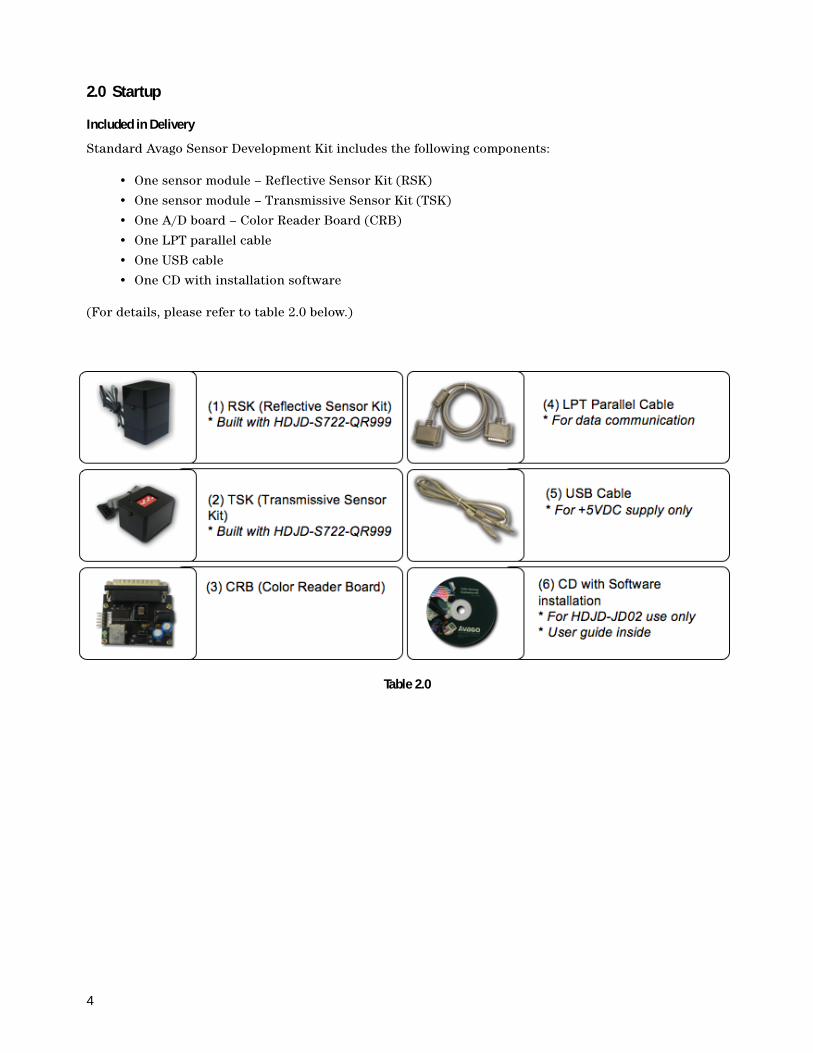
Standard Avago Sensor Development Kit includes the following components:
• One sensor module – Reflective Sensor Kit (RSK)
• One sensor module – Transmissive Sensor Kit (TSK)
• One A/D board – Color Reader Board (CRB)
• One LPT parallel cable
• One USB cable
• One CD with installation software
(For details, please refer to table 2.0 below.)
Table 2.0
5
3.0 Color Sensor Module
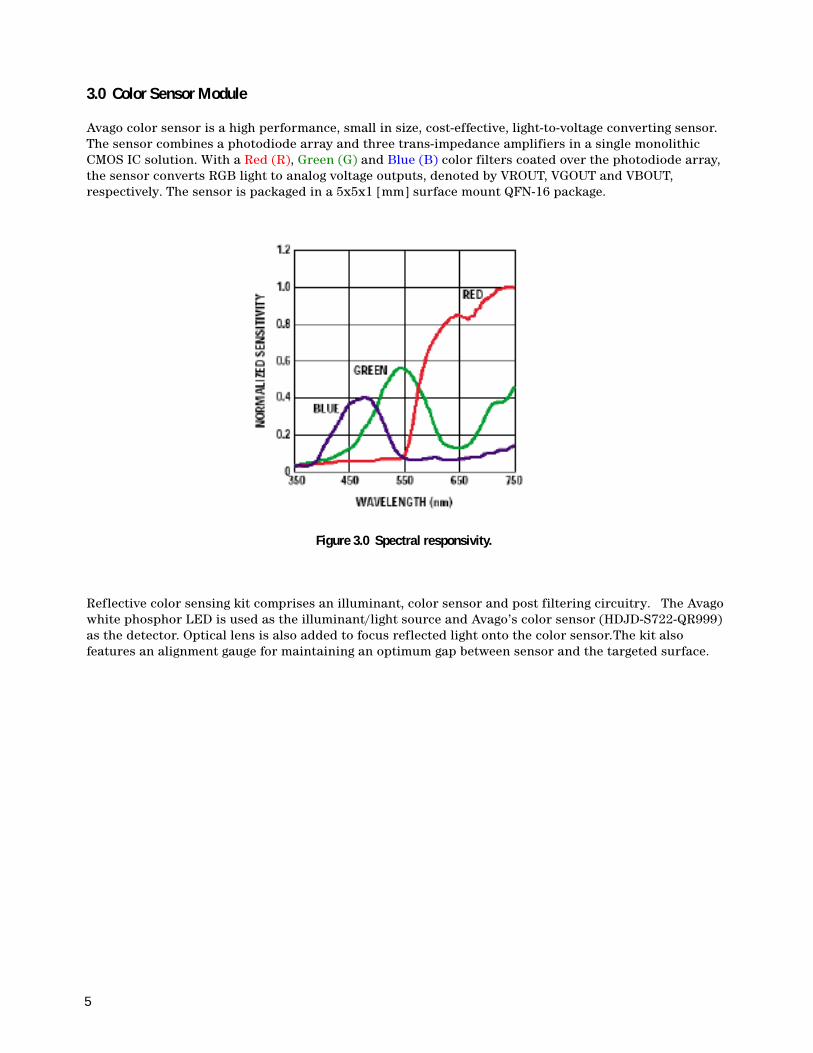
Avago color sensor is a high performance, small in size, cost-effective, light-to-voltage converting sensor.The sensor combines a photodiode array and three trans-impedance amplifiers in a single monolithicCMOS IC solution. With a Red (R), Green (G) and Blue (B) color filters coated over the photodiode array,the sensor converts RGB light to analog voltage outputs, denoted by VROUT, VGOUT and VBOUT,respectively. The sensor is packaged in a 5x5x1 [mm] surface mount QFN-16 package.
Figure 3.0 Spectral responsivity.
Reflective color sensing kit comprises an illuminant, color sensor and post filtering circuitry. The Avagowhite phosphor LED is used as the illuminant/light source and Avago’s color sensor (HDJD-S722-QR999)as the detector. Optical lens is also added to focus reflected light onto the color sensor.The kit alsofeatures an alignment gauge for maintaining an optimum gap between sensor and the targeted surface.
6
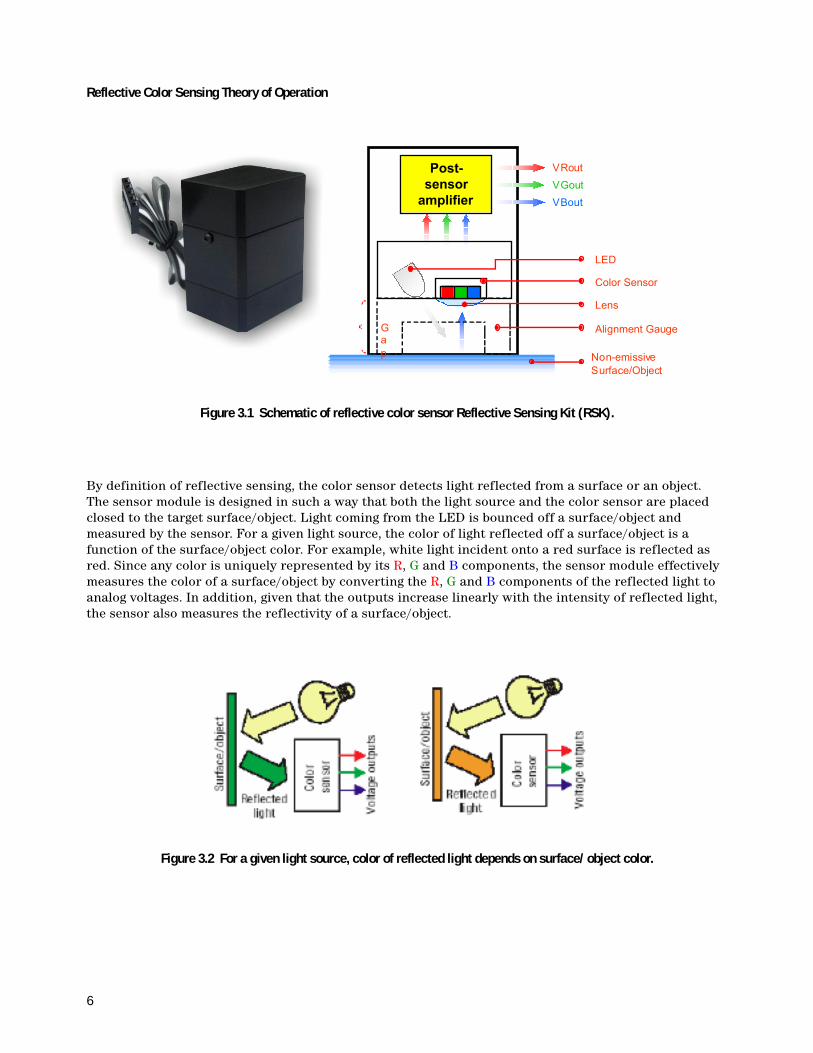
By definition of reflective sensing, the color sensor detects light reflected from a surface or an object.The sensor module is designed in such a way that both the light source and the color sensor are placedclosed to the target surface/object. Light coming from the LED is bounced off a surface/object andmeasured by the sensor. For a given light source, the color of light reflected off a surface/object is afunction of the surface/object color. For example, white light incident onto a red surface is reflected asred. Since any color is uniquely represented by its R, G and B components, the sensor module effectivelymeasures the color of a surface/object by converting the R, G and B components of the reflected light toanalog voltages. In addition, given that the outputs increase linearly with the intensity of reflected light,the sensor also measures the reflectivity of a surface/object.
Reflective Color Sensing Theory of Operation
Figure 3.2 For a given light source, color of reflected light depends on surface/object color.
Figure 3.1 Schematic of reflective color sensor Reflective Sensing Kit (RSK).
Color Sensor
Post-
sensor
amplifier
LED
Lens
Alignment Gauge
Non-emissive
Surface/Object
VRout
VGout
VBout
Ga
p
7
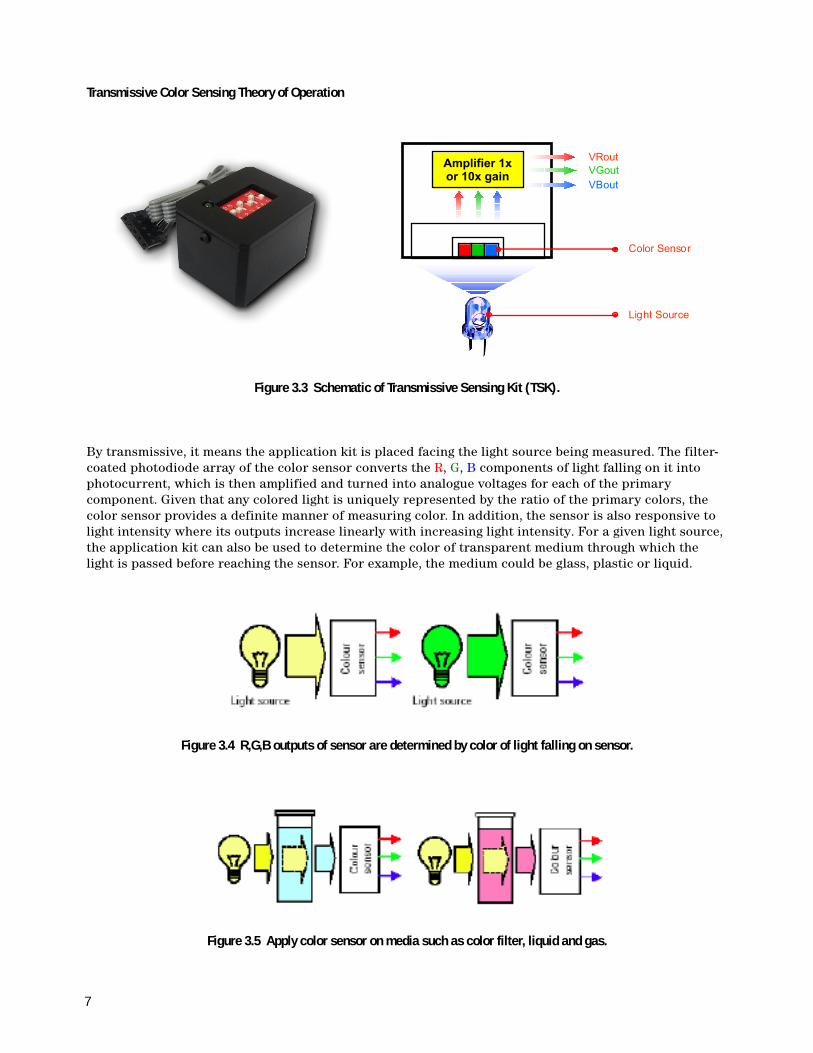
By transmissive, it means the application kit is placed facing the light source being measured. The filter-coated photodiode array of the color sensor converts the R, G, B components of light falling on it intophotocurrent, which is then amplified and turned into analogue voltages for each of the primarycomponent. Given that any colored light is uniquely represented by the ratio of the primary colors, thecolor sensor provides a definite manner of measuring color. In addition, the sensor is also responsive tolight intensity where its outputs increase linearly with increasing light intensity. For a given light source,the application kit can also be used to determine the color of transparent medium through which thelight is passed before reaching the sensor. For example, the medium could be glass, plastic or liquid.
Transmissive Color Sensing Theory of Operation
Figure 3.3 Schematic of Transmissive Sensing Kit (TSK).
Figure 3.4 R,G,B outputs of sensor are determined by color of light falling on sensor.
Figure 3.5 Apply color sensor on media such as color filter, liquid and gas.
Amplifier 1xor 10x gain
Color Sensor
VRout
VGout
VBout
Light Source
8
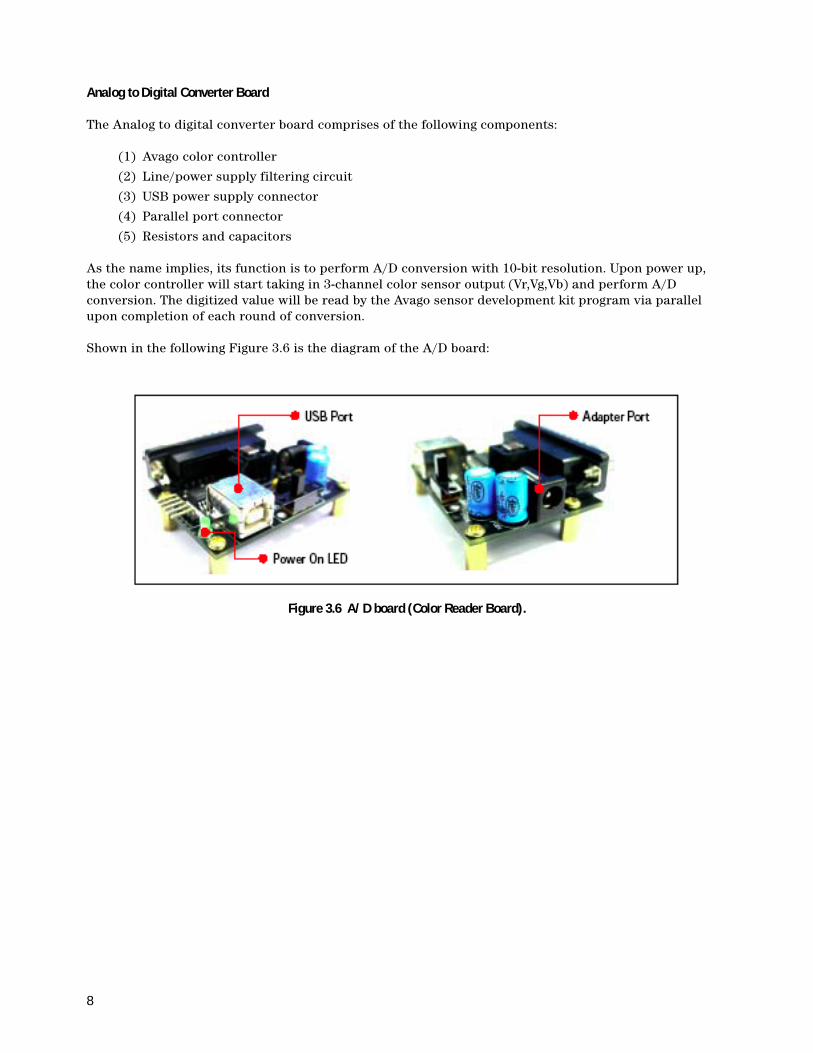
Analog to Digital Converter Board
The Analog to digital converter board comprises of the following components:
(1) Avago color controller
(2) Line/power supply filtering circuit
(3) USB power supply connector
(4) Parallel port connector
(5) Resistors and capacitors
As the name implies, its function is to perform A/D conversion with 10-bit resolution. Upon power up,the color controller will start taking in 3-channel color sensor output (Vr,Vg,Vb) and perform A/Dconversion. The digitized value will be read by the Avago sensor development kit program via parallelupon completion of each round of conversion.
Shown in the following Figure 3.6 is the diagram of the A/D board:
Figure 3.6 A/D board (Color Reader Board).
9
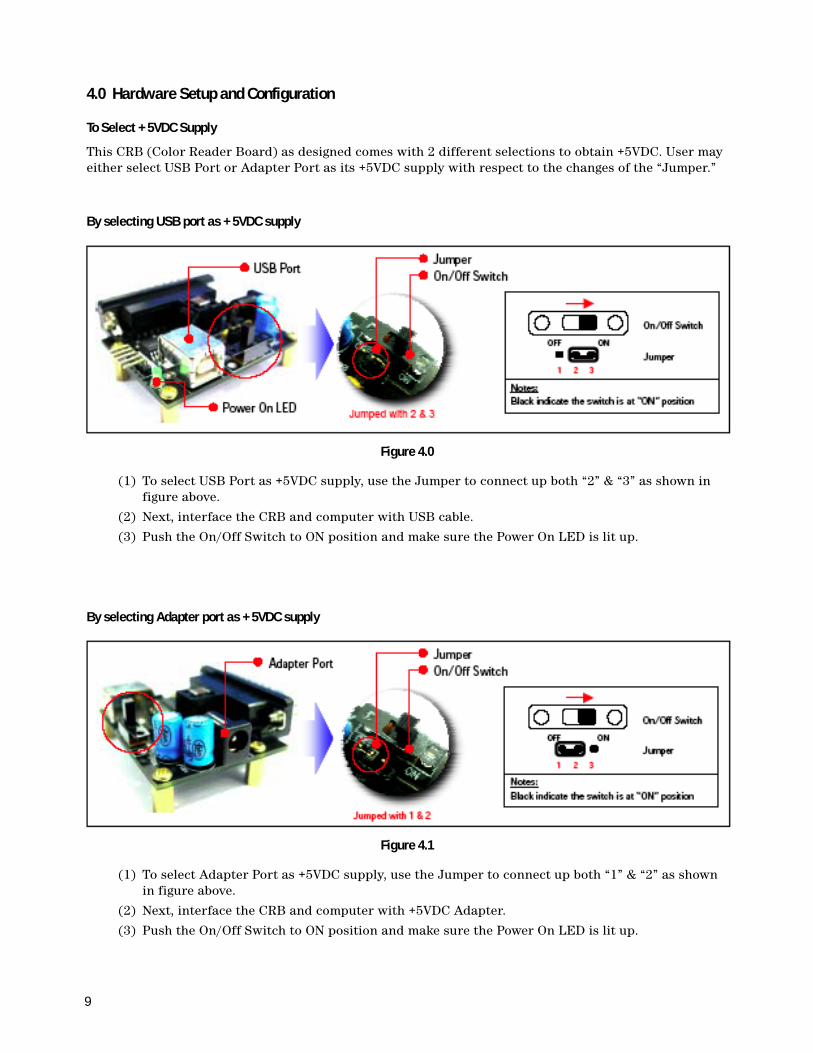
4.0 Hardware Setup and Configuration
To Select +5VDC Supply
This CRB (Color Reader Board) as designed comes with 2 different selections to obtain +5VDC. User mayeither select USB Port or Adapter Port as its +5VDC supply with respect to the changes of the “Jumper.”
(1) To select USB Port as +5VDC supply, use the Jumper to connect up both “2” & “3” as shown infigure above.
(2) Next, interface the CRB and computer with USB cable.
(3) Push the On/Off Switch to ON position and make sure the Power On LED is lit up.
(1) To select Adapter Port as +5VDC supply, use the Jumper to connect up both “1” & “2” as shownin figure above.
(2) Next, interface the CRB and computer with +5VDC Adapter.
(3) Push the On/Off Switch to ON position and make sure the Power On LED is lit up.
By selecting USB port as +5VDC supply
By selecting Adapter port as +5VDC supply
Figure 4.0
Figure 4.1
10
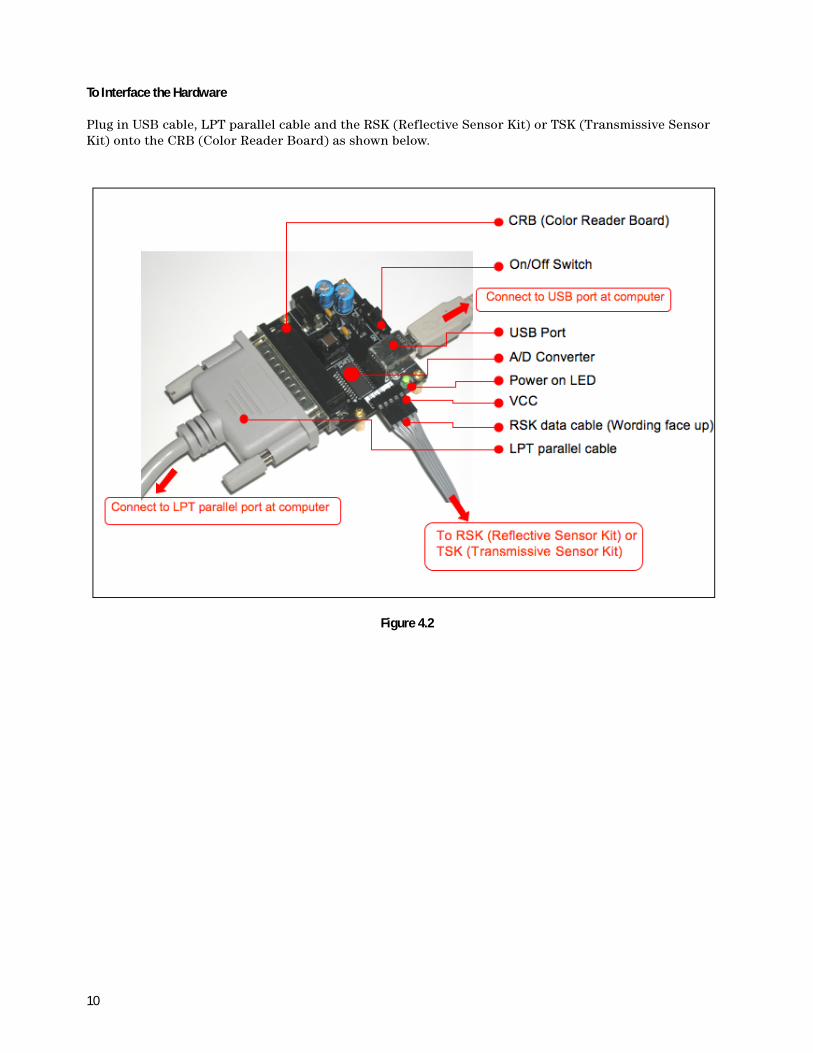
To Interface the Hardware
Plug in USB cable, LPT parallel cable and the RSK (Reflective Sensor Kit) or TSK (Transmissive SensorKit) onto the CRB (Color Reader Board) as shown below.
Figure 4.2
11
5.0 PC Software Description
Avago Color Sensor Development Kit software is developed to be a tool for user to acquire knowledge onhow color sensor can be applied and various types of standard color space system. It is also equippedwith a basic color differentiation tool that allows user to have a visual understanding on how colorcontrol is performed nowadays. The interactive graphical user interface has made the software to be userfriendly and easy to use. This software allows user to select either in Transmissive or Reflective mode.For Transmissvie mode program user may obtain Analogue & Digital output as shown in Figure 6.1. Theprogram for reflective sensor kit as shown in Figure 7.1 comprises 4 main sections i.e.,
(1) Sensor RGB Data
(2) Color Differentiation
(3) Color Interpretation
(4) Numerical Data Log and Chart Viewing
Software Installation
To begin the software installation, user has to run “Setup.exe” then follow the guided steps.
(1) Unzip “Package (Devkit+transmissive)zip.”
(2) Run “Setup.exe” to install the program.
(3) Plug in USB cable, LPT parallel cable and the RSK (Reflective Sensor Kit) or TSK(Transmissive Sensor Kit) onto the CRB (Color Reader Board) as shown below.
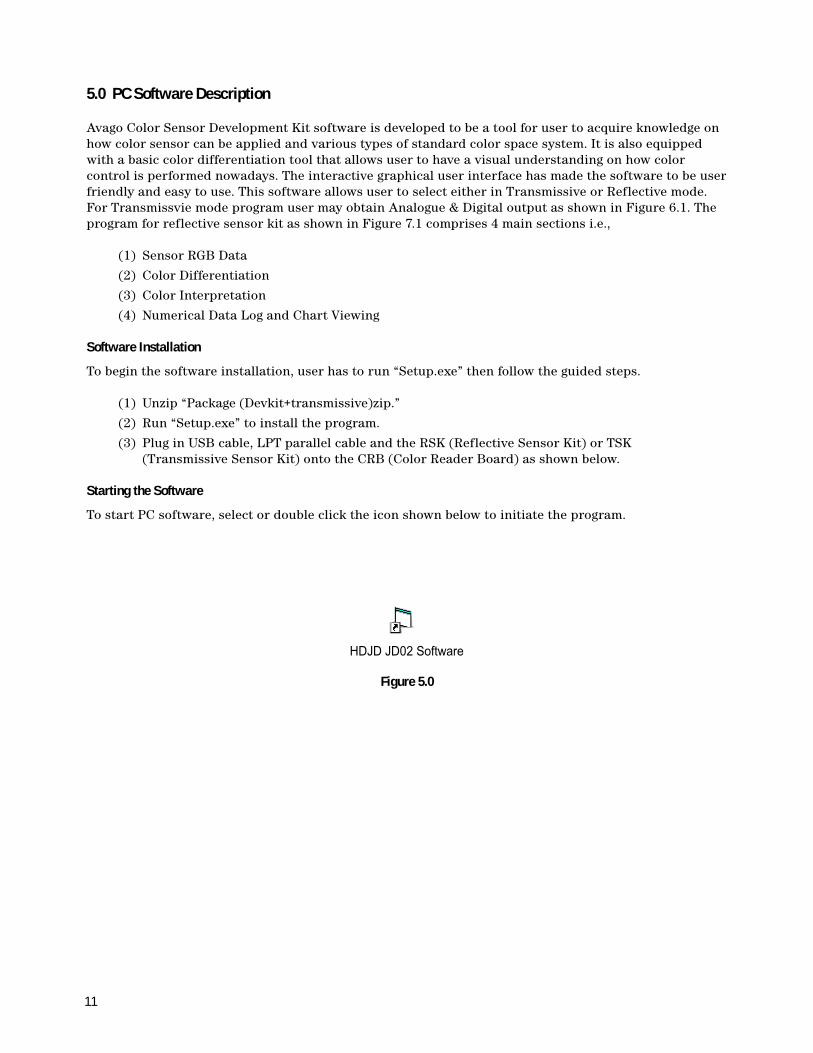
Starting the Software
To start PC software, select or double click the icon shown below to initiate the program.
Figure 5.0
HDJD JD02 Software
12
6.0 PC Software Operation – for Transmissive only
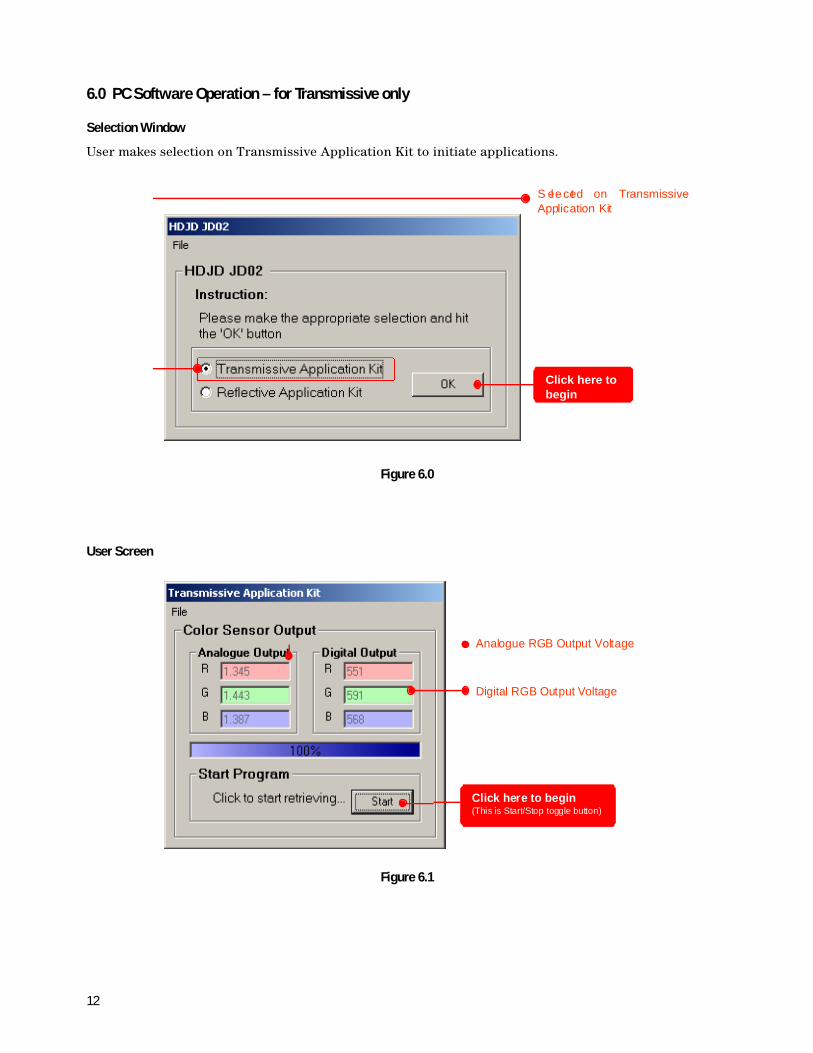
Selection Window
User makes selection on Transmissive Application Kit to initiate applications.
Figure 6.0
User Screen
Figure 6.1
Click here tobegin
S elec ted on TransmissiveApplication Kit
Analogue RGB Output Voltage
Click here to begin(This is Start/Stop toggle button)
Digital RGB Output Voltage
13
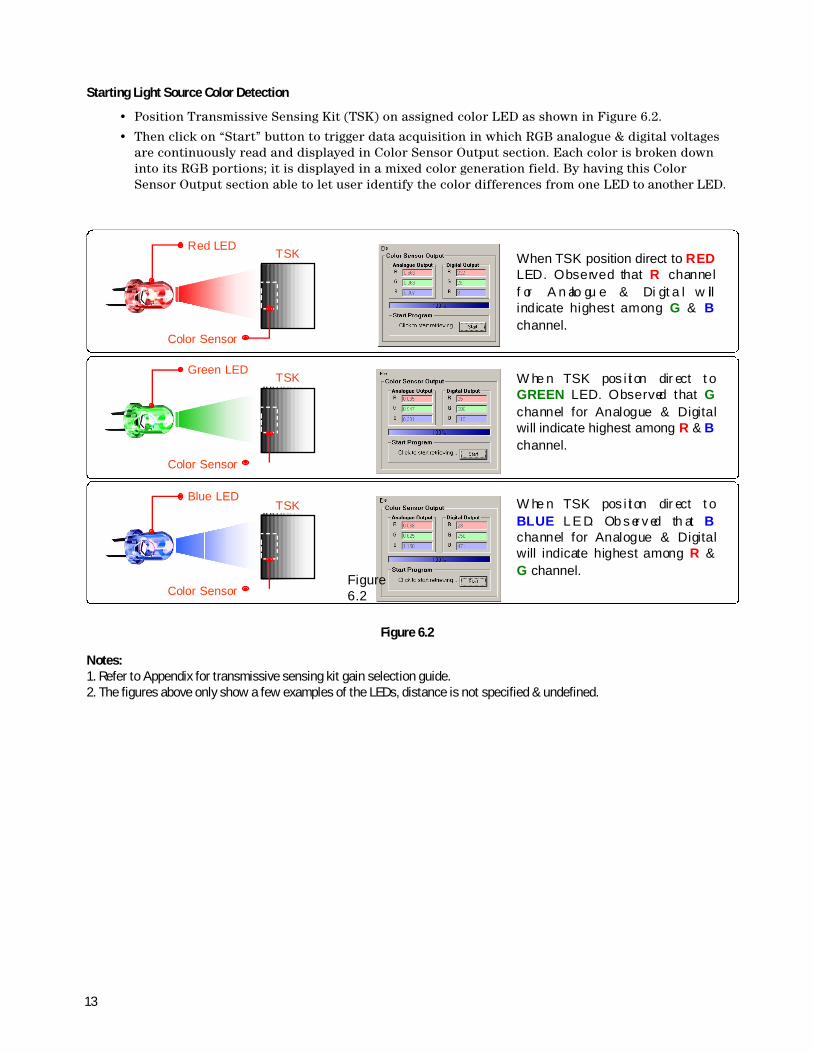
Starting Light Source Color Detection
• Position Transmissive Sensing Kit (TSK) on assigned color LED as shown in Figure 6.2.
• Then click on “Start” button to trigger data acquisition in which RGB analogue & digital voltagesare continuously read and displayed in Color Sensor Output section. Each color is broken downinto its RGB portions; it is displayed in a mixed color generation field. By having this ColorSensor Output section able to let user identify the color differences from one LED to another LED.
Figure 6.2
Notes:1. Refer to Appendix for transmissive sensing kit gain selection guide.2. The figures above only show a few examples of the LEDs, distance is not specified & undefined.
Red LEDTSK
Color Sensor
Green LEDTSK
Color Sensor
Blue LEDTSK
Color Sensor
When TSK position direct to REDLED. Observed that R channelf or A n alo gu e & Di git a l w illindicate highest among G & Bchannel.
W he n TSK pos i ti on dir ect t oGREEN LED. Observed that Gchannel for Analogue & Digitalwill indicate highest among R & Bchannel.
W he n TSK pos i ti on dir ect t oBLUE L E D. Ob s er v ed th at Bchannel for Analogue & Digitalwill indicate highest among R &G channel.
Figure6.2
14
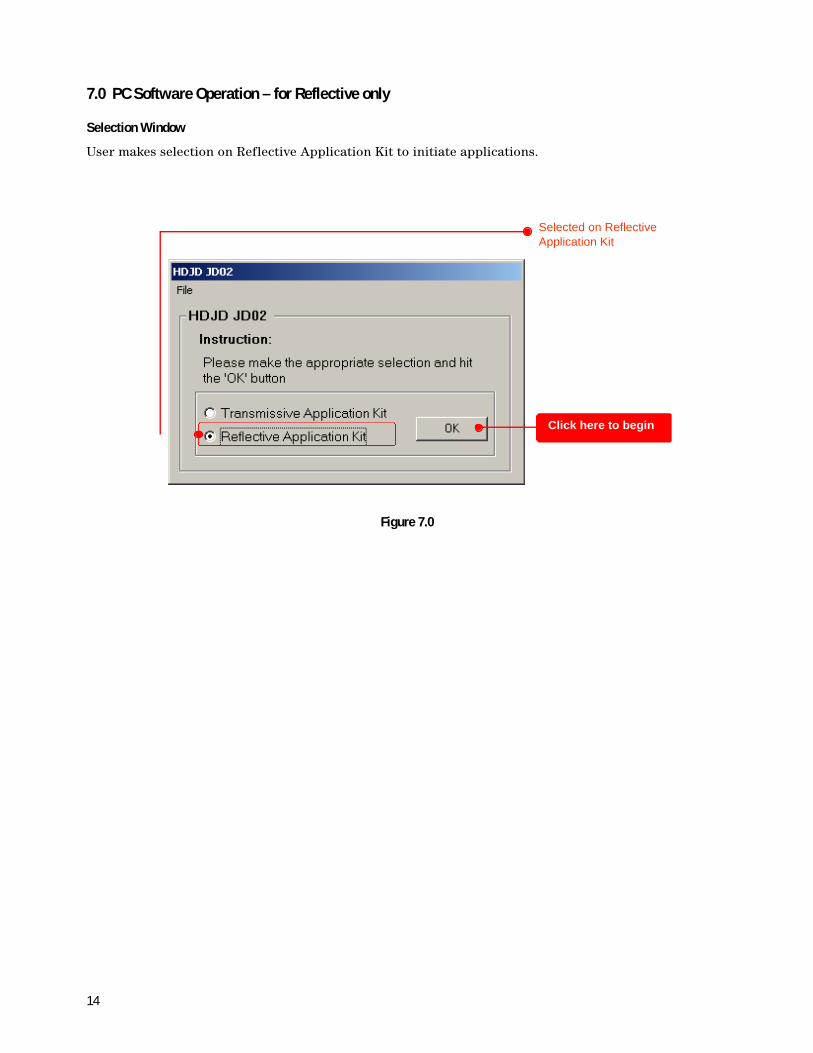
7.0 PC Software Operation – for Reflective only
Selection Window
User makes selection on Reflective Application Kit to initiate applications.
Figure 7.0
Click here to begin
Selected on ReflectiveApplication Kit
15
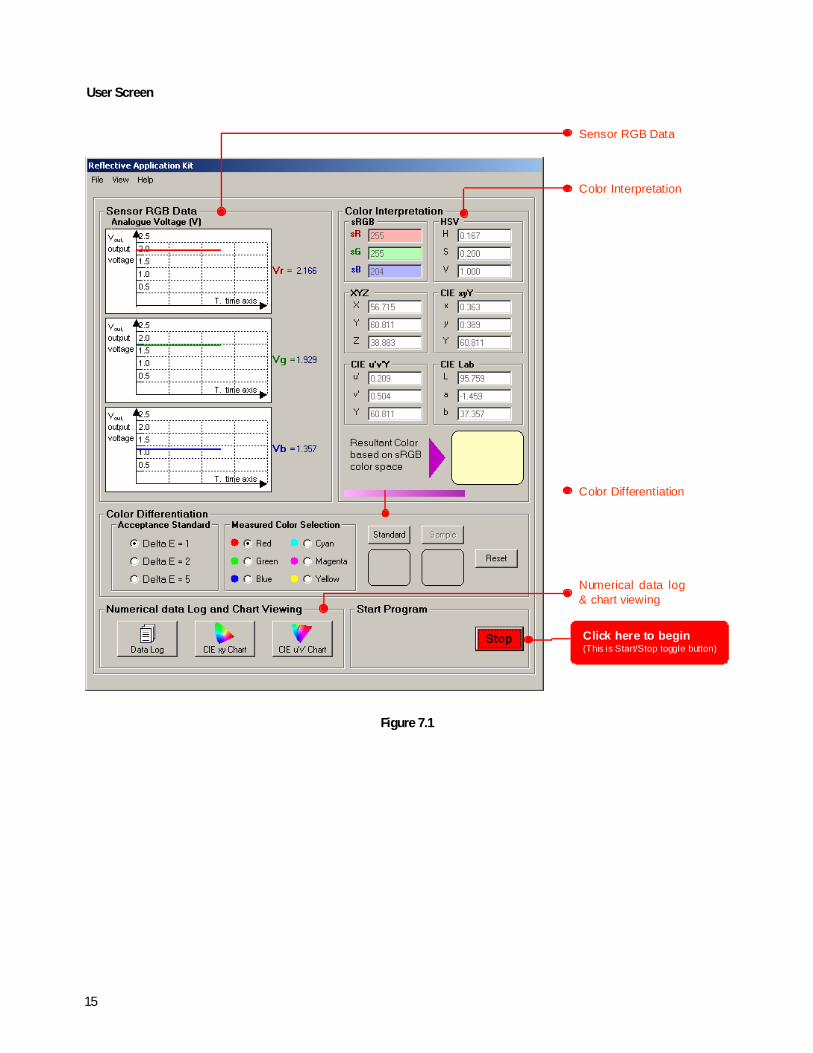
User Screen
Figure 7.1
Sensor RGB Data
Color Interpretation
Color Differentiation
Numerical data log& chart viewing
Click here to begin(This is Start/Stop toggle button)
16
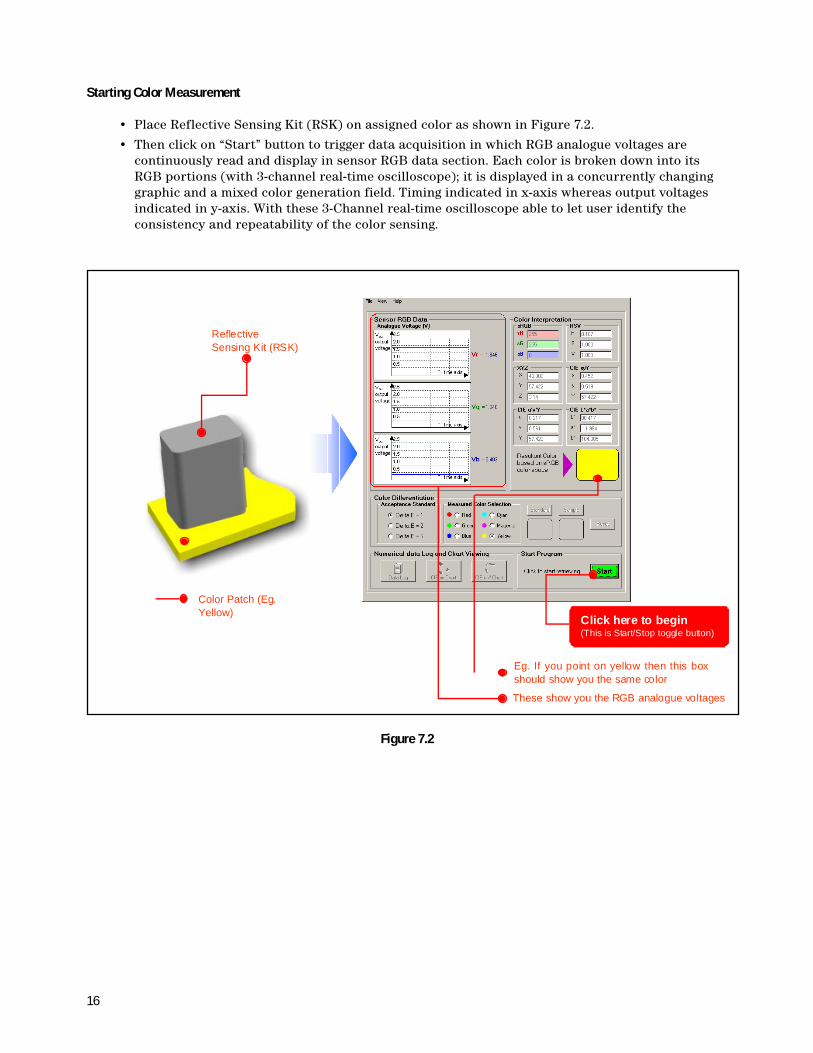
Starting Color Measurement
• Place Reflective Sensing Kit (RSK) on assigned color as shown in Figure 7.2.
• Then click on “Start” button to trigger data acquisition in which RGB analogue voltages arecontinuously read and display in sensor RGB data section. Each color is broken down into itsRGB portions (with 3-channel real-time oscilloscope); it is displayed in a concurrently changinggraphic and a mixed color generation field. Timing indicated in x-axis whereas output voltagesindicated in y-axis. With these 3-Channel real-time oscilloscope able to let user identify theconsistency and repeatability of the color sensing.
Figure 7.2
Eg. If you point on yellow then this boxshould show you the same color
These show you the RGB analogue voltages
ReflectiveSensing Kit (RSK)
Click here to begin(This is Start/Stop toggle button)
Color Patch (Eg.Yellow)
17
Color Sensing
Combination of various RGB portions into a mixed color may produce mismatches with theactual sample color. These circumstances can be corrected with the aid of complexmathematical algorithms.
Color Differentiation
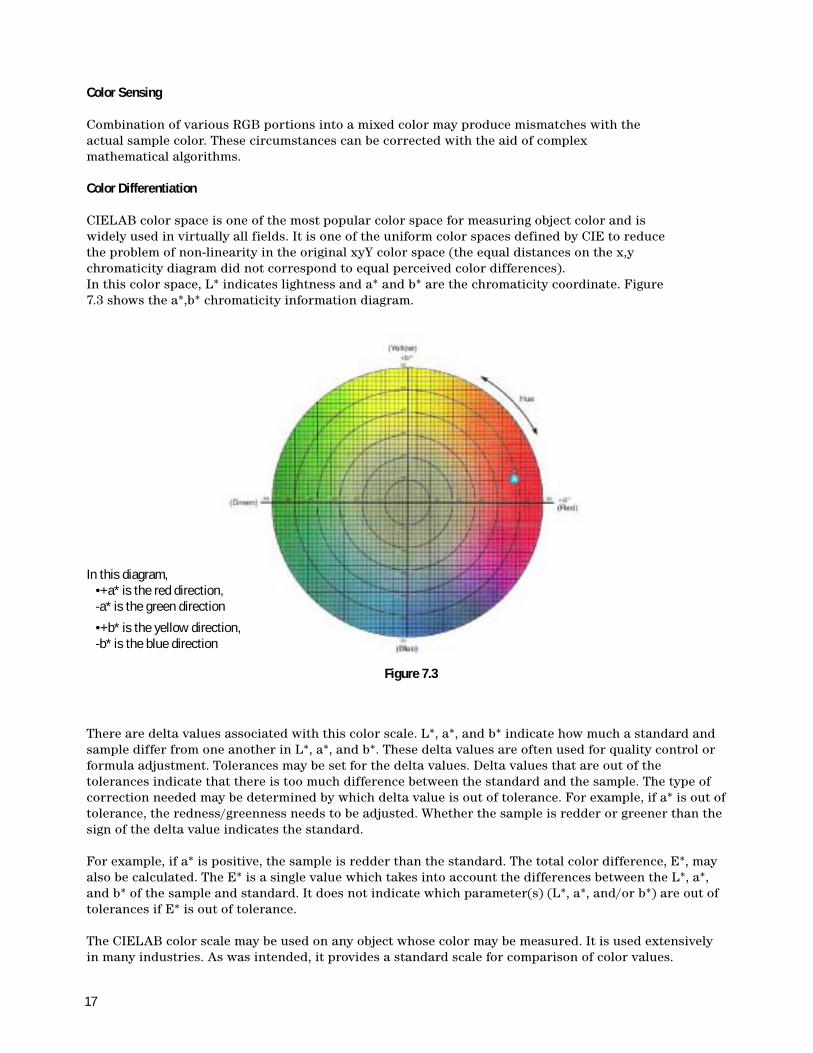
CIELAB color space is one of the most popular color space for measuring object color and iswidely used in virtually all fields. It is one of the uniform color spaces defined by CIE to reducethe problem of non-linearity in the original xyY color space (the equal distances on the x,ychromaticity diagram did not correspond to equal perceived color differences).In this color space, L* indicates lightness and a* and b* are the chromaticity coordinate. Figure7.3 shows the a*,b* chromaticity information diagram.
In this diagram, •+a* is the red direction, -a* is the green direction
•+b* is the yellow direction, -b* is the blue direction
Figure 7.3
There are delta values associated with this color scale. L*, a*, and b* indicate how much a standard andsample differ from one another in L*, a*, and b*. These delta values are often used for quality control orformula adjustment. Tolerances may be set for the delta values. Delta values that are out of thetolerances indicate that there is too much difference between the standard and the sample. The type ofcorrection needed may be determined by which delta value is out of tolerance. For example, if a* is out oftolerance, the redness/greenness needs to be adjusted. Whether the sample is redder or greener than thesign of the delta value indicates the standard.
For example, if a* is positive, the sample is redder than the standard. The total color difference, E*, mayalso be calculated. The E* is a single value which takes into account the differences between the L*, a*,and b* of the sample and standard. It does not indicate which parameter(s) (L*, a*, and/or b*) are out oftolerances if E* is out of tolerance.
The CIELAB color scale may be used on any object whose color may be measured. It is used extensivelyin many industries. As was intended, it provides a standard scale for comparison of color values.
18
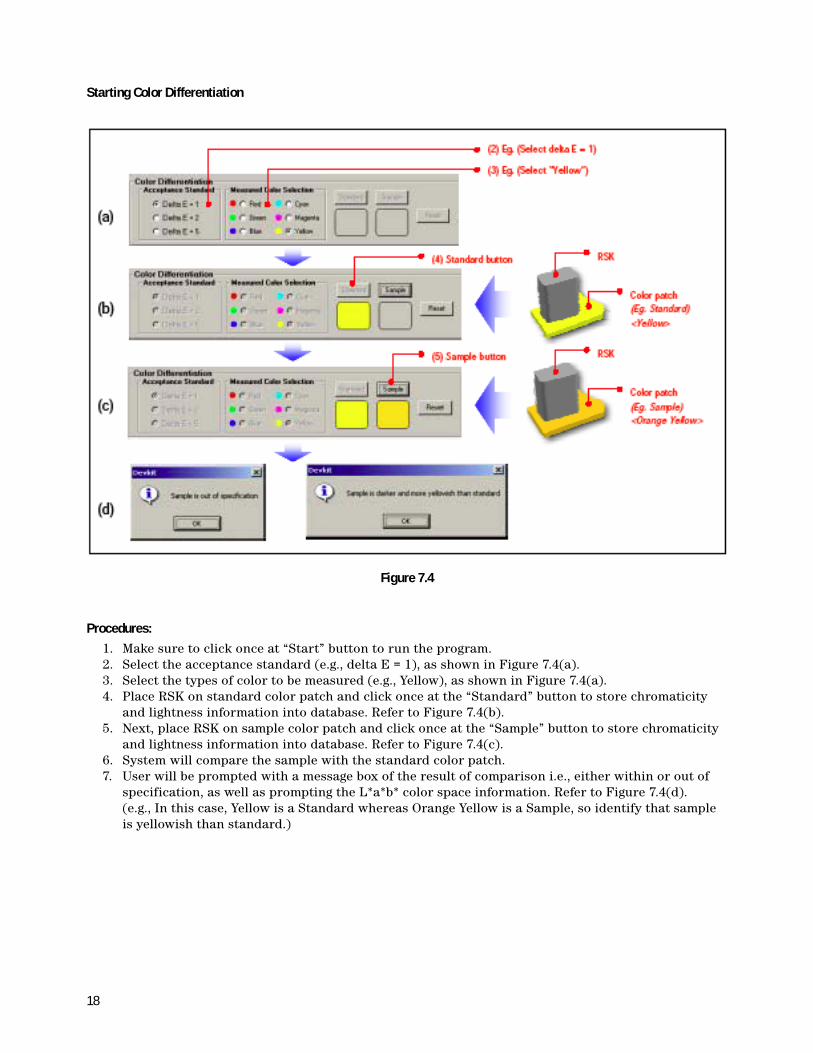
Starting Color Differentiation
Procedures:
1. Make sure to click once at “Start” button to run the program.2. Select the acceptance standard (e.g., delta E = 1), as shown in Figure 7.4(a).3. Select the types of color to be measured (e.g., Yellow), as shown in Figure 7.4(a).4. Place RSK on standard color patch and click once at the “Standard” button to store chromaticity
and lightness information into database. Refer to Figure 7.4(b).5. Next, place RSK on sample color patch and click once at the “Sample” button to store chromaticity
and lightness information into database. Refer to Figure 7.4(c).6. System will compare the sample with the standard color patch.7. User will be prompted with a message box of the result of comparison i.e., either within or out of
specification, as well as prompting the L*a*b* color space information. Refer to Figure 7.4(d).(e.g., In this case, Yellow is a Standard whereas Orange Yellow is a Sample, so identify that sampleis yellowish than standard.)
Figure 7.4
19
Interpretation of Colorimetric System
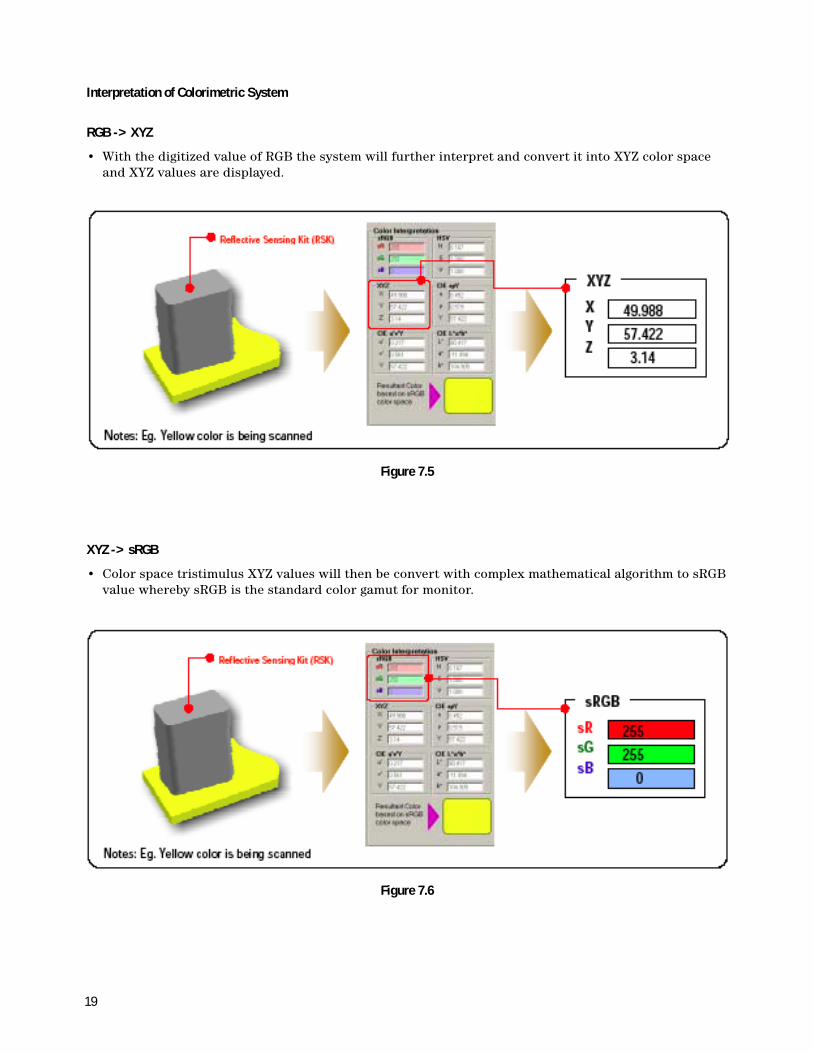
RGB -> XYZ
• With the digitized value of RGB the system will further interpret and convert it into XYZ color spaceand XYZ values are displayed.
XYZ -> sRGB
• Color space tristimulus XYZ values will then be convert with complex mathematical algorithm to sRGBvalue whereby sRGB is the standard color gamut for monitor.
Figure 7.5
Figure 7.6
20
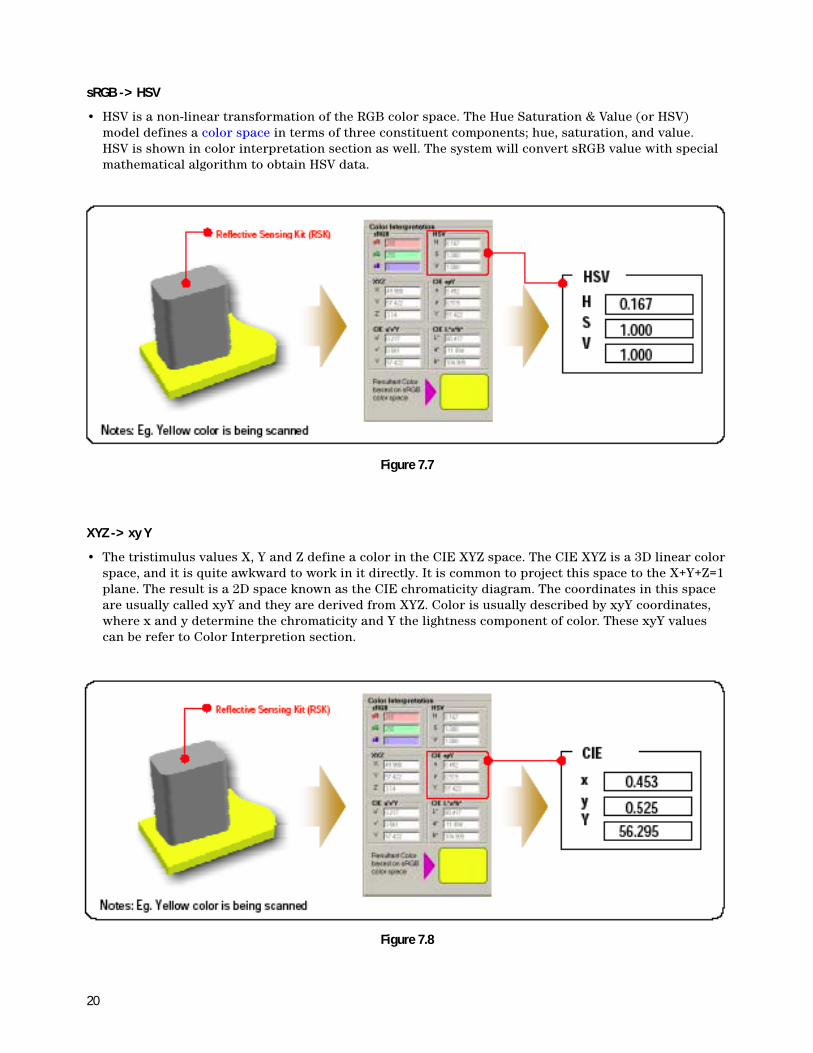
sRGB -> HSV
• HSV is a non-linear transformation of the RGB color space. The Hue Saturation & Value (or HSV)model defines a color space in terms of three constituent components; hue, saturation, and value.HSV is shown in color interpretation section as well. The system will convert sRGB value with specialmathematical algorithm to obtain HSV data.
XYZ -> xy Y
• The tristimulus values X, Y and Z define a color in the CIE XYZ space. The CIE XYZ is a 3D linear colorspace, and it is quite awkward to work in it directly. It is common to project this space to the X+Y+Z=1plane. The result is a 2D space known as the CIE chromaticity diagram. The coordinates in this spaceare usually called xyY and they are derived from XYZ. Color is usually described by xyY coordinates,where x and y determine the chromaticity and Y the lightness component of color. These xyY valuescan be refer to Color Interpretion section.
Figure 7.7
Figure 7.8
21
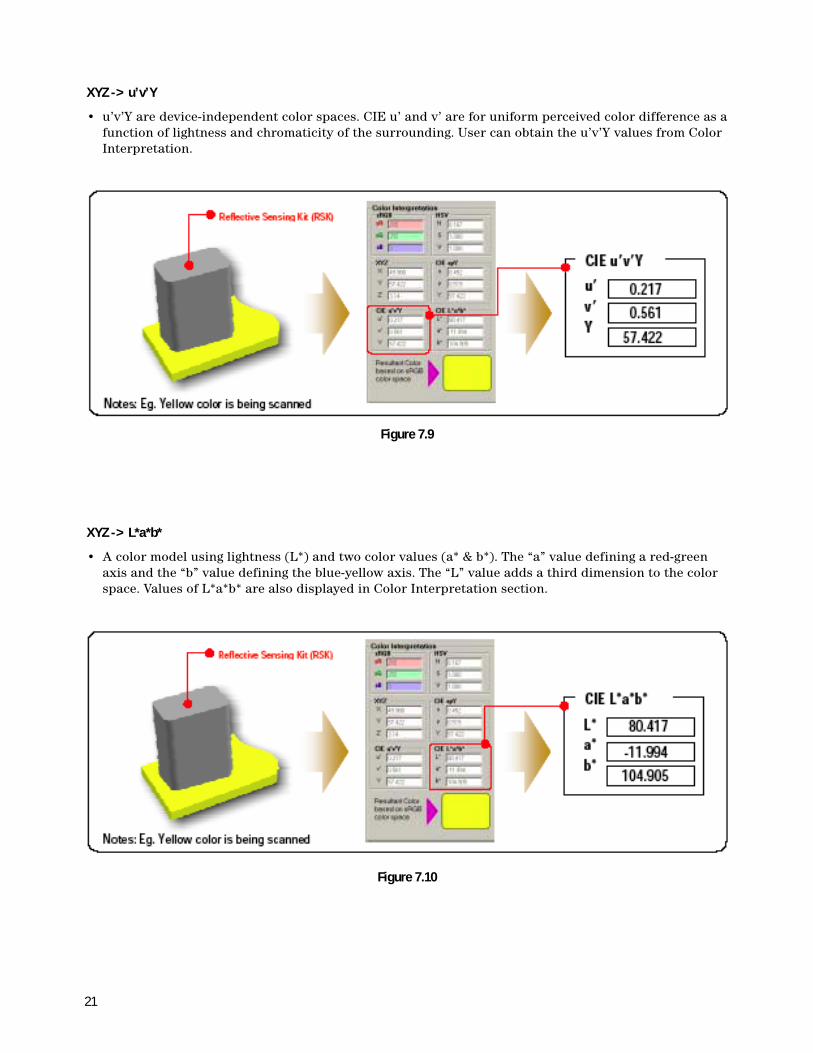
XYZ -> u’v’Y
• u’v’Y are device-independent color spaces. CIE u’ and v’ are for uniform perceived color difference as afunction of lightness and chromaticity of the surrounding. User can obtain the u’v’Y values from ColorInterpretation.
XYZ -> L*a*b*
• A color model using lightness (L*) and two color values (a* & b*). The “a” value defining a red-greenaxis and the “b” value defining the blue-yellow axis. The “L” value adds a third dimension to the colorspace. Values of L*a*b* are also displayed in Color Interpretation section.
Figure 7.9
Figure 7.10
22
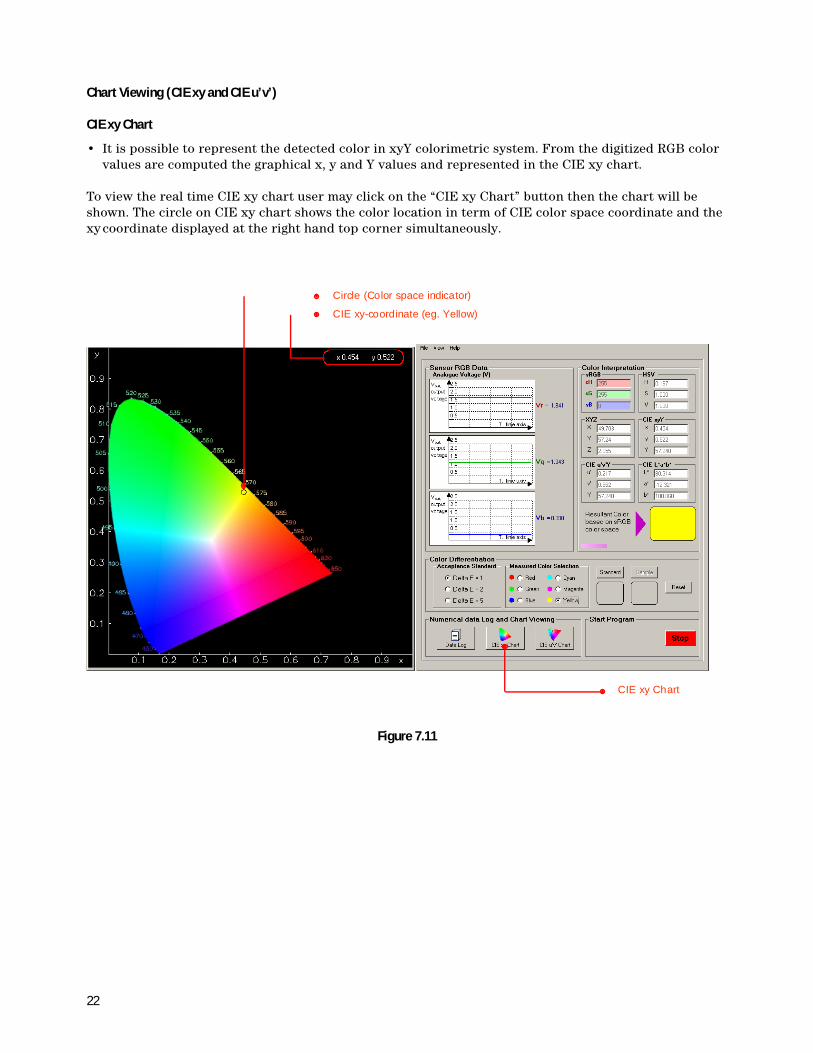
Chart Viewing (CIE xy and CIE u’v’)
CIE xy Chart
• It is possible to represent the detected color in xyY colorimetric system. From the digitized RGB colorvalues are computed the graphical x, y and Y values and represented in the CIE xy chart.
To view the real time CIE xy chart user may click on the “CIE xy Chart” button then the chart will beshown. The circle on CIE xy chart shows the color location in term of CIE color space coordinate and thexycoordinate displayed at the right hand top corner simultaneously.
Figure 7.11
CIE xy Chart
CIE xy-coordinate (eg. Yellow)
Circle (Color space indicator)
23
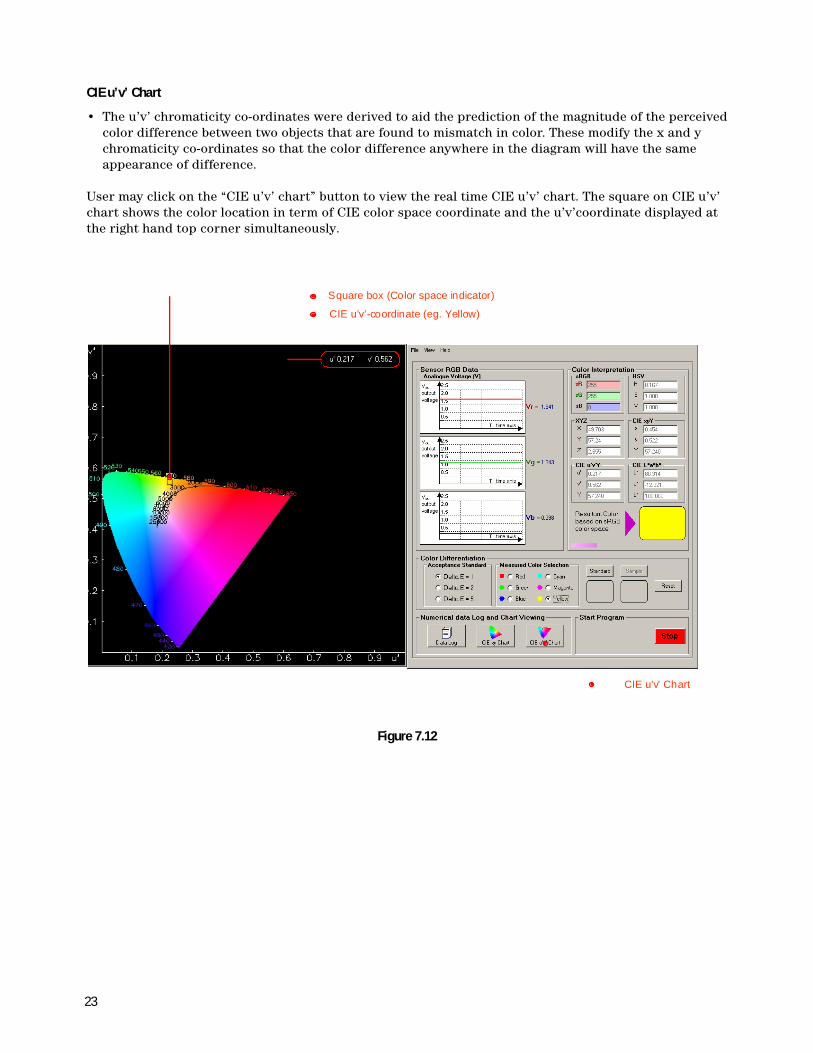
CIE u’v’ Chart
• The u’v’ chromaticity co-ordinates were derived to aid the prediction of the magnitude of the perceivedcolor difference between two objects that are found to mismatch in color. These modify the x and ychromaticity co-ordinates so that the color difference anywhere in the diagram will have the sameappearance of difference.
User may click on the “CIE u’v’ chart” button to view the real time CIE u’v’ chart. The square on CIE u’v’chart shows the color location in term of CIE color space coordinate and the u’v’coordinate displayed atthe right hand top corner simultaneously.
Figure 7.12
CIE u’v’ Chart
CIE u’v’-coordinate (eg. Yellow)
Square box (Color space indicator)
24
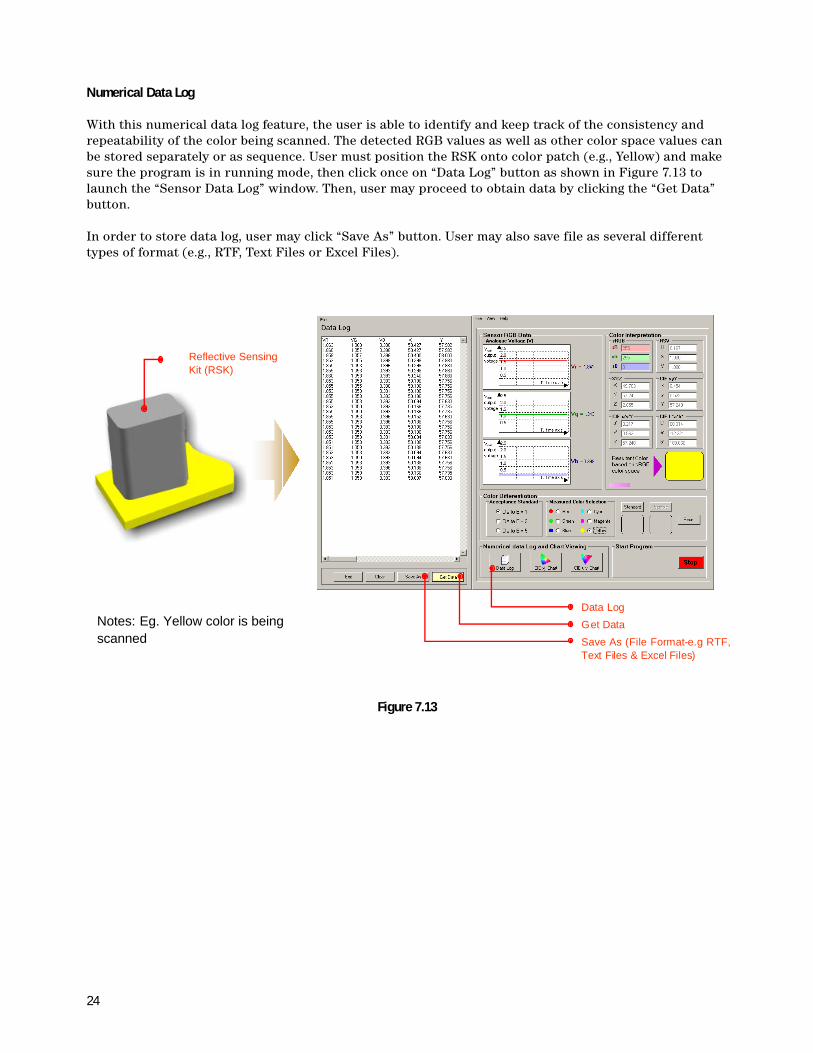
Numerical Data Log
With this numerical data log feature, the user is able to identify and keep track of the consistency andrepeatability of the color being scanned. The detected RGB values as well as other color space values canbe stored separately or as sequence. User must position the RSK onto color patch (e.g., Yellow) and makesure the program is in running mode, then click once on “Data Log” button as shown in Figure 7.13 tolaunch the “Sensor Data Log” window. Then, user may proceed to obtain data by clicking the “Get Data”button.
In order to store data log, user may click “Save As” button. User may also save file as several differenttypes of format (e.g., RTF, Text Files or Excel Files).
Figure 7.13
Data Log
Get Data
Save As (File Format-e.g RTF,Text Files & Excel Files)
Reflective SensingKit (RSK)
Notes: Eg. Yellow color is beingscanned
25
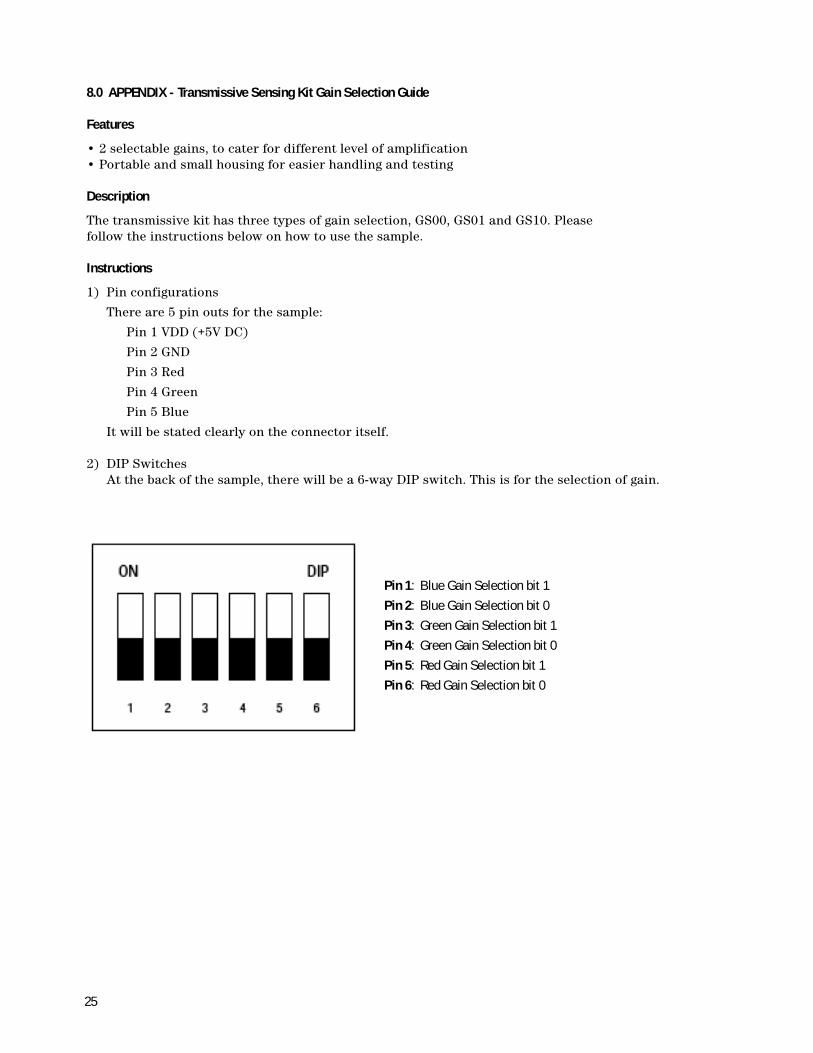
8.0 APPENDIX - Transmissive Sensing Kit Gain Selection Guide
Features
• 2 selectable gains, to cater for different level of amplification• Portable and small housing for easier handling and testing
Description
The transmissive kit has three types of gain selection, GS00, GS01 and GS10. Pleasefollow the instructions below on how to use the sample.
Instructions
1) Pin configurations
There are 5 pin outs for the sample:
Pin 1 VDD (+5V DC)
Pin 2 GND
Pin 3 Red
Pin 4 Green
Pin 5 Blue
It will be stated clearly on the connector itself.
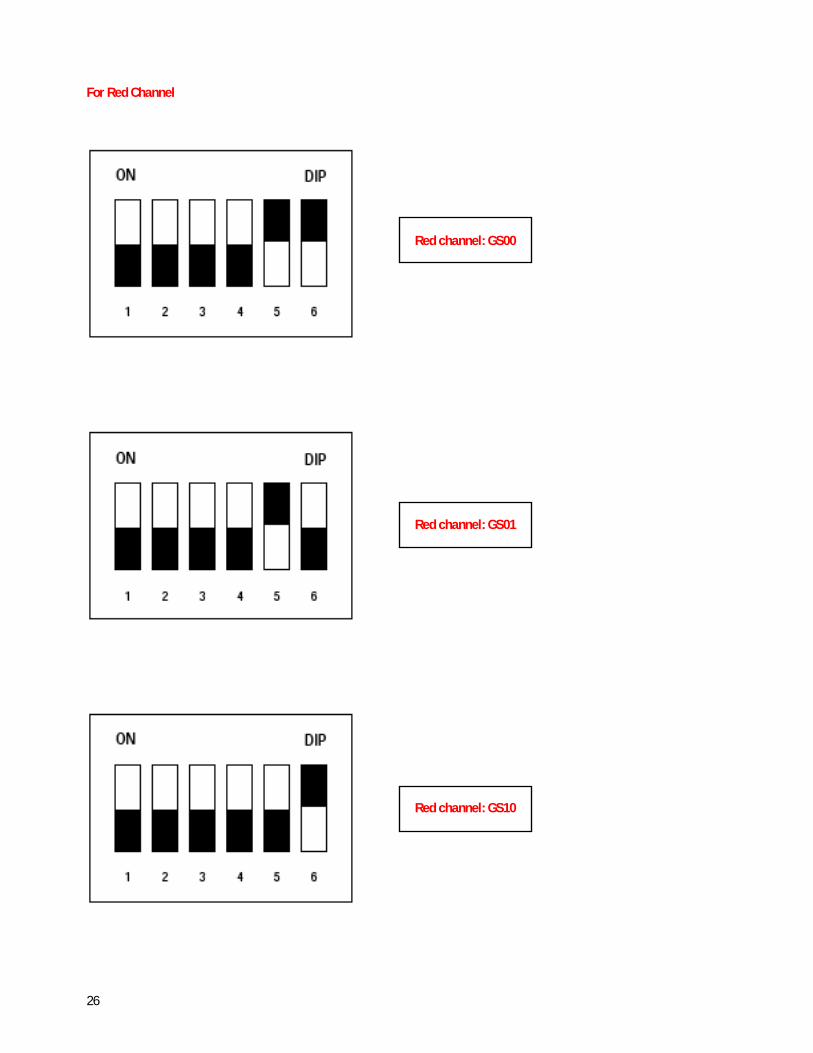
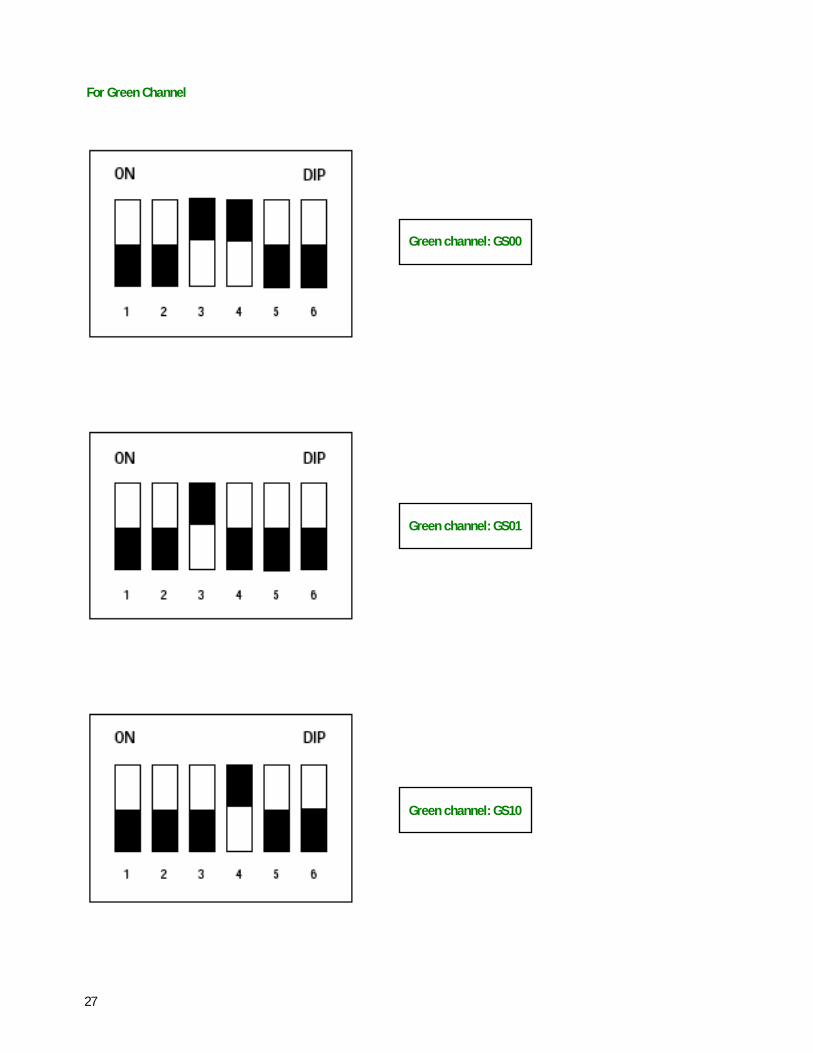
2) DIP SwitchesAt the back of the sample, there will be a 6-way DIP switch. This is for the selection of gain.
Pin 1: Blue Gain Selection bit 1
Pin 2: Blue Gain Selection bit 0
Pin 3: Green Gain Selection bit 1
Pin 4: Green Gain Selection bit 0
Pin 5: Red Gain Selection bit 1
Pin 6: Red Gain Selection bit 0
26
For Red Channel
Red channel: GS00
Red channel: GS01
Red channel: GS10
27
For Green Channel
Green channel: GS00
Green channel: GS01
Green channel: GS10
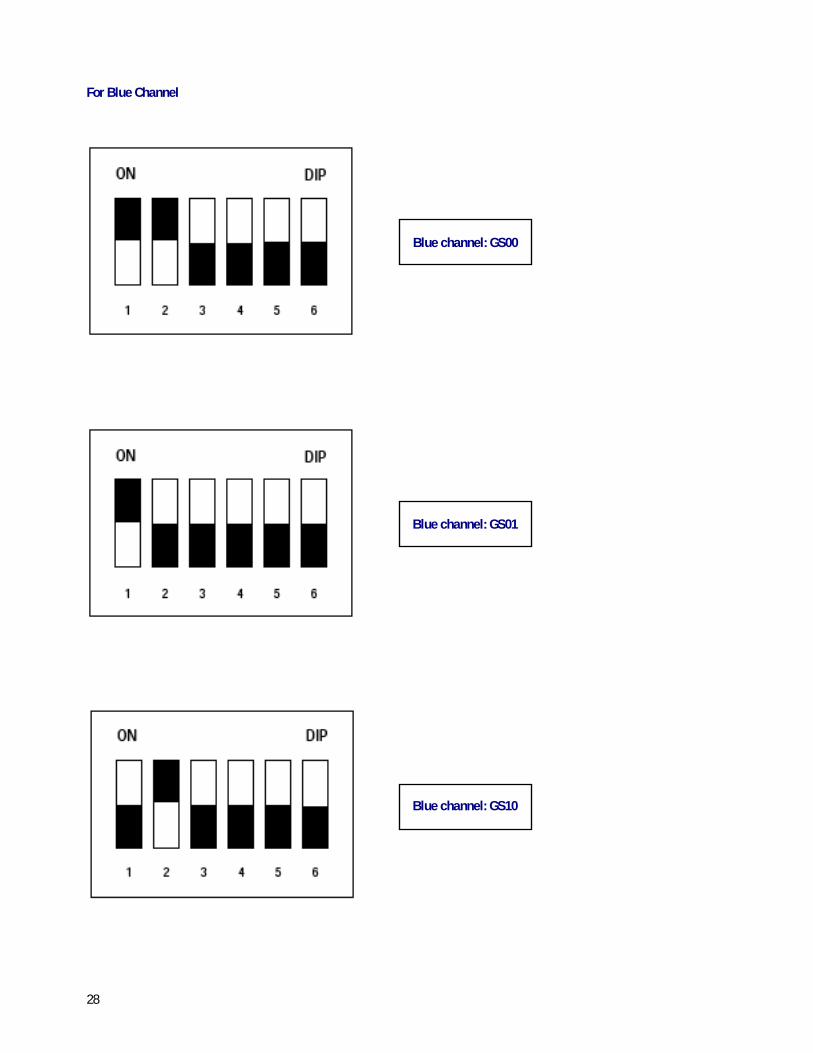
For Blue Channel
Blue channel: GS00
Blue channel: GS01
Blue channel: GS10
28

For product information and a complete list of distributors, please go to our website: www.avagotech.com
Avago, Avago Technologies, and the A logo are trademarks of Avago Technologies Limited in the United States and other countries.Data subject to change. Copyright © 2007 Avago Technologies Limited. All rights reserved. Obsoletes AV01-0306ENAV01-0604EN July 4, 2007