Embed Size (px)
Citation preview
People's Republic of Bangladesh Technical and Vocational Education and Training
(TVET) Reform Project
Project Research Report Series BD: 2/08
Availability of Data related to Technical and Vocational Education and Training (TVET) in
Bangladesh
By Md. Nurul Islam
Dhaka, 2008
Funded by the European Union and executed by the ILO
European Union International Labour Organization
2
Contents Abbreviations 7 EXECUTIVE SUMMARY 9 Methodology of the study Principal findings Principal recommendations CHAPTER I: DATA ON THE DEMAND SIDE IN TVET 17 1. Data on the student demand for TVET 17
1.1 Data on potential demand for TVET courses from youth who finished general
schooling at Grades 5-7 17
Table D01: Number of primary schools and enrolments Table D02: Number of secondary schools and students by Division Table D03: Annual school completions from Grades 5-6-7-8 (by location and gender)
1.2 Potential demand for skills from the working children 18
Table D04: Key data on the child labour, 1999-2000
1.3 Data on the student demand for formal TVET programmes 19
Table D05: Annual school graduations from Grades 8-11 (by location and gender) Table D06: Annual school graduations from Grades 8-11 applying for formal TVET
programmes (by location and gender) Table D07: Annual numbers of applicants for formal full-time TVET programmes (per type of programme, and gender)
1.4 Data on the economy’s demand for skilled labour force 21
1.4.1 Number of establishments 22 Table D08: Number of industrial units from 1988-1989 to 2001-2002
1.4.2 Data on the structure of the labour force 22 Table D09: Labour force by gender and residence Table D10: Labour force by age group and gender Table D11: Underemployment Rates by Residence and Gender
1.4.3 Data on sectoral distribution of employment in the economy 24 Table D12: Labour force (15 years and over) by employment status Table D13: Percent of employed (persons 15 years) and over by broad industry
wcms_106496.doc 3
1.4.4 Data on the labour force by occupational groups and large economic sectors 25 Table D14: Employed Persons by Broad Sector of Employment and Occupational
Group Table D15: Employed Persons (15 years and over) by Broad Occupational Group and
Residence Table D16: Share of unskilled workers in the labor force (major industries)
1.4.5 Data on employment & qualification structures by economic sector / subsectors 27 Table D17: Employed labor force by educational level Table D18: Employment and qualification structures by the economic sector and sub-
sector
1.4.6 Data on the structure of the technician, high-skilled and skilled worker 30 occupations by industry sub-sector
Table D19: Polytechnic diploma-level occupations in the sectors and sub- sectors of the economy
Table D20: High-skilled and skilled-worker occupations in the sectors and sub- sectors of the economy
1.4.7. Assessment of demand for skilled workforce by industry sectors (example of 33 shipbuilding industry)
Table D21: Demand for the workforce in the shipbuilding sector, 2007 2. Data on the demand for educated and skilled workforce caused by capital
inflows and growth/decline in production and productivity 34
Table D22: FDI Inflow by economic sectors (US$Million) Table D23: Employment and Productivity Growth in Industry Sub-sectors 3. Data on the replacement demand caused by labour force turnover 36
Table D24: Annual replacement needs for technicians and skilled workers 4. Demand for skilled workforce from overseas markets 37
Table D25: Skilled and semi-skilled migrants Table D26: Numbers of migrants employed per trade (June 2004 - December 2007) Table D27: Occupational and qualification structures of people going overseas
CHAPTER II: DATA ON THE SUPPLY SIDE IN TVET 39 1. Structure of TVET providers and their training capacity 39
1.1 Data on the providers of formal TVET 39
Table S01: TVET delivery supervised by the DTE Table S02: Public Training Institutions
wcms_106496.doc 4
Table S03: TVET providers by category, location and enrolments (data of 2005) Table S04: Institutions offering technical education programmes
Table S05: Specialist TVET providers focusing on economic sectors
1.2 Data on the formal public and private TVET programmes 42
Table S06: Principal formal TVET programmes in Bangladesh Table S07: Courses and the seating capacity of the TTCs under the Ministry of
Expatriates’ Welfare and Overseas Employment Table S08: Technical education programmes delivered under the supervision of DTE Table S09: Number and intake on all TVET programmes accredited by the BTEB Table S10: Intake capacity of TVET programmes trade-wise Table S11: Certificate level courses (S.S.C and HSC Vocational) Table S12: Training capacity of TVET institutions by the type of TVET award Table S13: Data on supply of formal programmes by private providers
1.3 Formal training courses delivered by Madrashas 51
Table S14: Enrolment in vocational programs in Madrashas
2. Data enabling monitoring of operations and outputs of TVET institutions 51
Table S15: Examination results on technical education programmes Table S16: Examination results on BTEB-accredited TVET programmes Table S17: Examination results on S.S.C Vocational programmes Table S18: Examination results on HSC programmes Table S19: Examination results on H.S.C Business Management programmes Table S20: Examination results on the Diploma programmes in engineering Table S21: Examination results for SSC (Voc) in Madrashas
3. Data on TVET staff per type and level of programme 57 3.1 Data on TVET instructors/teachers 57
Table S22: Total numbers of teachers in TVET institutions gender-wise Table S23: Instructors in TVET Institutions
3.2: Data on TVET staff employed in managerial positions 59
Table S24: Managerial Staff in TVET Institutions Table S25: Student/teacher ratios
4. Data on the provision of specialist formal TVET programmes by line
Ministries 60
Table S26: Training programs of the Ministry of Textiles Table S27: Training programmes of TICI
wcms_106496.doc 5
Table S28: Training courses in the trades related to marine field 5. Supply of non-formal training courses by public private providers 65 5.1 Structure of available non-formal training courses provided by the government
agencies 65
Table S29: Training centres operated by the Department of Youth Development Table S30: Training institutions and courses supervised by the Department of
Women Affairs 5.2 Training delivered by the NGOs 67
Table S31: Number of NGO operated training centers Table S32: Training capacity of some NGOs Table S33: Courses offered by NGO-managed institutions at Upazila Level Table S34: Training programmes of BRAC 5.3 Non-formal training courses offered by the private providers at upozila level 69
Table S35: Courses available from private training providers in Upazilas 6. Supply of skills training by industry 71 6.1 Data on in-house training for employees 71
Table S35a: Extent of On-the-job and Off-the-job training of the Workforces in the Sub-Sectors Table S35b: Occupational and Qualification Structures of Workers in the Workshop 6.2 Data on the formal apprenticeships 73
Table S36: Formal apprentices trade-wise
6.3 Training institutions operated by other employer-related agencies 74 7. Number of skilled workers returning from overseas employment 75
CHAPTER III: DATA ON EVIDENCE THAT SUPPLY MATCHES DEMAND IN TVET 76 1. Demand-supply ratios for selected occupations 76
Table SMD01: Example of data on demand-supply ratios in selected occupations
wcms_106496.doc 6
2. Data on employability and skills utilization by TVET graduates 77
Table SMD02: Employment status of TVET graduates Table SMD03: Labour market destinations of skilled electricians Table SMD04: Utilization of the acquired skills in the current job/electricians Table SMD05: Graduate assessment of the labor market demand for the occupation
acquired through training/electricians 3. Data on unemployment by the level of education and training 79
Table SMD06: Unemployed population (aged 15 years and over) by level of education, residence and gender
4. Data on skilled job vacancies advertised in press and internet 80
CHAPTER IV: OBSERVATIONS AND RECOMMENDATIONS 81 1. Observations 81 2. Recommendations 83
ANNEXES Annex 1: Major local investments in industry sectors 85Annex 2: Forecasted demand in the overseas employment market 86Annex 3: Structure of the education and TVET in Bangladesh 87Annex 4: Current vocational qualification framework in Bangladesh 88Annex 5: Newspaper advertisements for professional and managerial staff 89Annex 6: Agencies and persons contacted during collection of data 94
wcms_106496.doc 7
Abbreviations
ADB Asian Development Bank BAIRA Bangladesh Association of International Recruiting Agencies BBS Bangladesh Bureau of Statistics BCIC Bangladesh Chemical Industries Corporation BEI Bangladesh Enterprise Institute BGMEA Bangladesh Garments Manufacturers & Exporters Association BIDS Bangladesh Institute of Development Studies BIMT Bangladesh Institute of Marine Technology BITAC Bangladesh Industrial and Technical Assistance Center BJMC Bangladesh Jute Mills Corporation BKMEA Bangladesh Knitwear Manufacturers & Exporters Association BMET Bureau of Manpower Employment and Training BMTF Bangladesh Machine Tools Factory BOESL Bangladesh Overseas Employment Services Limited BOI Board of Investment BPC Bangladesh Parjaton Corporation BRAC Bangladesh Rural Advancement Committee BSCIC Bangladesh Small and Cottage Industries Corporation BSCO Bangladesh Standard Classification of Occupation BSEC Bangladesh Steel and Engineering Corporation BSFIC Bangladesh Sugar and Food Industries Corporation BSIC Bangladesh Standard Industrial Classification BTEB Bangladesh Technical Education Board BTMC Bangladesh Textile Mills Corporation CAD Computer Aided Design CAM Computer Aided Manufacturing CBT Community Based Training CFTI Central Fertilizer Training Institute CMI Census on Manufacturing Industries CNC Computer and Numerical Controlled DAE Department of Agricultural Extension DTE Directorate of Technical Education DYD Department of Youth Development EPZ Export Processing Zone EU European Union FDI Foreign Direct Investment GDP Gross Domestic Product GoB Government of Bangladesh HRD Human Resource Development
wcms_106496.doc 8
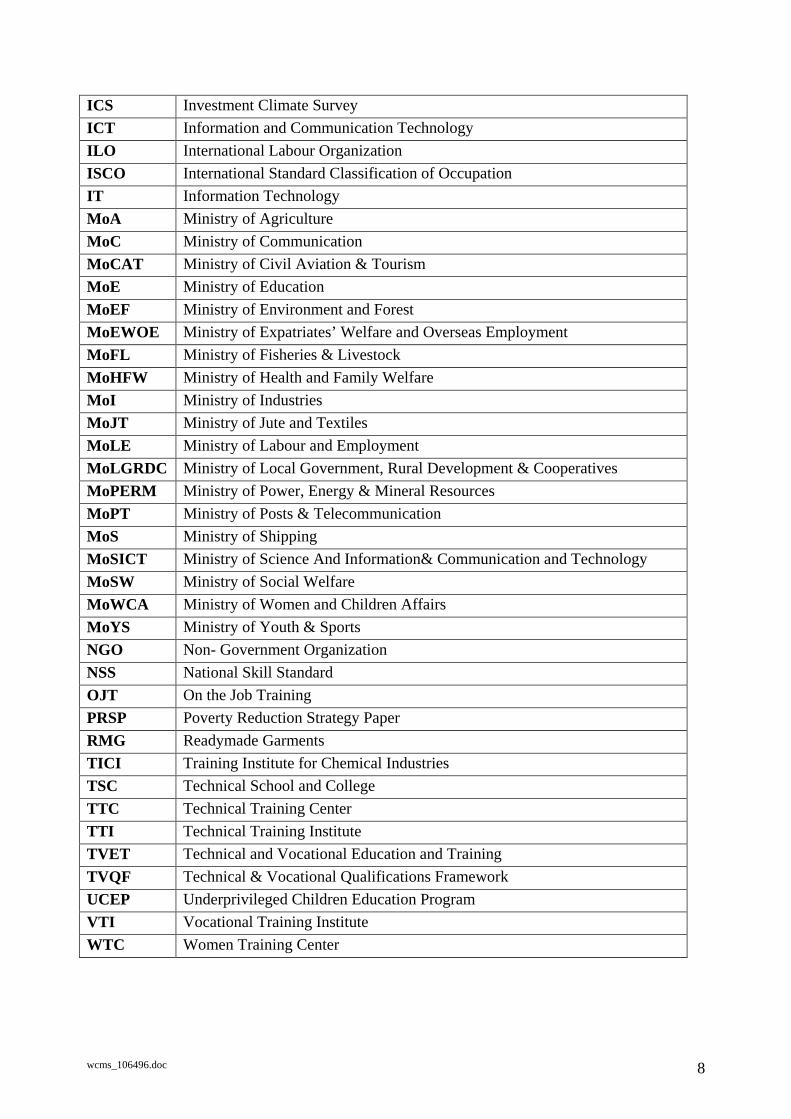
ICS Investment Climate Survey ICT Information and Communication Technology ILO International Labour Organization ISCO International Standard Classification of Occupation IT Information Technology MoA Ministry of Agriculture MoC Ministry of Communication MoCAT Ministry of Civil Aviation & Tourism MoE Ministry of Education MoEF Ministry of Environment and Forest MoEWOE Ministry of Expatriates’ Welfare and Overseas Employment MoFL Ministry of Fisheries & Livestock MoHFW Ministry of Health and Family Welfare MoI Ministry of Industries MoJT Ministry of Jute and Textiles MoLE Ministry of Labour and Employment MoLGRDC Ministry of Local Government, Rural Development & Cooperatives MoPERM Ministry of Power, Energy & Mineral Resources MoPT Ministry of Posts & Telecommunication MoS Ministry of Shipping MoSICT Ministry of Science And Information& Communication and Technology MoSW Ministry of Social Welfare MoWCA Ministry of Women and Children Affairs MoYS Ministry of Youth & Sports NGO Non- Government Organization NSS National Skill Standard OJT On the Job Training PRSP Poverty Reduction Strategy Paper RMG Readymade Garments TICI Training Institute for Chemical Industries TSC Technical School and College TTC Technical Training Center TTI Technical Training Institute TVET Technical and Vocational Education and Training TVQF Technical & Vocational Qualifications Framework UCEP Underprivileged Children Education Program VTI Vocational Training Institute WTC Women Training Center
wcms_106496.doc 9
EXECUTIVE SUMMARY
Bangladesh is a country with a population of approximately 140m. and a labour force of about 60m. Technical and Vocational Education and Training (TVET) is indispensable for the development of human capital of this country. The Constitution of the Republic states that “The state is responsible for development of human resources of the country irrespective of gender, and to assist in employment as per the capabilities of every citizen.” In the National Strategy for Accelerated Poverty Reduction (2005) the emphasis is given to the enhancement of workers’ skills resulting in the “Improvement of the percentage of vocational and technical graduates obtaining employment both in the domestic and international markets”. This study has been commissioned by the project “Technical and Vocational Education and Training (TVET) reform in Bangladesh”, which is funded by the European Union and implemented by the ILO. This study has attempted to map the sources of TVET- related data and assess their availability, reliability, and coverage. This study will contribute to the development of a database on TVET to better inform the delivery planning and resource allocation decisions and assess progress in the TVET sector, and has addressed the need for improved the data collection and data management for TVET in Bangladesh. This study has developed a structure and examined the three major sets of data covering: (i) demand for TVET, (ii) supply of TVET, and (iii) on matching between demand and supply. This study attempted, to a possible extent, to cover both public and private TVET markets. The tables describing the demand for TVET are coded with “D” (eg., Table D10); tables providing data on the supply are coded with “S” (eg.., Table S01); tables producing evidence that supply is matching the demand in TVET are coded with “SMD” (eg., Table SMD05). The mix of the data covered by this report reflects specific objectives of the TVET reform project in Bangladesh. One such objective is to ensure access to TVET of people with lower levels of general education, particularly those who accomplished primary school and reached Grades 6-8. Special attention is also given to the collection of the gender sensitive data on the access of girls to skills development programmes, their successful graduation from courses and participation in TVET as teachers and managerial staff. Specific data also need to be collected on the potential skills development needs of the working children enabling to prepare them as skilled workers for gainful and decent employment at the legal working age. For the above reasons, the report has proposed collecting some data which is not currently available. This study is the first in the series of development works aiming to design and implement a system of TVET-related data in Bangladesh. For this reason the current report has been unable to suggest how the existing data system should revised, and what new types of data need to be collected. It is also left to the later stages of the project to propose who, how and through which instruments, should collect, store, process and supply the TVET-related data. Methodology of the study
wcms_106496.doc 10
The study involved collection of available data from statistical sources as well interviews with relevant agencies. Analysis of data focuses on its availability, frequency of collection, relevance and reliability. Data was collected from public and private providers, NGOs, industry associations and trade bodies, joint-venture projects and other agencies. Data from journals, statistical booklets, and electronic publications was also analysed. Other sources of data involved information published by government departments supervising various TVET training providers, ministries, and agencies in charge of statistics (BBS, BANBEIS, etc.). A sample of the public and private TVET providers as well as of the training NGOs were interviewed enabling to examine the types of data available in the individual providers. Such data mostly covers student enrolments and final graduations per training course. The data on demand for TVET covered:
- the demand of youth for the formal TVET programmes which is influenced by the demographic processes, progression of youth in the general education and the patterns of transfer from general education to TVET and the labour markets;
- theoretical demand from youth and the child labour who currently have no access to the publicly-funded formal TVET;
- the labour force, by location and gender; - the demand for skills training caused by the structure of the economy (sectors and sub-
sectors) as well as by the structure of skilled jobs in companies from different economic sectors;
- size and growth of the labour force and productivity in different sub-sectors; - the data the FDI and local investments are viewed as important indicators of the future
demand for skilled workforce; and - migration outflows of skilled workers.
The data on the supply of TVET involved:
- enrolment and seat capacity of public and private TVET providers and NGOs per type of institution, TVET programme and award;
- data on the supply of specialist training courses provided by the line ministries for relevant industries; and
- inflows of skilled migrants returning to Bangladesh from the overseas labour markets. The supply- matching- demand data in TVET covered: - direct comparisons between the structure of TVET supply and the labour force structures
in the economy; - labour market success of fresh graduates - unemployment rates of Certificate and Diploma holders; and - company vacancies for skilled jobs
Principal findings
wcms_106496.doc 11
Findings on the demand-side data The demand for TVET in this study is viewed as consisting of two streams - the demand from youth for training courses and the demand from the economy for skilled and educated graduates. The size of the potential demand for TVET courses from the youth who drop out from general education failing to accomplish Grade 8 was impossible to assess because of lack of consistent data on the pupils’ progression in general schooling. Moreover, there is no data available on the patterns of transition of youth from the general education to TVET and the labour markets. The true size of the student-driven demand for TVET was impossible to assess because no data was available on the numbers of applicants: Consiquently, the data on enrolments the demand for training programmes1.
The scope of assessment of the demand of the economy for the educated and skilled workforce, at this stage of the project, has been reduced to the formal economy alone. The assessment of such demand is a particularly complex issue as no data is available on the occupational and qualifications structures of the industry subsectors. This study has been advised by the findings from another empirical study recently implemented by the EC/ILO TVET Reform Project in Bangladesh.2 Its findings indicated that companies in Bangladesh do not use a conventional definitions of the levels of skills and therefore the terms “skilled and high-skilled worker” cannot be used in accurate statistical assessments. The occupational and qualification structures of the industry sub-sectors identified by the latter study only indicate the actual structures of the workforce rather than the jobs’ occupational and qualifications requirements. Discrepancies can be very wide between the actual qualification structures of the workforce and the qualifications requirements of the jobs. It is particularly so in the countries and industries where employers pay no respect to TVET awards. For this reason, the Certificate and Diploma holders may be massively employed in the jobs which do not require any significant training. This situation can be aggravated further when the supply of TVET graduates significantly exceeds the demand for them from the economy. Consequently, an assessment of the demand for an educated and skilled workforce across industries can be improved through comparative assessment of the productivity growth and 1 Training institutions in Dhaka and Chittagong experience increasing demand for admission. In the trades like welding, RAC, Electrical and Electronics, the ratio of applicants to the seating capacity was 3-4/1. In some other trades, the ratio is about 2-3/1. Some trades like civil drafting, mechanical drafting, carpentry, etc. experienced fewer applicants. This indicates that the data on actual enrolments do not adequately describe the demand for skills training.
2 R. Rahman, A. Mondal, R. Islam: (Mapping and Analysis of Growth-Oriented Industrial Sub-Sectors and their Skill Requirements in Bangladesh.) ILO, Dhaka, 2008 draft report
wcms_106496.doc 12
employment growth in different industry subsectors. It can be assumed that the sub-sectors with fast growing productivity and exports, require increased inputs from skilled and educated labour forces. It can also be assumed that the growing industries which continue increasing numbers of their employees will proportionately require more skilled and educated workers and technicians. The opposite assumptions hold true for the industries with declining productivity and employment. The early assessments of changes in the demand for skilled workforce can be done through accessing data on the FDI and local investments in the different industry subsectors. Data published by the Board of Investment (BOI) on growth of industries, employment in industry sectors, FDI flow, local investments, etc. can help to understand the general trends in the demand for TVET. This data is regularly published and available on various websites. The Census of Manufacturing Industries (CMI) is also regularly conducted by BBS. This study benefitted from material generated by the Bangladesh Bureau of Statistics (BBS) which publishes data on population, age groups, workforce, GDP growth, employment, and general education. However, the Labour Force Survey (LFS) which is conducted in Bangladesh every 3-4 years, commonly deals with very general-level data and in its current form cannot be applied as an useful instrument for collecting the specific data on the demand and supply in TVET. The LFS-generated statistical data on large occupational groupings like managers and professionals, clerks, etc. are also available in Bangladesh. However the formats used by the statistical agencies for collecting such data are oversimplified and they can only be used for general guidance rather than for advising decisions on supply and demand in TVET. The issue of industry specific data cannot be addressed without setting-up a system of regular establishment surveys which address demands for information from TVET planners and decision makers. The flows of skilled and educated migrants remain an important factor in Bangladesh training and labour markets. These flows affect both the demand for and supply of skills. Many people acquire education and skills specifically for working overseas. The migration data at district level shows how significant migration flows can be. Although BMET collects and publishes solid data on overseas employment on its website, the profile of such data is insufficient for making judgments on the flow of educated and trained persons. Moreover no data exists on the skilled returnees who contribute to the supply of new skills in the labour market. The need for a national system enabling easy registration and data processing on the unemployed and under-employed skilled and educated people as well as on the industry demand for competent staff would be required in order to improve understanding of whether the education and training markets maintain some sort of equilibrium with the labour markets.
wcms_106496.doc 13
Some data are available on the TVET markets at the district level from which one could be amazed with a massive training offer by the NGOs and private providers. These data were generated however by occasional studies intended for some other purposes and cannot be utilized for the regular training delivery planning and monitoring. Findings on the supply-side data Public TVET in Bangladesh is delivered by institutions belonging to 19 different ministries. A large number of proprietary institutions deliver training courses for fees. Data on TVET providers and their courses, intake, and graduations are available from the agencies like BMET, DTE, BTEB, DYD, Department of Textiles, BANBEIS, etc. Although these data are published irregularly, they have been assessed as reliable. Data on the proprietary providers of TVET are not published regularly. Available are only the data regarding the courses affiliated with BTEB which are published by BTEB. Some data on the private provision is however collected by individual institutions and can be obtained from them. BTEB publishes annual reports involving data on student intake and pass-out rates by course and qualification level. The data on the labour market success of graduates is not, however, collected either centrally or by the individual TVET providers. Although some studies were conducted by BMET, BTEB and other departments on the employment of graduates, these findings are not regular and less reliable.
Hundreds of large and small NGOs offer skills training through short courses. NGOs providing skills training do maintain records of their activities, but this data is never collected and published. Industry bodies also provide training which is adjusted to the needs of relevant industries and companies. Some companies also offer in-house training courses although on a limited scale. There is little or no data on this activity. Industrial companies are considerable suppliers of semi-skilled and skilled workforce through on-the-job training. The scale of on-the-job training for new workers is huge involving in some industries some 20-30 percent of workers at any given time.3 Employers prefer recruiting apprentices and helpers who develop skills through work practice rather than formal training, and workers typically also prefer to learn a trade while working because of immediate earning and employment opportunity. Since establishment surveys are conducted rarely and do not collect data on workers learning trades on the job, this data is not currently available and needs to be explored further.
3 R. Rahman, A Mondal, R.Islam, op.cit.
wcms_106496.doc 14
The demand for skill retraining is growing especially from the labour force retrenched from the public sector enterprises and from returnees from overseas employment. This demand should be taken account of in the development of a national TVET database. Findings on data regarding matching supply and demand in TVET Although it was possible to conceptually outline a sub-set of data for judgments on the degree of alignment between the demand and supply in TVET, most of specific data such as the employment status of fresh TVET graduates, unfilled vacancies for the skilled-worker and technician jobs, share of TVET graduates amongst the registered unemployed, etc. are not currently available on a regular basis. Importantly, the lack of consistent industrial practices in qualifying the jobs as “semiskilled, skilled or high-skilled” or the “technician-level jobs” in Bangladesh prevents making direct comparisons between the demand and supply of graduates for individual trades. New data collection mechanisms are required for producing and processing such data. The data which is currently lacking on TVET includes:
- actual numbers of youth dropping from general schooling after the Grade 5 who are willing to enter further education and training to acquire skills,
- data on progression from different types and levels of education to formal TVET programs,
- potential district-level and upazila-level demand for skills development courses, - regional and district level mapping of TVET program, annual enrolments per trade and
award, - data on expected graduates by skilled occupation, - data on the demand for skilled occupations employed in the local economy and overseas, - data on the education and experience profiles of the unemployed and under-employed, - labour market success of TVET graduates in the occupations in which they received
training - rates of return to TVET per type of programme, etc.
Principle recommendations It is recommended that: 1. A system of TVET-related data be developed in Bangladesh given the massive training
supply and growing demand from youth. Collecting and processing data is expensive and such costs are only justifiable if the data can inform certain policy and management decisions in TVET.
2. In order to assess the demand for TVET programmes, the requirements of the population and
the economy need to be surveyed and published regularly. BBS needs to review its practices of conducting the establishment surveys to incorporate the demand for information required by TVET planners, as availability of accurate data on the industries’ occupational and
wcms_106496.doc 15
qualifications structures would allow improvements to the information base for TVET decisions. The establishment surveys should be more frequent, enabling more effective assessments of the growth and structural changes in the labour force and industry demands for an educated and skilled workforce.
3. Industry should be directly involved in providing data on the demand for skilled workers
across different occupations. This may be a task undertaken by industry associations or trade bodies with assistance from government as necessary. The role of the economic sectors through the Association of trade bodies and other industry bodies needs to be encouraged, enabling them to improve assessment of the demand for skilled and educated graduates and improve their linkages to the TVET system.
4. The collection of supply side data in TVET should cover all major providers. Not all of
them, however, may need to be followed-up on the annual basis. For instance, many short-term programmes are conducted by NGOs in the community to impart skills for income-generating activities. As long as the TVET system is not given a major role in the provision of skills training for income generation, the data on the demand for and supply of such programmes could be collected once in several years.
5. Generating data to assess how the supply of TVET services matches the demand for them is
a new task for many countries. One of the principal indicators here remains the labour market success of TVET graduates. TVET providers should be strictly required to follow up on the labour market status of their graduates and report to their respective agencies: BMET, DTE, DYD, etc on the annual basis. This work should be implemented at various qualification levels and cover graduates of polytechnics, SSC (voc), HSC (voc) and graduates from shorter courses. Collection of data should become a compulsory function assigned to the TVET institutions. TVET providers should be provided with standard questionnaires and their staff trained in the standard procedures for such surveys enabling to ensure reliability of data.
6. Information on enrolments and graduations of individual TVET providers should be made
publicly available allowing for benchmarking of performance. This may or may not be linked to a dedicated website that could be established to guide the public on TVET providers and their course offerings, to provide guidance on the content of TVET programmes and the national TVET qualifications, and to guide TVET students and graduates on the employment opportunities in various trades and industries.
7. Private training providers offering programs not affiliated with BTEB should also be
encouraged to collect the above data and supply them to the relevant agencies. 8. TVET data should be collected, stored and processed, by a dedicated and competent
organization set up for this purpose (ie: a skills training and labour market observatory).
wcms_106496.doc 16
Such an organization should have funds and staff trained in the collection, processing and interpretation of data related to TVET. This data would be used by the policy-makers, TVET administrators and national planners to coordinate, monitor and evaluate progress in TVET. This data would also be indispensable for making investment and funding decisions in TVET.
9. Ongoing work on the data system should continue to expand the data entries, eliminate
duplication and develop methods for combining the data. Methodological and technical guidance for the TVET information system needs to be developed further involving standard forms and techniques of data collection, processing, and interpretation as well as the formats in which the data will be provided to various users. National professionals need to be trained in handling the TVET-related data to ensure sustainability of this important work initiated by the TVET reform project.
10. Data on demand for and supply of TVET may best be structured on the basis of the system
of occupational qualifications which is currently undergoing a review by the TVET reform project. This would allow for identification of qualification structures in the economy, as well as skills shortages, and will help maintain the supply-demand equilibrium between TVET and the labour market.
11. Skills development in the vast informal economy of Bangladesh is taking place on an
enormous scale as it is a matter of personal survival for millions of people. This issue has not been touched upon during the current phase of this study. It would appear that the type of data, and methods of collection for the demand and supply of skills in the informal economy are different and will be addressed later in the TVET Reform Project.
wcms_106496.doc 17
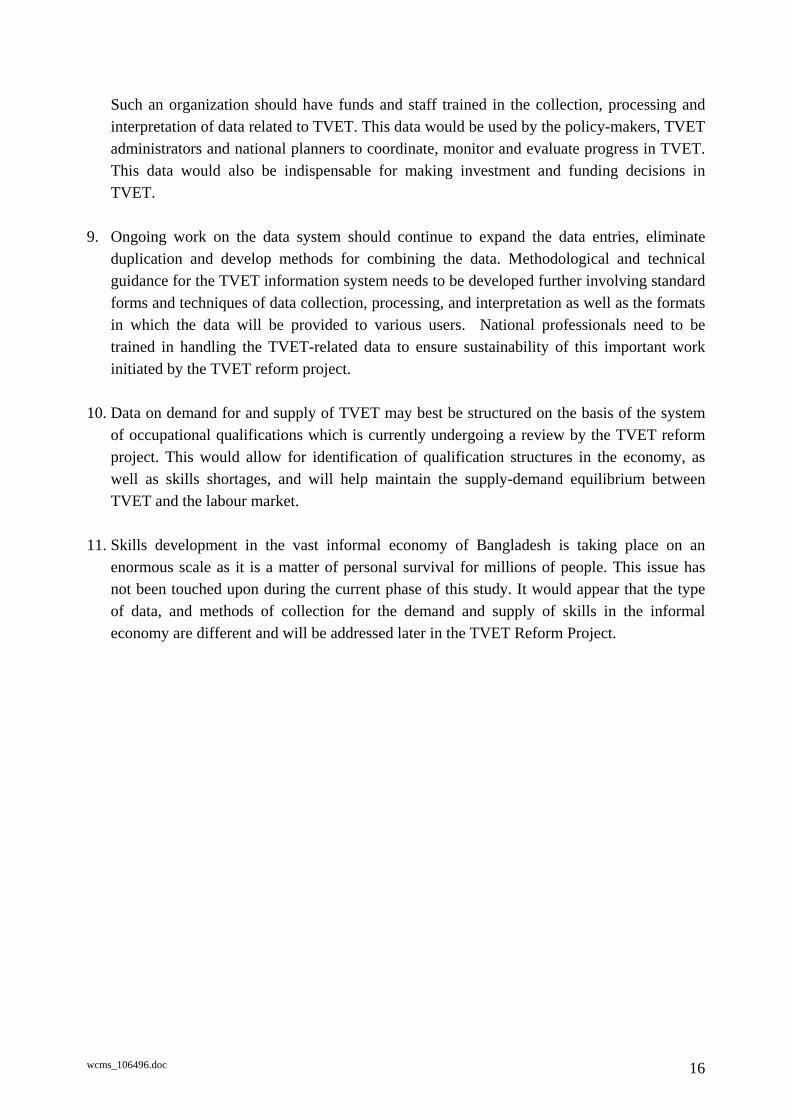
CHAPTER I: DATA ON THE DEMAND SIDE IN TVET 1. Data on the student demand for TVET 1.1 Data on potential demand for TVET courses from youth who finished general schooling at Grades 5-7 The present education system of Bangladesh is divided into three major stages - primary, secondary and tertiary education. The primary level institutions impart primary education. Junior, secondary and higher secondary level institutions impart secondary education. The Degree, Masters and other higher-level qualifications are awarded by the tertiary education institutions. Primary education (Grade I-V) is administered by the Ministry of Primary and Mass Education (MOPME), while all other educational areas up to the higher education are supervised by the Ministry of Education (MOE). The post-primary stream of education is structured into two systems in terms of curriculum: general education and madrasah education The TVET stream starts after the completion of Grade 8. Many general education students drop out after the completion of primary education. Currently, this vast group who stopped their education before accomplishing Grade 8 are not entitled to enroll in any formal TVET course. For this reason they have to join the labour market without training and at the ages which are below the legal working age (15 years). Improvements in the national skills development system and the system of formal qualifications should aim to accommodate these youth. For this reason it is necessary to collect data on this group of youth who accomplished primary school but failed to complete Grade 8. Such data is currently not collected by BBS and BANBEIS. The information currently available on the general education system is presented in Table D01 and Table D02 below:
Table D01: Number of primary schools and enrolments Primary Schools Number of schools Pupils (000)
2004 2005 2004 2005 Public Primary Schools 37,671 37,672 10,359 9,484 Private Primary Schools & Other 45,197 42,729 7,593 6,742
Total 82,868 80,401 17,952 16,226 Source: BBS
wcms_106496.doc 18
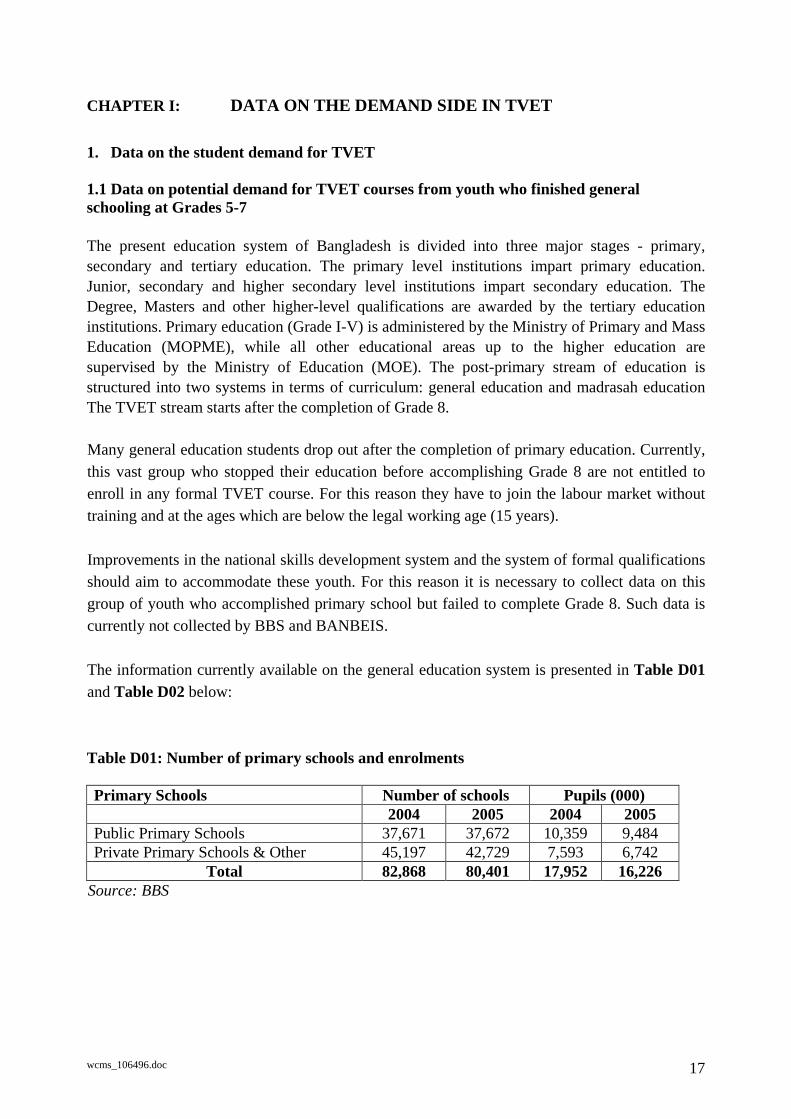
Table D02: Number of secondary schools and students by Division
School Student (000) Division 2003 2005 2003 2005
Barisal 1557 1634 487 521 Chittagong 2668 2812 1481 1442 Dhaka 4185 4369 2057 2092 Khulna 2516 2743 960 1031 Rajshahi 5723 6144 2028 1978 Sylhet 737 798 325 335 Total 17,386 18,500 7,338 7,399
Source: BBS An estimate of the number of drop-outs from primary schools could be done as follows. The number of pupils at the primary level in both the public and private primary schools and other primary level institutions in 2005 was 16,226,000. The number of students in TVET at SSC level is 73,99,000. About 7,51,421 students appeared in the SSC examinations and 3,94.993 of them passed out in 2005. From these figures it can be assumed that about 8,00,000 students annually reach grade 8 and 8+ and qualify for the formal TVET Programmes. About 30,00,000 pupils reach Grade 5 annually. Therefore about (30,00,00 - 8,00,000) = 22,00,000 students drop out annually after completion of Grade 5. Data on this large group of youth who although have not reached Grade 8 but may be able and willing to undertake vocational training is currently not available. The structure of such data to be collected in the future is proposed in Table D03.
Table D03: Annual school completions from Grades 5-6-7-8 (by location and gender) Urban Rural Total Grades Male Female Male Female Male Female
Completed Grade 5 Completed Grade 6 Completed Grade 7 Completed Grade 8 Total drop-outs who fail to accomplish Grade 8
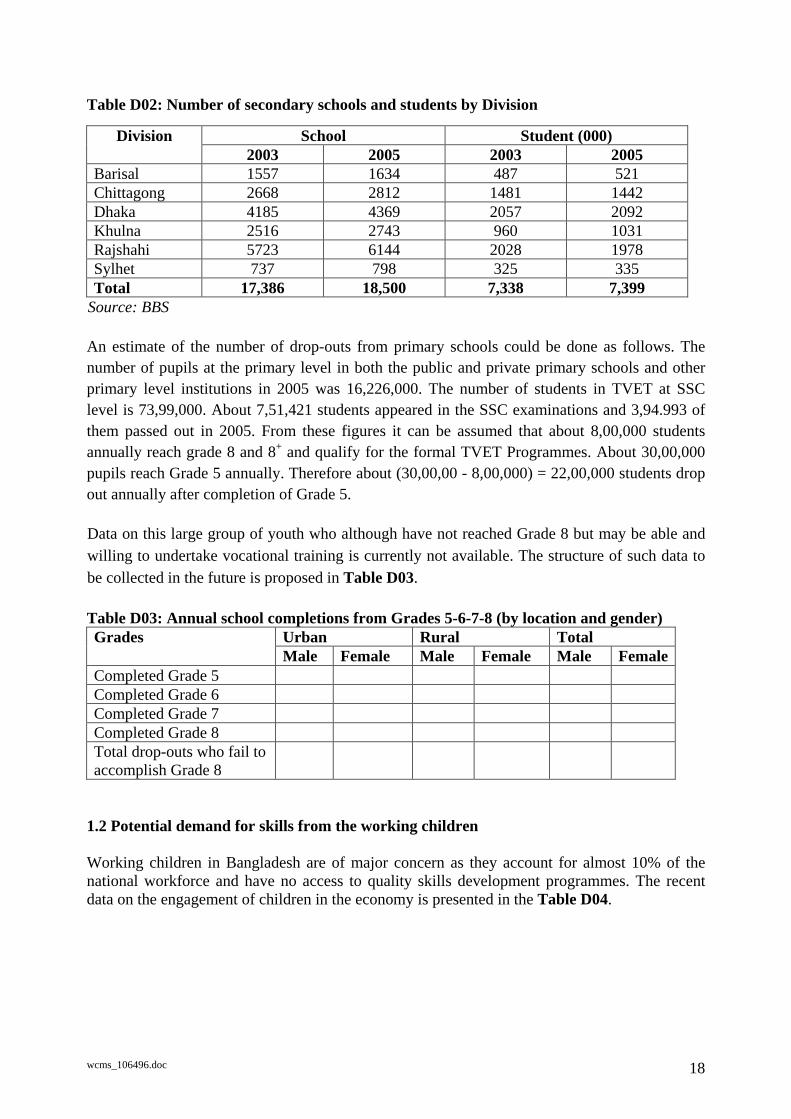
1.2 Potential demand for skills from the working children Working children in Bangladesh are of major concern as they account for almost 10% of the national workforce and have no access to quality skills development programmes. The recent data on the engagement of children in the economy is presented in the Table D04.
wcms_106496.doc 19
Table D04: Key data on the child labour, 1999-2000
1999-2000 SL. No.
Characteristics Total Male Female
1. Child labour force as % of total LFS 11.2 10.7 12.0 Wage employed child labour as % of total child labour (10-14 years)
Number (000) 1185 654 531
2.
Percent (%) 17.5 16.2 19.3 Child workers by major occupation (%) Total 100.0 100.0 100.0 Technical, administrative and managerial services 0.6 0.5 0.6 Production and transport labours 15.4 15.3 15.8 Clerical workers 0.5 0.7 0.1 Sales workers 9.9 15.6 1.4 Service workers 9.6 5.8 15.1 Agri. forestry and fisheries 64.0 62.1 67.0
3.
Not adequately defined (NAD) - - - Child workers by major industry (%) Total 100.0 100.0 100.0 Agriculture 64.2 62.2 67.1 Manufacturing 8.2 7.2 9.8 Transport/communication 2.6 4.2 0.2 Other services 14.4 21.5 3.9
4.
Other activities including household services - - - Employment status of child workers (%) Total 100.0 100.0 100.0 Employees 18.8 17.4 20.9 Self-employed 9.3 11.4 6.1 Unpaid family workers 60.3 55.1 68.1
5.
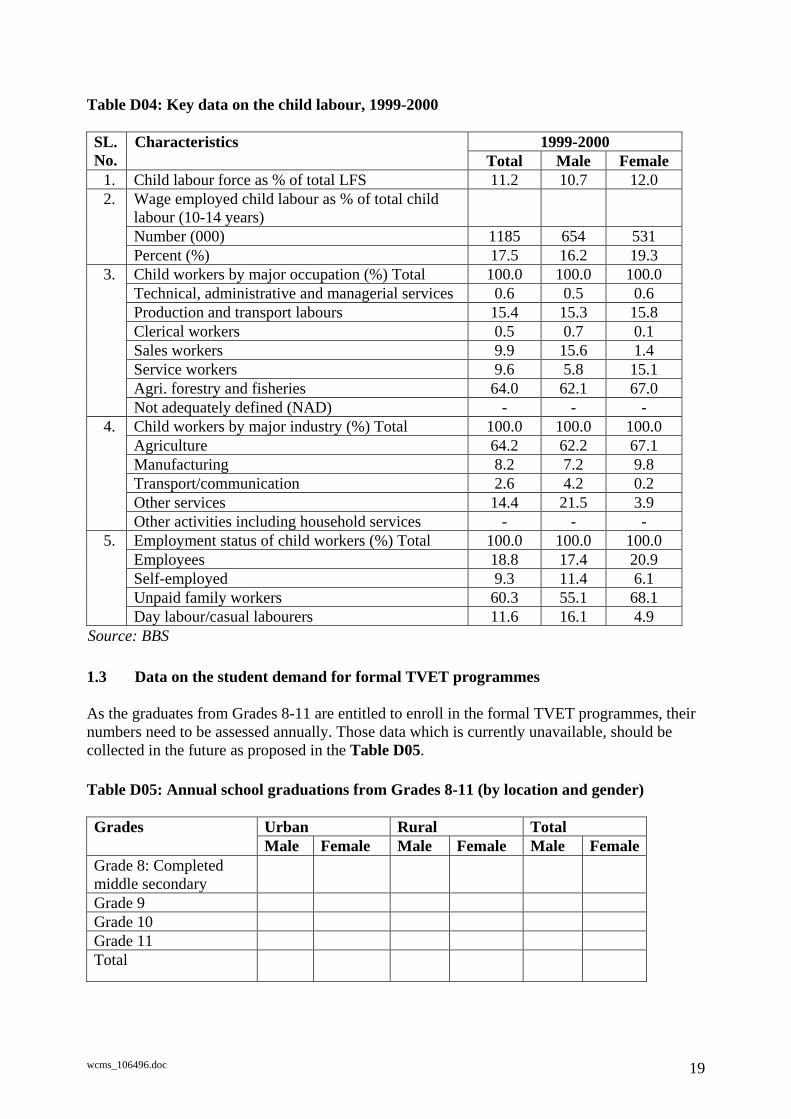
Day labour/casual labourers 11.6 16.1 4.9 Source: BBS 1.3 Data on the student demand for formal TVET programmes As the graduates from Grades 8-11 are entitled to enroll in the formal TVET programmes, their numbers need to be assessed annually. Those data which is currently unavailable, should be collected in the future as proposed in the Table D05.
Table D05: Annual school graduations from Grades 8-11 (by location and gender)
Urban Rural Total Grades Male Female Male Female Male Female
Grade 8: Completed middle secondary
Grade 9 Grade 10 Grade 11 Total
wcms_106496.doc 20
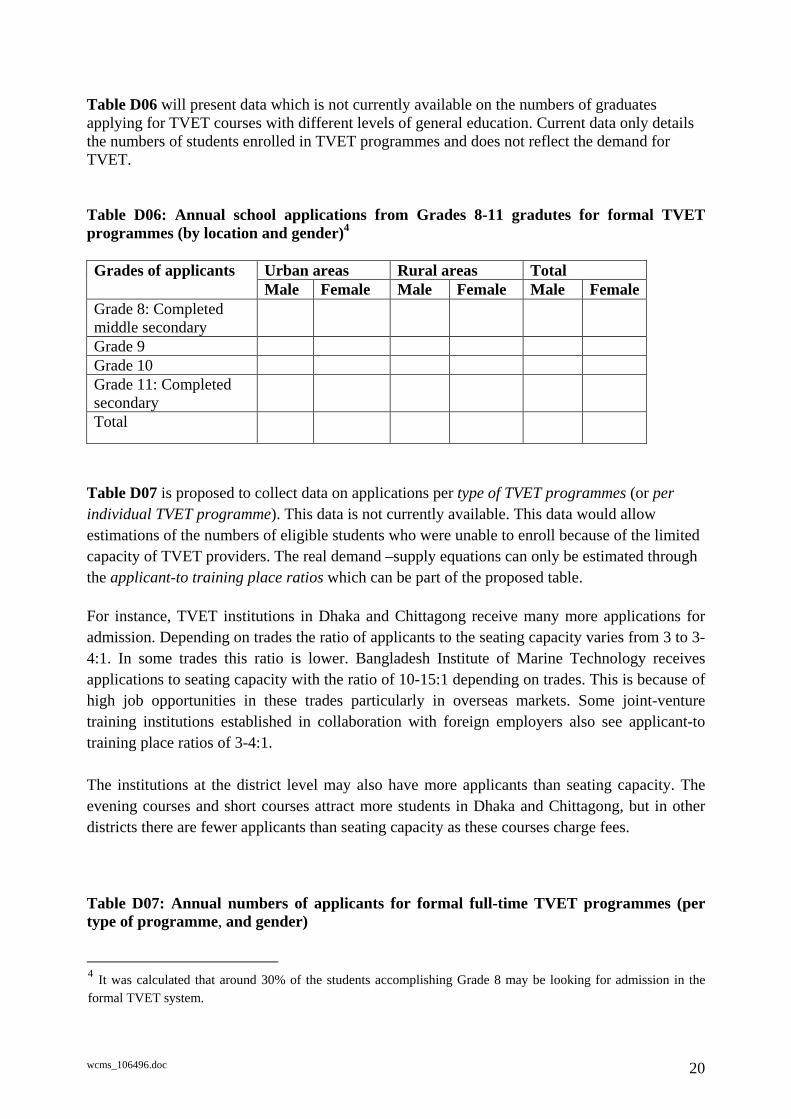
Table D06 will present data which is not currently available on the numbers of graduates applying for TVET courses with different levels of general education. Current data only details the numbers of students enrolled in TVET programmes and does not reflect the demand for TVET.
Table D06: Annual school applications from Grades 8-11 gradutes for formal TVET programmes (by location and gender)4
Urban areas Rural areas Total Grades of applicants Male Female Male Female Male Female
Grade 8: Completed middle secondary
Grade 9 Grade 10 Grade 11: Completed secondary
Total
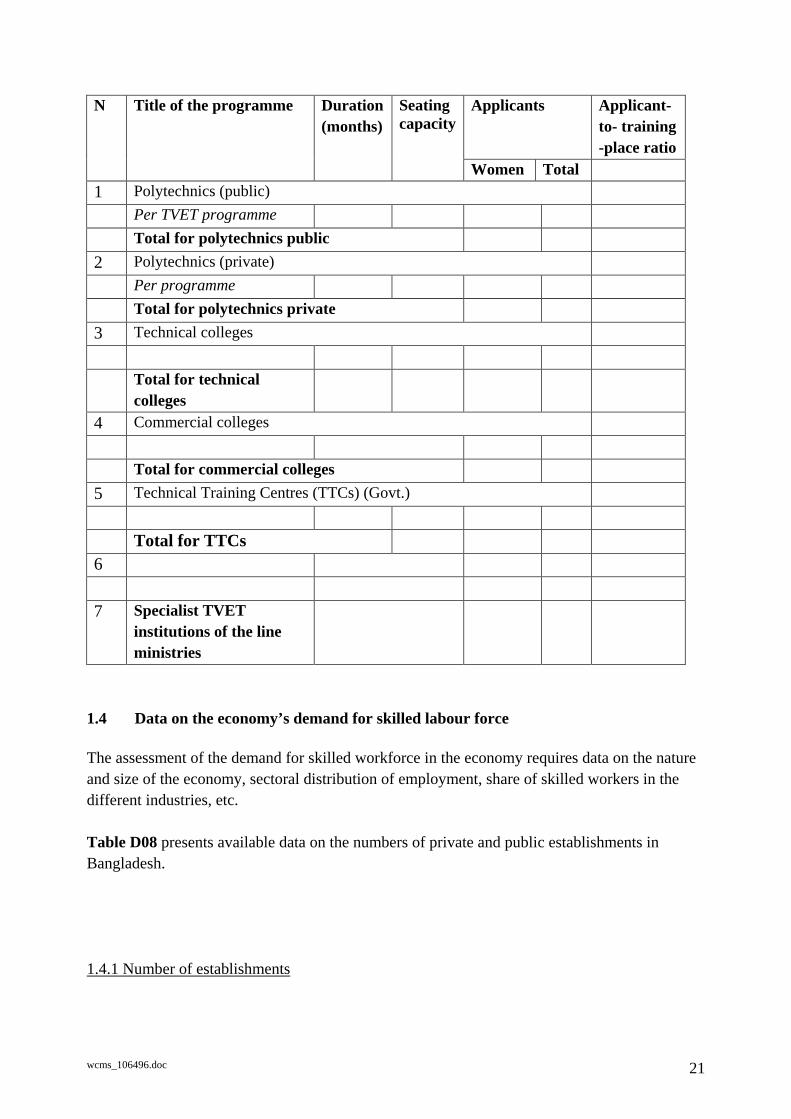
Table D07 is proposed to collect data on applications per type of TVET programmes (or per individual TVET programme). This data is not currently available. This data would allow estimations of the numbers of eligible students who were unable to enroll because of the limited capacity of TVET providers. The real demand –supply equations can only be estimated through the applicant-to training place ratios which can be part of the proposed table. For instance, TVET institutions in Dhaka and Chittagong receive many more applications for admission. Depending on trades the ratio of applicants to the seating capacity varies from 3 to 3-4:1. In some trades this ratio is lower. Bangladesh Institute of Marine Technology receives applications to seating capacity with the ratio of 10-15:1 depending on trades. This is because of high job opportunities in these trades particularly in overseas markets. Some joint-venture training institutions established in collaboration with foreign employers also see applicant-to training place ratios of 3-4:1. The institutions at the district level may also have more applicants than seating capacity. The evening courses and short courses attract more students in Dhaka and Chittagong, but in other districts there are fewer applicants than seating capacity as these courses charge fees.
Table D07: Annual numbers of applicants for formal full-time TVET programmes (per type of programme, and gender)
4 It was calculated that around 30% of the students accomplishing Grade 8 may be looking for admission in the formal TVET system.
wcms_106496.doc 21
Applicants Applicant- to- training -place ratio
N Title of the programme Duration(months)
Seating capacity
Women Total 1 Polytechnics (public)
Per TVET programme Total for polytechnics public
2 Polytechnics (private) Per programme Total for polytechnics private
3 Technical colleges
Total for technical colleges
4 Commercial colleges
Total for commercial colleges 5 Technical Training Centres (TTCs) (Govt.)
Total for TTCs 6
7 Specialist TVET institutions of the line ministries
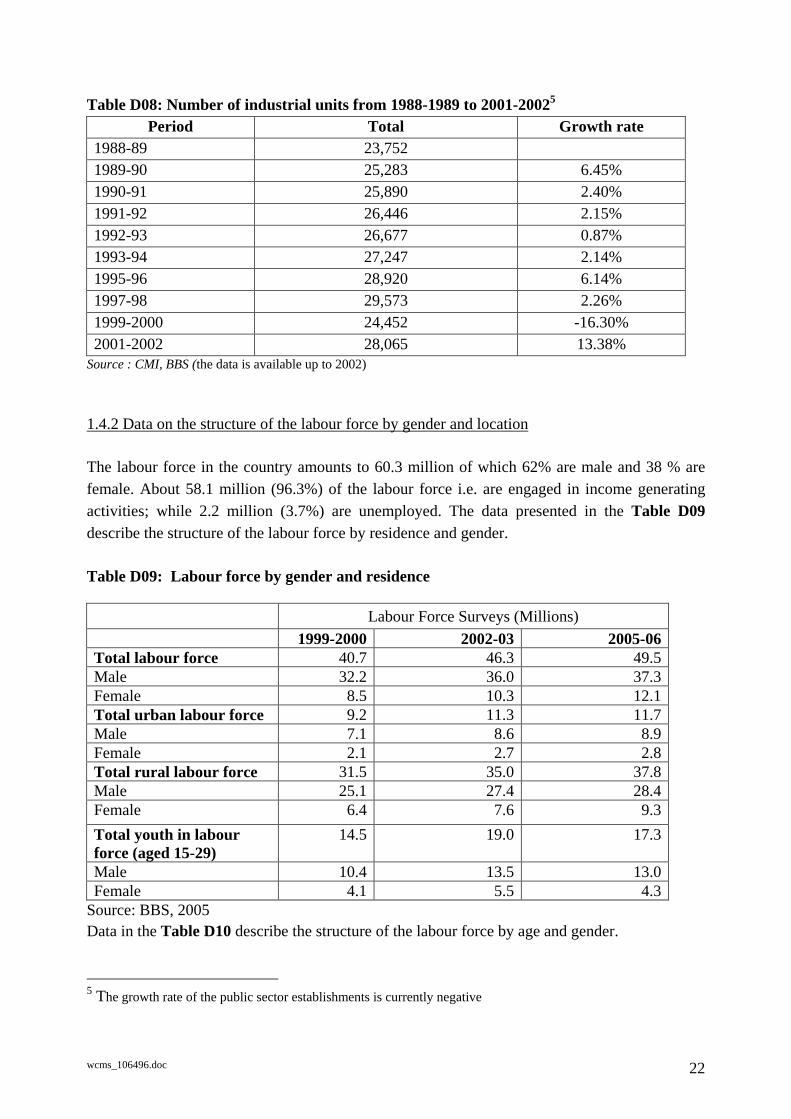
1.4 Data on the economy’s demand for skilled labour force The assessment of the demand for skilled workforce in the economy requires data on the nature and size of the economy, sectoral distribution of employment, share of skilled workers in the different industries, etc. Table D08 presents available data on the numbers of private and public establishments in Bangladesh.
1.4.1 Number of establishments
wcms_106496.doc 22
Table D08: Number of industrial units from 1988-1989 to 2001-20025
Period Total Growth rate 1988-89 23,752 1989-90 25,283 6.45% 1990-91 25,890 2.40% 1991-92 26,446 2.15% 1992-93 26,677 0.87% 1993-94 27,247 2.14% 1995-96 28,920 6.14% 1997-98 29,573 2.26% 1999-2000 24,452 -16.30% 2001-2002 28,065 13.38%
Source : CMI, BBS (the data is available up to 2002)
1.4.2 Data on the structure of the labour force by gender and location
The labour force in the country amounts to 60.3 million of which 62% are male and 38 % are female. About 58.1 million (96.3%) of the labour force i.e. are engaged in income generating activities; while 2.2 million (3.7%) are unemployed. The data presented in the Table D09 describe the structure of the labour force by residence and gender. Table D09: Labour force by gender and residence
Labour Force Surveys (Millions) 1999-2000 2002-03 2005-06
Total labour force 40.7 46.3 49.5Male 32.2 36.0 37.3Female 8.5 10.3 12.1Total urban labour force 9.2 11.3 11.7Male 7.1 8.6 8.9Female 2.1 2.7 2.8Total rural labour force 31.5 35.0 37.8Male 25.1 27.4 28.4Female 6.4 7.6 9.3Total youth in labour force (aged 15-29)
14.5 19.0 17.3
Male 10.4 13.5 13.0Female 4.1 5.5 4.3
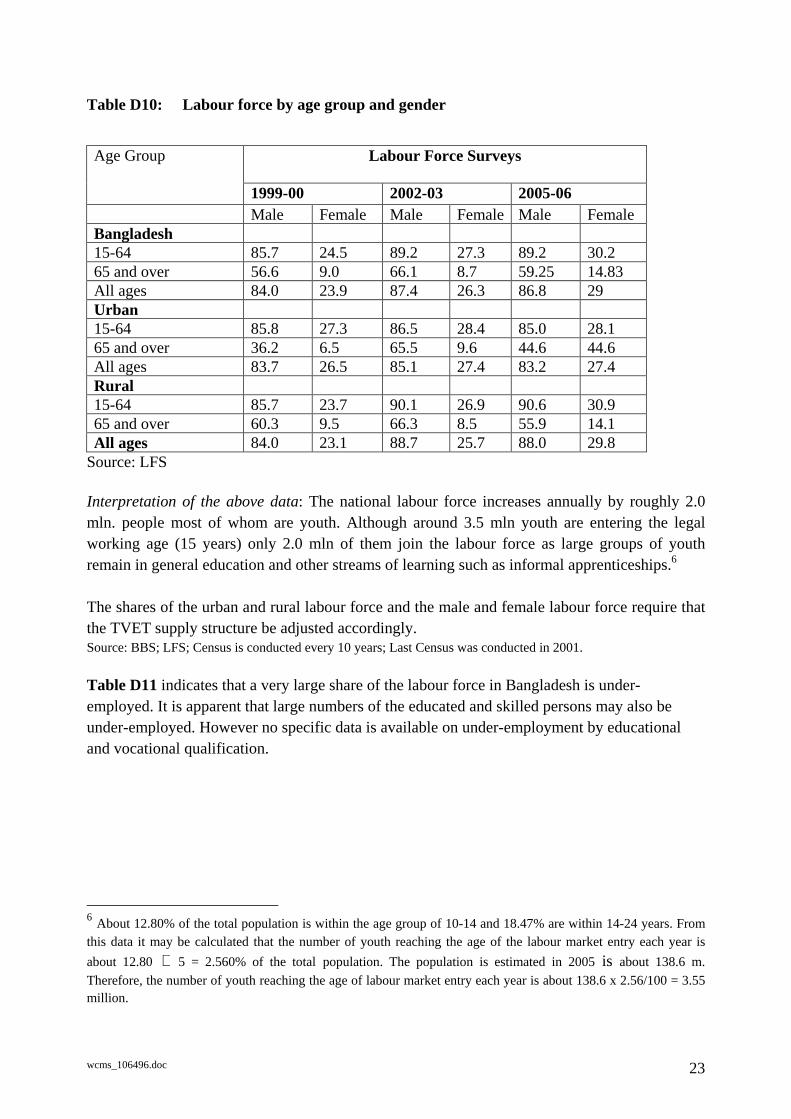
Source: BBS, 2005 Data in the Table D10 describe the structure of the labour force by age and gender.
5 The growth rate of the public sector establishments is currently negative
wcms_106496.doc 23
Table D10: Labour force by age group and gender
Labour Force Surveys
Age Group
1999-00 2002-03 2005-06 Male Female Male Female Male Female
Bangladesh 15-64 85.7 24.5 89.2 27.3 89.2 30.2 65 and over 56.6 9.0 66.1 8.7 59.25 14.83 All ages 84.0 23.9 87.4 26.3 86.8 29 Urban 15-64 85.8 27.3 86.5 28.4 85.0 28.1 65 and over 36.2 6.5 65.5 9.6 44.6 44.6 All ages 83.7 26.5 85.1 27.4 83.2 27.4 Rural 15-64 85.7 23.7 90.1 26.9 90.6 30.9 65 and over 60.3 9.5 66.3 8.5 55.9 14.1 All ages 84.0 23.1 88.7 25.7 88.0 29.8
Source: LFS Interpretation of the above data: The national labour force increases annually by roughly 2.0 mln. people most of whom are youth. Although around 3.5 mln youth are entering the legal working age (15 years) only 2.0 mln of them join the labour force as large groups of youth remain in general education and other streams of learning such as informal apprenticeships.6
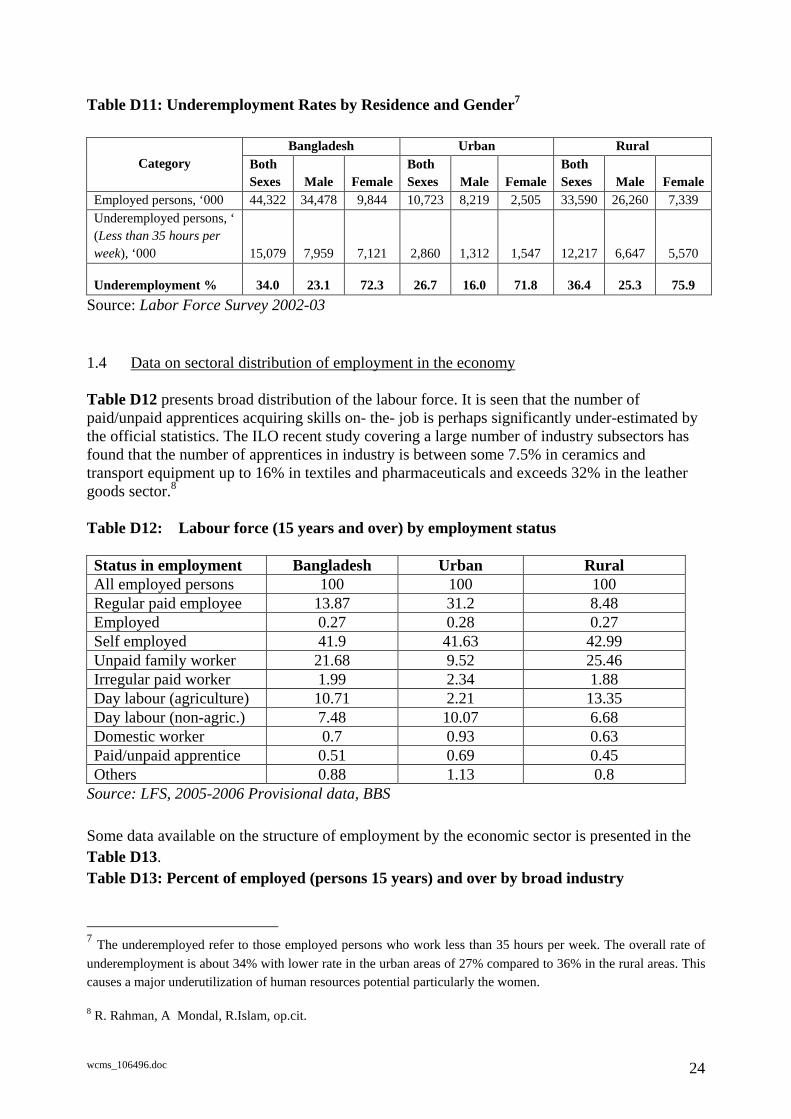
The shares of the urban and rural labour force and the male and female labour force require that the TVET supply structure be adjusted accordingly. Source: BBS; LFS; Census is conducted every 10 years; Last Census was conducted in 2001. Table D11 indicates that a very large share of the labour force in Bangladesh is under-employed. It is apparent that large numbers of the educated and skilled persons may also be under-employed. However no specific data is available on under-employment by educational and vocational qualification.
6 About 12.80% of the total population is within the age group of 10-14 and 18.47% are within 14-24 years. From this data it may be calculated that the number of youth reaching the age of the labour market entry each year is about 12.80 ÷ 5 = 2.560% of the total population. The population is estimated in 2005 is about 138.6 m. Therefore, the number of youth reaching the age of labour market entry each year is about 138.6 x 2.56/100 = 3.55 million.
wcms_106496.doc 24
Table D11: Underemployment Rates by Residence and Gender7
Bangladesh Urban Rural Category
Both Sexes Male Female
Both Sexes Male Female
Both Sexes Male Female
Employed persons, ‘000 44,322 34,478 9,844 10,723 8,219 2,505 33,590 26,260 7,339 Underemployed persons, ‘ (Less than 35 hours per week), ‘000 15,079 7,959 7,121 2,860 1,312 1,547 12,217 6,647 5,570
Underemployment % 34.0 23.1 72.3 26.7 16.0 71.8 36.4 25.3 75.9 Source: Labor Force Survey 2002-03
1.4 Data on sectoral distribution of employment in the economy
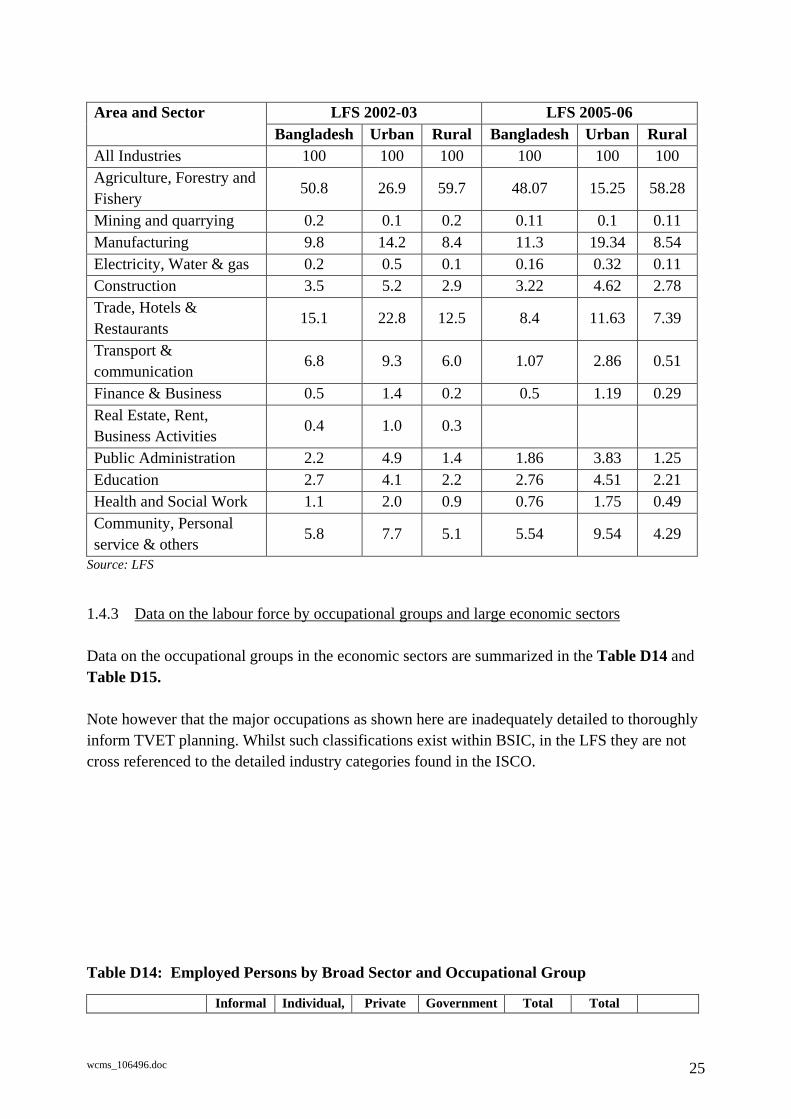
Table D12 presents broad distribution of the labour force. It is seen that the number of paid/unpaid apprentices acquiring skills on- the- job is perhaps significantly under-estimated by the official statistics. The ILO recent study covering a large number of industry subsectors has found that the number of apprentices in industry is between some 7.5% in ceramics and transport equipment up to 16% in textiles and pharmaceuticals and exceeds 32% in the leather goods sector.8
Table D12: Labour force (15 years and over) by employment status Status in employment Bangladesh Urban Rural All employed persons 100 100 100 Regular paid employee 13.87 31.2 8.48 Employed 0.27 0.28 0.27 Self employed 41.9 41.63 42.99 Unpaid family worker 21.68 9.52 25.46 Irregular paid worker 1.99 2.34 1.88 Day labour (agriculture) 10.71 2.21 13.35 Day labour (non-agric.) 7.48 10.07 6.68 Domestic worker 0.7 0.93 0.63 Paid/unpaid apprentice 0.51 0.69 0.45 Others 0.88 1.13 0.8
Source: LFS, 2005-2006 Provisional data, BBS
Some data available on the structure of employment by the economic sector is presented in the Table D13.Table D13: Percent of employed (persons 15 years) and over by broad industry
7 The underemployed refer to those employed persons who work less than 35 hours per week. The overall rate of underemployment is about 34% with lower rate in the urban areas of 27% compared to 36% in the rural areas. This causes a major underutilization of human resources potential particularly the women. 8 R. Rahman, A Mondal, R.Islam, op.cit.
wcms_106496.doc 25
LFS 2002-03 LFS 2005-06 Area and Sector Bangladesh Urban Rural Bangladesh Urban Rural
All Industries 100 100 100 100 100 100 Agriculture, Forestry and Fishery
50.8 26.9 59.7 48.07 15.25 58.28
Mining and quarrying 0.2 0.1 0.2 0.11 0.1 0.11 Manufacturing 9.8 14.2 8.4 11.3 19.34 8.54 Electricity, Water & gas 0.2 0.5 0.1 0.16 0.32 0.11 Construction 3.5 5.2 2.9 3.22 4.62 2.78 Trade, Hotels & Restaurants
15.1 22.8 12.5 8.4 11.63 7.39
Transport & communication
6.8 9.3 6.0 1.07 2.86 0.51
Finance & Business 0.5 1.4 0.2 0.5 1.19 0.29 Real Estate, Rent, Business Activities
0.4 1.0 0.3
Public Administration 2.2 4.9 1.4 1.86 3.83 1.25 Education 2.7 4.1 2.2 2.76 4.51 2.21 Health and Social Work 1.1 2.0 0.9 0.76 1.75 0.49 Community, Personal service & others
5.8 7.7 5.1 5.54 9.54 4.29
Source: LFS
1.4.3 Data on the labour force by occupational groups and large economic sectors
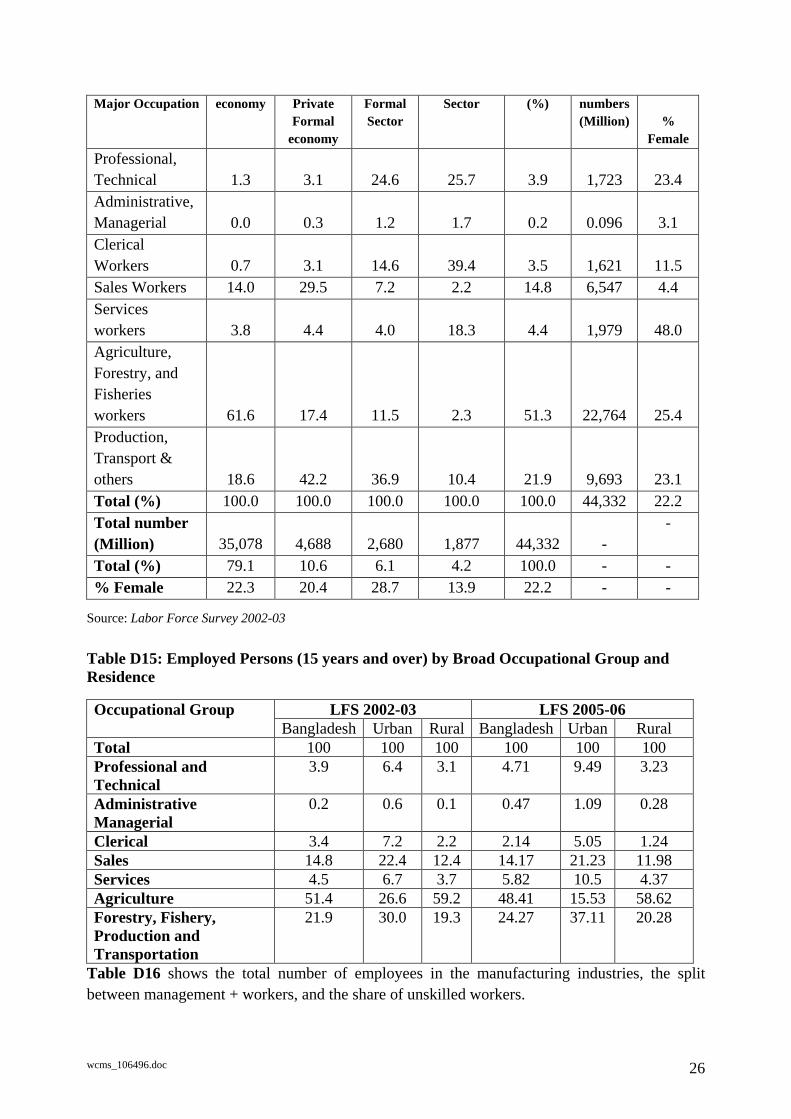
Data on the occupational groups in the economic sectors are summarized in the Table D14 and Table D15. Note however that the major occupations as shown here are inadequately detailed to thoroughly inform TVET planning. Whilst such classifications exist within BSIC, in the LFS they are not cross referenced to the detailed industry categories found in the ISCO.
Table D14: Employed Persons by Broad Sector and Occupational Group
Informal Individual, Private Government Total Total
wcms_106496.doc 26
Major Occupation economy Private Formal
economy
Formal Sector
Sector (%) numbers (Million)
%
Female Professional, Technical 1.3 3.1 24.6 25.7 3.9 1,723
23.4
Administrative, Managerial 0.0 0.3 1.2 1.7 0.2 0.096
3.1
Clerical Workers 0.7 3.1 14.6 39.4 3.5 1,621
11.5
Sales Workers 14.0 29.5 7.2 2.2 14.8 6,547 4.4 Services workers 3.8 4.4 4.0 18.3 4.4 1,979
48.0
Agriculture, Forestry, and Fisheries workers 61.6 17.4 11.5 2.3 51.3 22,764
25.4 Production, Transport & others 18.6 42.2 36.9 10.4 21.9 9,693
23.1 Total (%) 100.0 100.0 100.0 100.0 100.0 44,332 22.2 Total number (Million) 35,078 4,688 2,680 1,877 44,332 -
-
Total (%) 79.1 10.6 6.1 4.2 100.0 - - % Female 22.3 20.4 28.7 13.9 22.2 - -
Source: Labor Force Survey 2002-03
Table D15: Employed Persons (15 years and over) by Broad Occupational Group and Residence
LFS 2002-03 LFS 2005-06 Occupational Group
Bangladesh Urban Rural Bangladesh Urban Rural Total 100 100 100 100 100 100 Professional and Technical
3.9 6.4 3.1 4.71 9.49 3.23
Administrative Managerial
0.2 0.6 0.1 0.47 1.09 0.28
Clerical 3.4 7.2 2.2 2.14 5.05 1.24 Sales 14.8 22.4 12.4 14.17 21.23 11.98 Services 4.5 6.7 3.7 5.82 10.5 4.37 Agriculture 51.4 26.6 59.2 48.41 15.53 58.62 Forestry, Fishery, Production and Transportation
21.9 30.0 19.3 24.27 37.11 20.28
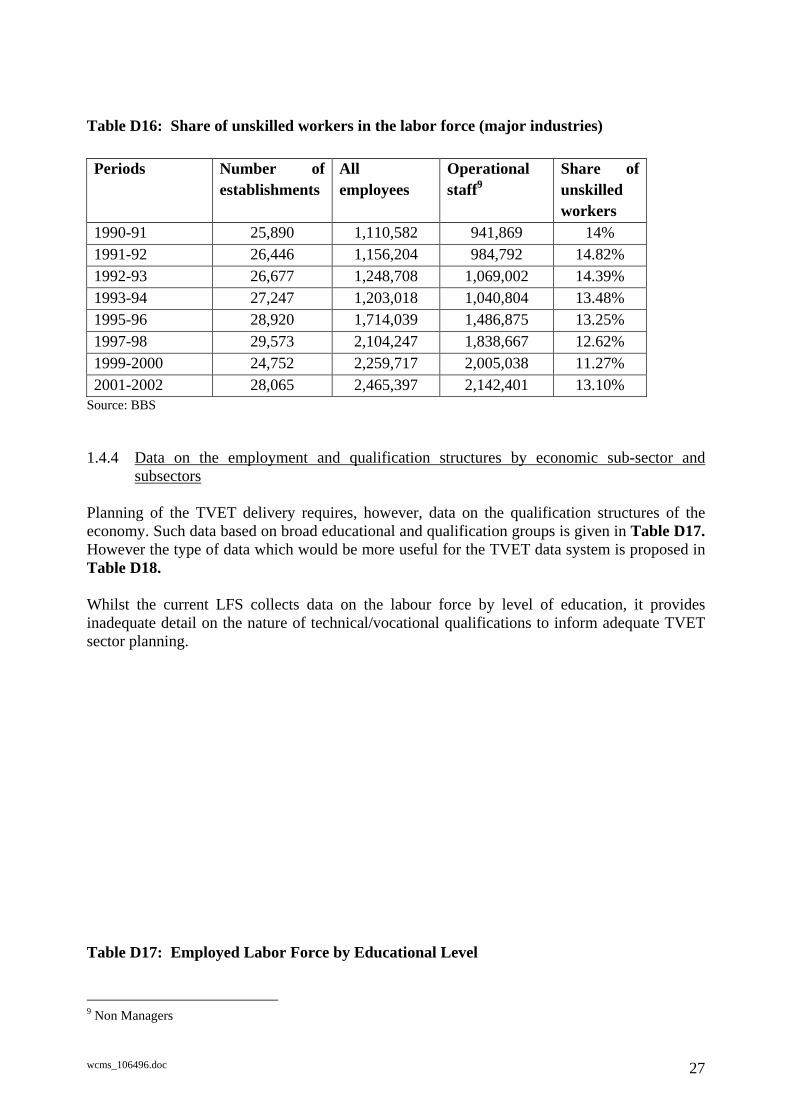
Table D16 shows the total number of employees in the manufacturing industries, the split between management + workers, and the share of unskilled workers.
wcms_106496.doc 27
Table D16: Share of unskilled workers in the labor force (major industries) Periods Number of
establishments All employees
Operational staff9
Share of unskilled workers
1990-91 25,890 1,110,582 941,869 14% 1991-92 26,446 1,156,204 984,792 14.82% 1992-93 26,677 1,248,708 1,069,002 14.39% 1993-94 27,247 1,203,018 1,040,804 13.48% 1995-96 28,920 1,714,039 1,486,875 13.25% 1997-98 29,573 2,104,247 1,838,667 12.62% 1999-2000 24,752 2,259,717 2,005,038 11.27% 2001-2002 28,065 2,465,397 2,142,401 13.10%
Source: BBS
1.4.4 Data on the employment and qualification structures by economic sub-sector and subsectors
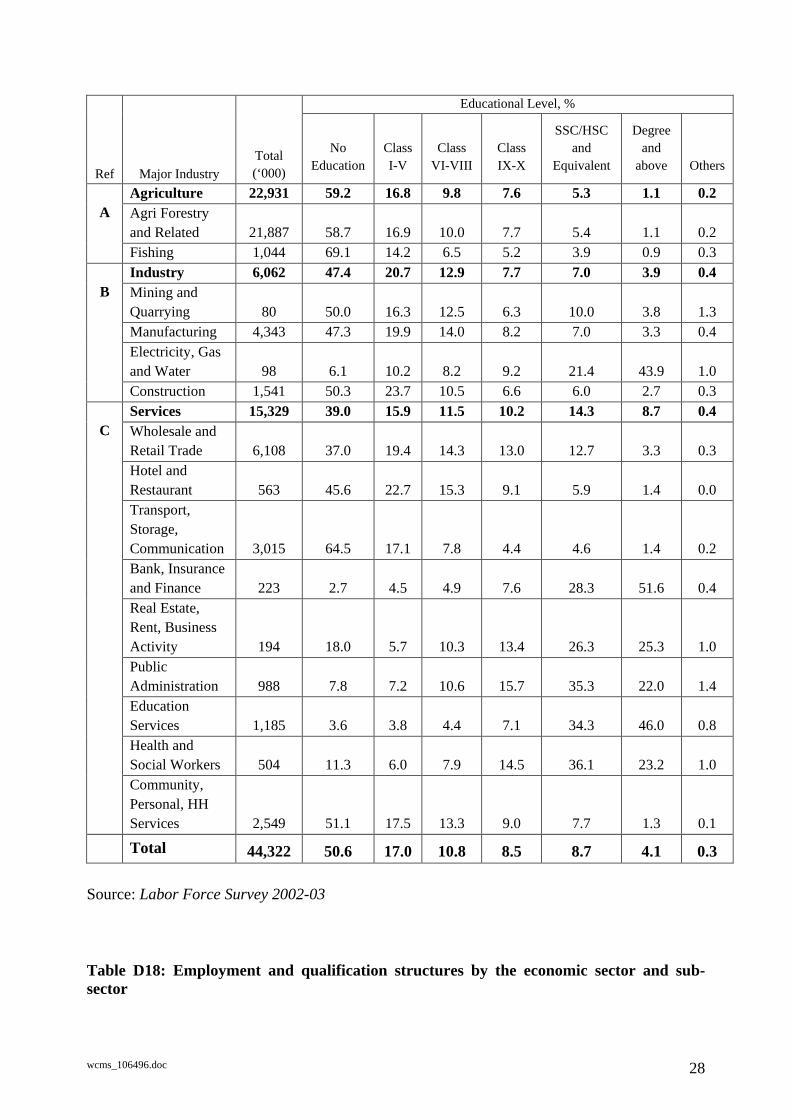
Planning of the TVET delivery requires, however, data on the qualification structures of the economy. Such data based on broad educational and qualification groups is given in Table D17. However the type of data which would be more useful for the TVET data system is proposed in Table D18. Whilst the current LFS collects data on the labour force by level of education, it provides inadequate detail on the nature of technical/vocational qualifications to inform adequate TVET sector planning.
Table D17: Employed Labor Force by Educational Level
9 Non Managers
wcms_106496.doc 28
Educational Level, %
Ref
Major Industry Total (‘000)
No
Education
Class I-V
Class
VI-VIII
Class IX-X
SSC/HSC and
Equivalent
Degree and
above
Others
Agriculture 22,931 59.2 16.8 9.8 7.6 5.3 1.1 0.2 Agri Forestry and Related 21,887 58.7 16.9 10.0 7.7 5.4 1.1 0.2
A
Fishing 1,044 69.1 14.2 6.5 5.2 3.9 0.9 0.3 Industry 6,062 47.4 20.7 12.9 7.7 7.0 3.9 0.4 Mining and Quarrying 80 50.0 16.3 12.5 6.3 10.0 3.8 1.3 Manufacturing 4,343 47.3 19.9 14.0 8.2 7.0 3.3 0.4 Electricity, Gas and Water 98 6.1 10.2 8.2 9.2 21.4 43.9 1.0
B
Construction 1,541 50.3 23.7 10.5 6.6 6.0 2.7 0.3 Services 15,329 39.0 15.9 11.5 10.2 14.3 8.7 0.4 Wholesale and Retail Trade 6,108 37.0 19.4 14.3 13.0 12.7 3.3 0.3 Hotel and Restaurant 563 45.6 22.7 15.3 9.1 5.9 1.4 0.0 Transport, Storage, Communication 3,015 64.5 17.1 7.8 4.4 4.6 1.4 0.2 Bank, Insurance and Finance 223 2.7 4.5 4.9 7.6 28.3 51.6 0.4 Real Estate, Rent, Business Activity 194 18.0 5.7 10.3 13.4 26.3 25.3 1.0 Public Administration 988 7.8 7.2 10.6 15.7 35.3 22.0 1.4 Education Services 1,185 3.6 3.8 4.4 7.1 34.3 46.0 0.8 Health and Social Workers 504 11.3 6.0 7.9 14.5 36.1 23.2 1.0
C
Community, Personal, HH Services 2,549 51.1 17.5 13.3 9.0 7.7 1.3 0.1
Total 44,322 50.6 17.0 10.8 8.5 8.7 4.1 0.3
Source: Labor Force Survey 2002-03
Table D18: Employment and qualification structures by the economic sector and sub-sector

wcms_106496.doc 29
Qualification structures11
N Sub-sectors10 Employment(thousands)
Managers and
professionalsTechnicians Clerks
High-skilled and skilled
workers
Semi-skilled workers
Manufacturing Industries
Wearing apparel
Drugs & pharmaceutical
Mfg. of textile Food manufacturing
Tobacco manufacturing
Other chemical production
Pottery & China-wear
Furniture & fixtures
Ginning & processing
Printing & publishing
Non-metal mineral Leather footwear Transport equipment
Electrical machinery
Industrial chemicals
Iron & steel basic industry
Leather & leather products
Beverage industriesPaper & paper products
Fabricated metal products
Plastic products OTHER INDUSTRIES
Construction Communication
10 The sub-sectors should be named according to BSIC.. 11 Note that these qualification, titles should be aligned with the TVQF currently underdevelopment for Bangladesh.
wcms_106496.doc 30
Transport, etc.
Services Education Health, etc.
Financial services, Banking, and Insurance, etc.
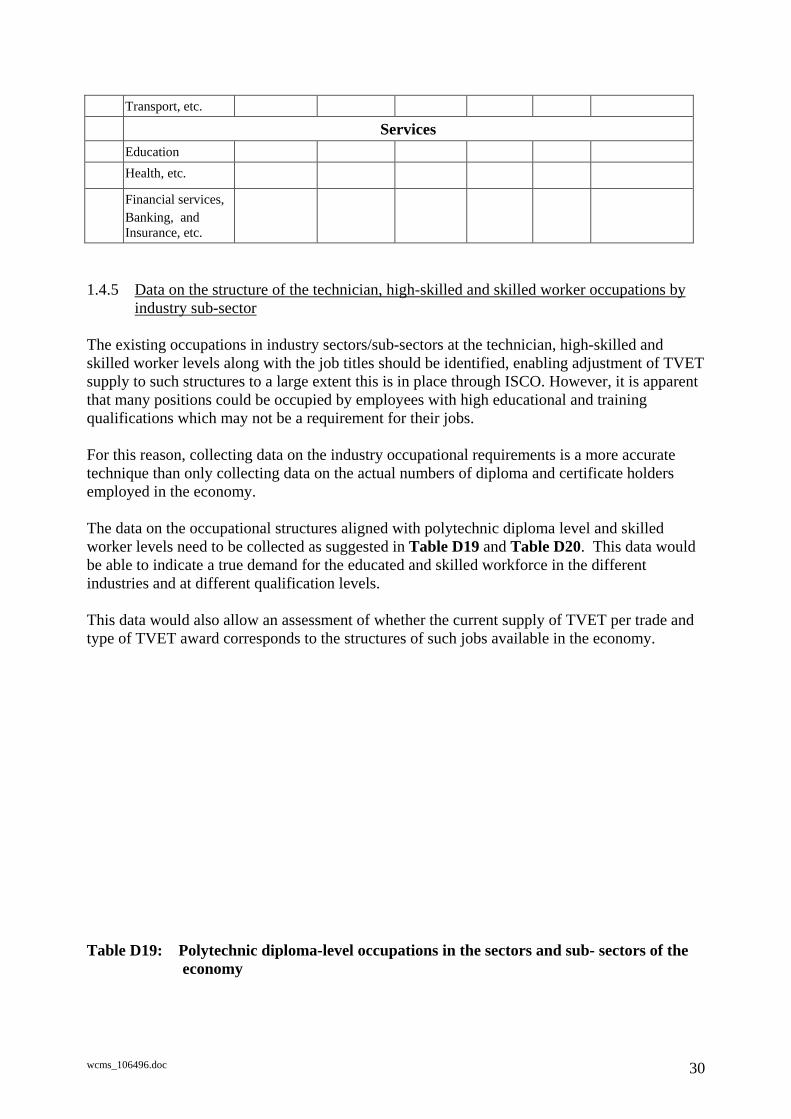
1.4.5 Data on the structure of the technician, high-skilled and skilled worker occupations byindustry sub-sector
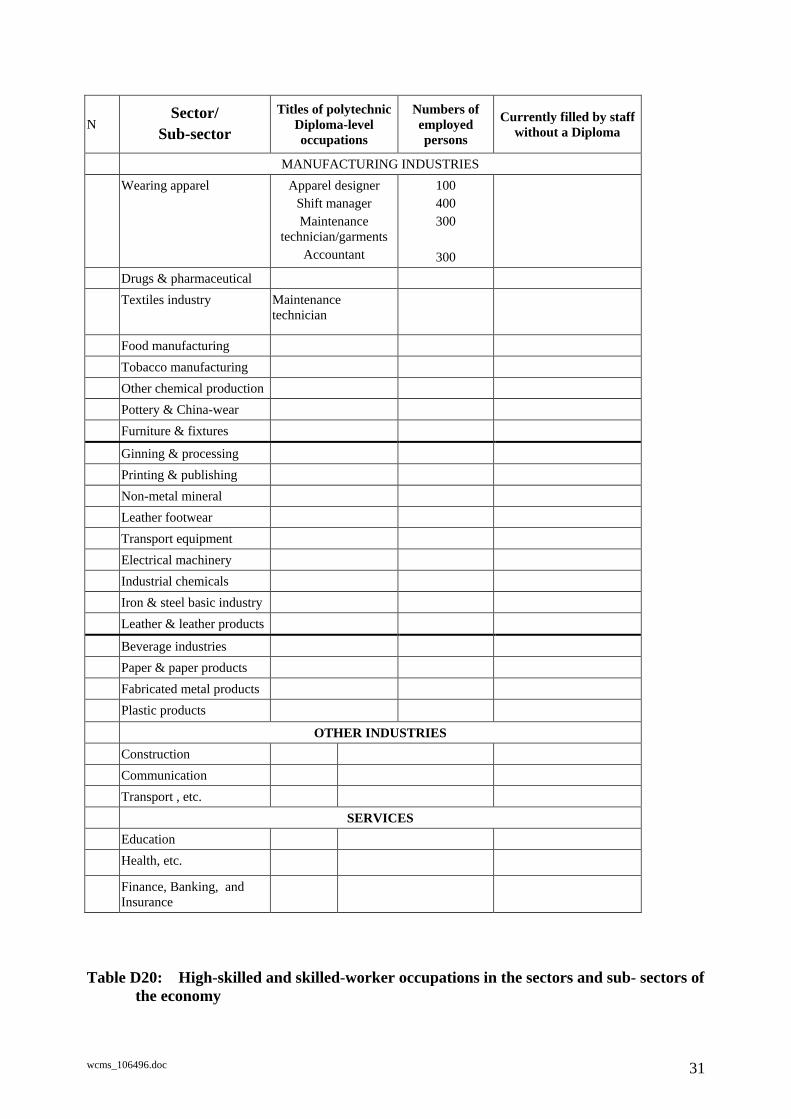
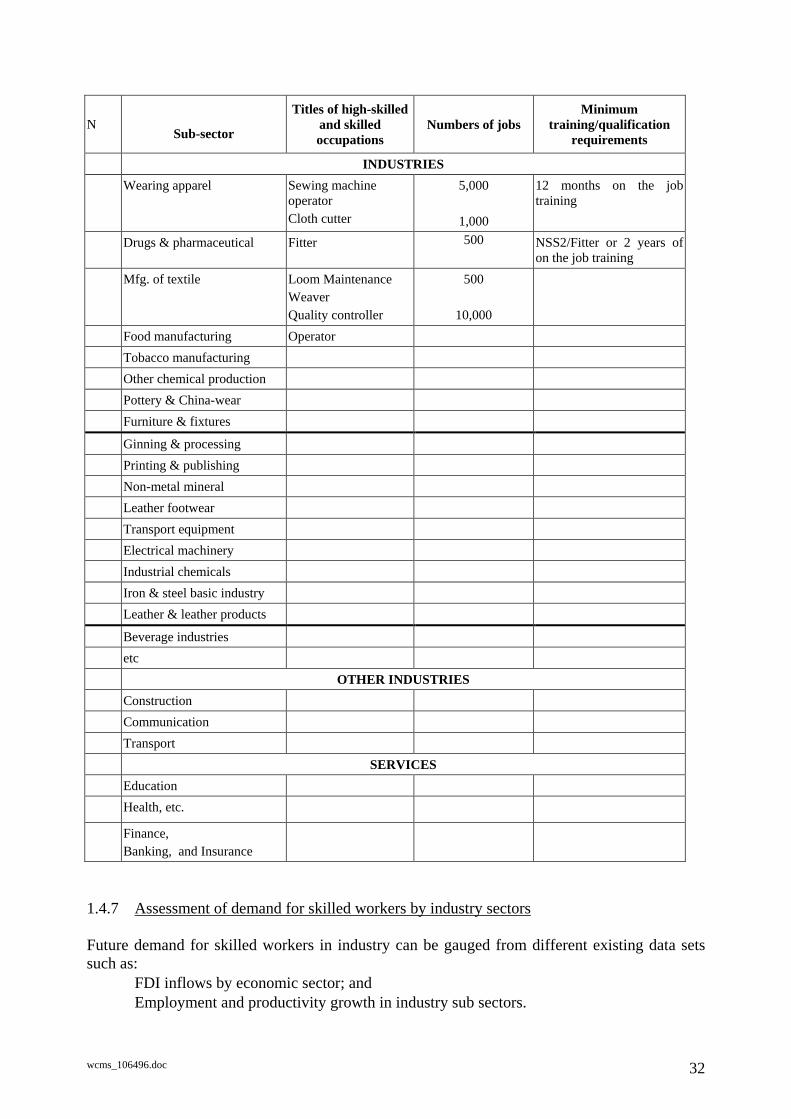
The existing occupations in industry sectors/sub-sectors at the technician, high-skilled and skilled worker levels along with the job titles should be identified, enabling adjustment of TVET supply to such structures to a large extent this is in place through ISCO. However, it is apparent that many positions could be occupied by employees with high educational and training qualifications which may not be a requirement for their jobs. For this reason, collecting data on the industry occupational requirements is a more accurate technique than only collecting data on the actual numbers of diploma and certificate holders employed in the economy. The data on the occupational structures aligned with polytechnic diploma level and skilled worker levels need to be collected as suggested in Table D19 and Table D20. This data would be able to indicate a true demand for the educated and skilled workforce in the different industries and at different qualification levels. This data would also allow an assessment of whether the current supply of TVET per trade and type of TVET award corresponds to the structures of such jobs available in the economy.
Table D19: Polytechnic diploma-level occupations in the sectors and sub- sectors of the economy
wcms_106496.doc 31
NSector/
Sub-sector Titles of polytechnic
Diploma-level occupations
Numbers of employed persons
Currently filled by staff without a Diploma
MANUFACTURING INDUSTRIES Wearing apparel Apparel designer
Shift manager Maintenance
technician/garments Accountant
100 400 300
300
Drugs & pharmaceutical
Textiles industry Maintenance technician
Food manufacturing Tobacco manufacturing Other chemical productionPottery & China-wear Furniture & fixtures
Ginning & processing Printing & publishing Non-metal mineral Leather footwear Transport equipment Electrical machinery Industrial chemicals Iron & steel basic industry Leather & leather products
Beverage industries Paper & paper products Fabricated metal products Plastic products
OTHER INDUSTRIES Construction Communication Transport , etc.
SERVICES Education Health, etc.
Finance, Banking, and Insurance
Table D20: High-skilled and skilled-worker occupations in the sectors and sub- sectors of the economy
wcms_106496.doc 32
NSub-sector
Titles of high-skilled and skilled occupations
Numbers of jobs Minimum
training/qualification requirements
INDUSTRIES Wearing apparel Sewing machine
operator Cloth cutter
5,000
1,000
12 months on the jobtraining
Drugs & pharmaceutical Fitter 500 NSS2/Fitter or 2 years of on the job training
Mfg. of textile Loom Maintenance Weaver Quality controller
500
10,000
Food manufacturing Operator Tobacco manufacturing Other chemical production Pottery & China-wear Furniture & fixtures
Ginning & processing Printing & publishing Non-metal mineral Leather footwear Transport equipment Electrical machinery Industrial chemicals Iron & steel basic industry Leather & leather products
Beverage industries etc
OTHER INDUSTRIES Construction Communication Transport
SERVICES Education Health, etc.
Finance, Banking, and Insurance
1.4.7 Assessment of demand for skilled workers by industry sectors
Future demand for skilled workers in industry can be gauged from different existing data sets such as:
• FDI inflows by economic sector; and • Employment and productivity growth in industry sub sectors.

wcms_106496.doc 33
However from these data sets inferences can be drawn about which occupations and skills are in demand. More detailed data is required from industry on skills in demand as a result of:
• industry restructuring; • the introduction of new technology12 • regulatory and/or compliance requirements; and • other management/production demands.
This data is best collected directly from industry. Section 1.4.7.1 below shows demand for skilled vacancies in the ship building sub-sector. 1.4.7.1 Assessment of demand for skilled workforce by industry sectors (example of shipbuilding industry)
More than 100 local shipyards, dockyard and shipways have emerged in Bangladesh; they are involved in producing medium-sized ships and vessels for inland water-ways. In the overseas employment market, thousands of Bangladeshis are now being employed in Singapore, Korea and Dubai shipyards. A strong demand for skills is being created in the field of shipbuilding technology. These trades primarily relate to: Ship Building and Repairing, Ship Conversion, Marine Engine Operation, Engine Repair and Maintenance.
The following training programmes are in strong demand in this sector: Marine fitter, Pipe fitter, 6G welding, Scaffolding in Ship Building, Marine Engine Maintenance, Drafting with ship building AutoCAD, and a Ship Fabricator.
The demand for trained personnel in the shipbuilding sector has been assessed by the industry (see Table D21). There is also a considerable demand for retraining programmes and skills recognition. Some training centers like Bangladesh Industrial and Technical Assistance Center (BITAC) and Bangladesh Oxygen Company (BOC) provide upgrading courses in some specialist trades. Some industries have their in-house training arrangement for upgrading of skill.
Table D21: Demand for workforce in the shipbuilding sector, 2007 SL. Job title Vacancies
12 Employees need to upgrade their skills and knowledge through re-training which may cause them to change jobs. Some occupations have been recently modernized due to the technological change, e.g. Photography, Printing, Design, Drafting, etc. Sectors like ICT, garments, etc. have been upgrading their technologies vary rapidly.
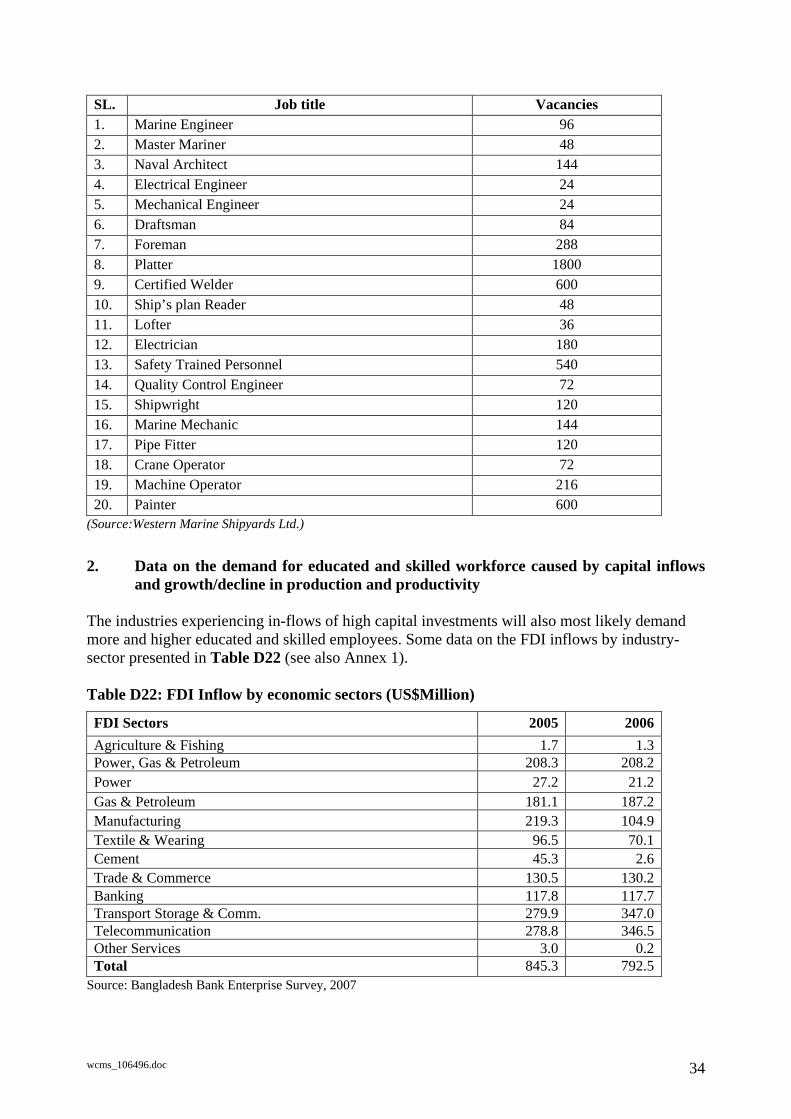
wcms_106496.doc 34
SL. Job title Vacancies 1. Marine Engineer 96 2. Master Mariner 48 3. Naval Architect 144 4. Electrical Engineer 24 5. Mechanical Engineer 24 6. Draftsman 84 7. Foreman 288 8. Platter 1800 9. Certified Welder 600 10. Ship’s plan Reader 48 11. Lofter 36 12. Electrician 180 13. Safety Trained Personnel 540 14. Quality Control Engineer 72 15. Shipwright 120 16. Marine Mechanic 144 17. Pipe Fitter 120 18. Crane Operator 72 19. Machine Operator 216 20. Painter 600
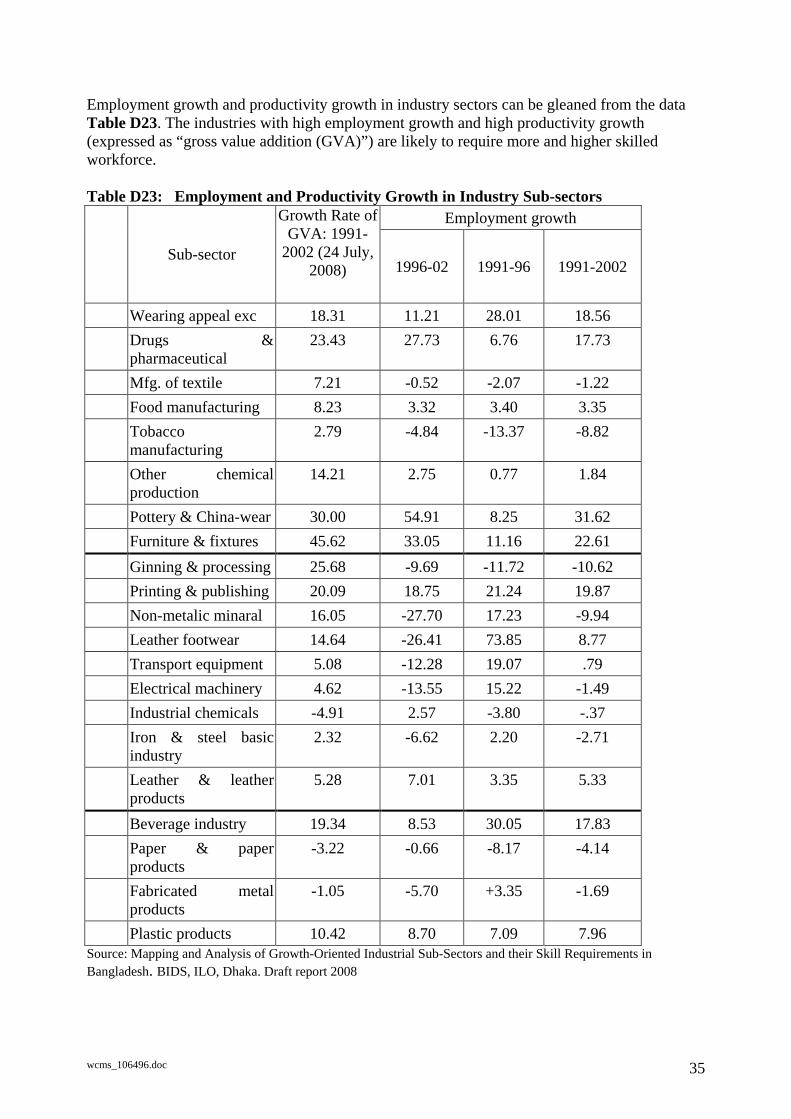
(Source:Western Marine Shipyards Ltd.) 2. Data on the demand for educated and skilled workforce caused by capital inflows
and growth/decline in production and productivity The industries experiencing in-flows of high capital investments will also most likely demand more and higher educated and skilled employees. Some data on the FDI inflows by industry-sector presented in Table D22 (see also Annex 1). Table D22: FDI Inflow by economic sectors (US$Million)
FDI Sectors 2005 2006Agriculture & Fishing 1.7 1.3 Power, Gas & Petroleum 208.3 208.2 Power 27.2 21.2 Gas & Petroleum 181.1 187.2 Manufacturing 219.3 104.9 Textile & Wearing 96.5 70.1 Cement 45.3 2.6 Trade & Commerce 130.5 130.2 Banking 117.8 117.7 Transport Storage & Comm. 279.9 347.0 Telecommunication 278.8 346.5 Other Services 3.0 0.2 Total 845.3 792.5
Source: Bangladesh Bank Enterprise Survey, 2007
wcms_106496.doc 35
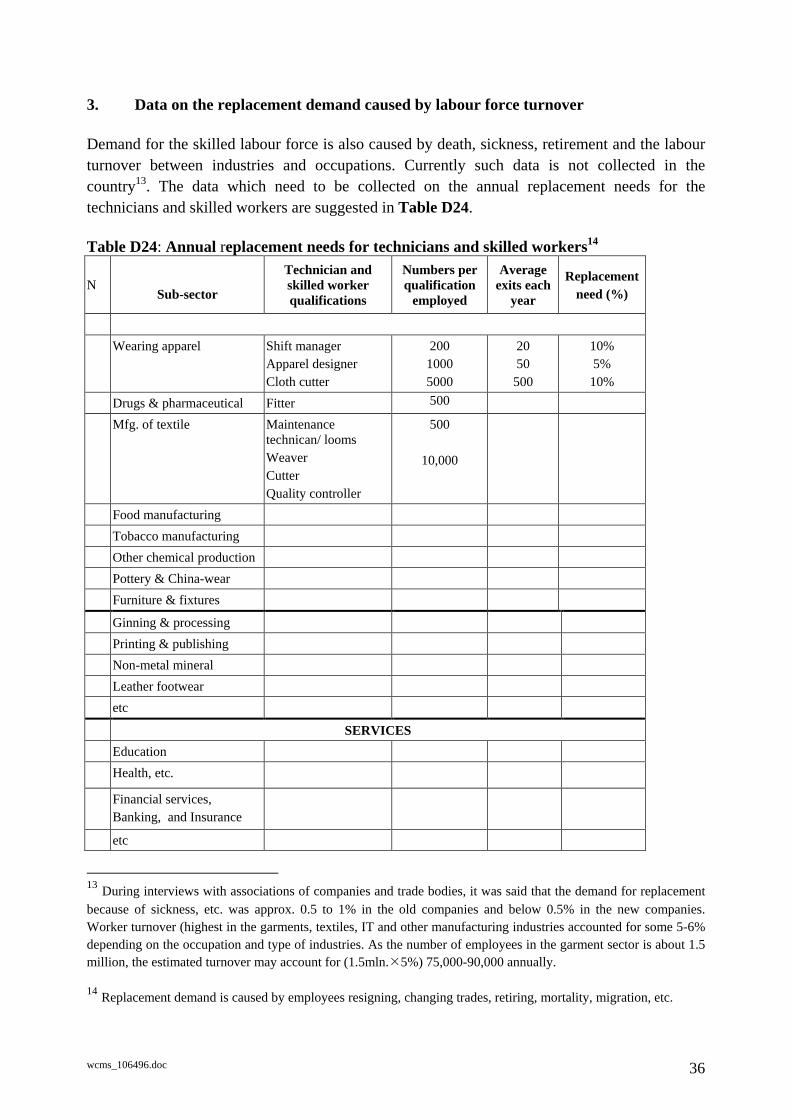
Employment growth and productivity growth in industry sectors can be gleaned from the data Table D23. The industries with high employment growth and high productivity growth (expressed as “gross value addition (GVA)”) are likely to require more and higher skilled workforce.
Table D23: Employment and Productivity Growth in Industry Sub-sectors
Employment growth
Sub-sector
Growth Rate of GVA: 1991-
2002 (24 July, 2008)
1996-02 1991-96 1991-2002
Wearing appeal exc 18.31 11.21 28.01 18.56 Drugs & pharmaceutical
23.43 27.73 6.76 17.73
Mfg. of textile 7.21 -0.52 -2.07 -1.22 Food manufacturing 8.23 3.32 3.40 3.35 Tobacco manufacturing
2.79 -4.84 -13.37 -8.82
Other chemical production
14.21 2.75 0.77 1.84
Pottery & China-wear 30.00 54.91 8.25 31.62 Furniture & fixtures 45.62 33.05 11.16 22.61 Ginning & processing 25.68 -9.69 -11.72 -10.62 Printing & publishing 20.09 18.75 21.24 19.87 Non-metalic minaral 16.05 -27.70 17.23 -9.94 Leather footwear 14.64 -26.41 73.85 8.77 Transport equipment 5.08 -12.28 19.07 .79 Electrical machinery 4.62 -13.55 15.22 -1.49 Industrial chemicals -4.91 2.57 -3.80 -.37 Iron & steel basic industry
2.32 -6.62 2.20 -2.71
Leather & leather products
5.28 7.01 3.35 5.33
Beverage industry 19.34 8.53 30.05 17.83 Paper & paper products
-3.22 -0.66 -8.17 -4.14
Fabricated metal products
-1.05 -5.70 +3.35 -1.69
Plastic products 10.42 8.70 7.09 7.96 Source: Mapping and Analysis of Growth-Oriented Industrial Sub-Sectors and their Skill Requirements in Bangladesh. BIDS, ILO, Dhaka. Draft report 2008
wcms_106496.doc 36
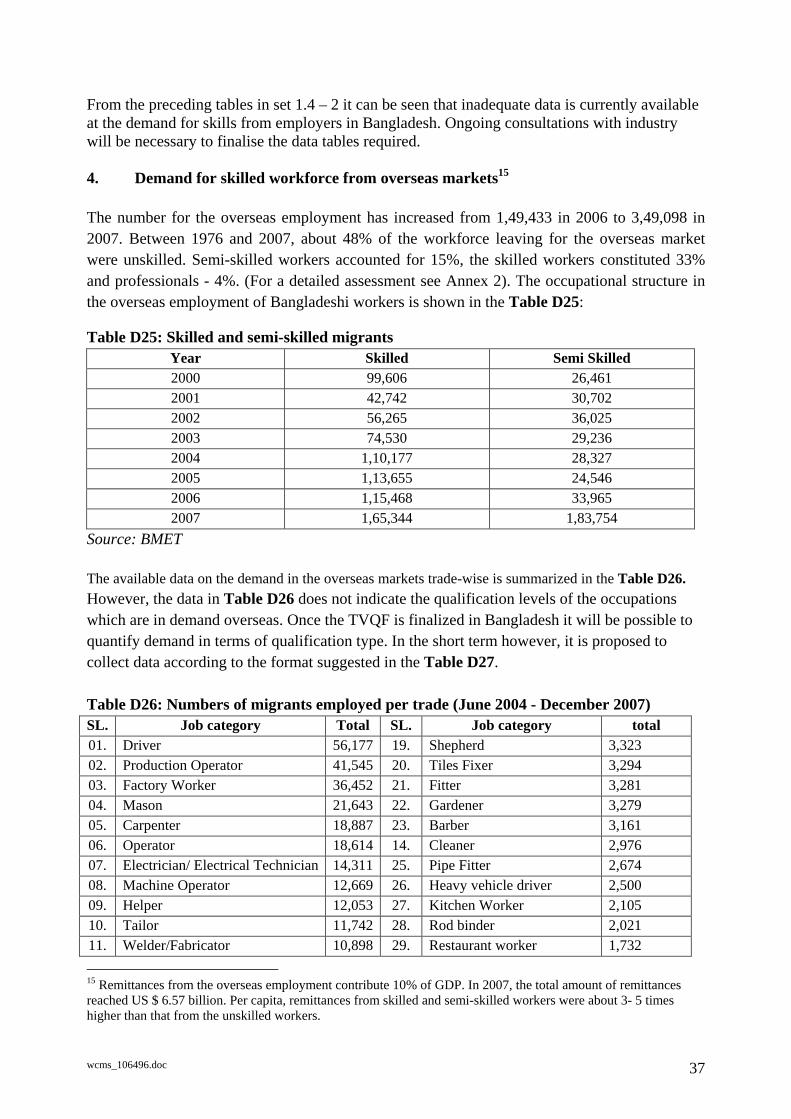
3. Data on the replacement demand caused by labour force turnover Demand for the skilled labour force is also caused by death, sickness, retirement and the labour turnover between industries and occupations. Currently such data is not collected in the country13. The data which need to be collected on the annual replacement needs for the technicians and skilled workers are suggested in Table D24.
Table D24: Annual replacement needs for technicians and skilled workers14
NSub-sector
Technician and skilled worker qualifications
Numbers per qualification
employed
Average exits each
year
Replacementneed (%)
Wearing apparel Shift manager Apparel designer Cloth cutter
200 1000 5000
20 50
500
10% 5% 10%
Drugs & pharmaceutical Fitter 500 Mfg. of textile Maintenance
technican/ looms Weaver Cutter Quality controller
500
10,000
Food manufacturing Tobacco manufacturing Other chemical production Pottery & China-wear Furniture & fixtures
Ginning & processing Printing & publishing Non-metal mineral Leather footwear etc
SERVICES Education Health, etc.
Financial services, Banking, and Insurance
etc
13 During interviews with associations of companies and trade bodies, it was said that the demand for replacement because of sickness, etc. was approx. 0.5 to 1% in the old companies and below 0.5% in the new companies. Worker turnover (highest in the garments, textiles, IT and other manufacturing industries accounted for some 5-6% depending on the occupation and type of industries. As the number of employees in the garment sector is about 1.5 million, the estimated turnover may account for (1.5mln.�5%) 75,000-90,000 annually. 14 Replacement demand is caused by employees resigning, changing trades, retiring, mortality, migration, etc.
wcms_106496.doc 37
From the preceding tables in set 1.4 – 2 it can be seen that inadequate data is currently available at the demand for skills from employers in Bangladesh. Ongoing consultations with industry will be necessary to finalise the data tables required.
4. Demand for skilled workforce from overseas markets15
The number for the overseas employment has increased from 1,49,433 in 2006 to 3,49,098 in 2007. Between 1976 and 2007, about 48% of the workforce leaving for the overseas market were unskilled. Semi-skilled workers accounted for 15%, the skilled workers constituted 33% and professionals - 4%. (For a detailed assessment see Annex 2). The occupational structure in the overseas employment of Bangladeshi workers is shown in the Table D25:
Table D25: Skilled and semi-skilled migrants Year Skilled Semi Skilled 2000 99,606 26,461 2001 42,742 30,702 2002 56,265 36,025 2003 74,530 29,236 2004 1,10,177 28,327 2005 1,13,655 24,546 2006 1,15,468 33,965 2007 1,65,344 1,83,754
Source: BMET The available data on the demand in the overseas markets trade-wise is summarized in the Table D26. However, the data in Table D26 does not indicate the qualification levels of the occupations which are in demand overseas. Once the TVQF is finalized in Bangladesh it will be possible to quantify demand in terms of qualification type. In the short term however, it is proposed to collect data according to the format suggested in the Table D27.
Table D26: Numbers of migrants employed per trade (June 2004 - December 2007) SL. Job category Total SL. Job category total 01. Driver 56,177 19. Shepherd 3,323 02. Production Operator 41,545 20. Tiles Fixer 3,294 03. Factory Worker 36,452 21. Fitter 3,281 04. Mason 21,643 22. Gardener 3,279 05. Carpenter 18,887 23. Barber 3,161 06. Operator 18,614 14. Cleaner 2,976 07. Electrician/ Electrical Technician 14,311 25. Pipe Fitter 2,674 08. Machine Operator 12,669 26. Heavy vehicle driver 2,500 09. Helper 12,053 27. Kitchen Worker 2,105 10. Tailor 11,742 28. Rod binder 2,021 11. Welder/Fabricator 10,898 29. Restaurant worker 1,732
15 Remittances from the overseas employment contribute 10% of GDP. In 2007, the total amount of remittances reached US $ 6.57 billion. Per capita, remittances from skilled and semi-skilled workers were about 3- 5 times higher than that from the unskilled workers.

wcms_106496.doc 38
12. Printer 10,884 30. Machinist 1,625 13. Steel Fixer 8,043 31. Guide 1,494 14. Plumber 6,456 32. Architect 1,332 15. Production Worker 6,190 33. Workshop employee 1,279 16. Technician 4,842 34. Laundry employee 1,128 17. Plasterer 3,823 35. Shuttering Carpenter 1,081 18. Mechanic 3,395 36. Embroiderer 1,049 Source: BMET
Table D27: Occupational and qualification structures of people going overseas Occupational group of
migrants Holders of TVET awards (Degree/Diploma/National Certificate, License, etc.)
Migrants without awards (years of experience)
Professional jobs 1
Doctors Engineers Architects University/college teachers Accountants Computer Programmers (Etc. )
2 Technician jobs Paramedics Nurses Foremen Duct Technician (Etc.)
3 Skilled worker jobs
Mechanics Welders Masons, Carpenters Tailors Gas operator Sales personnel, etc. Gardeners Clerks (Etc)
4 Semi-skilled workers Cleaners House keepers General workers Laborers (Etc)
5 Unskilled workers
39
CHAPTER II: DATA ON THE SUPPLY SIDE IN TVET 1. Structure of TVET providers and their training capacity16
1.1 Data on the providers of formal TVET
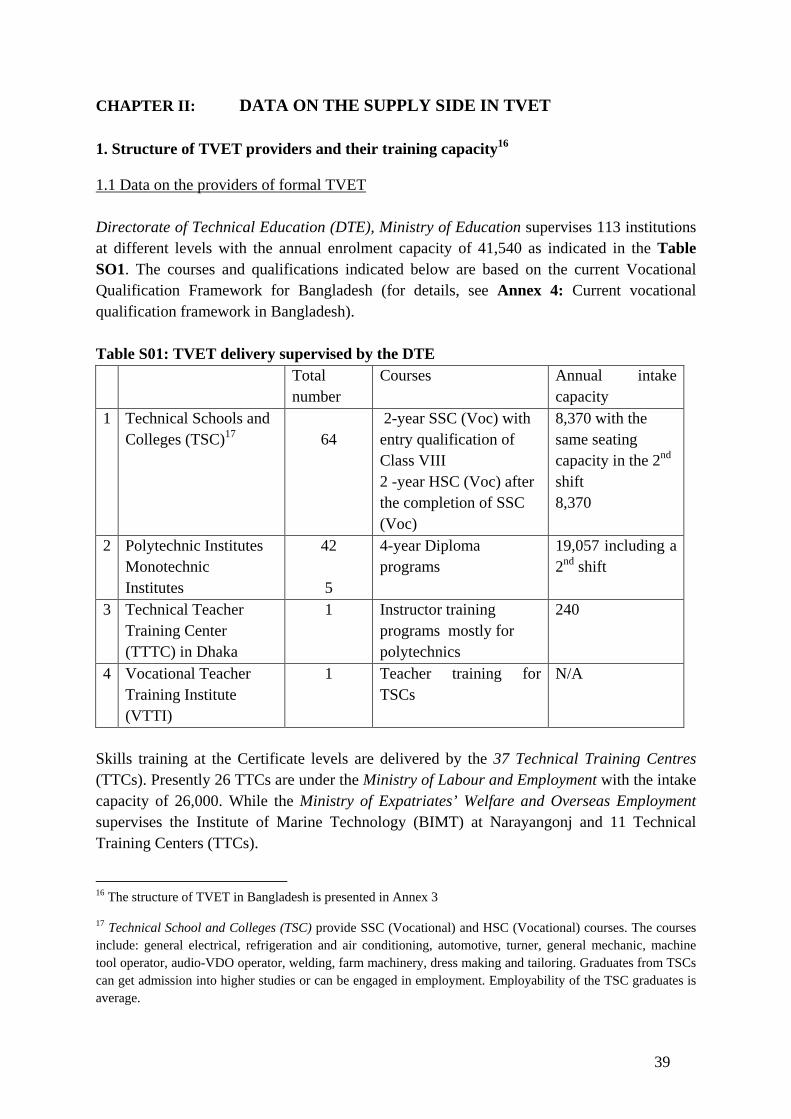
Directorate of Technical Education (DTE), Ministry of Education supervises 113 institutions at different levels with the annual enrolment capacity of 41,540 as indicated in the Table SO1. The courses and qualifications indicated below are based on the current Vocational Qualification Framework for Bangladesh (for details, see Annex 4: Current vocational qualification framework in Bangladesh). Table S01: TVET delivery supervised by the DTE Total
number Courses Annual intake
capacity 1 Technical Schools and
Colleges (TSC)17 642-year SSC (Voc) with entry qualification of Class VIII 2 -year HSC (Voc) after the completion of SSC (Voc)
8,370 with the same seating capacity in the 2nd shift 8,370
2 Polytechnic Institutes Monotechnic Institutes
42 5
4-year Diploma programs
19,057 including a 2nd shift
3 Technical Teacher Training Center (TTTC) in Dhaka
1 Instructor training programs mostly for polytechnics
240
4 Vocational Teacher Training Institute (VTTI)
1 Teacher training for TSCs
N/A
Skills training at the Certificate levels are delivered by the 37 Technical Training Centres (TTCs). Presently 26 TTCs are under the Ministry of Labour and Employment with the intake capacity of 26,000. While the Ministry of Expatriates’ Welfare and Overseas Employment supervises the Institute of Marine Technology (BIMT) at Narayangonj and 11 Technical Training Centers (TTCs).
16 The structure of TVET in Bangladesh is presented in Annex 3
17 Technical School and Colleges (TSC) provide SSC (Vocational) and HSC (Vocational) courses. The courses include: general electrical, refrigeration and air conditioning, automotive, turner, general mechanic, machine tool operator, audio-VDO operator, welding, farm machinery, dress making and tailoring. Graduates from TSCs can get admission into higher studies or can be engaged in employment. Employability of the TSC graduates is average.
wcms_106496.doc 40
All the 37 TTC are operationally supervised by the Bureau of Manpower, Employment and Training (BMET). Six TTCs are reserved exclusively for women.
TTCs offer a 2-year course (SSC voc.) in 31 different basic engineering trades; while the BIMT offers 4-year Diploma courses. Besides regular courses, many evening skills upgrading courses, on request of employers, are also conducted at TTCs. A total annual intake at the TTCs (both regular & short-term courses) amounts to 39,000 students (for details, see Table S03 and Table S07). Training programmes supervised by BMET involve: Diploma in Marine Engineering, Diploma in Shipbuilding Engineering, Drafting Mechanical, Drafting Civil, General Mechanics, Machine tool operation, Machinist, Welding and Fabrication, Automotive, Electrical, Wood working, Civil Construction, Refrigeration & Air conditioning, Electronics Plumbing & Pipe Fitting, Garments, Marine Diesel Artificer, Ship Building & Welding (arc & gas), Ship building & Mechanical Drafting, Shipwright /Platter, Computer, Architectural Drafting with AutoCAD, Electrical Machine Maintenance, House Keeping, Plastic Technology, Pattern making and cutting, 6G welding, Auto CAD (3D), Graphics Design, Suttering, Block and Boutique, Rod Binding, Tile Fixer, Knitting and Linking operator, Mechanical Fitter, Sewing Machine Maintenance, Mid-level Supervisor (garments) Need for the gender-related data Most of the tables lack gender dimensions which are very important in the provision of equal access to skills and education for girls. Enrolement of girls is about 35% in SSC (Voc) courses. BMET is planning to establish 6 TTCs exclusively for female trainees. DTE has also decided to established 6 TSCs for girls18.
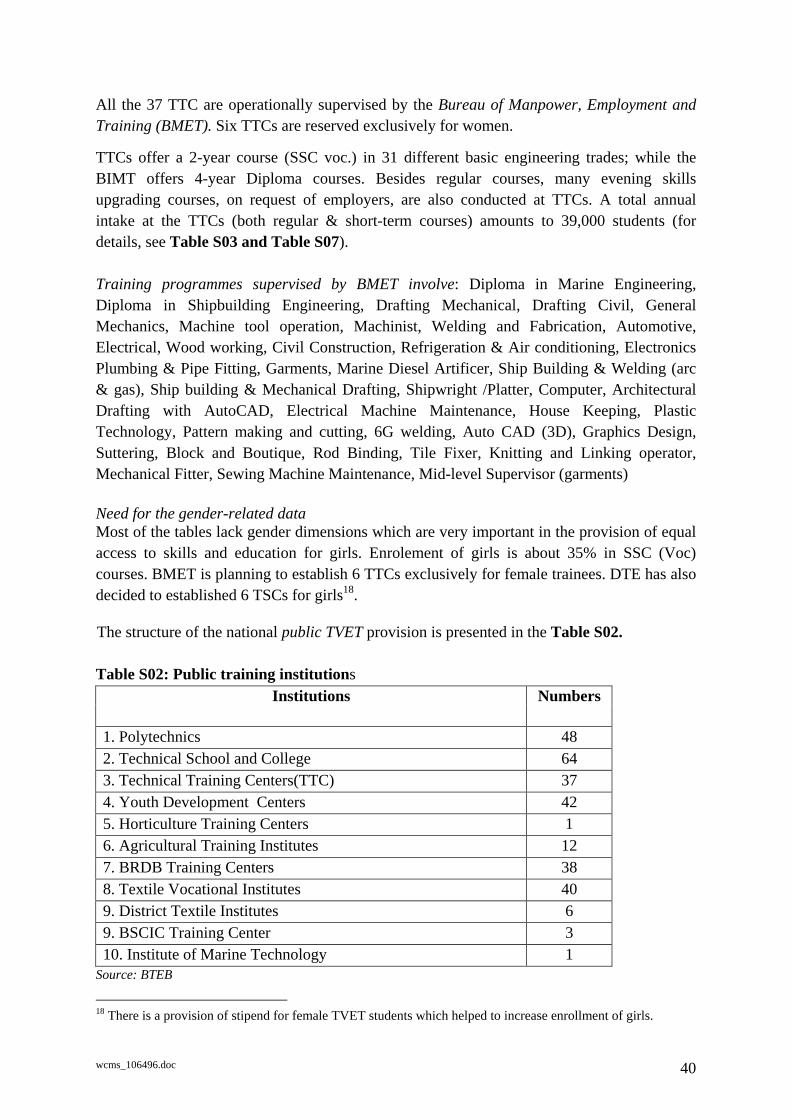
The structure of the national public TVET provision is presented in the Table S02. Table S02: Public training institutions
Institutions Numbers
1. Polytechnics 48 2. Technical School and College 64 3. Technical Training Centers(TTC) 37 4. Youth Development Centers 42 5. Horticulture Training Centers 1 6. Agricultural Training Institutes 12 7. BRDB Training Centers 38 8. Textile Vocational Institutes 40 9. District Textile Institutes 6 9. BSCIC Training Center 3 10. Institute of Marine Technology 1
Source: BTEB
18 There is a provision of stipend for female TVET students which helped to increase enrollment of girls.
wcms_106496.doc 41
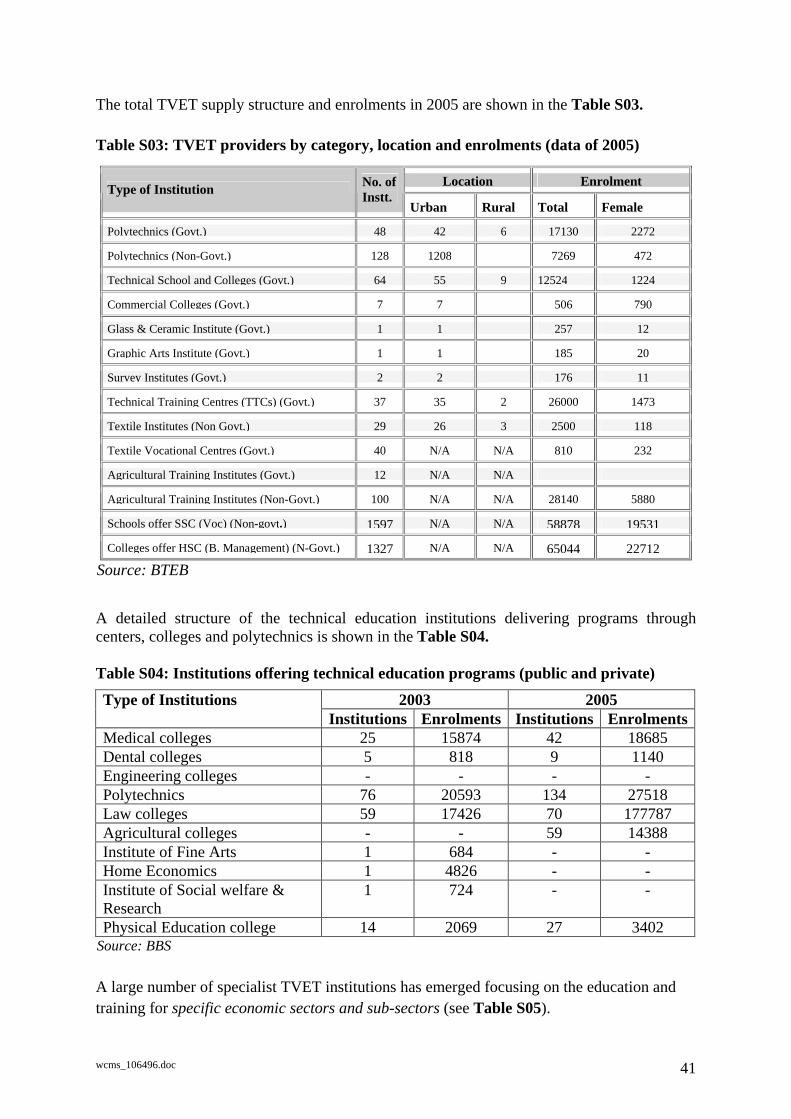
The total TVET supply structure and enrolments in 2005 are shown in the Table S03.
Table S03: TVET providers by category, location and enrolments (data of 2005)
Location EnrolmentType of Institution No. of Instt.
Urban Rural Total Female
Polytechnics (Govt.) 48 42 6 17130 2272
Polytechnics (Non-Govt.) 128 1208 7269 472
Technical School and Colleges (Govt.) 64 55 9 12524 1224
Commercial Colleges (Govt.) 7 7 506 790
Glass & Ceramic Institute (Govt.) 1 1 257 12
Graphic Arts Institute (Govt.) 1 1 185 20
Survey Institutes (Govt.) 2 2 176 11
Technical Training Centres (TTCs) (Govt.) 37 35 2 26000 1473
Textile Institutes (Non Govt.) 29 26 3 2500 118
Textile Vocational Centres (Govt.) 40 N/A N/A 810 232
Agricultural Training Institutes (Govt.) 12 N/A N/A
Agricultural Training Institutes (Non-Govt.) 100 N/A N/A 28140 5880
Schools offer SSC (Voc) (Non-govt.) 1597 N/A N/A 58878 19531
Colleges offer HSC (B. Management) (N-Govt.) 1327 N/A N/A 65044 22712
Source: BTEB
A detailed structure of the technical education institutions delivering programs through centers, colleges and polytechnics is shown in the Table S04. Table S04: Institutions offering technical education programs (public and private)
2003 2005 Type of Institutions Institutions Enrolments Institutions Enrolments
Medical colleges 25 15874 42 18685 Dental colleges 5 818 9 1140 Engineering colleges - - - - Polytechnics 76 20593 134 27518 Law colleges 59 17426 70 177787 Agricultural colleges - - 59 14388 Institute of Fine Arts 1 684 - - Home Economics 1 4826 - - Institute of Social welfare & Research
1 724 - -
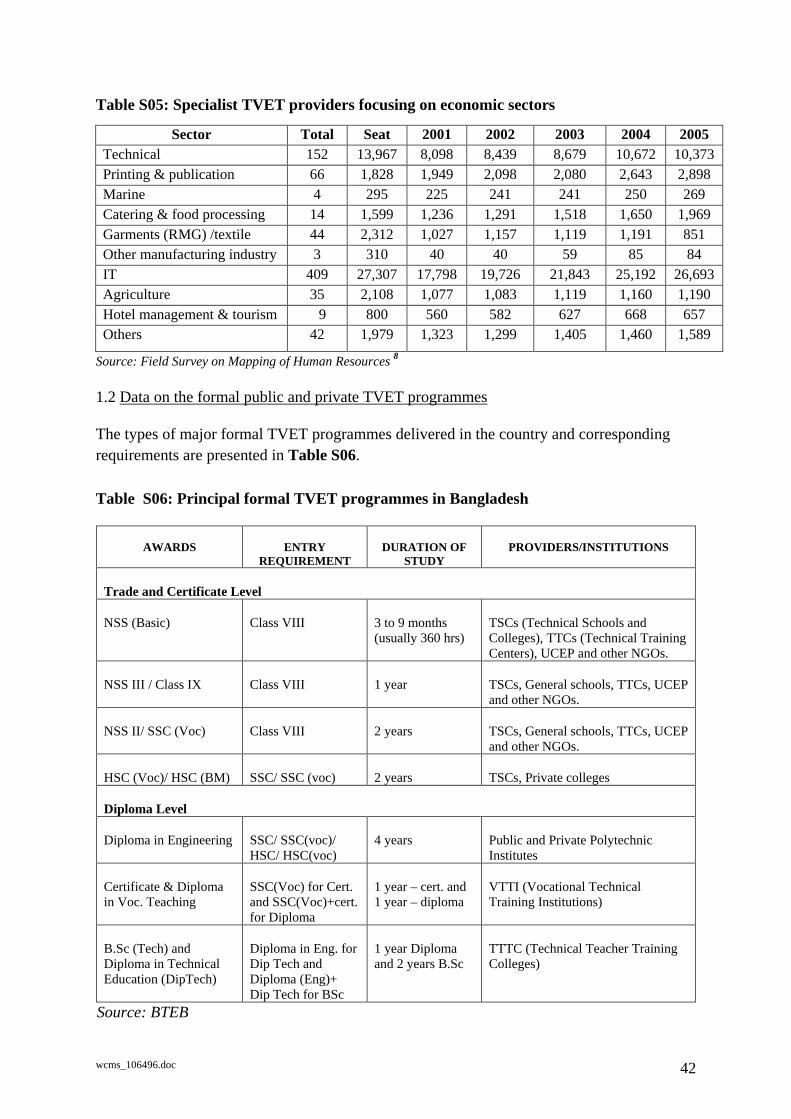
Physical Education college 14 2069 27 3402 Source: BBS A large number of specialist TVET institutions has emerged focusing on the education and training for specific economic sectors and sub-sectors (see Table S05).
wcms_106496.doc 42
Table S05: Specialist TVET providers focusing on economic sectors
Sector Total Seat 2001 2002 2003 2004 2005 Technical 152 13,967 8,098 8,439 8,679 10,672 10,373 Printing & publication 66 1,828 1,949 2,098 2,080 2,643 2,898 Marine 4 295 225 241 241 250 269 Catering & food processing 14 1,599 1,236 1,291 1,518 1,650 1,969 Garments (RMG) /textile 44 2,312 1,027 1,157 1,119 1,191 851 Other manufacturing industry 3 310 40 40 59 85 84 IT 409 27,307 17,798 19,726 21,843 25,192 26,693 Agriculture 35 2,108 1,077 1,083 1,119 1,160 1,190 Hotel management & tourism 9 800 560 582 627 668 657 Others 42 1,979 1,323 1,299 1,405 1,460 1,589
Source: Field Survey on Mapping of Human Resources 8
1.2 Data on the formal public and private TVET programmes
The types of major formal TVET programmes delivered in the country and corresponding requirements are presented in Table S06.
Table S06: Principal formal TVET programmes in Bangladesh
AWARDS
ENTRY REQUIREMENT
DURATION OF
STUDY
PROVIDERS/INSTITUTIONS
Trade and Certificate Level
NSS (Basic) Class VIII
3 to 9 months (usually 360 hrs)
TSCs (Technical Schools and Colleges), TTCs (Technical Training Centers), UCEP and other NGOs.
NSS III / Class IX Class VIII
1 year
TSCs, General schools, TTCs, UCEP and other NGOs.
NSS II/ SSC (Voc) Class VIII
2 years
TSCs, General schools, TTCs, UCEP and other NGOs.
HSC (Voc)/ HSC (BM) SSC/ SSC (voc)
2 years
TSCs, Private colleges
Diploma Level
Diploma in Engineering SSC/ SSC(voc)/ HSC/ HSC(voc)
4 years
Public and Private Polytechnic Institutes
Certificate & Diploma in Voc. Teaching
SSC(Voc) for Cert. and SSC(Voc)+cert. for Diploma
1 year – cert. and 1 year – diploma
VTTI (Vocational Technical Training Institutions)
B.Sc (Tech) and Diploma in Technical Education (DipTech)
Diploma in Eng. for Dip Tech and Diploma (Eng)+ Dip Tech for BSc
1 year Diploma and 2 years B.Sc
TTTC (Technical Teacher Training Colleges)
Source: BTEB
wcms_106496.doc 43
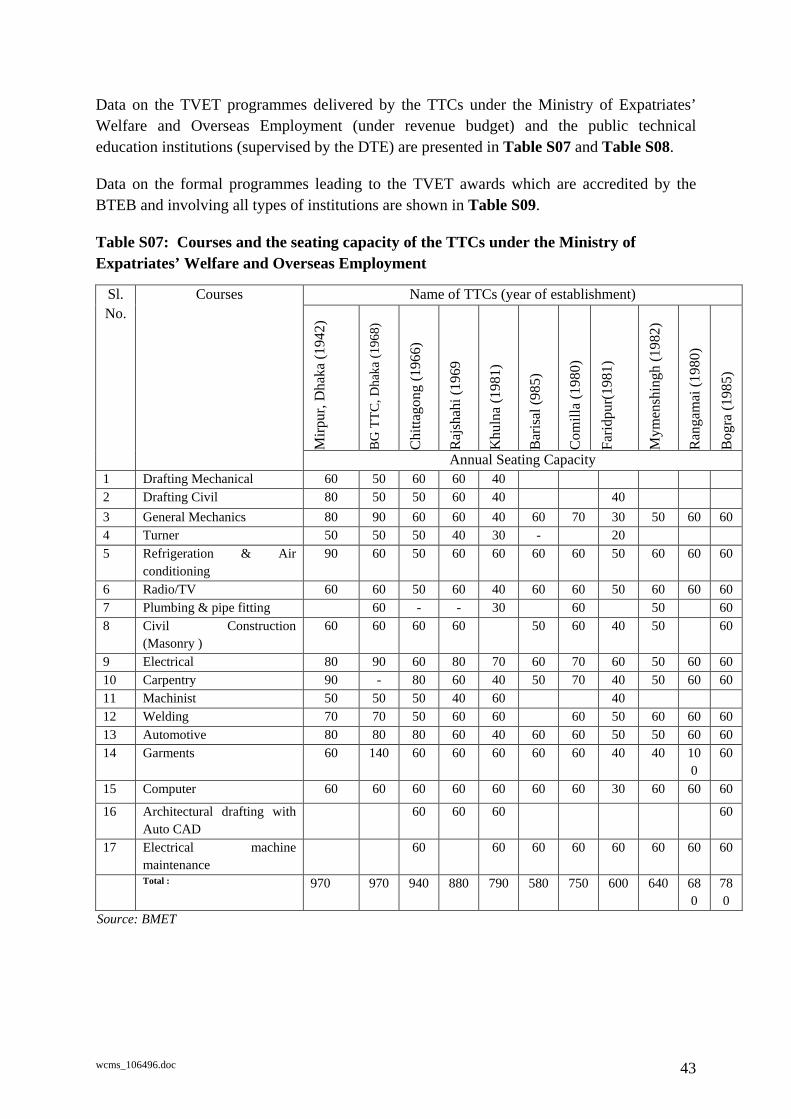
Data on the TVET programmes delivered by the TTCs under the Ministry of Expatriates’ Welfare and Overseas Employment (under revenue budget) and the public technical education institutions (supervised by the DTE) are presented in Table S07 and Table S08.
Data on the formal programmes leading to the TVET awards which are accredited by the BTEB and involving all types of institutions are shown in Table S09.
Table S07: Courses and the seating capacity of the TTCs under the Ministry of Expatriates’ Welfare and Overseas Employment
Name of TTCs (year of establishment)
Mirp
ur,D
haka
(194
2)
BG
TTC
,Dha
ka(1
968)
Chi
ttago
ng(1
966)
Raj
shah
i(19
69
Khu
lna
(198
1)
Bar
isal
(985
)
Com
illa
(198
0)
Farid
pur(
1981
)
Mym
ensh
ingh
(198
2)
Ran
gam
ai(1
980)
Bog
ra(1
985)
Sl. No.
Courses
Annual Seating Capacity 1 Drafting Mechanical 60 50 60 60 40 2 Drafting Civil 80 50 50 60 40 40 3 General Mechanics 80 90 60 60 40 60 70 30 50 60 60 4 Turner 50 50 50 40 30 - 20 5 Refrigeration & Air
conditioning 90 60 50 60 60 60 60 50 60 60 60
6 Radio/TV 60 60 50 60 40 60 60 50 60 60 60 7 Plumbing & pipe fitting 60 - - 30 60 50 60 8 Civil Construction
(Masonry ) 60 60 60 60 50 60 40 50 60
9 Electrical 80 90 60 80 70 60 70 60 50 60 60 10 Carpentry 90 - 80 60 40 50 70 40 50 60 60 11 Machinist 50 50 50 40 60 40 12 Welding 70 70 50 60 60 60 50 60 60 60 13 Automotive 80 80 80 60 40 60 60 50 50 60 60 14 Garments 60 140 60 60 60 60 60 40 40 10
060
15 Computer 60 60 60 60 60 60 60 30 60 60 60
16 Architectural drafting with Auto CAD
60 60 60 60
17 Electrical machine maintenance
60 60 60 60 60 60 60 60
Total : 970 970 940 880 790 580 750 600 640 680
780
Source: BMET
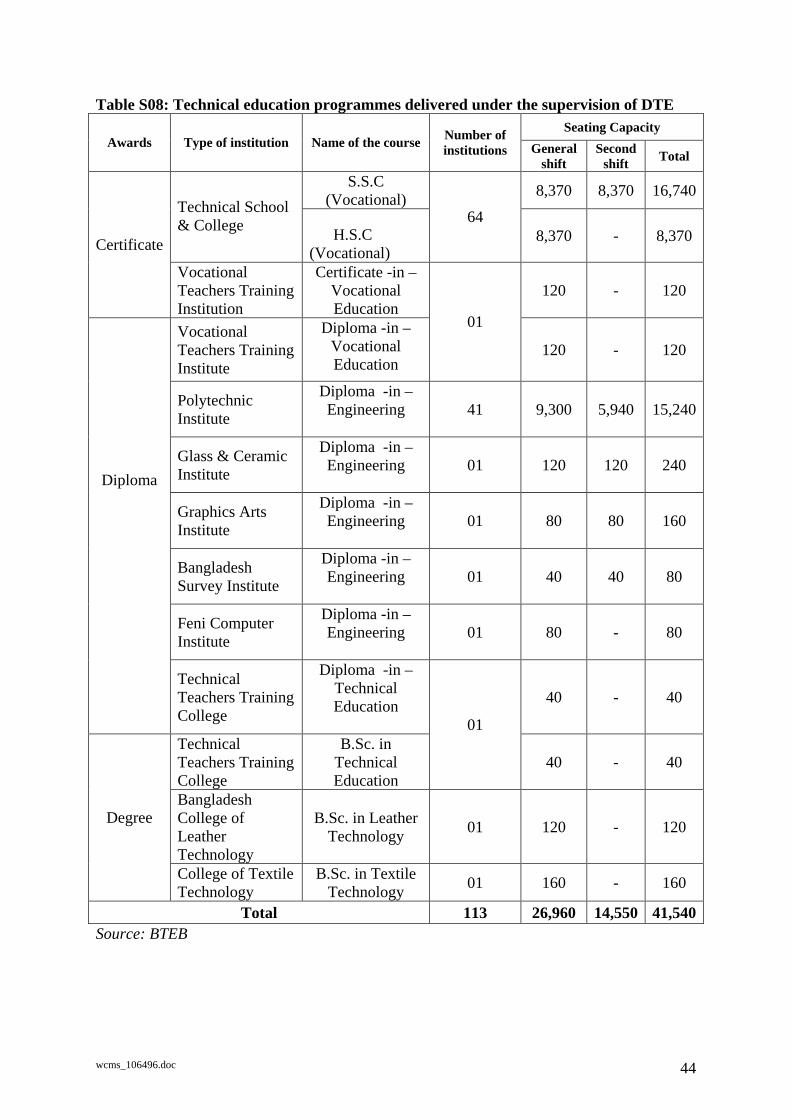
wcms_106496.doc 44
Table S08: Technical education programmes delivered under the supervision of DTE Seating Capacity
Awards Type of institution Name of the course Number of institutions General
shift Second
shift Total
S.S.C (Vocational) 8,370 8,370 16,740
Technical School & College H.S.C
(Vocational)
64 8,370 - 8,370 Certificate
Vocational Teachers Training Institution
Certificate -in –Vocational Education
120 - 120
Vocational Teachers Training Institute
Diploma -in –Vocational Education
01
120 - 120
Polytechnic Institute
Diploma -in –Engineering
41 9,300 5,940 15,240
Glass & Ceramic Institute
Diploma -in –Engineering
01 120 120 240
Graphics Arts Institute
Diploma -in –Engineering
01 80 80 160
Bangladesh Survey Institute
Diploma -in –Engineering
01 40 40 80
Feni Computer Institute
Diploma -in –Engineering
01 80 - 80
Diploma
Technical Teachers Training College
Diploma -in – Technical Education
40 - 40
Technical Teachers Training College
B.Sc. in Technical Education
01
40 - 40
Bangladesh College of Leather Technology
B.Sc. in Leather Technology 01 120 - 120 Degree
College of Textile Technology
B.Sc. in Textile Technology 01 160 - 160
Total 113 26,960 14,550 41,540Source: BTEB
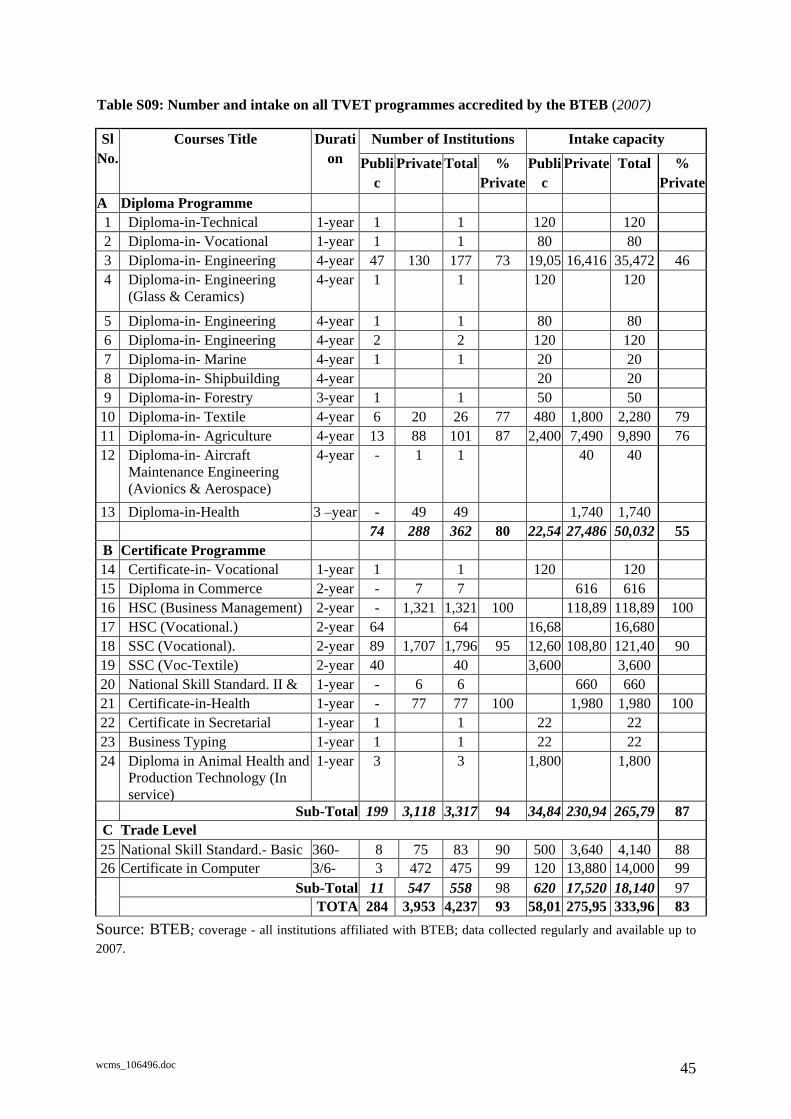
wcms_106496.doc 45
Table S09: Number and intake on all TVET programmes accredited by the BTEB (2007)
Number of Institutions Intake capacity Sl No.
Courses Title Duration Publi
cPrivate Total %
PrivatePubli
cPrivate Total %
PrivateA Diploma Programme 1 Diploma-in-Technical 1-year 1 1 120 120 2 Diploma-in- Vocational 1-year 1 1 80 80 3 Diploma-in- Engineering 4-year 47 130 177 73 19,05 16,416 35,472 46 4 Diploma-in- Engineering
(Glass & Ceramics) 4-year 1 1 120 120
5 Diploma-in- Engineering 4-year 1 1 80 80 6 Diploma-in- Engineering 4-year 2 2 120 120 7 Diploma-in- Marine 4-year 1 1 20 20 8 Diploma-in- Shipbuilding 4-year 20 20 9 Diploma-in- Forestry 3-year 1 1 50 50
10 Diploma-in- Textile 4-year 6 20 26 77 480 1,800 2,280 79 11 Diploma-in- Agriculture 4-year 13 88 101 87 2,400 7,490 9,890 76 12 Diploma-in- Aircraft
Maintenance Engineering (Avionics & Aerospace)
4-year - 1 1 40 40
13 Diploma-in-Health 3 –year - 49 49 1,740 1,74074 288 362 80 22,54 27,486 50,032 55
B Certificate Programme 14 Certificate-in- Vocational 1-year 1 1 120 120 15 Diploma in Commerce 2-year - 7 7 616 616 16 HSC (Business Management) 2-year - 1,321 1,321 100 118,89 118,89 100 17 HSC (Vocational.) 2-year 64 64 16,68 16,68018 SSC (Vocational). 2-year 89 1,707 1,796 95 12,60 108,80 121,40 90 19 SSC (Voc-Textile) 2-year 40 40 3,600 3,60020 National Skill Standard. II & 1-year - 6 6 660 660 21 Certificate-in-Health 1-year - 77 77 100 1,980 1,980 100 22 Certificate in Secretarial 1-year 1 1 22 22 23 Business Typing 1-year 1 1 22 22 24 Diploma in Animal Health and
Production Technology (In service)
1-year 3 3 1,800 1,800
Sub-Total 199 3,118 3,317 94 34,84 230,94 265,79 87 C Trade Level 25 National Skill Standard.- Basic 360- 8 75 83 90 500 3,640 4,140 88 26 Certificate in Computer 3/6- 3 472 475 99 120 13,880 14,000 99
Sub-Total 11 547 558 98 620 17,520 18,140 97 TOTA 284 3,953 4,237 93 58,01 275,95 333,96 83
Source: BTEB; coverage - all institutions affiliated with BTEB; data collected regularly and available up to 2007.
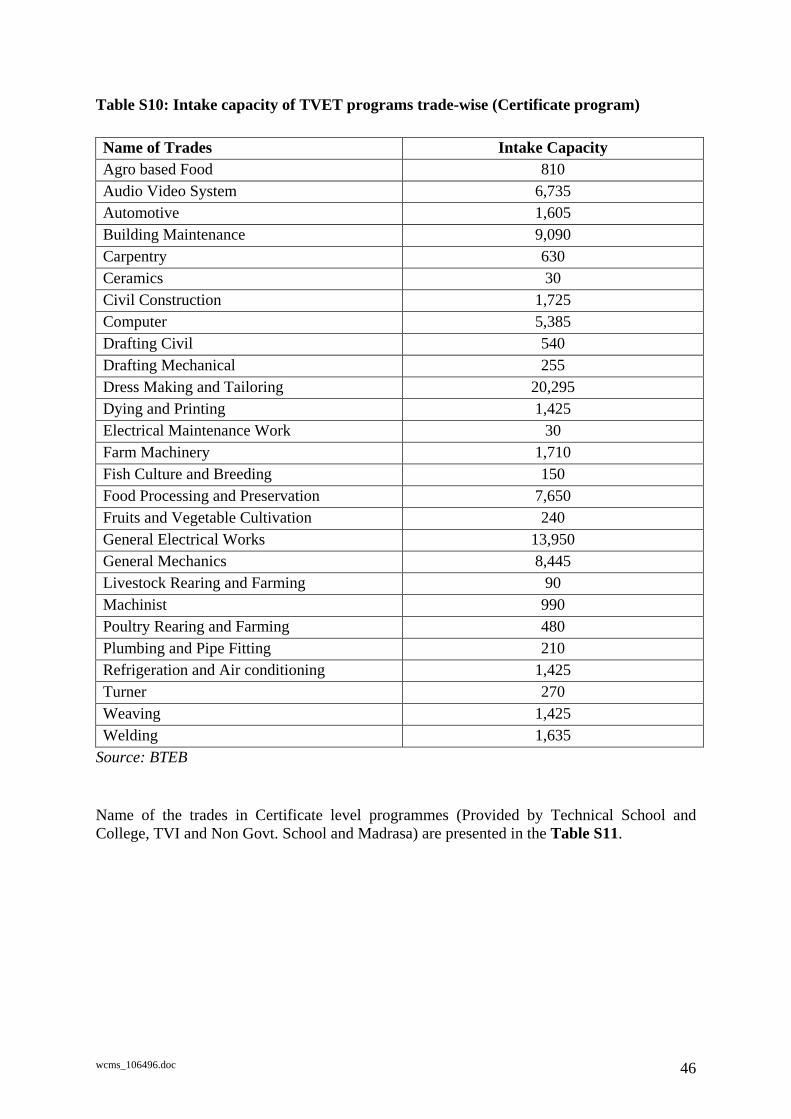
wcms_106496.doc 46
Table S10: Intake capacity of TVET programs trade-wise (Certificate program) Name of Trades Intake Capacity Agro based Food 810 Audio Video System 6,735 Automotive 1,605 Building Maintenance 9,090 Carpentry 630 Ceramics 30 Civil Construction 1,725 Computer 5,385 Drafting Civil 540 Drafting Mechanical 255 Dress Making and Tailoring 20,295 Dying and Printing 1,425 Electrical Maintenance Work 30 Farm Machinery 1,710 Fish Culture and Breeding 150 Food Processing and Preservation 7,650 Fruits and Vegetable Cultivation 240 General Electrical Works 13,950 General Mechanics 8,445 Livestock Rearing and Farming 90 Machinist 990 Poultry Rearing and Farming 480 Plumbing and Pipe Fitting 210 Refrigeration and Air conditioning 1,425 Turner 270 Weaving 1,425 Welding 1,635
Source: BTEB
Name of the trades in Certificate level programmes (Provided by Technical School and College, TVI and Non Govt. School and Madrasa) are presented in the Table S11.
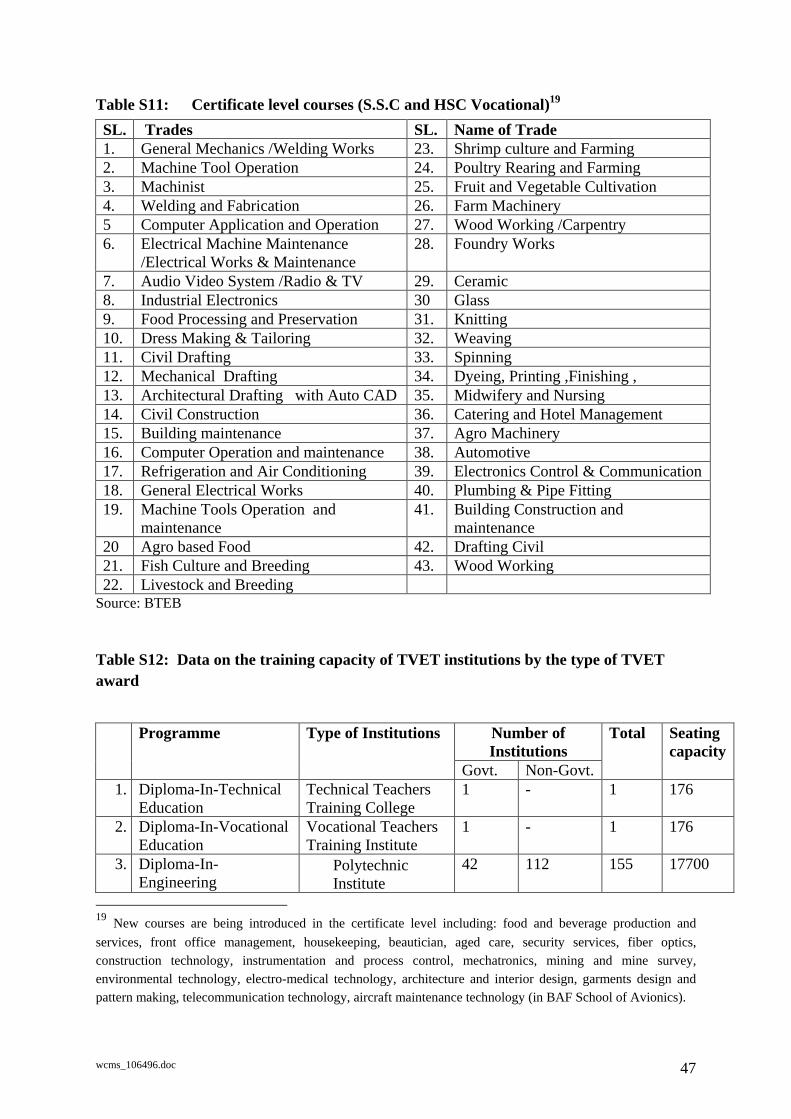
wcms_106496.doc 47
Table S11: Certificate level courses (S.S.C and HSC Vocational)19 SL. Trades SL. Name of Trade 1. General Mechanics /Welding Works 23. Shrimp culture and Farming 2. Machine Tool Operation 24. Poultry Rearing and Farming 3. Machinist 25. Fruit and Vegetable Cultivation 4. Welding and Fabrication 26. Farm Machinery 5 Computer Application and Operation 27. Wood Working /Carpentry 6. Electrical Machine Maintenance
/Electrical Works & Maintenance 28. Foundry Works
7. Audio Video System /Radio & TV 29. Ceramic 8. Industrial Electronics 30 Glass 9. Food Processing and Preservation 31. Knitting 10. Dress Making & Tailoring 32. Weaving 11. Civil Drafting 33. Spinning 12. Mechanical Drafting 34. Dyeing, Printing ,Finishing , 13. Architectural Drafting with Auto CAD 35. Midwifery and Nursing 14. Civil Construction 36. Catering and Hotel Management 15. Building maintenance 37. Agro Machinery 16. Computer Operation and maintenance 38. Automotive 17. Refrigeration and Air Conditioning 39. Electronics Control & Communication 18. General Electrical Works 40. Plumbing & Pipe Fitting 19. Machine Tools Operation and
maintenance 41. Building Construction and
maintenance 20 Agro based Food 42. Drafting Civil 21. Fish Culture and Breeding 43. Wood Working 22. Livestock and Breeding
Source: BTEB
Table S12: Data on the training capacity of TVET institutions by the type of TVET award
Number of Institutions
Programme Type of Institutions
Govt. Non-Govt.
Total Seating capacity
1. Diploma-In-Technical Education
Technical Teachers Training College
1 - 1 176
2. Diploma-In-Vocational Education
Vocational Teachers Training Institute
1 - 1 176
3. Diploma-In-Engineering
• Polytechnic Institute
42
112 155 17700
19 New courses are being introduced in the certificate level including: food and beverage production and services, front office management, housekeeping, beautician, aged care, security services, fiber optics, construction technology, instrumentation and process control, mechatronics, mining and mine survey, environmental technology, electro-medical technology, architecture and interior design, garments design and pattern making, telecommunication technology, aircraft maintenance technology (in BAF School of Avionics).
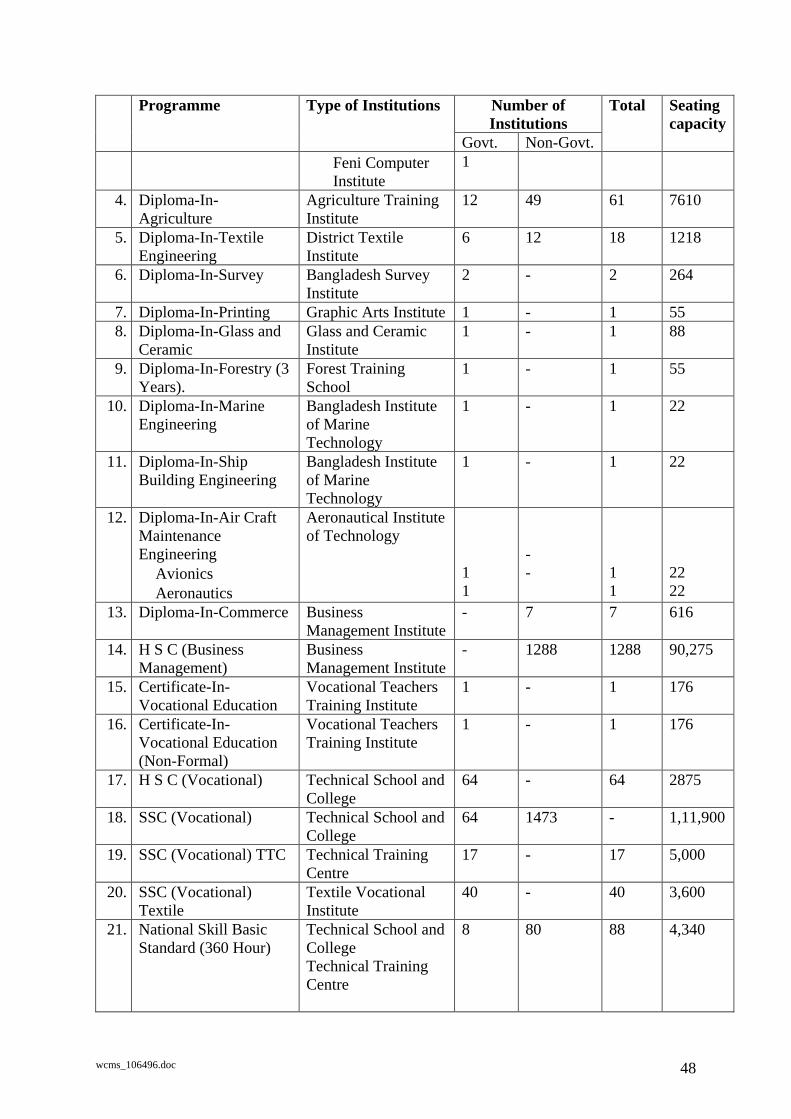
wcms_106496.doc 48
Number of Institutions
Programme Type of Institutions
Govt. Non-Govt.
Total Seating capacity
• Feni Computer Institute
1
4. Diploma-In-Agriculture
Agriculture Training Institute
12 49 61 7610
5. Diploma-In-Textile Engineering
District Textile Institute
6 12 18 1218
6. Diploma-In-Survey Bangladesh Survey Institute
2 - 2 264
7. Diploma-In-Printing Graphic Arts Institute 1 - 1 55 8. Diploma-In-Glass and
Ceramic Glass and Ceramic Institute
1 - 1 88
9. Diploma-In-Forestry (3 Years).
Forest Training School
1 - 1 55
10. Diploma-In-Marine Engineering
Bangladesh Institute of Marine Technology
1 - 1 22
11. Diploma-In-Ship Building Engineering
Bangladesh Institute of Marine Technology
1 - 1 22
12. Diploma-In-Air Craft Maintenance Engineering • Avionics • Aeronautics
Aeronautical Institute of Technology
11
-- 1
122 22
13. Diploma-In-Commerce Business Management Institute
- 7 7 616
14. H S C (Business Management)
Business Management Institute
- 1288 1288 90,275
15. Certificate-In-Vocational Education
Vocational Teachers Training Institute
1 - 1 176
16. Certificate-In-Vocational Education (Non-Formal)
Vocational Teachers Training Institute
1 - 1 176
17. H S C (Vocational) Technical School and College
64 - 64 2875
18. SSC (Vocational) Technical School and College
64 1473 - 1,11,900
19. SSC (Vocational) TTC Technical Training Centre
17 - 17 5,000
20. SSC (Vocational) Textile
Textile Vocational Institute
40 - 40 3,600
21. National Skill Basic Standard (360 Hour)
Technical School and College Technical Training Centre
8 80 88 4,340
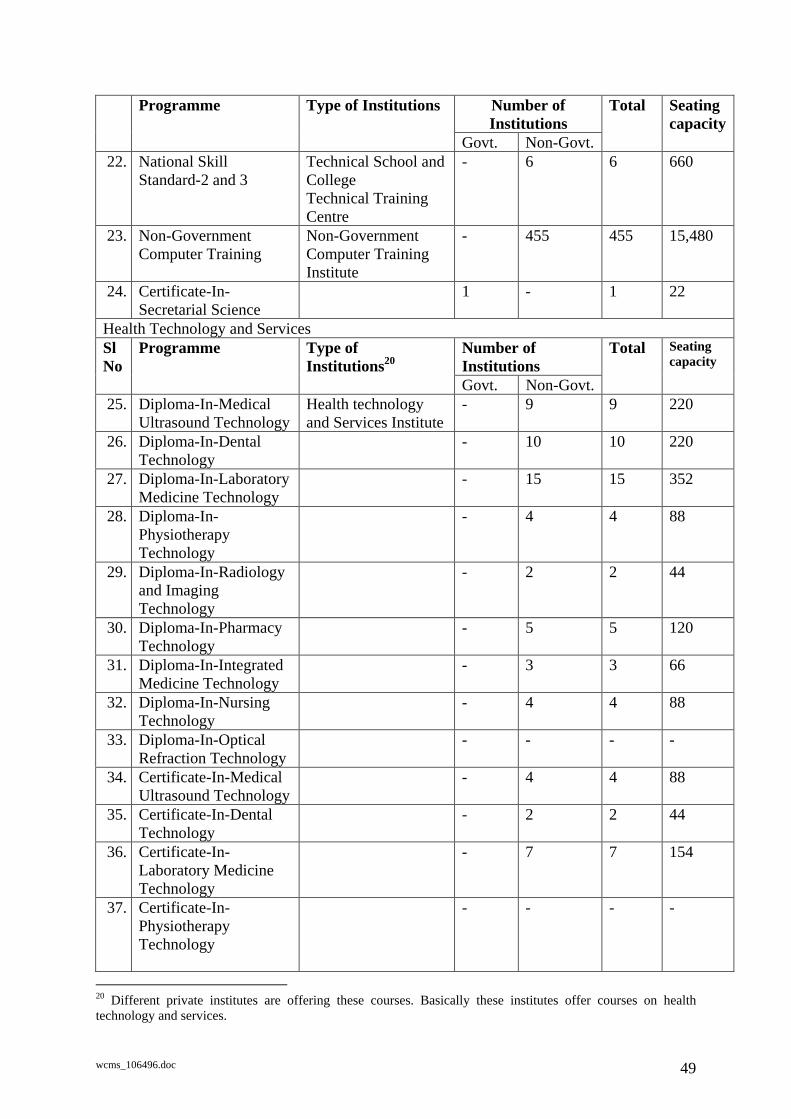
wcms_106496.doc 49
Number of Institutions
Programme Type of Institutions
Govt. Non-Govt.
Total Seating capacity
22. National Skill Standard-2 and 3
Technical School and College Technical Training Centre
- 6 6 660
23. Non-Government Computer Training
Non-Government Computer Training Institute
- 455 455 15,480
24. Certificate-In- Secretarial Science
1 - 1 22
Health Technology and Services Number of Institutions
Sl No
Programme Type of Institutions20
Govt. Non-Govt.
Total Seating capacity
25. Diploma-In-Medical Ultrasound Technology
Health technology and Services Institute
- 9 9 220
26. Diploma-In-Dental Technology
- 10 10 220
27. Diploma-In-Laboratory Medicine Technology
- 15 15 352
28. Diploma-In-Physiotherapy Technology
- 4 4 88
29. Diploma-In-Radiology and Imaging Technology
- 2 2 44
30. Diploma-In-Pharmacy Technology
- 5 5 120
31. Diploma-In-Integrated Medicine Technology
- 3 3 66
32. Diploma-In-Nursing Technology
- 4 4 88
33. Diploma-In-Optical Refraction Technology
- - - -
34. Certificate-In-Medical Ultrasound Technology
- 4 4 88
35. Certificate-In-Dental Technology
- 2 2 44
36. Certificate-In-Laboratory Medicine Technology
- 7 7 154
37. Certificate-In-Physiotherapy Technology
- - - -
20 Different private institutes are offering these courses. Basically these institutes offer courses on health technology and services.
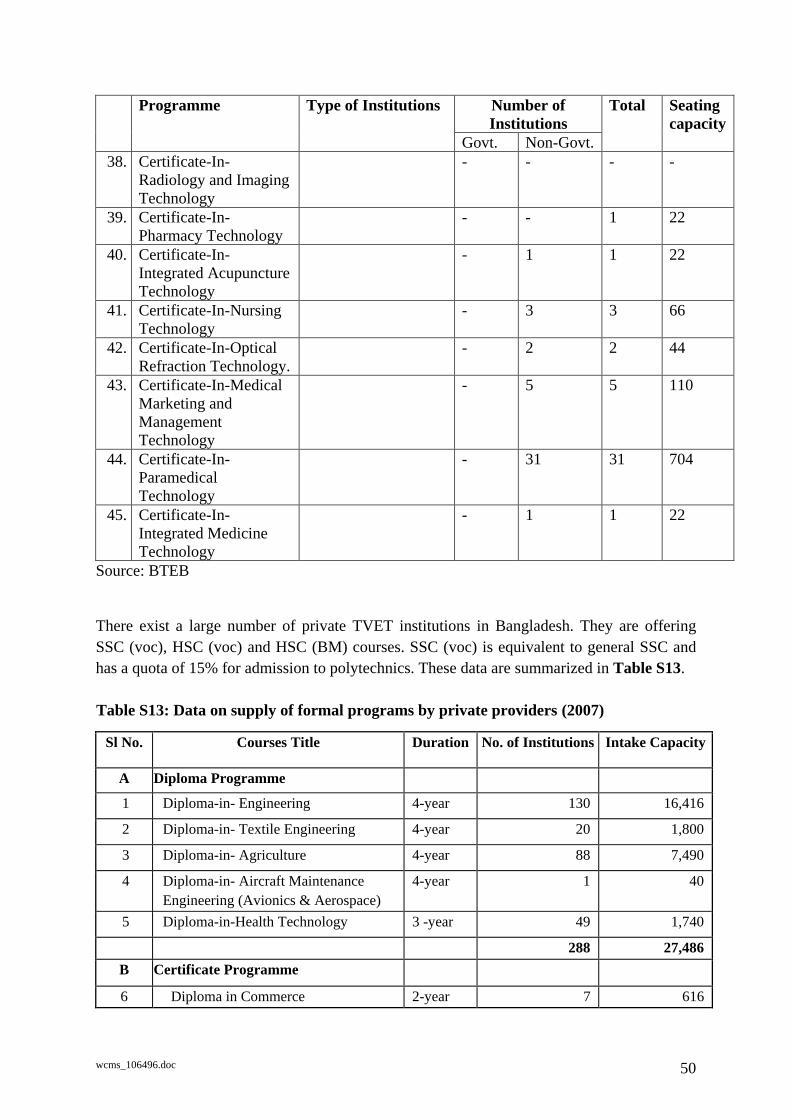
wcms_106496.doc 50
Number of Institutions
Programme Type of Institutions
Govt. Non-Govt.
Total Seating capacity
38. Certificate-In-Radiology and Imaging Technology
- - - -
39. Certificate-In-Pharmacy Technology
- - 1 22
40. Certificate-In-Integrated Acupuncture Technology
- 1 1 22
41. Certificate-In-Nursing Technology
- 3 3 66
42. Certificate-In-Optical Refraction Technology.
- 2 2 44
43. Certificate-In-Medical Marketing and Management Technology
- 5 5 110
44. Certificate-In-Paramedical Technology
- 31 31 704
45. Certificate-In-Integrated Medicine Technology
- 1 1 22
Source: BTEB
There exist a large number of private TVET institutions in Bangladesh. They are offering SSC (voc), HSC (voc) and HSC (BM) courses. SSC (voc) is equivalent to general SSC and has a quota of 15% for admission to polytechnics. These data are summarized in Table S13.
Table S13: Data on supply of formal programs by private providers (2007)
Sl No. Courses Title Duration No. of Institutions Intake Capacity
A Diploma Programme
1 Diploma-in- Engineering 4-year 130 16,416
2 Diploma-in- Textile Engineering 4-year 20 1,800
3 Diploma-in- Agriculture 4-year 88 7,490
4 Diploma-in- Aircraft Maintenance Engineering (Avionics & Aerospace)
4-year 1 40
5 Diploma-in-Health Technology 3 -year 49 1,740
288 27,486 B Certificate Programme
6 Diploma in Commerce 2-year 7 616
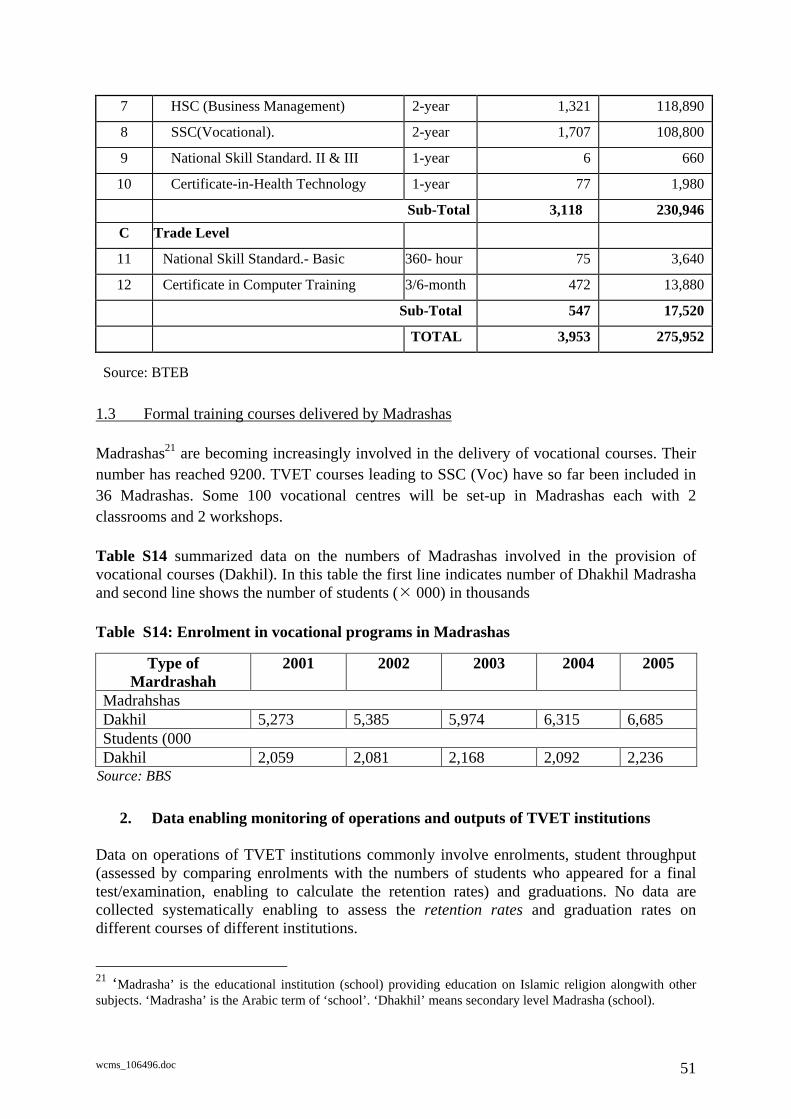
wcms_106496.doc 51
7 HSC (Business Management) 2-year 1,321 118,890
8 SSC(Vocational). 2-year 1,707 108,800
9 National Skill Standard. II & III 1-year 6 660
10 Certificate-in-Health Technology 1-year 77 1,980
Sub-Total 3,118 230,946 C Trade Level
11 National Skill Standard.- Basic 360- hour 75 3,640
12 Certificate in Computer Training 3/6-month 472 13,880
Sub-Total 547 17,520
TOTAL 3,953 275,952
Source: BTEB
1.3 Formal training courses delivered by Madrashas
Madrashas21 are becoming increasingly involved in the delivery of vocational courses. Their number has reached 9200. TVET courses leading to SSC (Voc) have so far been included in 36 Madrashas. Some 100 vocational centres will be set-up in Madrashas each with 2 classrooms and 2 workshops. Table S14 summarized data on the numbers of Madrashas involved in the provision of vocational courses (Dakhil). In this table the first line indicates number of Dhakhil Madrasha and second line shows the number of students (� 000) in thousands Table S14: Enrolment in vocational programs in Madrashas
Type of Mardrashah
2001 2002 2003 2004 2005
Madrahshas Dakhil 5,273 5,385 5,974 6,315 6,685 Students (000 Dakhil 2,059 2,081 2,168 2,092 2,236
Source: BBS
2. Data enabling monitoring of operations and outputs of TVET institutions
Data on operations of TVET institutions commonly involve enrolments, student throughput (assessed by comparing enrolments with the numbers of students who appeared for a final test/examination, enabling to calculate the retention rates) and graduations. No data are collected systematically enabling to assess the retention rates and graduation rates on different courses of different institutions.
21 ‘Madrasha’ is the educational institution (school) providing education on Islamic religion alongwith other subjects. ‘Madrasha’ is the Arabic term of ‘school’. ‘Dhakhil’ means secondary level Madrasha (school).
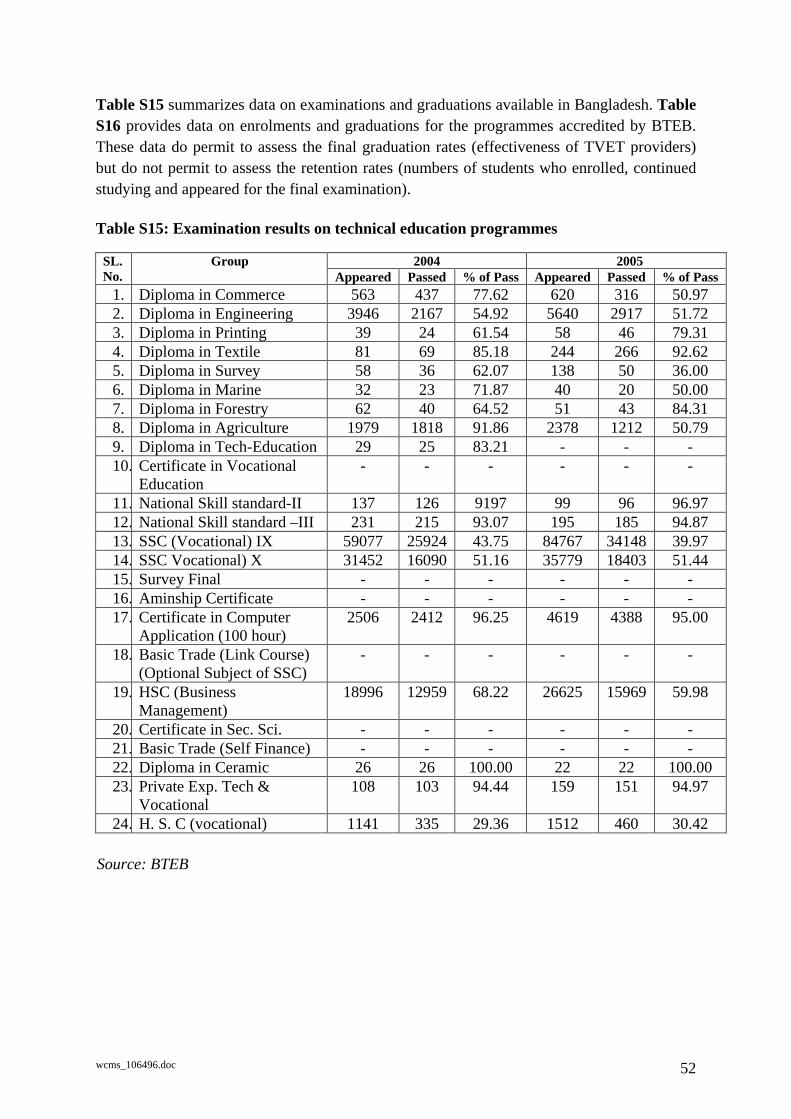
wcms_106496.doc 52
Table S15 summarizes data on examinations and graduations available in Bangladesh. Table S16 provides data on enrolments and graduations for the programmes accredited by BTEB. These data do permit to assess the final graduation rates (effectiveness of TVET providers) but do not permit to assess the retention rates (numbers of students who enrolled, continued studying and appeared for the final examination). Table S15: Examination results on technical education programmes
2004 2005 SL. No.
Group Appeared Passed % of Pass Appeared Passed % of Pass
1. Diploma in Commerce 563 437 77.62 620 316 50.97 2. Diploma in Engineering 3946 2167 54.92 5640 2917 51.72 3. Diploma in Printing 39 24 61.54 58 46 79.31 4. Diploma in Textile 81 69 85.18 244 266 92.62 5. Diploma in Survey 58 36 62.07 138 50 36.00 6. Diploma in Marine 32 23 71.87 40 20 50.00 7. Diploma in Forestry 62 40 64.52 51 43 84.31 8. Diploma in Agriculture 1979 1818 91.86 2378 1212 50.79 9. Diploma in Tech-Education 29 25 83.21 - - - 10. Certificate in Vocational
Education - - - - - -
11. National Skill standard-II 137 126 9197 99 96 96.97 12. National Skill standard –III 231 215 93.07 195 185 94.87 13. SSC (Vocational) IX 59077 25924 43.75 84767 34148 39.97 14. SSC Vocational) X 31452 16090 51.16 35779 18403 51.44 15. Survey Final - - - - - - 16. Aminship Certificate - - - - - - 17. Certificate in Computer
Application (100 hour) 2506 2412 96.25 4619 4388 95.00
18. Basic Trade (Link Course) (Optional Subject of SSC)
- - - - - -
19. HSC (Business Management)
18996 12959 68.22 26625 15969 59.98
20. Certificate in Sec. Sci. - - - - - - 21. Basic Trade (Self Finance) - - - - - - 22. Diploma in Ceramic 26 26 100.00 22 22 100.00 23. Private Exp. Tech &
Vocational 108 103 94.44 159 151 94.97
24. H. S. C (vocational) 1141 335 29.36 1512 460 30.42
Source: BTEB
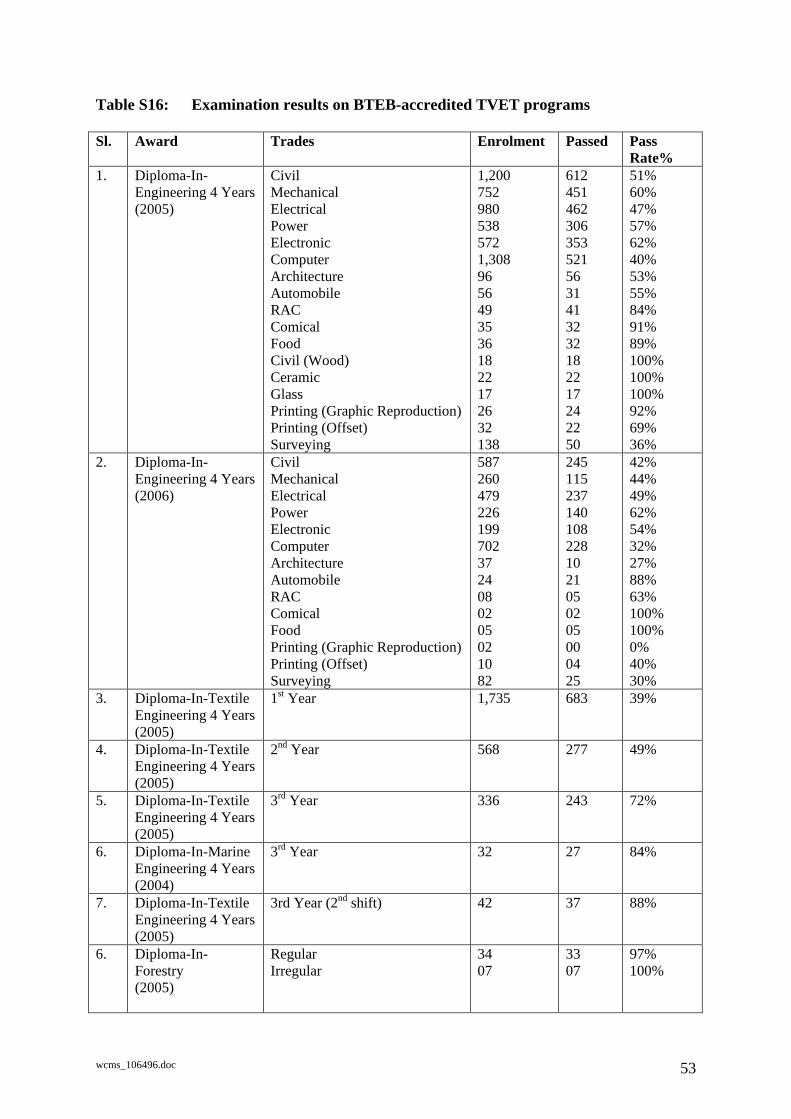
wcms_106496.doc 53
Table S16: Examination results on BTEB-accredited TVET programs Sl. Award Trades Enrolment Passed Pass
Rate% 1. Diploma-In-
Engineering 4 Years (2005)
Civil Mechanical Electrical Power Electronic Computer Architecture Automobile RAC Comical Food Civil (Wood) Ceramic Glass Printing (Graphic Reproduction) Printing (Offset) Surveying
1,200 752 980 538 572 1,308 96 56 49 35 36 18 22 17 26 32 138
612 451 462 306 353 521 56 31 41 32 32 18 22 17 24 22 50
51% 60% 47% 57% 62% 40% 53% 55% 84% 91% 89% 100% 100% 100% 92% 69% 36%
2. Diploma-In-Engineering 4 Years (2006)
Civil Mechanical Electrical Power Electronic Computer Architecture Automobile RAC Comical Food Printing (Graphic Reproduction) Printing (Offset) Surveying
587 260 479 226 199 702 37 24 08 02 05 02 10 82
245 115 237 140 108 228 10 21 05 02 05 00 04 25
42% 44% 49% 62% 54% 32% 27% 88% 63% 100% 100% 0% 40% 30%
3. Diploma-In-Textile Engineering 4 Years (2005)
1st Year 1,735 683 39%
4. Diploma-In-Textile Engineering 4 Years (2005)
2nd Year 568 277 49%
5. Diploma-In-Textile Engineering 4 Years (2005)
3rd Year 336 243 72%
6. Diploma-In-Marine Engineering 4 Years (2004)
3rd Year 32 27 84%
7. Diploma-In-Textile Engineering 4 Years (2005)
3rd Year (2nd shift) 42 37 88%
6. Diploma-In-Forestry (2005)
Regular Irregular
34 07
33 07
97% 100%
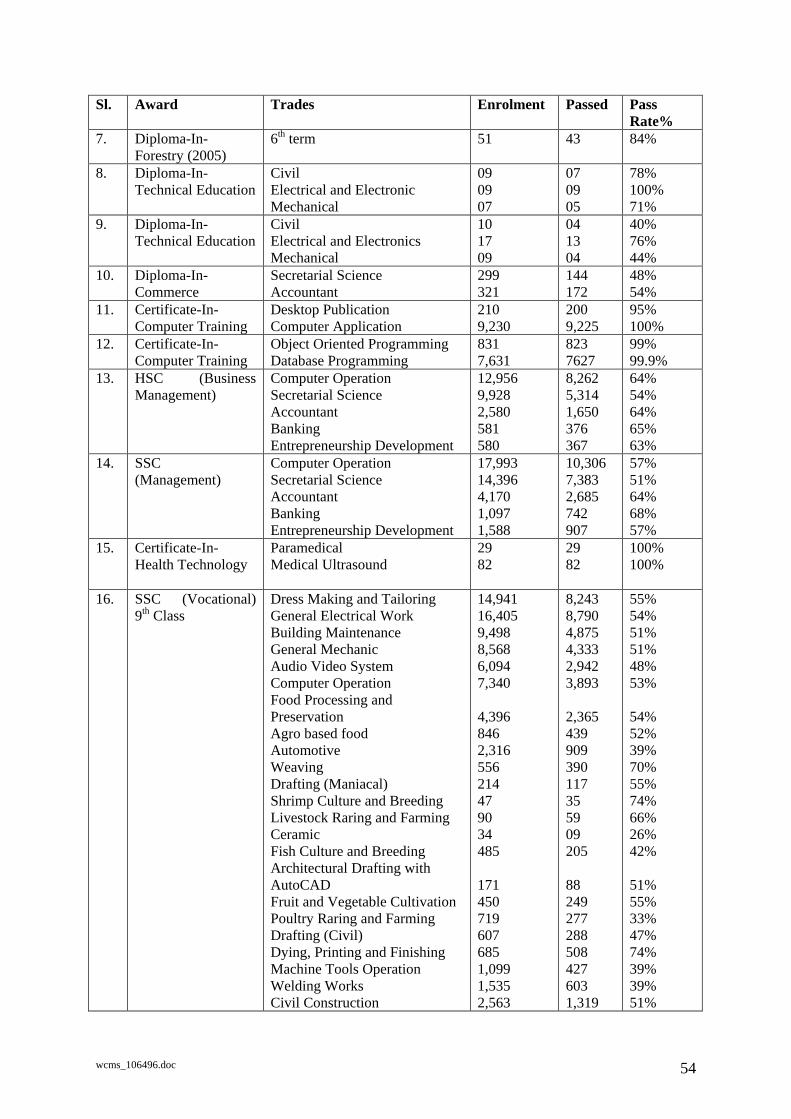
wcms_106496.doc 54
Sl. Award Trades Enrolment Passed Pass Rate%
7. Diploma-In-Forestry (2005)
6th term 51 43 84%
8. Diploma-In-Technical Education
Civil Electrical and Electronic Mechanical
09 09 07
07 09 05
78% 100% 71%
9. Diploma-In-Technical Education
Civil Electrical and Electronics Mechanical
10 17 09
04 13 04
40% 76% 44%
10. Diploma-In-Commerce
Secretarial Science Accountant
299 321
144 172
48% 54%
11. Certificate-In- Computer Training
Desktop Publication Computer Application
210 9,230
200 9,225
95% 100%
12. Certificate-In- Computer Training
Object Oriented Programming Database Programming
831 7,631
823 7627
99% 99.9%
13. HSC (Business Management)
Computer Operation Secretarial Science Accountant Banking Entrepreneurship Development
12,956 9,928 2,580 581 580
8,262 5,314 1,650 376 367
64% 54% 64% 65% 63%
14. SSC (Management)
Computer Operation Secretarial Science Accountant Banking Entrepreneurship Development
17,993 14,396 4,170 1,097 1,588
10,306 7,383 2,685 742 907
57% 51% 64% 68% 57%
15. Certificate-In-Health Technology
Paramedical Medical Ultrasound
29 82
29 82
100% 100%
16. SSC (Vocational) 9th Class
Dress Making and Tailoring General Electrical Work Building Maintenance General Mechanic Audio Video System Computer Operation Food Processing and Preservation Agro based food Automotive Weaving Drafting (Maniacal) Shrimp Culture and Breeding Livestock Raring and Farming Ceramic Fish Culture and Breeding Architectural Drafting with AutoCAD Fruit and Vegetable Cultivation Poultry Raring and Farming Drafting (Civil) Dying, Printing and Finishing Machine Tools Operation Welding Works Civil Construction
14,941 16,405 9,498 8,568 6,094 7,340 4,396 846 2,316 556 214 47 90 34 485 171 450 719 607 685 1,099 1,535 2,563
8,243 8,790 4,875 4,333 2,942 3,893 2,365 439 909 390 117 35 59 09 205 88 249 277 288 508 427 603 1,319
55% 54% 51% 51% 48% 53% 54% 52% 39% 70% 55% 74% 66% 26% 42% 51% 55% 33% 47% 74% 39% 39% 51%
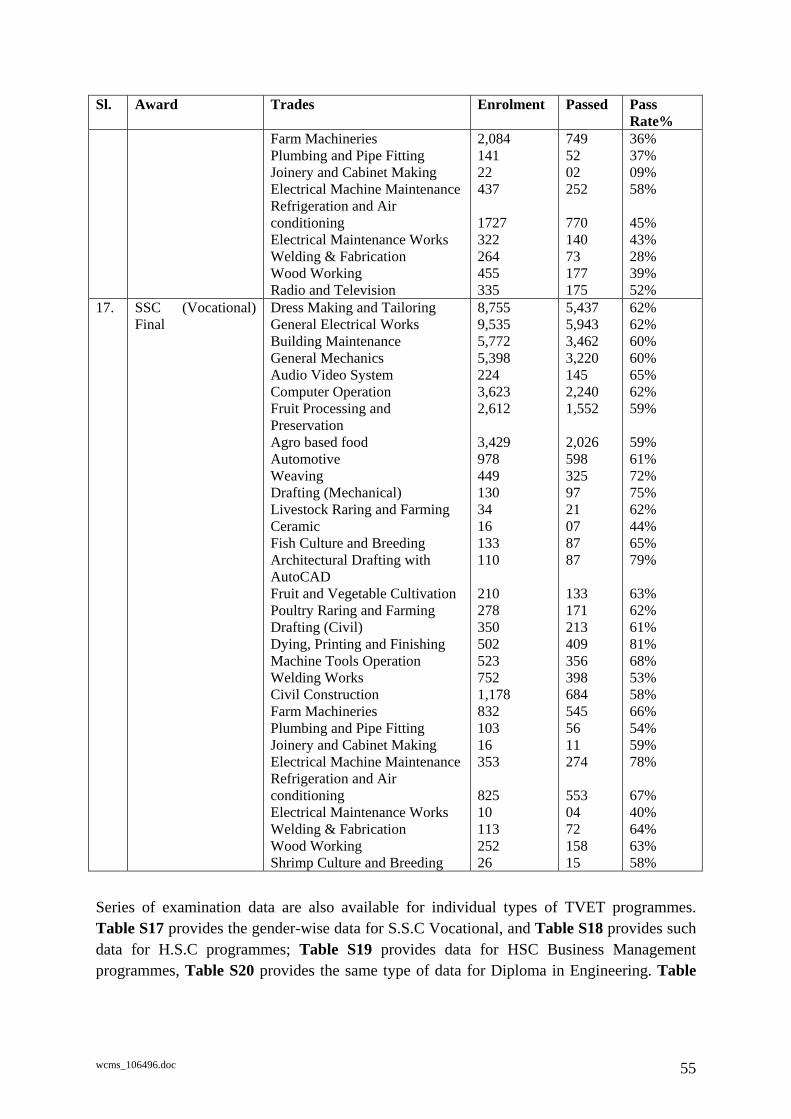
wcms_106496.doc 55
Sl. Award Trades Enrolment Passed Pass Rate%
Farm Machineries Plumbing and Pipe Fitting Joinery and Cabinet Making Electrical Machine Maintenance Refrigeration and Air conditioning Electrical Maintenance Works Welding & Fabrication Wood Working Radio and Television
2,084 141 22 437 1727 322 264 455 335
749 52 02 252 770 140 73 177 175
36% 37% 09% 58% 45% 43% 28% 39% 52%
17. SSC (Vocational) Final
Dress Making and Tailoring General Electrical Works Building Maintenance General Mechanics Audio Video System Computer Operation Fruit Processing and Preservation Agro based food Automotive Weaving Drafting (Mechanical) Livestock Raring and Farming Ceramic Fish Culture and Breeding Architectural Drafting with AutoCAD Fruit and Vegetable Cultivation Poultry Raring and Farming Drafting (Civil) Dying, Printing and Finishing Machine Tools Operation Welding Works Civil Construction Farm Machineries Plumbing and Pipe Fitting Joinery and Cabinet Making Electrical Machine Maintenance Refrigeration and Air conditioning Electrical Maintenance Works Welding & Fabrication Wood Working Shrimp Culture and Breeding
8,755 9,535 5,772 5,398 224 3,623 2,612 3,429 978 449 130 34 16 133 110 210 278 350 502 523 752 1,178 832 103 16 353 825 10 113 252 26
5,437 5,943 3,462 3,220 145 2,240 1,552 2,026 598 325 97 21 07 87 87 133 171 213 409 356 398 684 545 56 11 274 553 04 72 158 15
62% 62% 60% 60% 65% 62% 59% 59% 61% 72% 75% 62% 44% 65% 79% 63% 62% 61% 81% 68% 53% 58% 66% 54% 59% 78% 67% 40% 64% 63% 58%
Series of examination data are also available for individual types of TVET programmes. Table S17 provides the gender-wise data for S.S.C Vocational, and Table S18 provides such data for H.S.C programmes; Table S19 provides data for HSC Business Management programmes, Table S20 provides the same type of data for Diploma in Engineering. Table
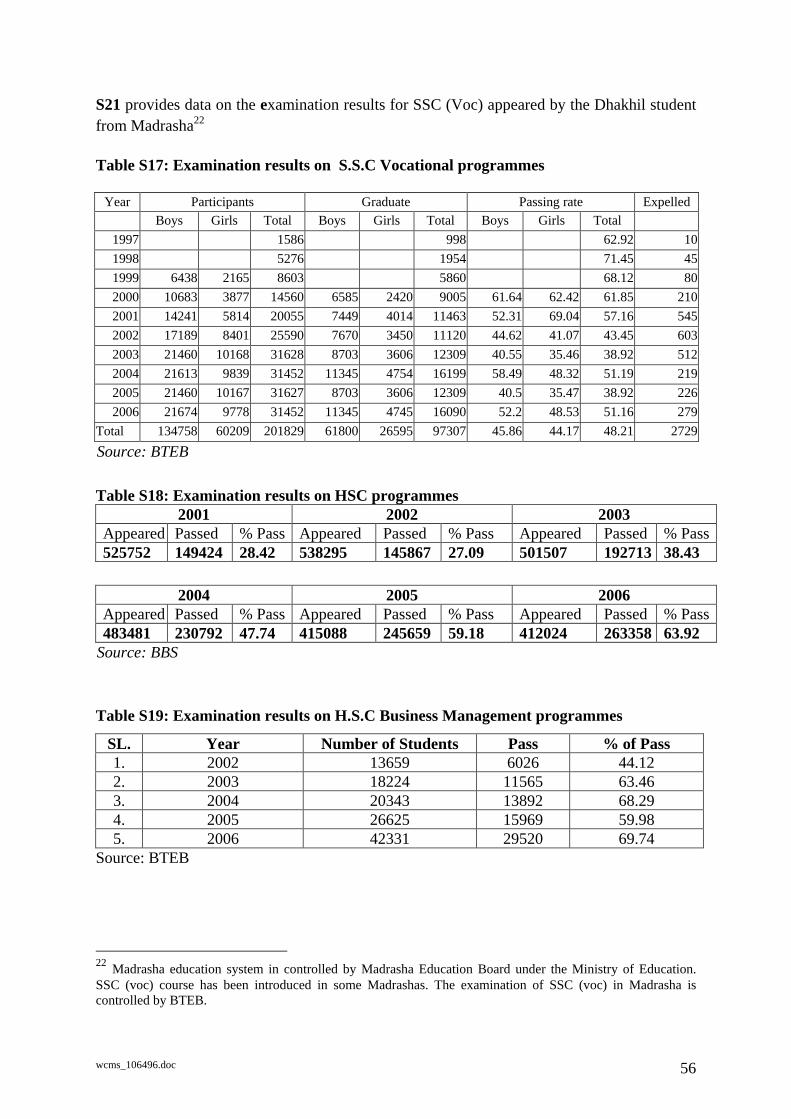
wcms_106496.doc 56
S21 provides data on the examination results for SSC (Voc) appeared by the Dhakhil student from Madrasha22
Table S17: Examination results on S.S.C Vocational programmes
Year Participants Graduate Passing rate Expelled Boys Girls Total Boys Girls Total Boys Girls Total
1997 1586 998 62.92 101998 5276 1954 71.45 451999 6438 2165 8603 5860 68.12 802000 10683 3877 14560 6585 2420 9005 61.64 62.42 61.85 2102001 14241 5814 20055 7449 4014 11463 52.31 69.04 57.16 5452002 17189 8401 25590 7670 3450 11120 44.62 41.07 43.45 6032003 21460 10168 31628 8703 3606 12309 40.55 35.46 38.92 5122004 21613 9839 31452 11345 4754 16199 58.49 48.32 51.19 2192005 21460 10167 31627 8703 3606 12309 40.5 35.47 38.92 2262006 21674 9778 31452 11345 4745 16090 52.2 48.53 51.16 279
Total 134758 60209 201829 61800 26595 97307 45.86 44.17 48.21 2729Source: BTEB
Table S18: Examination results on HSC programmes 2001 2002 2003
Appeared Passed % Pass Appeared Passed % Pass Appeared Passed % Pass 525752 149424 28.42 538295 145867 27.09 501507 192713 38.43
2004 2005 2006 Appeared Passed % Pass Appeared Passed % Pass Appeared Passed % Pass 483481 230792 47.74 415088 245659 59.18 412024 263358 63.92
Source: BBS
Table S19: Examination results on H.S.C Business Management programmes
SL. Year Number of Students Pass % of Pass 1. 2002 13659 6026 44.12 2. 2003 18224 11565 63.46 3. 2004 20343 13892 68.29 4. 2005 26625 15969 59.98 5. 2006 42331 29520 69.74
Source: BTEB
22 Madrasha education system in controlled by Madrasha Education Board under the Ministry of Education. SSC (voc) course has been introduced in some Madrashas. The examination of SSC (voc) in Madrasha is controlled by BTEB.
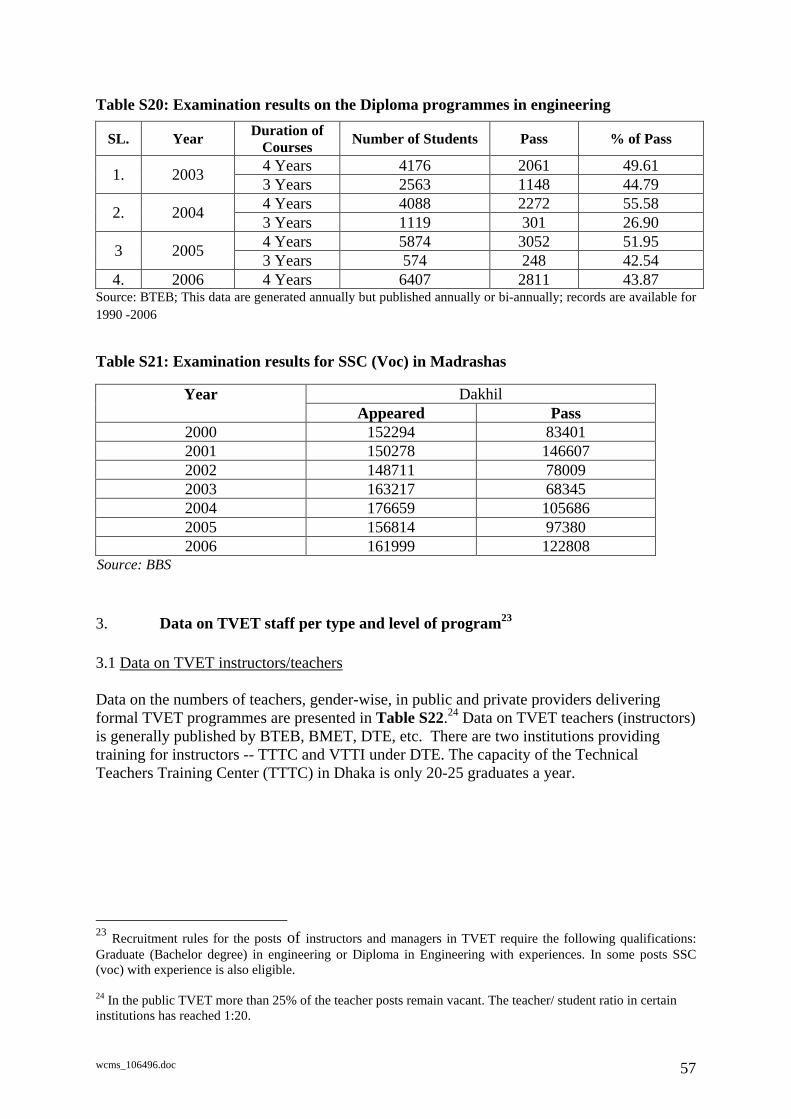
wcms_106496.doc 57
Table S20: Examination results on the Diploma programmes in engineering
SL. Year Duration of Courses Number of Students Pass % of Pass
4 Years 4176 2061 49.61 1. 2003 3 Years 2563 1148 44.79 4 Years 4088 2272 55.58 2. 2004 3 Years 1119 301 26.90 4 Years 5874 3052 51.95 3 2005 3 Years 574 248 42.54
4. 2006 4 Years 6407 2811 43.87 Source: BTEB; This data are generated annually but published annually or bi-annually; records are available for 1990 -2006
Table S21: Examination results for SSC (Voc) in Madrashas
Dakhil Year Appeared Pass
2000 152294 83401 2001 150278 146607 2002 148711 78009 2003 163217 68345 2004 176659 105686 2005 156814 97380 2006 161999 122808
Source: BBS
3. Data on TVET staff per type and level of program23
3.1 Data on TVET instructors/teachers
Data on the numbers of teachers, gender-wise, in public and private providers delivering formal TVET programmes are presented in Table S22.24 Data on TVET teachers (instructors) is generally published by BTEB, BMET, DTE, etc. There are two institutions providing training for instructors -- TTTC and VTTI under DTE. The capacity of the Technical Teachers Training Center (TTTC) in Dhaka is only 20-25 graduates a year.
23 Recruitment rules for the posts of instructors and managers in TVET require the following qualifications: Graduate (Bachelor degree) in engineering or Diploma in Engineering with experiences. In some posts SSC (voc) with experience is also eligible. 24 In the public TVET more than 25% of the teacher posts remain vacant. The teacher/ student ratio in certain institutions has reached 1:20.
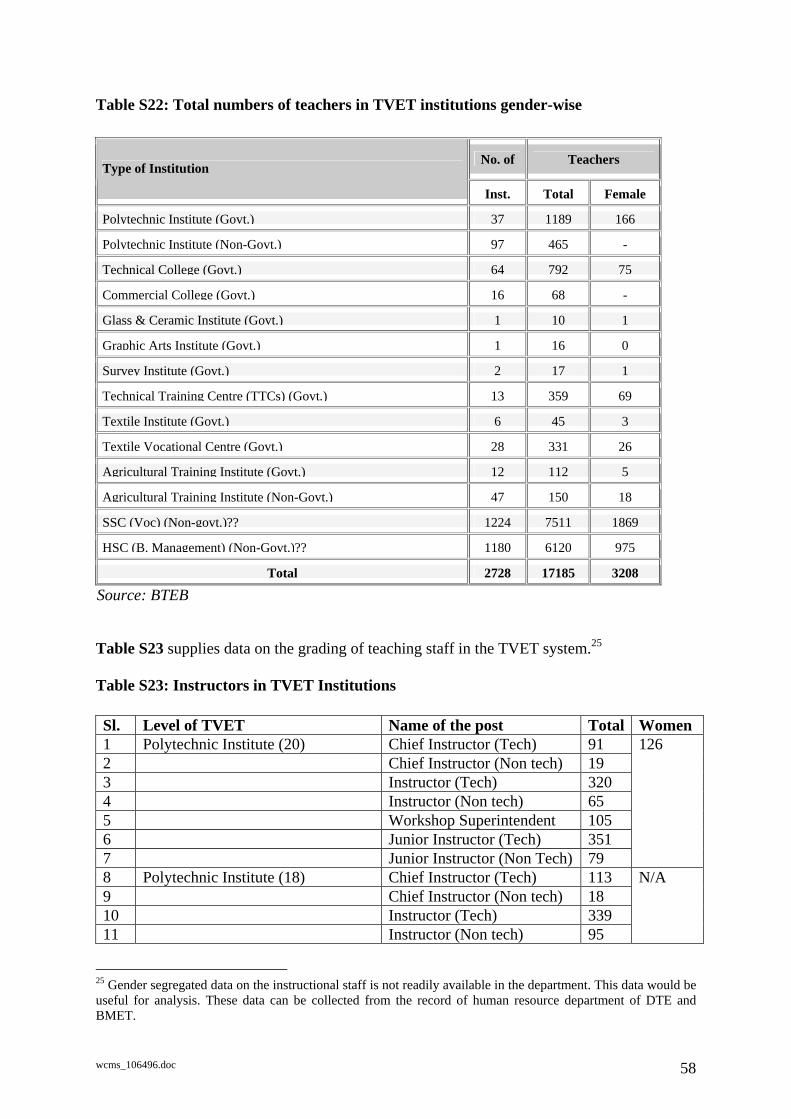
wcms_106496.doc 58
Table S22: Total numbers of teachers in TVET institutions gender-wise
No. of Teachers Type of Institution
Inst. Total Female
Polytechnic Institute (Govt.) 37 1189 166
Polytechnic Institute (Non-Govt.) 97 465 -
Technical College (Govt.) 64 792 75
Commercial College (Govt.) 16 68 -
Glass & Ceramic Institute (Govt.) 1 10 1
Graphic Arts Institute (Govt.) 1 16 0
Survey Institute (Govt.) 2 17 1
Technical Training Centre (TTCs) (Govt.) 13 359 69
Textile Institute (Govt.) 6 45 3
Textile Vocational Centre (Govt.) 28 331 26
Agricultural Training Institute (Govt.) 12 112 5
Agricultural Training Institute (Non-Govt.) 47 150 18
SSC (Voc) (Non-govt.)?? 1224 7511 1869
HSC (B. Management) (Non-Govt.)?? 1180 6120 975
Total 2728 17185 3208
Source: BTEB
Table S23 supplies data on the grading of teaching staff in the TVET system.25
Table S23: Instructors in TVET Institutions Sl. Level of TVET Name of the post Total Women 1 Polytechnic Institute (20) Chief Instructor (Tech) 91 2 Chief Instructor (Non tech) 19 3 Instructor (Tech) 320 4 Instructor (Non tech) 65 5 Workshop Superintendent 105 6 Junior Instructor (Tech) 351 7 Junior Instructor (Non Tech) 79
126
8 Polytechnic Institute (18) Chief Instructor (Tech) 113 9 Chief Instructor (Non tech) 18 10 Instructor (Tech) 339 11 Instructor (Non tech) 95
N/A
25 Gender segregated data on the instructional staff is not readily available in the department. This data would be useful for analysis. These data can be collected from the record of human resource department of DTE and BMET.
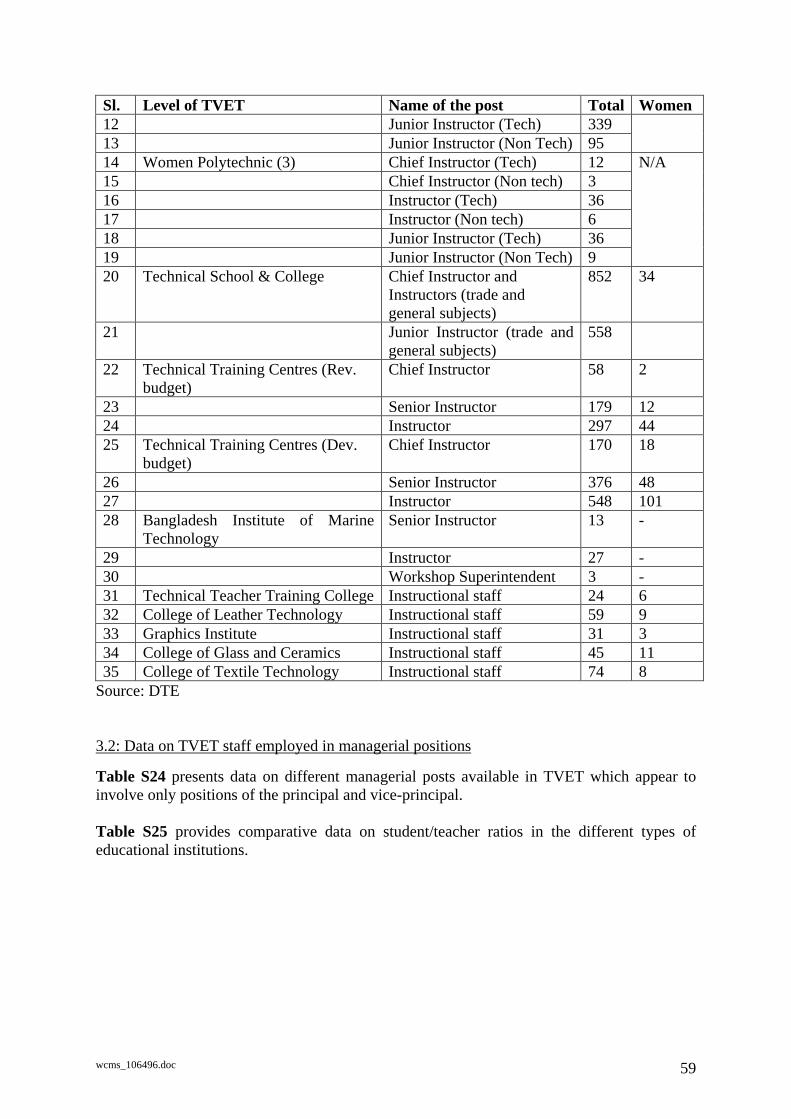
wcms_106496.doc 59
Sl. Level of TVET Name of the post Total Women 12 Junior Instructor (Tech) 339 13 Junior Instructor (Non Tech) 95 14 Women Polytechnic (3) Chief Instructor (Tech) 12 15 Chief Instructor (Non tech) 3 16 Instructor (Tech) 36 17 Instructor (Non tech) 6 18 Junior Instructor (Tech) 36 19 Junior Instructor (Non Tech) 9
N/A
20 Technical School & College Chief Instructor and Instructors (trade and general subjects)
852 34
21 Junior Instructor (trade and general subjects)
558
22 Technical Training Centres (Rev. budget)
Chief Instructor 58 2
23 Senior Instructor 179 12 24 Instructor 297 44 25 Technical Training Centres (Dev.
budget) Chief Instructor 170 18
26 Senior Instructor 376 48 27 Instructor 548 101 28 Bangladesh Institute of Marine
Technology Senior Instructor 13 -
29 Instructor 27 - 30 Workshop Superintendent 3 - 31 Technical Teacher Training College Instructional staff 24 6 32 College of Leather Technology Instructional staff 59 9 33 Graphics Institute Instructional staff 31 3 34 College of Glass and Ceramics Instructional staff 45 11 35 College of Textile Technology Instructional staff 74 8
Source: DTE
3.2: Data on TVET staff employed in managerial positions
Table S24 presents data on different managerial posts available in TVET which appear to involve only positions of the principal and vice-principal. Table S25 provides comparative data on student/teacher ratios in the different types of educational institutions.
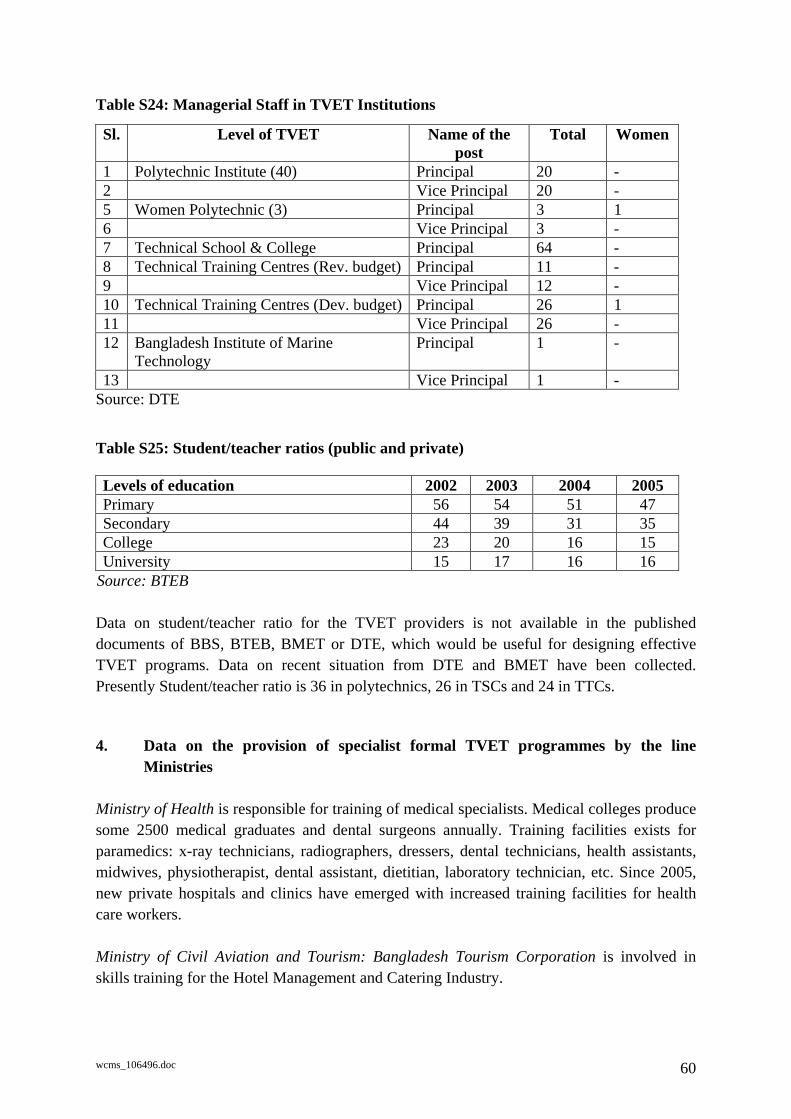
wcms_106496.doc 60
Table S24: Managerial Staff in TVET Institutions
Sl. Level of TVET Name of the post
Total Women
1 Polytechnic Institute (40) Principal 20 - 2 Vice Principal 20 - 5 Women Polytechnic (3) Principal 3 1 6 Vice Principal 3 - 7 Technical School & College Principal 64 - 8 Technical Training Centres (Rev. budget) Principal 11 - 9 Vice Principal 12 - 10 Technical Training Centres (Dev. budget) Principal 26 1 11 Vice Principal 26 - 12 Bangladesh Institute of Marine
Technology Principal 1 -
13 Vice Principal 1 - Source: DTE
Table S25: Student/teacher ratios (public and private) Levels of education 2002 2003 2004 2005 Primary 56 54 51 47 Secondary 44 39 31 35 College 23 20 16 15 University 15 17 16 16
Source: BTEB Data on student/teacher ratio for the TVET providers is not available in the published documents of BBS, BTEB, BMET or DTE, which would be useful for designing effective TVET programs. Data on recent situation from DTE and BMET have been collected. Presently Student/teacher ratio is 36 in polytechnics, 26 in TSCs and 24 in TTCs.
4. Data on the provision of specialist formal TVET programmes by the line Ministries Ministry of Health is responsible for training of medical specialists. Medical colleges produce some 2500 medical graduates and dental surgeons annually. Training facilities exists for paramedics: x-ray technicians, radiographers, dressers, dental technicians, health assistants, midwives, physiotherapist, dental assistant, dietitian, laboratory technician, etc. Since 2005, new private hospitals and clinics have emerged with increased training facilities for health care workers. Ministry of Civil Aviation and Tourism: Bangladesh Tourism Corporation is involved in skills training for the Hotel Management and Catering Industry.

wcms_106496.doc 61
These courses are not affiliated with BTEB. Hospitality management is now considered a growth industry with new international franchise and good offshore demand. Bangladesh Tourism Corporation has training centre named National Hotel and Tourism Training Institute (NHTTI)26, which offers diploma and certificate courses in the following fields:
1. Diploma in Hotel Management 2. Professional chef course 3. Food and beverage service 4. Food and beverage production 5. Front office and secretarial operation 6. Bakery and Pastry Production 7. House Keeping and laundry operation 8. Travel agency and tour operation 9. Computer literacy.
Annual production capacity is about 500. Duration of these courses vary from 4 months to 1 year. Moreover some other private training institutes offer these types of courses. These institutes are located in Dhaka and Sylhet. Ministry of Textile offers a 4-year Diploma in Textile Engineering in two institutions with the annual intake capacity of 160 students. It’s textile vocational training institutions provide the Certificate-level training. Examples of the line ministries –based specialist training provision are provided in Table S26, S27 and S28.
Table S26: Training programs of the Ministry of Textiles
Name of the course
Duration
Seat capacity Enrolments Passed Out
1. S.S.C.(vocational Textile Course) 2 years 3600 2653 1525 2. Diploma in Textile Engineering 4 years 4041 344 295
Source: Textile Department
Table S27: Specialist programs of other ministries Sl Name of the
Ministry/Department Training program
1 Ministry of Local Government, Rural Development and Cooperatives (LGRD)
Diploma in Engineering in Surveying
2 Ministry of Environment and Forests
Diploma in Engineering in Forestry (1 instt.) and Diploma in Engineering in Forestry (in-service) (2 inst)
26 NHTTI is located at Mahakhali, Dhaka
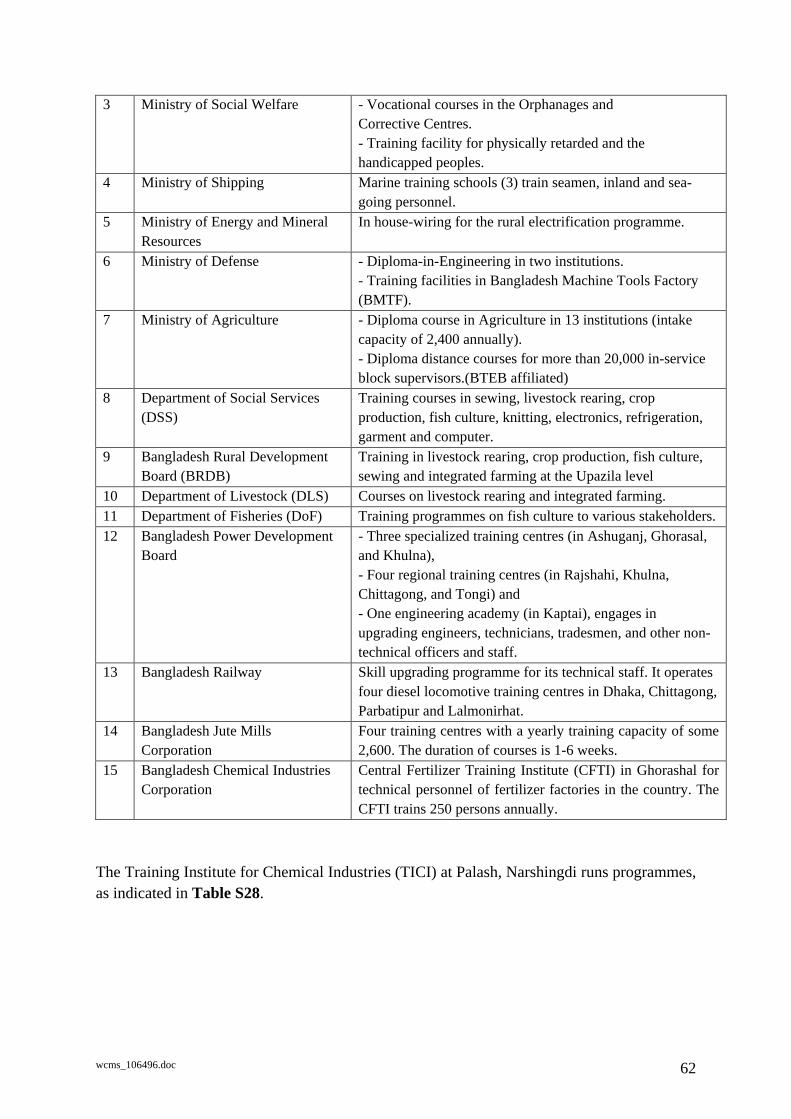
wcms_106496.doc 62
3 Ministry of Social Welfare - Vocational courses in the Orphanages and Corrective Centres. - Training facility for physically retarded and the handicapped peoples.
4 Ministry of Shipping Marine training schools (3) train seamen, inland and sea-going personnel.
5 Ministry of Energy and Mineral Resources
In house-wiring for the rural electrification programme.
6 Ministry of Defense - Diploma-in-Engineering in two institutions. - Training facilities in Bangladesh Machine Tools Factory (BMTF).
7 Ministry of Agriculture
- Diploma course in Agriculture in 13 institutions (intake capacity of 2,400 annually). - Diploma distance courses for more than 20,000 in-service block supervisors.(BTEB affiliated)
8 Department of Social Services (DSS)
Training courses in sewing, livestock rearing, crop production, fish culture, knitting, electronics, refrigeration, garment and computer.
9 Bangladesh Rural Development Board (BRDB)
Training in livestock rearing, crop production, fish culture, sewing and integrated farming at the Upazila level
10 Department of Livestock (DLS) Courses on livestock rearing and integrated farming. 11 Department of Fisheries (DoF) Training programmes on fish culture to various stakeholders. 12 Bangladesh Power Development
Board - Three specialized training centres (in Ashuganj, Ghorasal, and Khulna), - Four regional training centres (in Rajshahi, Khulna, Chittagong, and Tongi) and - One engineering academy (in Kaptai), engages in upgrading engineers, technicians, tradesmen, and other non-technical officers and staff.
13 Bangladesh Railway Skill upgrading programme for its technical staff. It operates four diesel locomotive training centres in Dhaka, Chittagong, Parbatipur and Lalmonirhat.
14 Bangladesh Jute Mills Corporation
Four training centres with a yearly training capacity of some 2,600. The duration of courses is 1-6 weeks.
15 Bangladesh Chemical Industries Corporation
Central Fertilizer Training Institute (CFTI) in Ghorashal for technical personnel of fertilizer factories in the country. The CFTI trains 250 persons annually.
The Training Institute for Chemical Industries (TICI) at Palash, Narshingdi runs programmes, as indicated in Table S28.
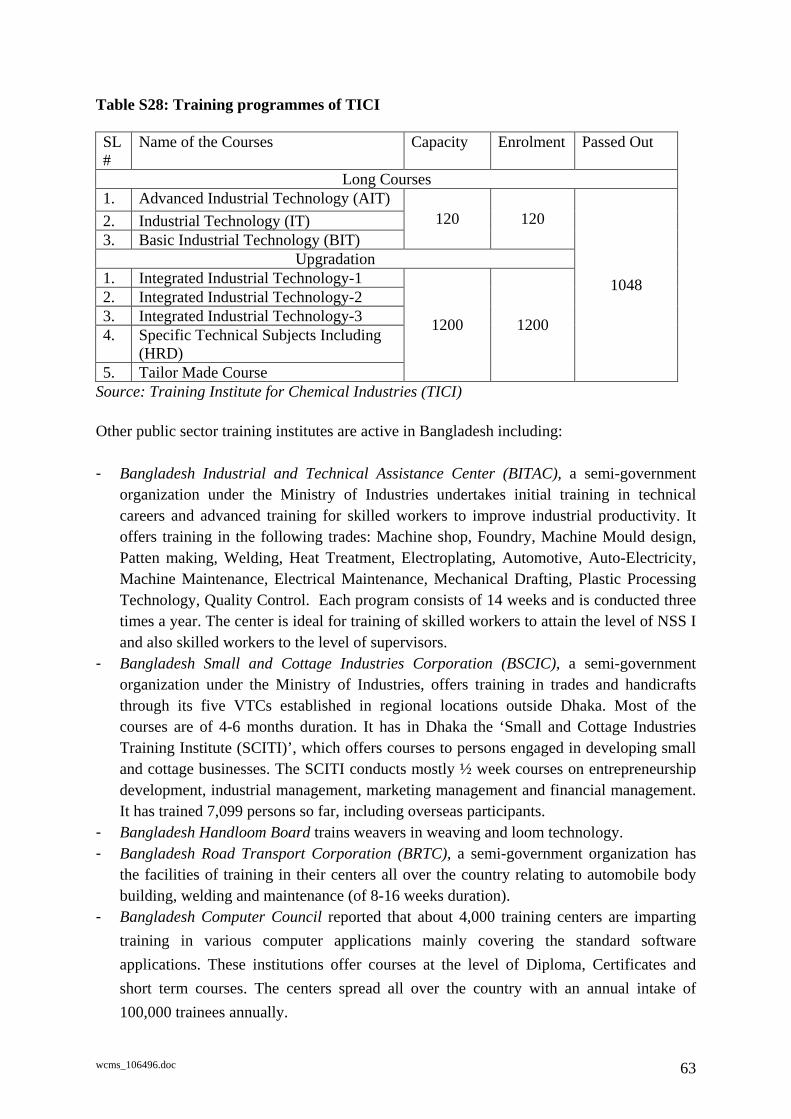
wcms_106496.doc 63
Table S28: Training programmes of TICI SL#
Name of the Courses Capacity Enrolment Passed Out
Long Courses 1. Advanced Industrial Technology (AIT) 2. Industrial Technology (IT) 3. Basic Industrial Technology (BIT)
120 120
Upgradation 1. Integrated Industrial Technology-1 2. Integrated Industrial Technology-2 3. Integrated Industrial Technology-3 4. Specific Technical Subjects Including
(HRD) 5. Tailor Made Course
1200 1200
1048
Source: Training Institute for Chemical Industries (TICI) Other public sector training institutes are active in Bangladesh including: - Bangladesh Industrial and Technical Assistance Center (BITAC), a semi-government
organization under the Ministry of Industries undertakes initial training in technical careers and advanced training for skilled workers to improve industrial productivity. It offers training in the following trades: Machine shop, Foundry, Machine Mould design, Patten making, Welding, Heat Treatment, Electroplating, Automotive, Auto-Electricity, Machine Maintenance, Electrical Maintenance, Mechanical Drafting, Plastic Processing Technology, Quality Control. Each program consists of 14 weeks and is conducted three times a year. The center is ideal for training of skilled workers to attain the level of NSS I and also skilled workers to the level of supervisors.
- Bangladesh Small and Cottage Industries Corporation (BSCIC), a semi-government organization under the Ministry of Industries, offers training in trades and handicrafts through its five VTCs established in regional locations outside Dhaka. Most of the courses are of 4-6 months duration. It has in Dhaka the ‘Small and Cottage Industries Training Institute (SCITI)’, which offers courses to persons engaged in developing small and cottage businesses. The SCITI conducts mostly ½ week courses on entrepreneurship development, industrial management, marketing management and financial management. It has trained 7,099 persons so far, including overseas participants.
- Bangladesh Handloom Board trains weavers in weaving and loom technology. - Bangladesh Road Transport Corporation (BRTC), a semi-government organization has
the facilities of training in their centers all over the country relating to automobile body building, welding and maintenance (of 8-16 weeks duration).
- Bangladesh Computer Council reported that about 4,000 training centers are imparting training in various computer applications mainly covering the standard software applications. These institutions offer courses at the level of Diploma, Certificates and short term courses. The centers spread all over the country with an annual intake of 100,000 trainees annually.
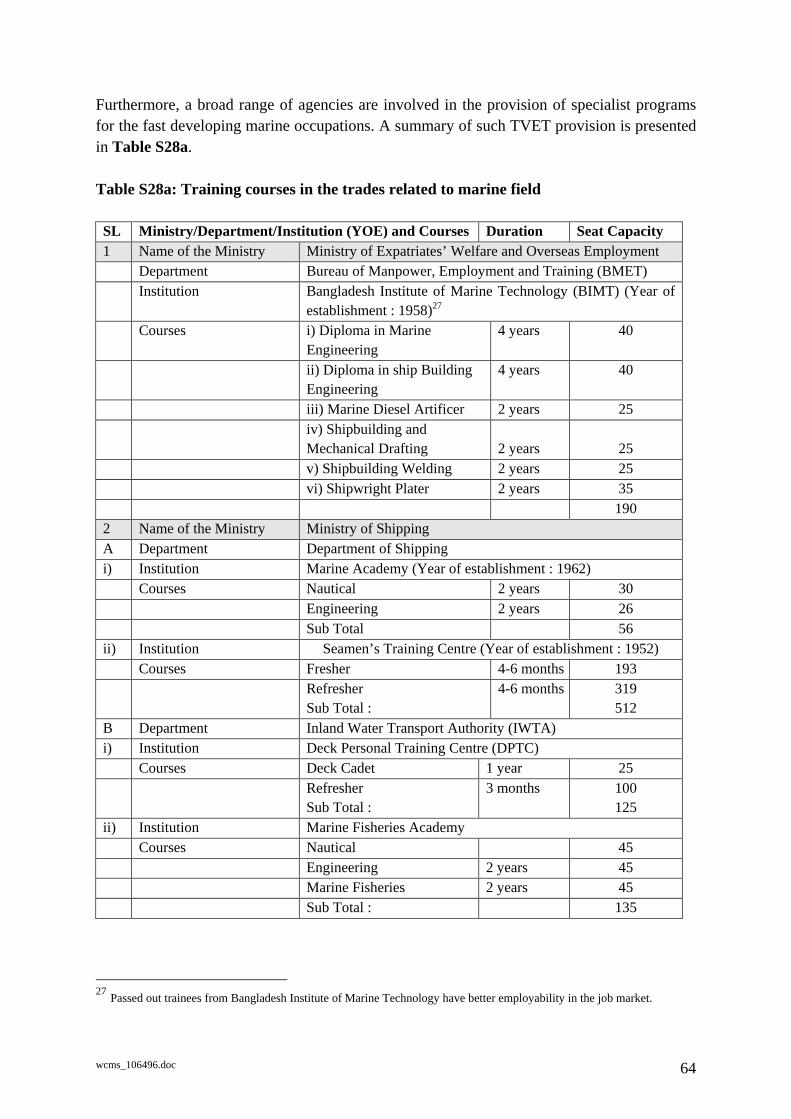
wcms_106496.doc 64
Furthermore, a broad range of agencies are involved in the provision of specialist programs for the fast developing marine occupations. A summary of such TVET provision is presented in Table S28a.
Table S28a: Training courses in the trades related to marine field SL Ministry/Department/Institution (YOE) and Courses Duration Seat Capacity 1 Name of the Ministry Ministry of Expatriates’ Welfare and Overseas Employment
Department Bureau of Manpower, Employment and Training (BMET) Institution Bangladesh Institute of Marine Technology (BIMT) (Year of
establishment : 1958)27 Courses i) Diploma in Marine
Engineering 4 years 40
ii) Diploma in ship Building Engineering
4 years 40
iii) Marine Diesel Artificer 2 years 25 iv) Shipbuilding and Mechanical Drafting
2 years
25
v) Shipbuilding Welding 2 years 25 vi) Shipwright Plater 2 years 35
190 2 Name of the Ministry Ministry of Shipping A Department Department of Shipping i) Institution Marine Academy (Year of establishment : 1962)
Courses Nautical 2 years 30 Engineering 2 years 26 Sub Total 56
ii) Institution Seamen’s Training Centre (Year of establishment : 1952) Courses Fresher 4-6 months 193
Refresher Sub Total :
4-6 months 319 512
B Department Inland Water Transport Authority (IWTA) i) Institution Deck Personal Training Centre (DPTC)
Courses Deck Cadet 1 year 25 Refresher Sub Total :
3 months 100 125
ii) Institution Marine Fisheries Academy Courses Nautical 45
Engineering 2 years 45 Marine Fisheries 2 years 45 Sub Total : 135
27 Passed out trainees from Bangladesh Institute of Marine Technology have better employability in the job market.
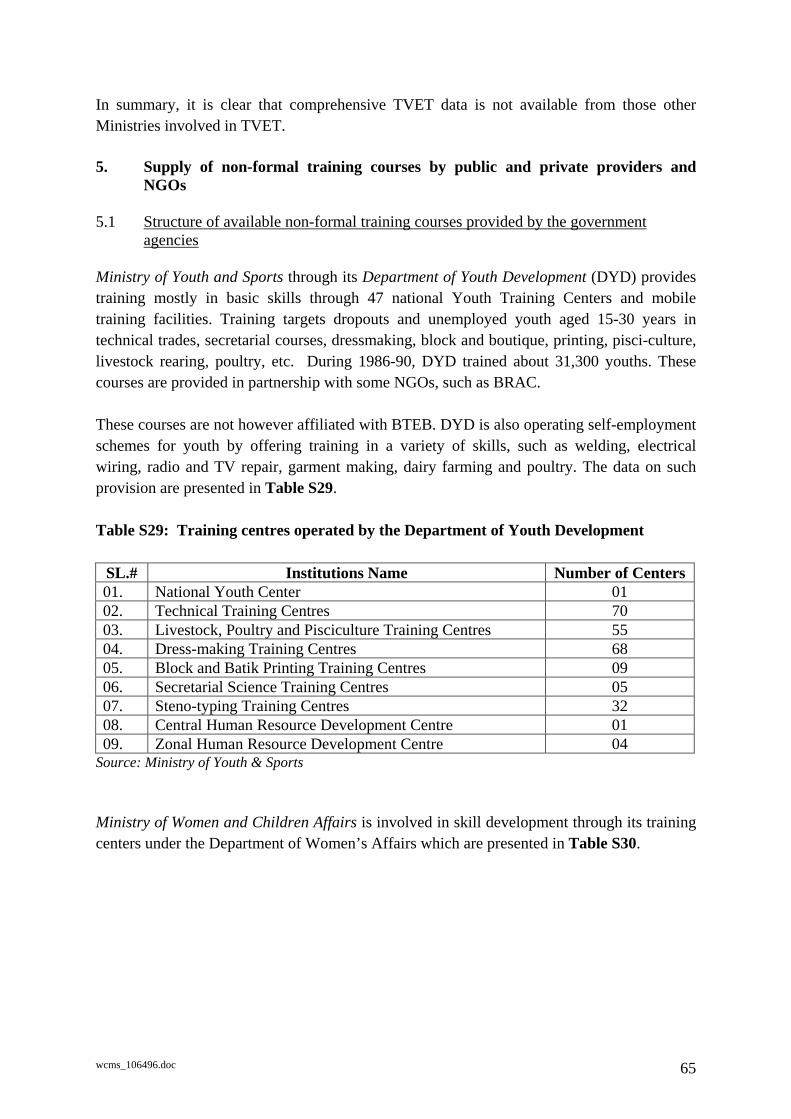
wcms_106496.doc 65
In summary, it is clear that comprehensive TVET data is not available from those other Ministries involved in TVET. 5. Supply of non-formal training courses by public and private providers and
NGOs 5.1 Structure of available non-formal training courses provided by the government
agencies
Ministry of Youth and Sports through its Department of Youth Development (DYD) provides training mostly in basic skills through 47 national Youth Training Centers and mobile training facilities. Training targets dropouts and unemployed youth aged 15-30 years in technical trades, secretarial courses, dressmaking, block and boutique, printing, pisci-culture, livestock rearing, poultry, etc. During 1986-90, DYD trained about 31,300 youths. These courses are provided in partnership with some NGOs, such as BRAC. These courses are not however affiliated with BTEB. DYD is also operating self-employment schemes for youth by offering training in a variety of skills, such as welding, electrical wiring, radio and TV repair, garment making, dairy farming and poultry. The data on such provision are presented in Table S29.
Table S29: Training centres operated by the Department of Youth Development
SL.# Institutions Name Number of Centers 01. National Youth Center 01 02. Technical Training Centres 70 03. Livestock, Poultry and Pisciculture Training Centres 55 04. Dress-making Training Centres 68 05. Block and Batik Printing Training Centres 09 06. Secretarial Science Training Centres 05 07. Steno-typing Training Centres 32 08. Central Human Resource Development Centre 01 09. Zonal Human Resource Development Centre 04
Source: Ministry of Youth & Sports
Ministry of Women and Children Affairs is involved in skill development through its training centers under the Department of Women’s Affairs which are presented in Table S30.
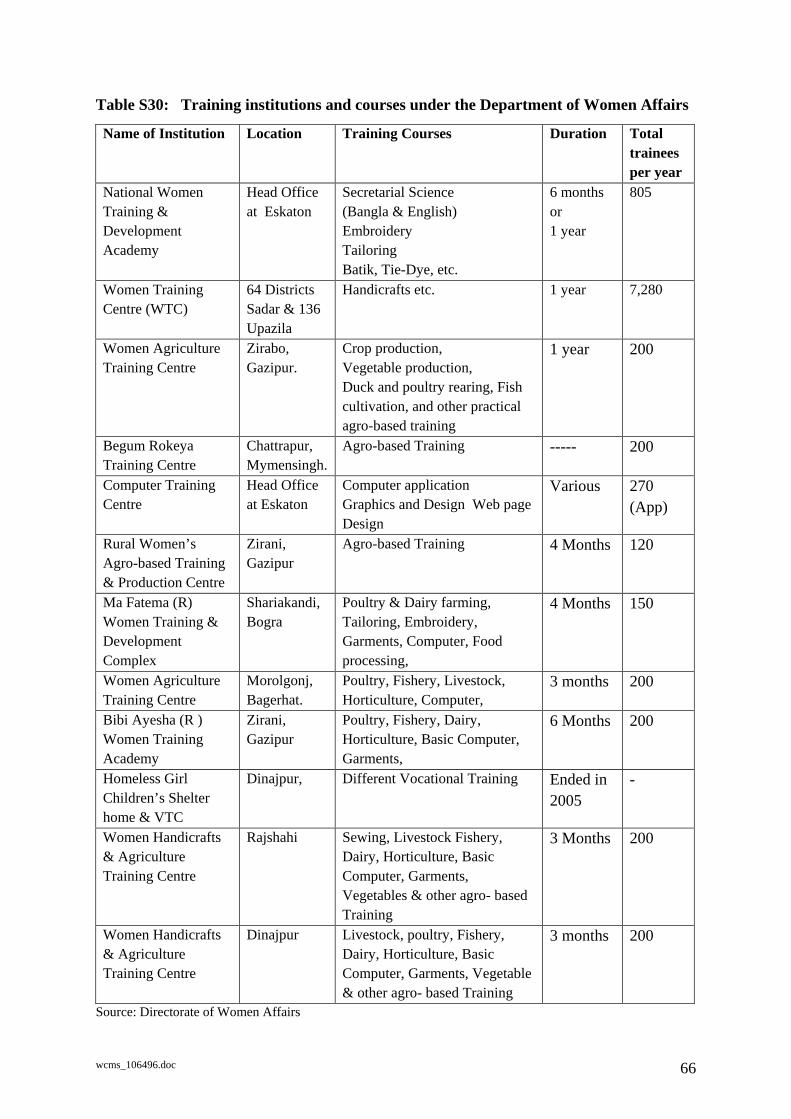
wcms_106496.doc 66
Table S30: Training institutions and courses under the Department of Women Affairs
Name of Institution Location Training Courses Duration Total trainees per year
National Women Training & Development Academy
Head Office at Eskaton
Secretarial Science (Bangla & English) Embroidery Tailoring Batik, Tie-Dye, etc.
6 months or 1 year
805
Women Training Centre (WTC)
64 Districts Sadar & 136 Upazila
Handicrafts etc. 1 year 7,280
Women Agriculture Training Centre
Zirabo, Gazipur.
Crop production, Vegetable production, Duck and poultry rearing, Fish cultivation, and other practical agro-based training
1 year 200
Begum Rokeya Training Centre
Chattrapur, Mymensingh.
Agro-based Training ----- 200
Computer Training Centre
Head Office at Eskaton
Computer application Graphics and Design Web page Design
Various 270 (App)
Rural Women’s Agro-based Training & Production Centre
Zirani, Gazipur
Agro-based Training 4 Months 120
Ma Fatema (R) Women Training & Development Complex
Shariakandi, Bogra
Poultry & Dairy farming, Tailoring, Embroidery, Garments, Computer, Food processing,
4 Months 150
Women Agriculture Training Centre
Morolgonj, Bagerhat.
Poultry, Fishery, Livestock, Horticulture, Computer,
3 months 200
Bibi Ayesha (R ) Women Training Academy
Zirani, Gazipur
Poultry, Fishery, Dairy, Horticulture, Basic Computer, Garments,
6 Months 200
Homeless Girl Children’s Shelter home & VTC
Dinajpur, Different Vocational Training Ended in 2005
-
Women Handicrafts & Agriculture Training Centre
Rajshahi Sewing, Livestock Fishery, Dairy, Horticulture, Basic Computer, Garments, Vegetables & other agro- based Training
3 Months 200
Women Handicrafts & Agriculture Training Centre
Dinajpur Livestock, poultry, Fishery, Dairy, Horticulture, Basic Computer, Garments, Vegetable & other agro- based Training
3 months 200
Source: Directorate of Women Affairs
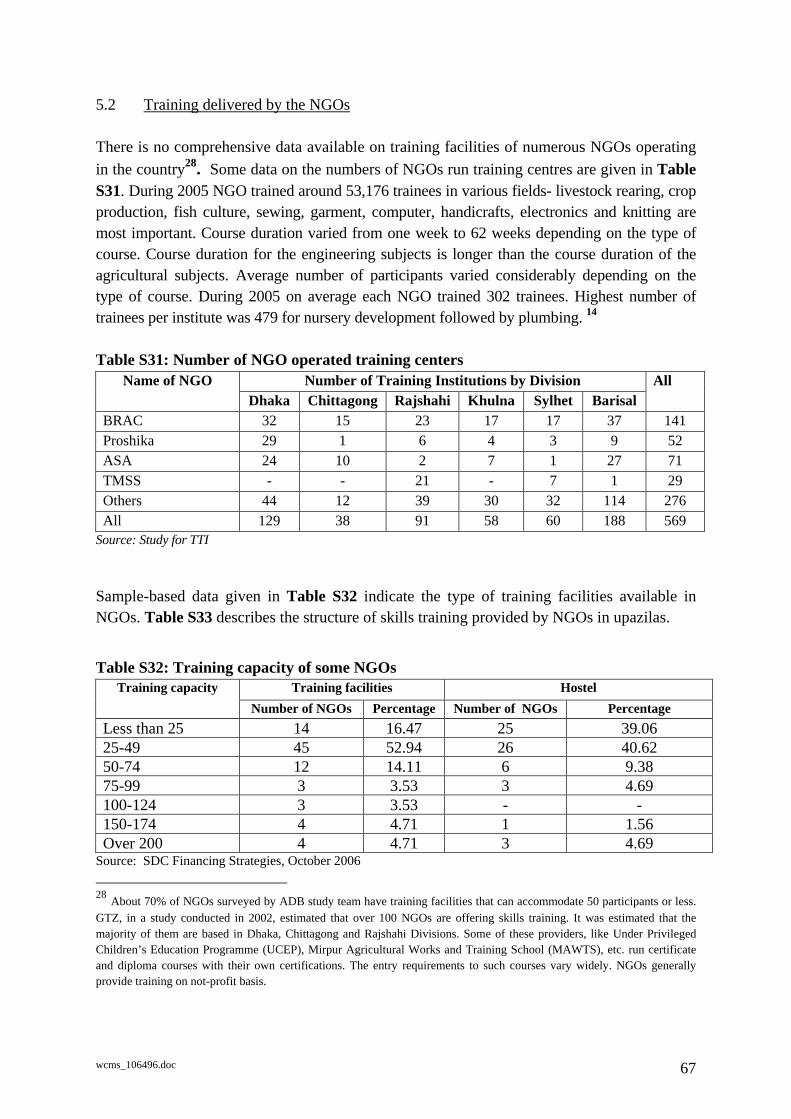
wcms_106496.doc 67
5.2 Training delivered by the NGOs
There is no comprehensive data available on training facilities of numerous NGOs operating in the country28. Some data on the numbers of NGOs run training centres are given in Table S31. During 2005 NGO trained around 53,176 trainees in various fields- livestock rearing, crop production, fish culture, sewing, garment, computer, handicrafts, electronics and knitting are most important. Course duration varied from one week to 62 weeks depending on the type of course. Course duration for the engineering subjects is longer than the course duration of the agricultural subjects. Average number of participants varied considerably depending on the type of course. During 2005 on average each NGO trained 302 trainees. Highest number of trainees per institute was 479 for nursery development followed by plumbing. 14
Table S31: Number of NGO operated training centers Number of Training Institutions by Division Name of NGO
Dhaka Chittagong Rajshahi Khulna Sylhet Barisal All
BRAC 32 15 23 17 17 37 141 Proshika 29 1 6 4 3 9 52 ASA 24 10 2 7 1 27 71 TMSS - - 21 - 7 1 29 Others 44 12 39 30 32 114 276 All 129 38 91 58 60 188 569
Source: Study for TTI
Sample-based data given in Table S32 indicate the type of training facilities available in NGOs. Table S33 describes the structure of skills training provided by NGOs in upazilas.
Table S32: Training capacity of some NGOs
Training facilities Hostel Training capacity Number of NGOs Percentage Number of NGOs Percentage
Less than 25 14 16.47 25 39.06 25-49 45 52.94 26 40.62 50-74 12 14.11 6 9.38 75-99 3 3.53 3 4.69 100-124 3 3.53 - - 150-174 4 4.71 1 1.56 Over 200 4 4.71 3 4.69
Source: SDC Financing Strategies, October 2006 28 About 70% of NGOs surveyed by ADB study team have training facilities that can accommodate 50 participants or less. GTZ, in a study conducted in 2002, estimated that over 100 NGOs are offering skills training. It was estimated that the majority of them are based in Dhaka, Chittagong and Rajshahi Divisions. Some of these providers, like Under Privileged Children’s Education Programme (UCEP), Mirpur Agricultural Works and Training School (MAWTS), etc. run certificate and diploma courses with their own certifications. The entry requirements to such courses vary widely. NGOs generally provide training on not-profit basis.
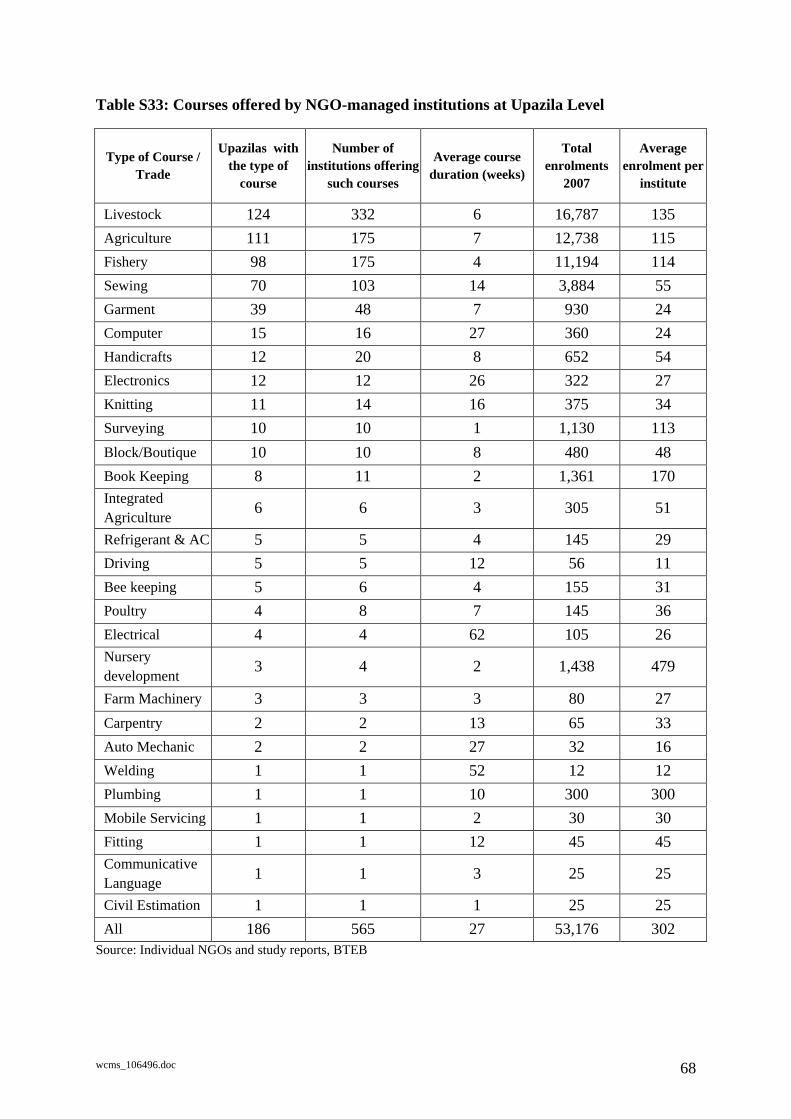
wcms_106496.doc 68
Table S33: Courses offered by NGO-managed institutions at Upazila Level
Type of Course / Trade
Upazilas with the type of
course
Number of institutions offering
such courses
Average course duration (weeks)
Total enrolments
2007
Average enrolment per
institute
Livestock 124 332 6 16,787 135 Agriculture 111 175 7 12,738 115 Fishery 98 175 4 11,194 114 Sewing 70 103 14 3,884 55 Garment 39 48 7 930 24 Computer 15 16 27 360 24 Handicrafts 12 20 8 652 54 Electronics 12 12 26 322 27 Knitting 11 14 16 375 34 Surveying 10 10 1 1,130 113 Block/Boutique 10 10 8 480 48 Book Keeping 8 11 2 1,361 170Integrated Agriculture 6 6 3 305 51
Refrigerant & AC 5 5 4 145 29Driving 5 5 12 56 11Bee keeping 5 6 4 155 31Poultry 4 8 7 145 36Electrical 4 4 62 105 26Nursery development 3 4 2 1,438 479
Farm Machinery 3 3 3 80 27Carpentry 2 2 13 65 33Auto Mechanic 2 2 27 32 16Welding 1 1 52 12 12Plumbing 1 1 10 300 300Mobile Servicing 1 1 2 30 30Fitting 1 1 12 45 45Communicative Language 1 1 3 25 25
Civil Estimation 1 1 1 25 25All 186 565 27 53,176 302
Source: Individual NGOs and study reports, BTEB
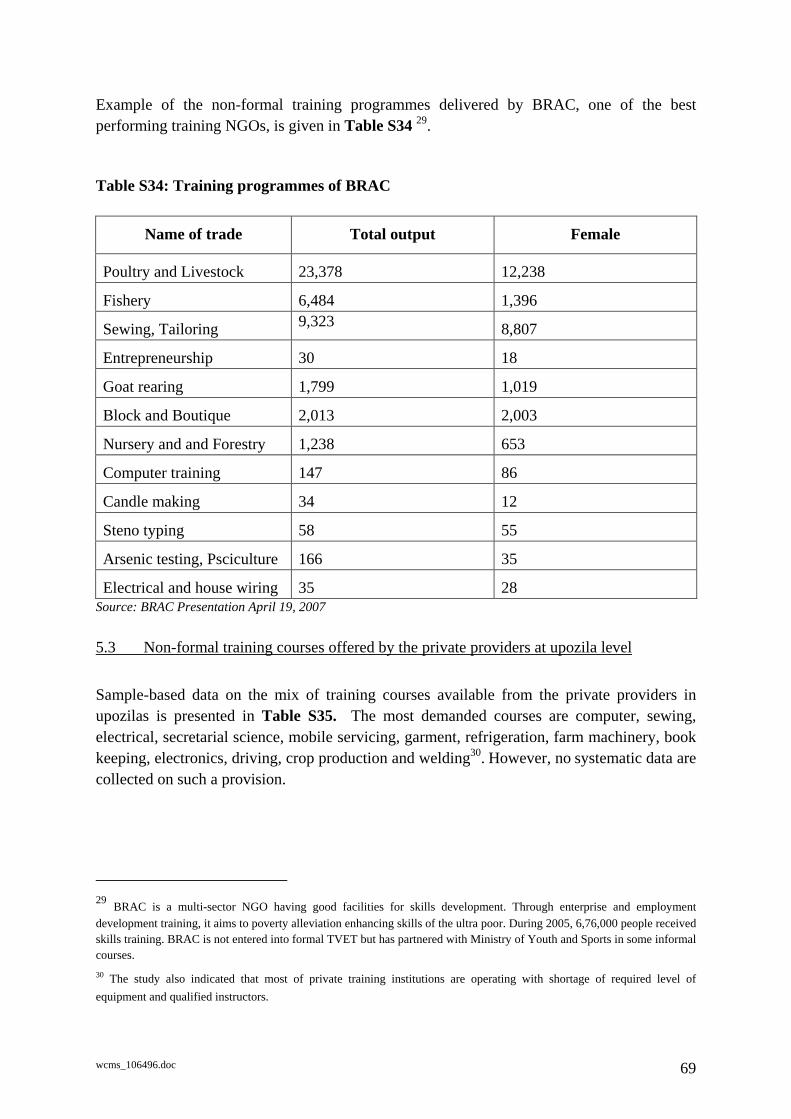
wcms_106496.doc 69
Example of the non-formal training programmes delivered by BRAC, one of the best performing training NGOs, is given in Table S34 29.
Table S34: Training programmes of BRAC
Name of trade Total output Female
Poultry and Livestock 23,378 12,238
Fishery 6,484 1,396
Sewing, Tailoring 9,323 8,807
Entrepreneurship 30 18
Goat rearing 1,799 1,019
Block and Boutique 2,013 2,003
Nursery and and Forestry 1,238 653
Computer training 147 86
Candle making 34 12
Steno typing 58 55
Arsenic testing, Psciculture 166 35
Electrical and house wiring 35 28 Source: BRAC Presentation April 19, 2007 5.3 Non-formal training courses offered by the private providers at upozila level
Sample-based data on the mix of training courses available from the private providers in upozilas is presented in Table S35. The most demanded courses are computer, sewing, electrical, secretarial science, mobile servicing, garment, refrigeration, farm machinery, book keeping, electronics, driving, crop production and welding30. However, no systematic data are collected on such a provision.
29 BRAC is a multi-sector NGO having good facilities for skills development. Through enterprise and employment development training, it aims to poverty alleviation enhancing skills of the ultra poor. During 2005, 6,76,000 people received skills training. BRAC is not entered into formal TVET but has partnered with Ministry of Youth and Sports in some informal courses. 30 The study also indicated that most of private training institutions are operating with shortage of required level of equipment and qualified instructors.
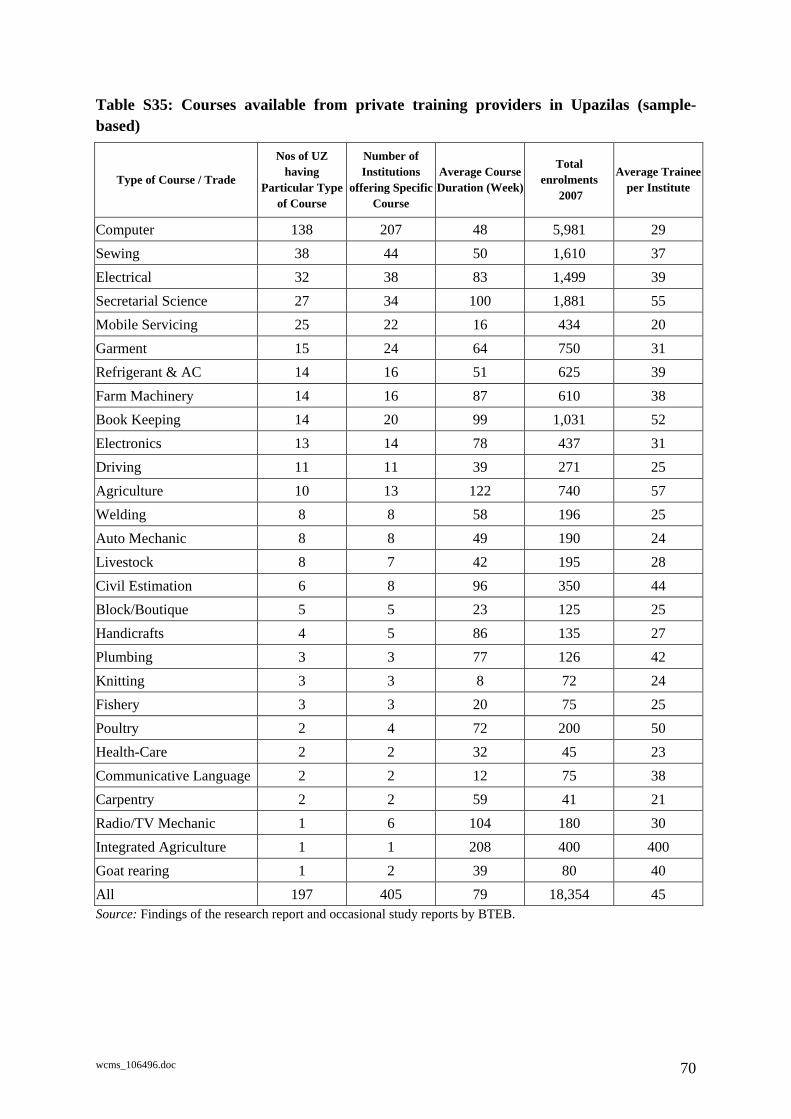
wcms_106496.doc 70
Table S35: Courses available from private training providers in Upazilas (sample-based)
Type of Course / Trade
Nos of UZ having
Particular Type of Course
Number of Institutions
offering Specific Course
Average Course Duration (Week)
Total enrolments
2007
Average Trainee per Institute
Computer 138 207 48 5,981 29 Sewing 38 44 50 1,610 37 Electrical 32 38 83 1,499 39 Secretarial Science 27 34 100 1,881 55 Mobile Servicing 25 22 16 434 20 Garment 15 24 64 750 31 Refrigerant & AC 14 16 51 625 39 Farm Machinery 14 16 87 610 38 Book Keeping 14 20 99 1,031 52 Electronics 13 14 78 437 31 Driving 11 11 39 271 25 Agriculture 10 13 122 740 57 Welding 8 8 58 196 25 Auto Mechanic 8 8 49 190 24 Livestock 8 7 42 195 28 Civil Estimation 6 8 96 350 44 Block/Boutique 5 5 23 125 25 Handicrafts 4 5 86 135 27 Plumbing 3 3 77 126 42 Knitting 3 3 8 72 24 Fishery 3 3 20 75 25 Poultry 2 4 72 200 50 Health-Care 2 2 32 45 23 Communicative Language 2 2 12 75 38 Carpentry 2 2 59 41 21 Radio/TV Mechanic 1 6 104 180 30 Integrated Agriculture 1 1 208 400 400 Goat rearing 1 2 39 80 40 All 197 405 79 18,354 45 Source: Findings of the research report and occasional study reports by BTEB.
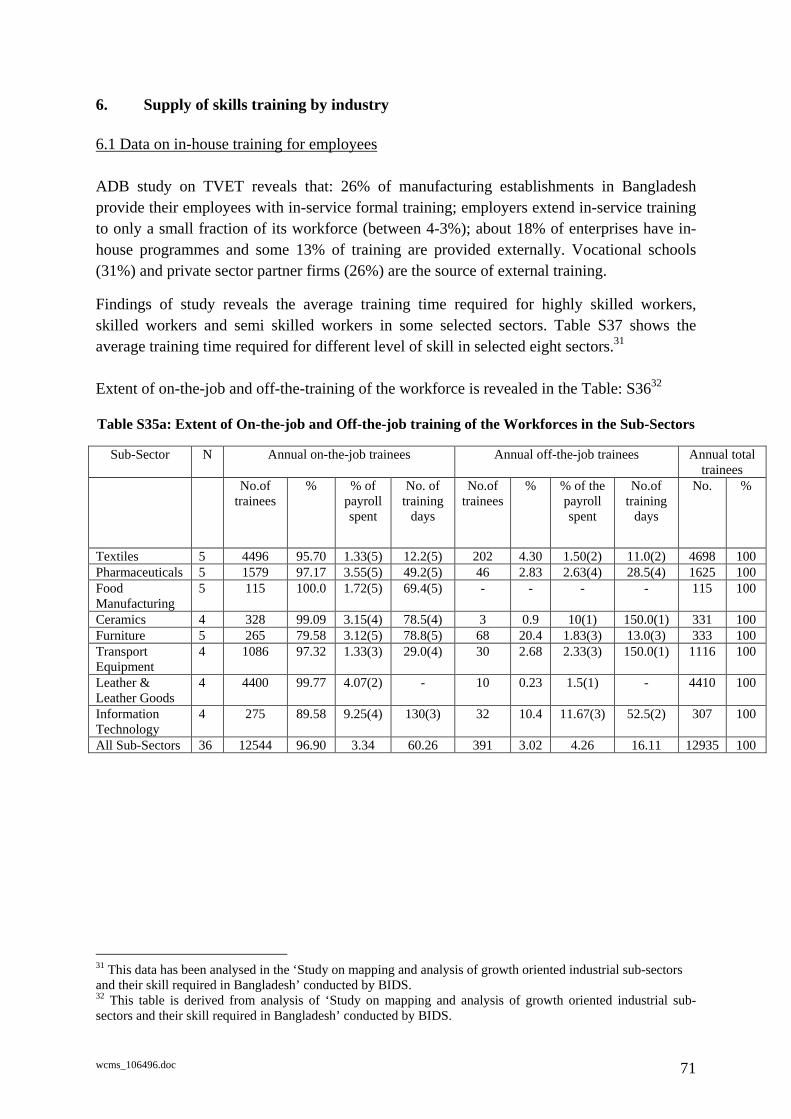
wcms_106496.doc 71
6. Supply of skills training by industry 6.1 Data on in-house training for employees
ADB study on TVET reveals that: 26% of manufacturing establishments in Bangladesh provide their employees with in-service formal training; employers extend in-service training to only a small fraction of its workforce (between 4-3%); about 18% of enterprises have in-house programmes and some 13% of training are provided externally. Vocational schools (31%) and private sector partner firms (26%) are the source of external training.
Findings of study reveals the average training time required for highly skilled workers, skilled workers and semi skilled workers in some selected sectors. Table S37 shows the average training time required for different level of skill in selected eight sectors.31
Extent of on-the-job and off-the-training of the workforce is revealed in the Table: S3632
Table S35a: Extent of On-the-job and Off-the-job training of the Workforces in the Sub-Sectors
Sub-Sector N Annual on-the-job trainees Annual off-the-job trainees Annual total trainees
No.of trainees
% % of payroll spent
No. of training
days
No.of trainees
% % of the payroll spent
No.of training
days
No. %
Textiles 5 4496 95.70 1.33(5) 12.2(5) 202 4.30 1.50(2) 11.0(2) 4698 100 Pharmaceuticals 5 1579 97.17 3.55(5) 49.2(5) 46 2.83 2.63(4) 28.5(4) 1625 100 Food Manufacturing
5 115 100.0 1.72(5) 69.4(5) - - - - 115 100
Ceramics 4 328 99.09 3.15(4) 78.5(4) 3 0.9 10(1) 150.0(1) 331 100 Furniture 5 265 79.58 3.12(5) 78.8(5) 68 20.4 1.83(3) 13.0(3) 333 100 Transport Equipment
4 1086 97.32 1.33(3) 29.0(4) 30 2.68 2.33(3) 150.0(1) 1116 100
Leather & Leather Goods
4 4400 99.77 4.07(2) - 10 0.23 1.5(1) - 4410 100
Information Technology
4 275 89.58 9.25(4) 130(3) 32 10.4 11.67(3) 52.5(2) 307 100
All Sub-Sectors 36 12544 96.90 3.34 60.26 391 3.02 4.26 16.11 12935 100
31 This data has been analysed in the ‘Study on mapping and analysis of growth oriented industrial sub-sectors and their skill required in Bangladesh’ conducted by BIDS. 32 This table is derived from analysis of ‘Study on mapping and analysis of growth oriented industrial sub-sectors and their skill required in Bangladesh’ conducted by BIDS.
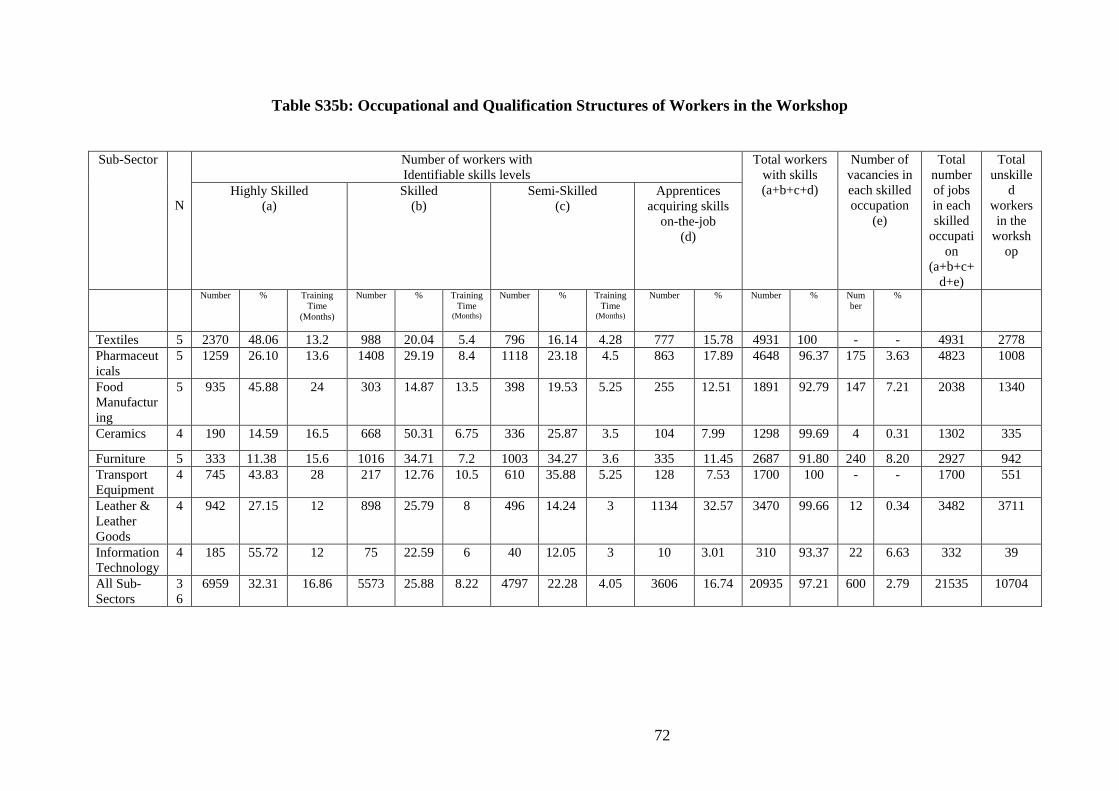
72
Table S35b: Occupational and Qualification Structures of Workers in the Workshop
Number of workers withIdentifiable skills levels
Sub-Sector
NHighly Skilled
(a)Skilled
(b)Semi-Skilled
(c)Apprentices
acquiring skillson-the-job
(d)
Total workerswith skills(a+b+c+d)
Number ofvacancies ineach skilledoccupation
(e)
Totalnumberof jobsin eachskilled
occupation
(a+b+c+d+e)
Totalunskille
dworkersin the
workshop
Number % TrainingTime
(Months)
Number % TrainingTime
(Months)
Number % TrainingTime
(Months)
Number % Number % Number
%
Textiles 5 2370 48.06 13.2 988 20.04 5.4 796 16.14 4.28 777 15.78 4931 100 - - 4931 2778Pharmaceuticals
5 1259 26.10 13.6 1408 29.19 8.4 1118 23.18 4.5 863 17.89 4648 96.37 175 3.63 4823 1008
FoodManufacturing
5 935 45.88 24 303 14.87 13.5 398 19.53 5.25 255 12.51 1891 92.79 147 7.21 2038 1340
Ceramics 4 190 14.59 16.5 668 50.31 6.75 336 25.87 3.5 104 7.99 1298 99.69 4 0.31 1302 335
Furniture 5 333 11.38 15.6 1016 34.71 7.2 1003 34.27 3.6 335 11.45 2687 91.80 240 8.20 2927 942TransportEquipment
4 745 43.83 28 217 12.76 10.5 610 35.88 5.25 128 7.53 1700 100 - - 1700 551
Leather &LeatherGoods
4 942 27.15 12 898 25.79 8 496 14.24 3 1134 32.57 3470 99.66 12 0.34 3482 3711
InformationTechnology
4 185 55.72 12 75 22.59 6 40 12.05 3 10 3.01 310 93.37 22 6.63 332 39
All Sub-Sectors
36
6959 32.31 16.86 5573 25.88 8.22 4797 22.28 4.05 3606 16.74 20935 97.21 600 2.79 21535 10704
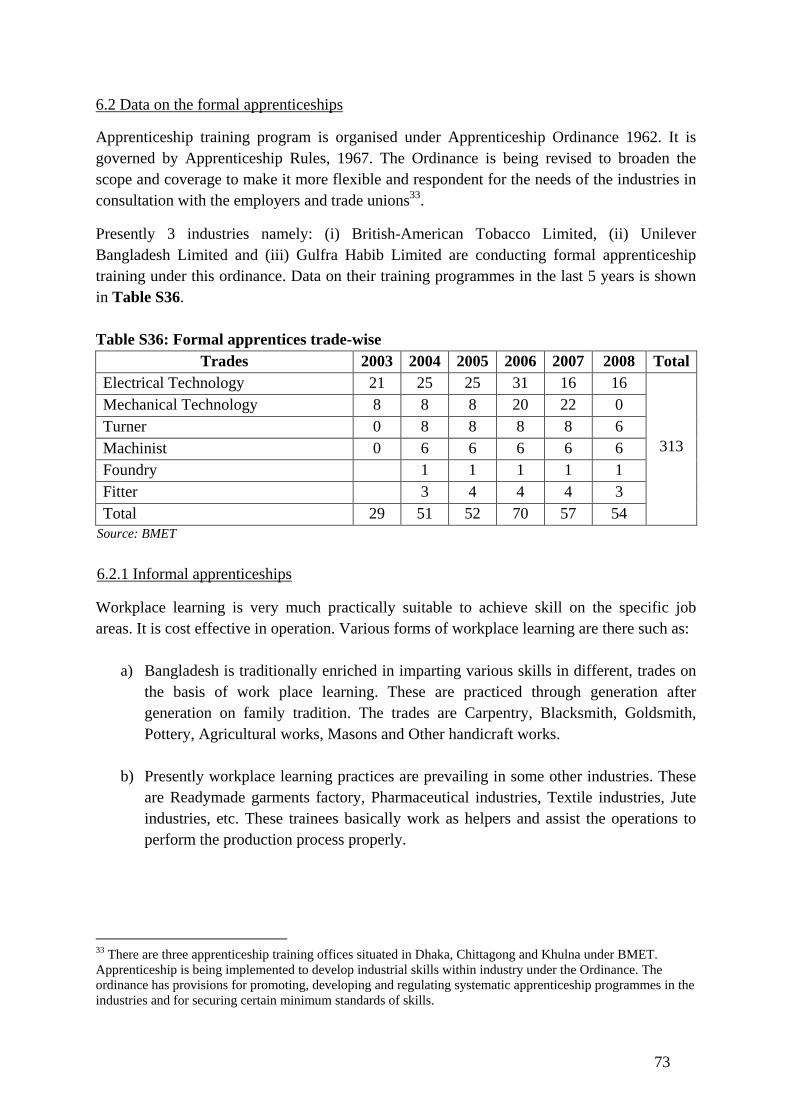
73
6.2 Data on the formal apprenticeships
Apprenticeship training program is organised under Apprenticeship Ordinance 1962. It is governed by Apprenticeship Rules, 1967. The Ordinance is being revised to broaden the scope and coverage to make it more flexible and respondent for the needs of the industries in consultation with the employers and trade unions33.
Presently 3 industries namely: (i) British-American Tobacco Limited, (ii) Unilever Bangladesh Limited and (iii) Gulfra Habib Limited are conducting formal apprenticeship training under this ordinance. Data on their training programmes in the last 5 years is shown in Table S36.
Table S36: Formal apprentices trade-wise Trades 2003 2004 2005 2006 2007 2008 Total
Electrical Technology 21 25 25 31 16 16 Mechanical Technology 8 8 8 20 22 0 Turner 0 8 8 8 8 6 Machinist 0 6 6 6 6 6 Foundry 1 1 1 1 1 Fitter 3 4 4 4 3 Total 29 51 52 70 57 54
313
Source: BMET 6.2.1 Informal apprenticeships
Workplace learning is very much practically suitable to achieve skill on the specific job areas. It is cost effective in operation. Various forms of workplace learning are there such as:
a) Bangladesh is traditionally enriched in imparting various skills in different, trades on the basis of work place learning. These are practiced through generation after generation on family tradition. The trades are Carpentry, Blacksmith, Goldsmith, Pottery, Agricultural works, Masons and Other handicraft works.
b) Presently workplace learning practices are prevailing in some other industries. These
are Readymade garments factory, Pharmaceutical industries, Textile industries, Jute industries, etc. These trainees basically work as helpers and assist the operations to perform the production process properly.
33 There are three apprenticeship training offices situated in Dhaka, Chittagong and Khulna under BMET. Apprenticeship is being implemented to develop industrial skills within industry under the Ordinance. The ordinance has provisions for promoting, developing and regulating systematic apprenticeship programmes in the industries and for securing certain minimum standards of skills.

wcms_106496.doc 74
6.3 Training institutions operated by other employer-related agencies
Several employers’ associations have their training establishments. Bangladesh Garments Manufacturers and Exporters Association (BGMEA) runs the BGMEA Institute of Fashion and Technology (BIFT) which is a fully self-financed training institute. The Chittagong Skill Development Centre (CSDC) is the employer-led institution and is a role model of industry-government cooperation. It provides technical training in different industrial trades. CSDC offers training courses for the in-service trainees and operated on the basis of requirement of the industries. The courses are operated on i) Telecommunications, ii) Executive leaderships and iii) Ready made garments. The courses are summarized below:
(1) TELECOMMUNICATIONS
• GSM Fundamentals • Infrastructure, site acquisition & civil works - level 1 and Level 2 • Fiber Optic Transmission– Level 1 and Level 2 • RBS & Microwave – Level 1 and Level 2 • Base Transceiver Station (BTS) Installation • Basic Microwave Propagation & Microwave Link Installation
(2) EXECUTIVE LEADERSHIP
• Project management Professional (PMP) Certification • Effective Leadership for Organizational Excellence • Managerial effectiveness AND leadership skills • Effective Performance Management • Management of Creativity & Innovation • Communication & Presentation Skills • Negotiation Skills • Improving Service Quality • Managing Organizational Change • Supervisory, Managerial & Leadership Skills • Team Building • Effective Decision Making & Problem Solving Skills • Interpersonal Skills
(3) READY-MADE GARMENTS
• Garments Machine Maintenance • Garments Quality Control (QC) • Preventive maintenance • RMG social and environmental compliance
The Dhaka Chamber of Commerce and Industry (DCCI) has set up training centre to cater to the needs of the professional training for industrial management and productivity improvement. DCCI Business Institute34 provides training on business and productivity. The
34 DCCI Business Institute is the training institute established by Dhaka Chamber of Commerce and Industries.
wcms_106496.doc 75
Institute is an affiliate of ITC- UNCTD, WTO, Geneva. The major courses of DCCI are as follows:
• Shipping Procedures for Export & Import • Effective Office Management • Effective Negotiation Skills • Human Resource Development (HRD) • Proper L/C Procedures for Export & Import Operations • Quality Management & ISO 9000 • Project Management • Quality Management System for Productivity Improvement • Managing Finance • Garments Merchandising: Operations & Management • How to Develop Distribution Network for Marketing of Products • Import and Indenting Procedures • Reduction of Wastage and measures to increase Productivity in RMG • Rules & Procedures of VAT & Income Tax • Tour Management for Tours Operators • Material Planning and Inventory Control • Effective Selling Skills • How to Operate Import & Export Business Successfully • Garments Merchandising: Operations & Management • How to develop Distribution Network for Marketing of Products
Bangladesh Association of International Recruiting Agencies (BAIRA) has training facilities. The member recruiting agencies have their training centres to provide some refresher training for the selected candidates for overseas market35. Presently about 50 recruiting agencies have their own training centres but only 10-15 agencies maintain the minimum standard of training. Most of the training is of very short duration and provides mostly skills upgrading for the selected workers for the overseas employment. About 15 recruiting agencies run specialized training centres in collaboration with foreign employers, to cater to the foreign employment demands (mostly with the employer from Singapore). The trades in which training is provided are - Industrial Carpenter, Welding (with TIG, MIG and 6G), Rod binder, Marine fitter, Shutterer (Steel fixer), Pipe fitter, etc. Duration of courses spans 3-6 months. Annual output at these training centres is about 30,000-50,000 a year. 7. Number of skilled workers returning from overseas employment Overseas employment market is a short term contractual in nature. All the contracts are 2-3 years in duration. After completion of the tenure most of the workers return home acquiring technical skill in a trade. There is no data available on returnee skilled migrants at all. But this data would be very useful on analysis of the supply-demand dimensions for labour markets.
35 Government has made it mandatory for the recruiting agencies concerned with overseas employment to have training centres of their own as a condition for renewing licenses.
wcms_106496.doc 76
CHAPTER III: DATA ON EVIDENCE THAT SUPPLY MATCHES DEMAND IN TVET
1. Demand-supply ratios for selected occupations
Steering the linkages between the training and the employment market require data on the demand-supply ratios for particular occupations and qualifications. Such ratios can be produced through direct comparisons between the structures of TVET supply and the occupational and qualification structures of the economy. It is an important form of TVET related data that is able to link the data on supply with the data on demand. Such data should compare the total numbers of high-skilled and skilled employees working in the economy with the numbers of TVET graduates produced annually at higher occupational levels in each major occupation. Collecting such data on semi-skilled workers or jobs with low qualification requirements is not always worthwhile because of the high labour turnover that often exists in such trades and for such workers. The major assumption underpinning this type of data is that the TVET graduates having undertaken long (and costly) education and training will be pursuing working careers in the trades in which they had been trained or at least in some neighboring trades where the acquired skills could be used. The national data of this type may however be difficult to work out and maintain, while the regional or district-level balances of the supply and demand on major skilled trade would be rather useful.
The data on the supply side per trade from both public and private providers is mostly available in Bangladesh. It means that it is quite possible to know how many high-skilled TVET graduates will be produced every year in the mass trades such as welders, electricians, fitters, etc. at the high skills levels. If it also becomes known how many jobs in the economy require skilled and high-skilled welders, electricians and fitters, etc., it would be possible to make judgments on whether the annual supply of skilled workers reflects the (potential) demand fairly. From experience, it may be recommended that the overall number of skilled and high-skilled workers produced in a certain trade each year should not exceed 10% of the total number of skilled jobs in this occupation. Collecting such data for the Diploma level occupations could be a lot easier because there are fewer people who will be required in the economy as for instance, electronics technicians and the capacity to produce electronics technicians is rather limited in the country. The risk however is that technicians can easily accept a job of a skilled worker, if need be, while the probability is perhaps less than skilled workers will be employed as technicians. However, in those sectors where labour turnover is more than 10% per year, more accurate data on actual vacancies should be used.
As mentioned above, such comparisons are most practical at the regional, district-wise and local level where the data can be easily collected and interpreted. Such comparisons should take account of migration of skilled workers in each trade, which in case of Bangladesh can make an important impact. Table SMD01 (supply-matching-demand) outlines the type of data required.
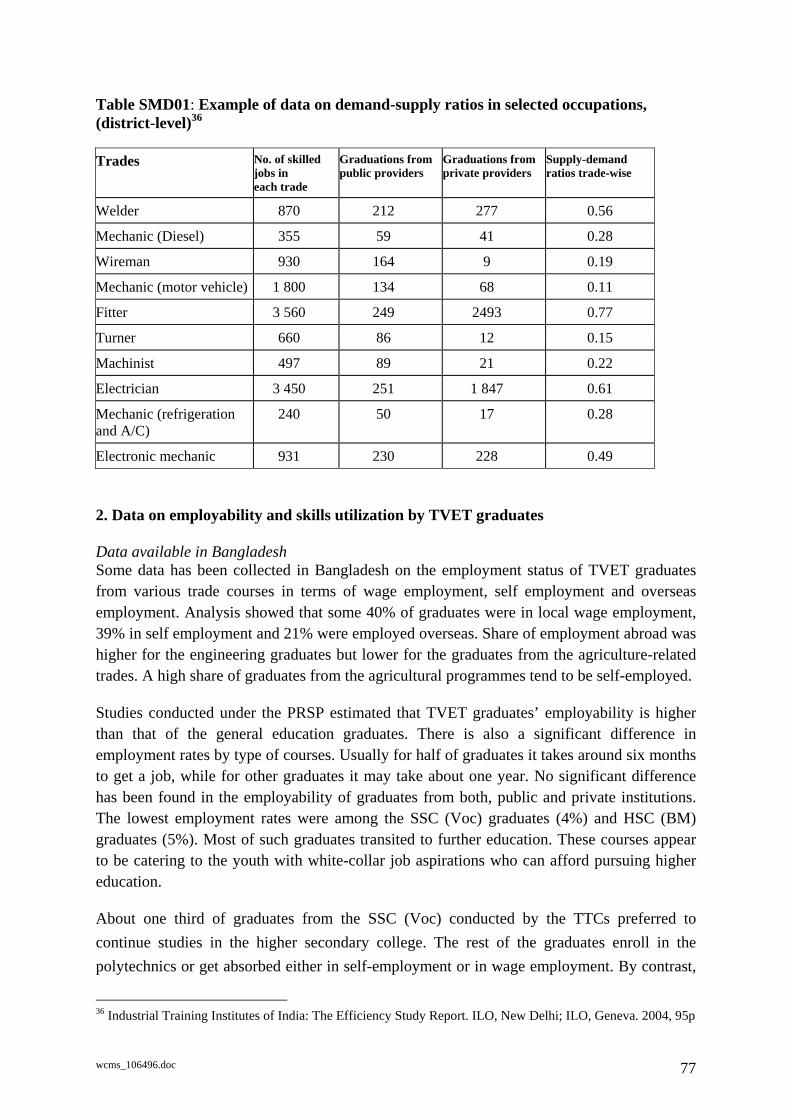
wcms_106496.doc 77
Table SMD01: Example of data on demand-supply ratios in selected occupations, (district-level)36
Trades No. of skilled jobs ineach trade
Graduations frompublic providers
Graduations fromprivate providers
Supply-demand ratios trade-wise
Welder 870 212 277 0.56
Mechanic (Diesel) 355 59 41 0.28
Wireman 930 164 9 0.19
Mechanic (motor vehicle) 1 800 134 68 0.11
Fitter 3 560 249 2493 0.77
Turner 660 86 12 0.15
Machinist 497 89 21 0.22
Electrician 3 450 251 1 847 0.61
Mechanic (refrigeration and A/C)
240 50 17 0.28
Electronic mechanic 931 230 228 0.49
2. Data on employability and skills utilization by TVET graduates Data available in Bangladesh Some data has been collected in Bangladesh on the employment status of TVET graduates from various trade courses in terms of wage employment, self employment and overseas employment. Analysis showed that some 40% of graduates were in local wage employment, 39% in self employment and 21% were employed overseas. Share of employment abroad was higher for the engineering graduates but lower for the graduates from the agriculture-related trades. A high share of graduates from the agricultural programmes tend to be self-employed.
Studies conducted under the PRSP estimated that TVET graduates’ employability is higher than that of the general education graduates. There is also a significant difference in employment rates by type of courses. Usually for half of graduates it takes around six months to get a job, while for other graduates it may take about one year. No significant difference has been found in the employability of graduates from both, public and private institutions. The lowest employment rates were among the SSC (Voc) graduates (4%) and HSC (BM) graduates (5%). Most of such graduates transited to further education. These courses appear to be catering to the youth with white-collar job aspirations who can afford pursuing higher education.
About one third of graduates from the SSC (Voc) conducted by the TTCs preferred to continue studies in the higher secondary college. The rest of the graduates enroll in the polytechnics or get absorbed either in self-employment or in wage employment. By contrast,
36 Industrial Training Institutes of India: The Efficiency Study Report. ILO, New Delhi; ILO, Geneva. 2004, 95p
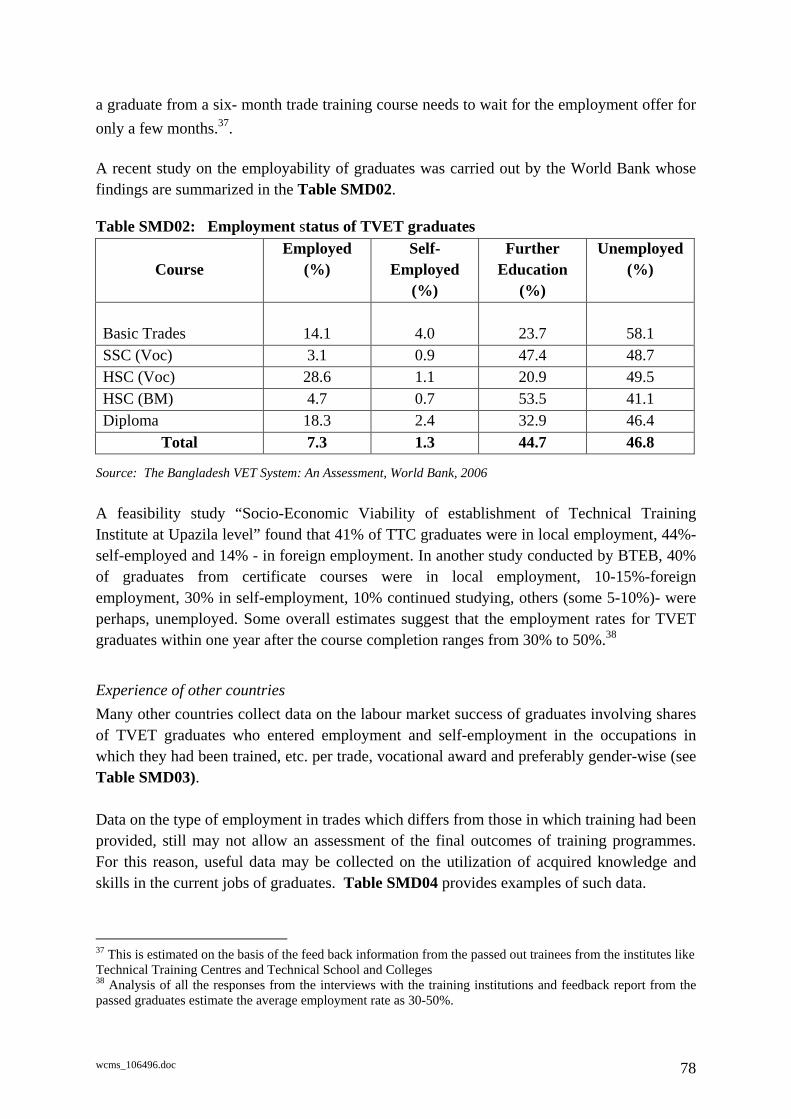
wcms_106496.doc 78
a graduate from a six- month trade training course needs to wait for the employment offer for only a few months.37.
A recent study on the employability of graduates was carried out by the World Bank whose findings are summarized in the Table SMD02.
Table SMD02: Employment status of TVET graduates
Source: The Bangladesh VET System: An Assessment, World Bank, 2006 A feasibility study “Socio-Economic Viability of establishment of Technical Training Institute at Upazila level” found that 41% of TTC graduates were in local employment, 44%-self-employed and 14% - in foreign employment. In another study conducted by BTEB, 40% of graduates from certificate courses were in local employment, 10-15%-foreign employment, 30% in self-employment, 10% continued studying, others (some 5-10%)- were perhaps, unemployed. Some overall estimates suggest that the employment rates for TVET graduates within one year after the course completion ranges from 30% to 50%.38
Experience of other countries Many other countries collect data on the labour market success of graduates involving shares of TVET graduates who entered employment and self-employment in the occupations in which they had been trained, etc. per trade, vocational award and preferably gender-wise (see Table SMD03).
Data on the type of employment in trades which differs from those in which training had been provided, still may not allow an assessment of the final outcomes of training programmes. For this reason, useful data may be collected on the utilization of acquired knowledge and skills in the current jobs of graduates. Table SMD04 provides examples of such data.
37 This is estimated on the basis of the feed back information from the passed out trainees from the institutes like Technical Training Centres and Technical School and Colleges 38 Analysis of all the responses from the interviews with the training institutions and feedback report from the passed graduates estimate the average employment rate as 30-50%.
Course Employed
(%) Self-
Employed (%)
Further Education
(%)
Unemployed (%)
Basic Trades 14.1 4.0 23.7 58.1 SSC (Voc) 3.1 0.9 47.4 48.7 HSC (Voc) 28.6 1.1 20.9 49.5 HSC (BM) 4.7 0.7 53.5 41.1 Diploma 18.3 2.4 32.9 46.4
Total 7.3 1.3 44.7 46.8
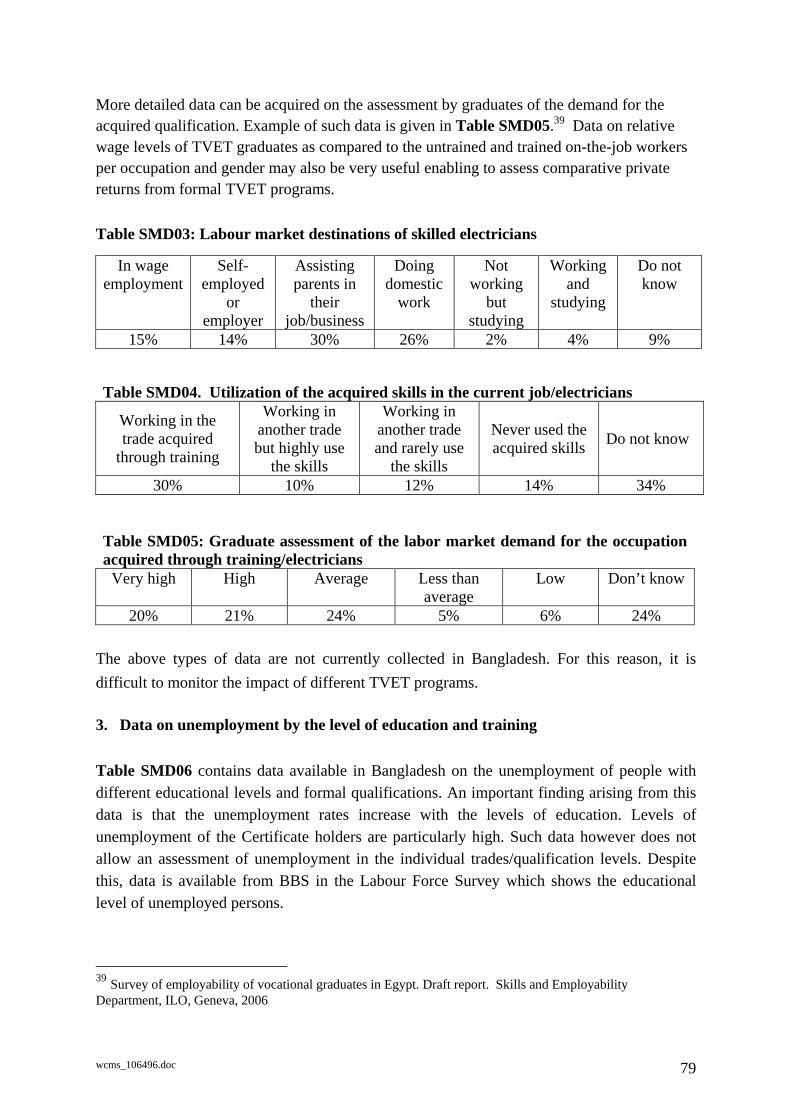
wcms_106496.doc 79
More detailed data can be acquired on the assessment by graduates of the demand for the acquired qualification. Example of such data is given in Table SMD05.39 Data on relative wage levels of TVET graduates as compared to the untrained and trained on-the-job workers per occupation and gender may also be very useful enabling to assess comparative private returns from formal TVET programs. Table SMD03: Labour market destinations of skilled electricians
Table SMD04. Utilization of the acquired skills in the current job/electricians
Working in the trade acquired
through training
Working in another trade but highly use
the skills
Working in another trade and rarely use
the skills
Never used the acquired skills Do not know
30% 10% 12% 14% 34%
Table SMD05: Graduate assessment of the labor market demand for the occupation acquired through training/electricians
Very high High Average Less than average
Low Don’t know
20% 21% 24% 5% 6% 24%
The above types of data are not currently collected in Bangladesh. For this reason, it is difficult to monitor the impact of different TVET programs. 3. Data on unemployment by the level of education and training
Table SMD06 contains data available in Bangladesh on the unemployment of people with different educational levels and formal qualifications. An important finding arising from this data is that the unemployment rates increase with the levels of education. Levels of unemployment of the Certificate holders are particularly high. Such data however does not allow an assessment of unemployment in the individual trades/qualification levels. Despite this, data is available from BBS in the Labour Force Survey which shows the educational level of unemployed persons.
39 Survey of employability of vocational graduates in Egypt. Draft report. Skills and Employability Department, ILO, Geneva, 2006
In wage employment
Self-employed
or employer
Assisting parents in
their job/business
Doing domestic
work
Not working
but studying
Working and
studying
Do not know
15% 14% 30% 26% 2% 4% 9%
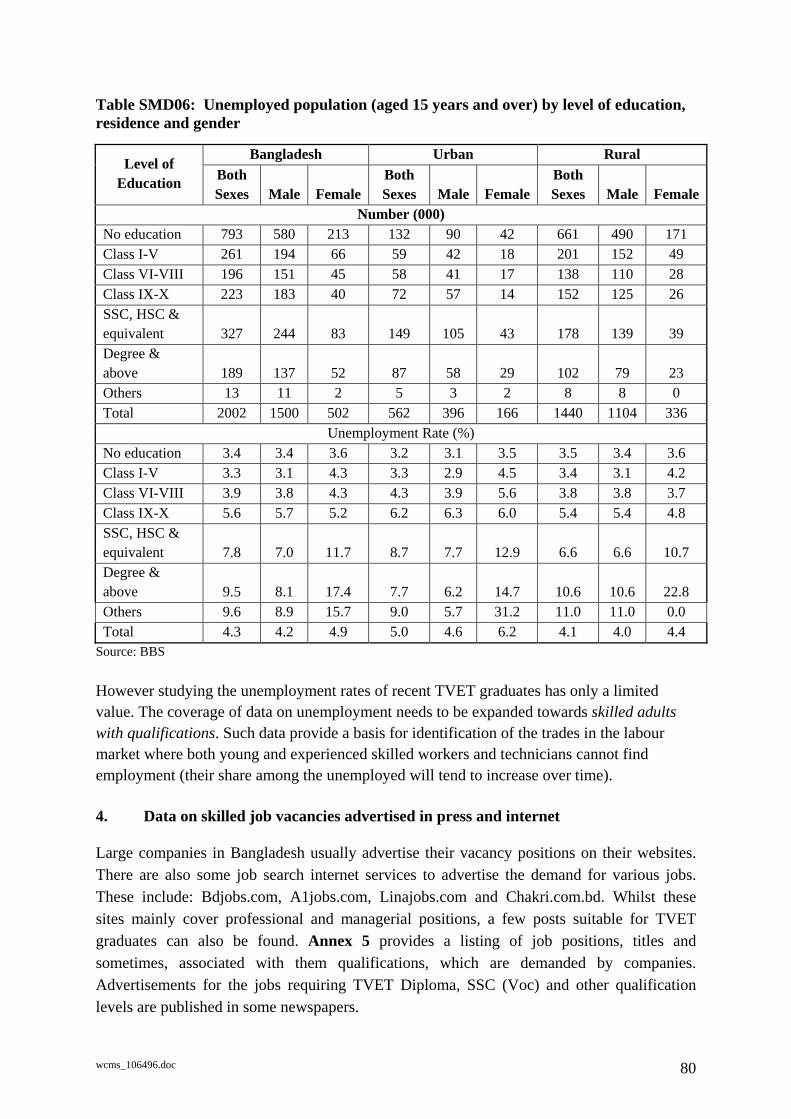
wcms_106496.doc 80
Table SMD06: Unemployed population (aged 15 years and over) by level of education, residence and gender
Bangladesh Urban Rural Level of Education Both
Sexes Male Female Both Sexes Male Female
Both Sexes Male Female
Number (000) No education 793 580 213 132 90 42 661 490 171 Class I-V 261 194 66 59 42 18 201 152 49 Class VI-VIII 196 151 45 58 41 17 138 110 28 Class IX-X 223 183 40 72 57 14 152 125 26 SSC, HSC & equivalent 327 244 83 149 105 43 178 139 39 Degree & above 189 137 52 87 58 29 102 79 23 Others 13 11 2 5 3 2 8 8 0 Total 2002 1500 502 562 396 166 1440 1104 336
Unemployment Rate (%) No education 3.4 3.4 3.6 3.2 3.1 3.5 3.5 3.4 3.6 Class I-V 3.3 3.1 4.3 3.3 2.9 4.5 3.4 3.1 4.2 Class VI-VIII 3.9 3.8 4.3 4.3 3.9 5.6 3.8 3.8 3.7 Class IX-X 5.6 5.7 5.2 6.2 6.3 6.0 5.4 5.4 4.8 SSC, HSC & equivalent 7.8 7.0 11.7 8.7 7.7 12.9 6.6 6.6 10.7 Degree & above 9.5 8.1 17.4 7.7 6.2 14.7 10.6 10.6 22.8 Others 9.6 8.9 15.7 9.0 5.7 31.2 11.0 11.0 0.0 Total 4.3 4.2 4.9 5.0 4.6 6.2 4.1 4.0 4.4
Source: BBS
However studying the unemployment rates of recent TVET graduates has only a limited value. The coverage of data on unemployment needs to be expanded towards skilled adults with qualifications. Such data provide a basis for identification of the trades in the labour market where both young and experienced skilled workers and technicians cannot find employment (their share among the unemployed will tend to increase over time). 4. Data on skilled job vacancies advertised in press and internet
Large companies in Bangladesh usually advertise their vacancy positions on their websites. There are also some job search internet services to advertise the demand for various jobs. These include: Bdjobs.com, A1jobs.com, Linajobs.com and Chakri.com.bd. Whilst these sites mainly cover professional and managerial positions, a few posts suitable for TVET graduates can also be found. Annex 5 provides a listing of job positions, titles and sometimes, associated with them qualifications, which are demanded by companies. Advertisements for the jobs requiring TVET Diploma, SSC (Voc) and other qualification levels are published in some newspapers.
wcms_106496.doc 81
CHAPTER IV OBSERVATIONS AND RECOMMENDATIONS 1. Observations Observations and recommendations of this report are based on the data collected from statistical sources as well as interviews with relevant agencies and institutions (list of contacted agencies is in Annex 6).
Availability of data - TVET related data is usually published through regular or occasional publications and on
some websites. BTEB publishes annual reports comprising the data on intake and passed out graduates course-wise and level-wise. The latest annual report available is of 2005-2006. It covers all the institutions both public and private affiliated with BTEB.
- BMET also generates data on student intakes and graduations and some other related data. Annual reports with such data are not however published annually. BMET website also publishes data on employment overseas. Such data has been available since 1976 and updated annually.
- DYD and DWA publish data on their training programmes including student intake and graduations data for different courses. This data is available annually and published regularly.
- Data on private TVET providers is not collected in an organized manner. The only data on this sector is available from the BTEB and cover the courses affiliated with BTEB. In this study, some data on private TVET providers have been collected from individual institutions.
- Data on TVET providers, courses, enrolment capacity, institutions, student intake, and graduations are also published by departments such as BMET, DTE, BTEB, DYD, Department of Textile, BANBEIS, BBS, etc. This data is reliable but not published regularly. The data on student employment status is also available from some individual institutions.
- Those NGOs who deliver training maintain their own data on courses. As these courses cover specific groups of their beneficiaries, the data is generally not publicly available.
- No data on the demand for TVET graduates from the economy is available as such demand has not been properly assessed.
- TVET providers do not maintain any record of the student demand for courses in individual trades.
- BBS produces a considerable number of TVET-related data. BBS conducts national population census every 10 years (last census was conducted in 2001). Labour Force Surveys (LFS) are normally conducted every 3-4 years. Last LFS was carried out in 2005-2006. BBS annually publishes the data relating to TVET on population, age group, workforce, GDP growth, employment, education, and TVET, however the level of detail reported on is of limited value in TVET planning.
- Census of Manufacturing Industries (CMI) has great potential to improve understanding of the demand side of the TVET skills equsation, but it is not regularly conducted by
wcms_106496.doc 82
BBS. Improving the practice of establishment surveys would be a very important input to the TVET data system.
- BOI publishes data on growth of industries, employment in industry, FDI flow and local and foreign investment which is relevant for understanding of the demand for TVET graduates. Such data is available on the website and updated regularly.
The type of data to be generated The data which is currently lacking on TVET includes:
- actual numbers of youth leaving general schooling after the Grade 5 who are willing to acquire skills;
- data on progression from different types and levels of education to formal TVET programmes;
- potential district-level and upozila-level demand for skills development courses; - regional and district level mapping of TVET programme, annual enrolments per trade
and award; - the demand for and supply of TVET covering massive skilled occupations employed
in the local economy and overseas; - data on unemployment and under-employment of the educated, skilled and
experienced workforce; - labour market success of TVET graduates in the occupations in which they received
training; - rates of return to TVET per type of programme, etc.
Structure of available data
- the currently available data focusus primarily on the type of courses and graduates (such as SSC (Voc) and Diploma programmes). This mostly is relevant for informing policy decisions such as whether to expand or reduce enrolments in SSC (Voc), etc. However, no evidence has been found that this data on TVET programmes have been used for such a purpose;
- since the data collected is generally not occupation-specific, it does not permit an assessment of the training market regarding particular trade areas and individual trades;
- industry demands for skilled workers is commonly expressed in terms of occupations and qualifications, for this reason, the data on supply described above is not able to be matched with the demands of industry;
- available data does not trace the employment of graduates in the occupations in which they had been trained. Many TVET graduates may find themselves employed in entirely different trades where the acquired skills and knowledge cannot be utilized (meaning negative private returns to such training), etc.
wcms_106496.doc 83
2. Recommendations: A national system of TVET-related data would be useful mostly for advising policy decisions and for the monitoring purposes. However, at the local level, systems of TVET-related data would permit decisions to be made on balancing the supply with demand and would allow for improved coordination of providers.
It is recommended that: 12. A system of TVET-related data be developed in Bangladesh given the massive training
supply and growing demand from youth. Collecting and processing data is expensive and such costs are only justifiable if the data can inform certain policy and management decisions in TVET.
13. In order to assess the demand for TVET programmes, the requirements of the population
and the economy need to be surveyed and published regularly. BBS needs to review its practices of conducting the establishment surveys to incorporate the demand for information required by TVET planners, as availability of accurate data on the industries’ occupational and qualifications structures would allow improvements to the information base for TVET decisions. The establishment surveys should be more frequent, enabling more effective assessments of the growth and structural changes in the labour force and industry demands for an educated and skilled workforce.
14. Industry should be directly involved in providing data on the demand for skilled workers
across different occupations. This may be a task undertaken by industry associations or trade bodies with assistance from government as necessary. The role of the economic sectors through the Association of trade bodies and other industry bodies needs to be encouraged, enabling them to improve assessment of the demand for skilled and educated graduates and improve their linkages to the TVET system.
15. The collection of supply side data in TVET should cover all major providers. Not all of
them, however, may need to be followed-up on the annual basis. For instance, many short-term programmes are conducted by NGOs in the community to impart skills for income-generating activities. As long as the TVET system is not given a major role in the provision of skills training for income generation, the data on the demand for and supply of such programmes could be collected once in several years.
16. Generating data to assess how the supply of TVET services matches the demand for them
is a new task for many countries. One of the principal indicators here remains the labour market success of TVET graduates. TVET providers should be strictly required to follow up on the labour market status of their graduates and report to their respective agencies: BMET, DTE, DYD, etc on the annual basis. This work should be implemented at various qualification levels and cover graduates of polytechnics, SSC (voc), HSC (voc) and graduates from shorter courses. Collection of data should become a compulsory function
wcms_106496.doc 84
assigned to the TVET institutions. TVET providers should be provided with standard questionnaires and their staff trained in the standard procedures for such surveys enabling to ensure reliability of data.
17. Information on enrolments and graduations of individual TVET providers should be made
publicly available allowing for benchmarking of performance. This may or may not be linked to a dedicated website that could be established to guide the public on TVET providers and their course offerings, to provide guidance on the content of TVET programmes and the national TVET qualifications, and to guide TVET students and graduates on the employment opportunities in various trades and industries.
18. Private training providers offering programs not affiliated with BTEB should also be
encouraged to collect the above data and supply them to the relevant agencies. 19. TVET data should be collected, stored and processed, by a dedicated and competent
organization set up for this purpose (ie: a skills training and labour market observatory). Such an organization should have funds and staff trained in the collection, processing and interpretation of data related to TVET. This data would be used by the policy-makers, TVET administrators and national planners to coordinate, monitor and evaluate progress in TVET. This data would also be indispensable for making investment and funding decisions in TVET.
20. Ongoing work on the data system should continue to expand the data entries, eliminate
duplication and develop methods for combining the data. Methodological and technical guidance for the TVET information system needs to be developed further involving standard forms and techniques of data collection, processing, and interpretation as well as the formats in which the data will be provided to various users. National professionals need to be trained in handling the TVET-related data to ensure sustainability of this important work initiated by the TVET reform project.
21. Data on demand for and supply of TVET may best be structured on the basis of the
system of occupational qualifications which is currently undergoing a review by the TVET reform project. This would allow for identification of qualification structures in the economy, as well as skills shortages, and will help maintain the supply-demand equilibrium between TVET and the labour market.
22. Skills development in the vast informal economy of Bangladesh is taking place on an
enormous scale as it is a matter of personal survival for millions of people. This issue has not been touched upon during the current phase of this study. It would appear that the type of data, and methods of collection for the demand and supply of skills in the informal economy are different and will be addressed later in the TVET Reform Project.
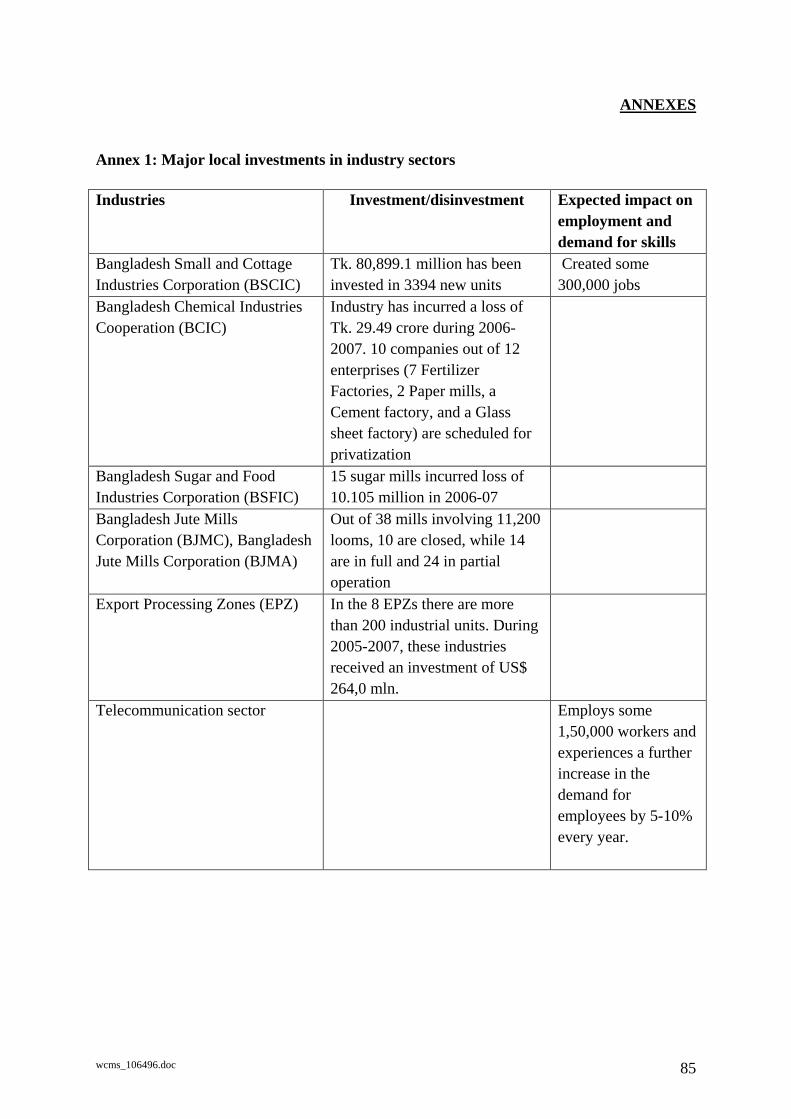
wcms_106496.doc 85
ANNEXES
Annex 1: Major local investments in industry sectors Industries Investment/disinvestment Expected impact on
employment and demand for skills
Bangladesh Small and Cottage Industries Corporation (BSCIC)
Tk. 80,899.1 million has been invested in 3394 new units
Created some 300,000 jobs
Bangladesh Chemical Industries Cooperation (BCIC)
Industry has incurred a loss of Tk. 29.49 crore during 2006-2007. 10 companies out of 12 enterprises (7 Fertilizer Factories, 2 Paper mills, a Cement factory, and a Glass sheet factory) are scheduled for privatization
Bangladesh Sugar and Food Industries Corporation (BSFIC)
15 sugar mills incurred loss of 10.105 million in 2006-07
Bangladesh Jute Mills Corporation (BJMC), Bangladesh Jute Mills Corporation (BJMA)
Out of 38 mills involving 11,200 looms, 10 are closed, while 14 are in full and 24 in partial operation
Export Processing Zones (EPZ) In the 8 EPZs there are more than 200 industrial units. During 2005-2007, these industries received an investment of US$ 264,0 mln.
Telecommunication sector Employs some 1,50,000 workers and experiences a further increase in the demand for employees by 5-10% every year.
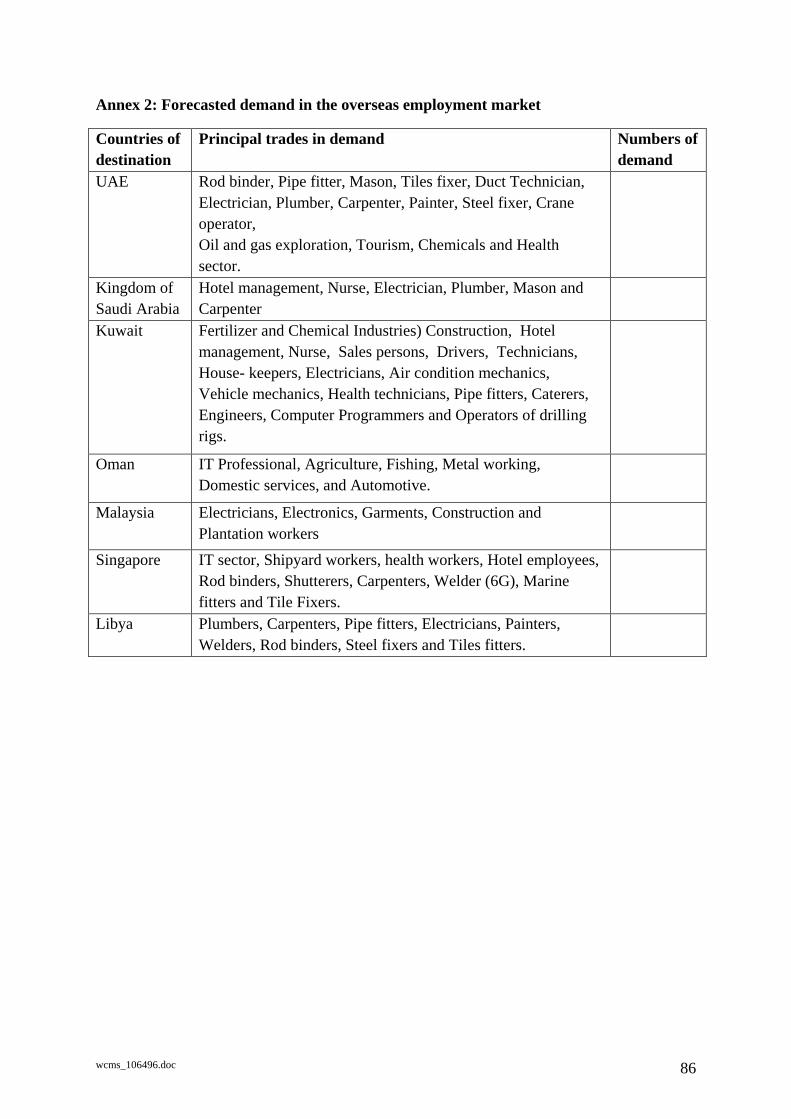
wcms_106496.doc 86
Annex 2: Forecasted demand in the overseas employment market
Countries of destination
Principal trades in demand Numbers of demand
UAE Rod binder, Pipe fitter, Mason, Tiles fixer, Duct Technician, Electrician, Plumber, Carpenter, Painter, Steel fixer, Crane operator, Oil and gas exploration, Tourism, Chemicals and Health sector.
Kingdom of Saudi Arabia
Hotel management, Nurse, Electrician, Plumber, Mason and Carpenter
Kuwait Fertilizer and Chemical Industries) Construction, Hotel management, Nurse, Sales persons, Drivers, Technicians, House- keepers, Electricians, Air condition mechanics, Vehicle mechanics, Health technicians, Pipe fitters, Caterers, Engineers, Computer Programmers and Operators of drilling rigs.
Oman IT Professional, Agriculture, Fishing, Metal working, Domestic services, and Automotive.
Malaysia Electricians, Electronics, Garments, Construction and Plantation workers
Singapore IT sector, Shipyard workers, health workers, Hotel employees, Rod binders, Shutterers, Carpenters, Welder (6G), Marine fitters and Tile Fixers.
Libya Plumbers, Carpenters, Pipe fitters, Electricians, Painters, Welders, Rod binders, Steel fixers and Tiles fitters.

wcms_106496.doc 87
Annex 3: Structure of the education and TVET in Bangladesh
Age Grade
26+
25+ XX
24+ XIX Ph. D
PostMBBS Dipl
23+ XVIII M.Phil M.Phil(Medical
Ph. D(Engr)
Ph.D(Medical)
Ph. D (Education)
22+ XVII MA/MSc/MCom/MSS/MBA LLM M BB SBDS
MSc(Engr) MSc.(Agr) M B A M.Ed & M A(Edn)
MA(LSc)
21+ XVI Masters (Prel)
B.Ed &Dip.Ed
BP ED Dip.(LSc)
20+ XV
BSc.Eng BSc (Tech.Edn)
Kamil
19+ XIV
18+ XIII
Bachelor (Hons)
Bachelor (Pass)
LLB(Hons) BSc.Eng BSc.Agr BSc.Text BSc.Leath
B B A
Fazil
17+ XII Examination HSC
16+ XI HIGHER SECONDARY EDUCATION
Diploma (Engineering)
HSC Vocational
C in Edu.
C in Agri
Diploma in
Comm
Diploma in
Nursing Alim
15+ X Examination SSC
14+ IX SECONDARY EDUCATION
TRADE Certificate/ SSC Vocational
ARTISAN COURSE e.g. CERAMICS
13+ VIII
12+ VII
11+ VI
Secondary
JUNIOR SECONDARY EDUCATION
Dakhil
10+ V
9+ IV
8+ III
7+ II
6+ I
PRIMARY EDUCATION Ebtedayee
5+ PRE-PRIMARY EDUCATION
4+
3+

wcms_106496.doc 88
Annex 4: Current vocational qualification framework in Bangladesh National Skill Standard (NSS) Classification
III Semi-skilled Routine/Repetitive job under minimum supervision and new job under direct supervision
II Skilled Routine/Repetitive job without supervision and new/complex job with supervision.
I Highly Skilled Limited planning of job and coordination and supervision of activities of a group of workers.
Subsequently the following two standards were added by BTEB:
NSS Skill Level Competence Level (Capable of doing)
Basic Basic Skilled Routine/Repetitive job under 100% supervision.
Master Master Craftsman Planning of a new complex job coordination and supervision of activities of a group of workers and evaluation and control of quality of works.
First year course content of SSC (voc) meets the requirement of National Skill Standard Grade-111 (Semi-Skilled level). Similarly Second year course content meets the requirement of Grade-11 (Skilled level). The trainees on completion of each part are employable as semi-skilled and skilled workers attaining the certificates of national skill standard Grade-111 & Grade-11 on completion of 1st and 2nd year respectively.

wcms_106496.doc 89
Annex 5: Demand for professional and managerial staff (summary of newspaper advertisements) SL.# Position Qualification
1. Engineer Civil Engineer Diploma Engineer Senior Project Engineer Senior Engineer Junior Project Engineer Engineer civil Team Leader (Survey & Design) Design Engineer CME Manager Quality Controller Regional Project Manager Construction Supervisor Office Engineer/Quantity Surveyor Site Engineer Fabric Construction Technician Project Engineer Manager Field Engineer Field Engineer(Structure) Assistant Engineer Instructor Draftsman Operator Maintenance Officer Auto CAD Operator Planning Engineer Material Engineer Surveyor
Diploma in civil Engineering
2.
Technician Sub Assistant Engineer Workshop in Charge Assistant Manager (Technical ) Diploma Engineer Engineer Laboratory Technician Maintenance Engineer Assistant Engineer Lecturer/ Associate professor Project Manager Assistant Professor Commercial Officer IT Executive Assistant Bio Medical Engineer
Diploma in Electronics Engineering

wcms_106496.doc 90
SL.# Position Qualification Marketing Executive Instructor
3.
Engineer Workshop in Charge Assistant Manager (Technical ) Diploma Engineer CAD Design Engineer CAD Operator Irrigation Engineer Mechanical Engineer Washing Manager Chief Engineer Project Engineer Auto Mechanic Press Mechanic Assistant Maintenance Manager Shift Supervisor Assistant Engineer Field Engineer Instructor Draftsman Maintenance Manager Maintenance in Charge Project Manager Production Engineer Foreman Production Officer Field Engineer Testing Engineer Generator Engineer Commercial Officer Engineering Trainee Engineer Maintenance Engineer Supervisor Plant Mechanic Shift in Charge Purchase Officer Paper Machine Shift In Charge Quality Control Officer
Diploma in Mechanical Engineering
4. Engineer Manager (Technical ) Diploma Engineer CAD Operator Chief Engineer Assistant Professor Assistant Engineer Project Manager Implementation Engineer
Diploma in Electrical Engineering

wcms_106496.doc 91
SL.# Position Qualification Support Engineer Solutions Engineer Instructor Field Engineer Draftsman Executive Engineer Service Engineer Assistant General Manager Production Officer Supervisor Building Supervisor Testing Engineer (Meter) Commercial Officer Trainee Engineer Marketing Executive Generator Operator
5. CAD Design Engineer Architect (Design and Planning) Assistant Engineer Chief Instructor Jr. Architect Auto CAD Operator Executive (Plumbing) Drafts Man
Diploma in Architect
6. Power Engineer Power Manager Chief Engineer Assistant Maintenance Manager Assistant Engineer Field Engineer Inspector Power Tiller Technician
Diploma in Power
7. Chief Engineer Manager Engineering and Maintenance Assistant Maintenance Manager
Diploma in Marine Engineering
8. Lecturer/ Associate professor Project Manager Implementation Engineer Solutions Engineer Support Engineer
TelecommunicationEngineering
9. Laboratory Assistant (Computer ) System Analyst Data Entry Operator Project Manager Implementation Engineer Support Engineer Solutions Engineer Computer Network manager/Engineer Computer Programmer
Diploma in Computer Engineering

wcms_106496.doc 92
SL.# Position Qualification Software Engineer Hardware Engineer Instructor Assistant Teacher
10. Computer Operator Data Entry Operator
Trade/ Certificate Course
11. Laboratory Technologist Lab Assistant
Diploma in Laboratory Technology
12. Assistant Physiotherapist Diploma in Physiotherapy
13. Medical Technologist Mechanical in Charge Medical Assistant
Diploma in Medical Technology
14. Senior Engineer Electro Medical Technology
15. Nurse Diploma in Nurse 17. Driver 18. Production line in Charge
Production Supervisor Diploma in Food Technology
19. Senior Technician Knitting 20. Senior Technician Textile & Clothing 21. Senior Technician Sweater 22. Helper Weaving
Helper Dyeing Production Officer Assistant. Production Officer production Manager Prof./Associate professor Associate professor Lecturer Surveyor Garments Technologist Director Director production General Manager Merchandising Manager Quality Manager Maintenance Manager Merchandiser Quality Controller Garment Technologist
Textile Technology
23. Lecturer/ Associate professor Dyeing & Finishing Technician Sweater Technician
Diploma in Fashion Design
24. Lecturer/ Associate professor Quality Assurance Technician Knitting Technician
Textile Engineering

wcms_106496.doc 93
SL.# Position Qualification Yarn Dyeing Technician Fabric Dyeing Technician Sr. Lecturer Assistant Professor Technologist Manager Sr. Executive Manager (Dyeing & Finishing) Executive Production Officer Knit Quality Controller Dyeing Master Floor Supervisor Assistant Project Manager Knitting Manager Inspector Assistant Seizer Laboratory Technician Laboratory Assistant
25. Lecturer/ Associate professor Sewing Technology
26. Graphic Designer Production Manager Garment Quality Controller Sweater Technician Computer Graphic Designer
Diploma in Graphic Design
27. Lecturer/ Associate professor Garment Technologist
Apparel manufacturing Technology
28. Technical Manager
Graduate in Pattern making & Garment
29. Pattern Master 30. Electrician
Technician Plant Attendant Lab Technician Engine Driver Radio Technician Mechanic Auto Mechanic Press Mechanic Mechanical Foreman Press Mechanic Mechanical Fitter Technical Trainee
Trade Course (Voc)
36. Generator Operator Industrial Electrician House Wearing Electrician Auto Mechanic
SSC Trade Course

wcms_106496.doc 94
SL.# Position Qualification Press Mechanic Plumber Electric Line man
38. Draftsman Diploma in Draftsmanship
39. Shift Supervisor Quality Control Officer Selection Officer
Diploma in Glass & Ceramics
40. Sr. Technician Woven, Knit, Sweater, Patterns, Fittings.
41. Jr. Technician Woven, Knit, Sweater, Patterns, Fittings.
42. Production Manager Technical Manager Quality Assurance Manager Garment Technologist
Garment Manufacturing Technician
43. Washing Manager Garments Washing Technology
44. Sampling master Engraving manager Loom Technician
SSC Textile
45 Foreman Supervisor Service Engineer Engineer Sub- Assistant Engineer
Diploma in Engineering
Welder Trade Course Fitter/Pipe Fitter Trade Course Surveyor Diploma in Survey Mason/ Carpenter/ Shuttering Trade Course
Annex 6: Agencies and persons contacted during collection of data A. Government organisations SL# Name of the institution Address Contact Person
1. Bangladesh Technical Education Board (BTEB) Department
Agargao, Shere Bangla nagar, Dhaka
Mr. Shahjahan Mia Secretary
2. Bangladesh Technical Education Board (BTEB) Department
Agargao, Shere Bangla nagar, Dhaka
Dr. Nitai Chandra Sutradhar, Chairman
3. Directorate of Technical Education (DTE)
Shiksha Bhaban, Abdul Gani Road, Dhaka
Dr. Md. Wazed Ali, Project Officer
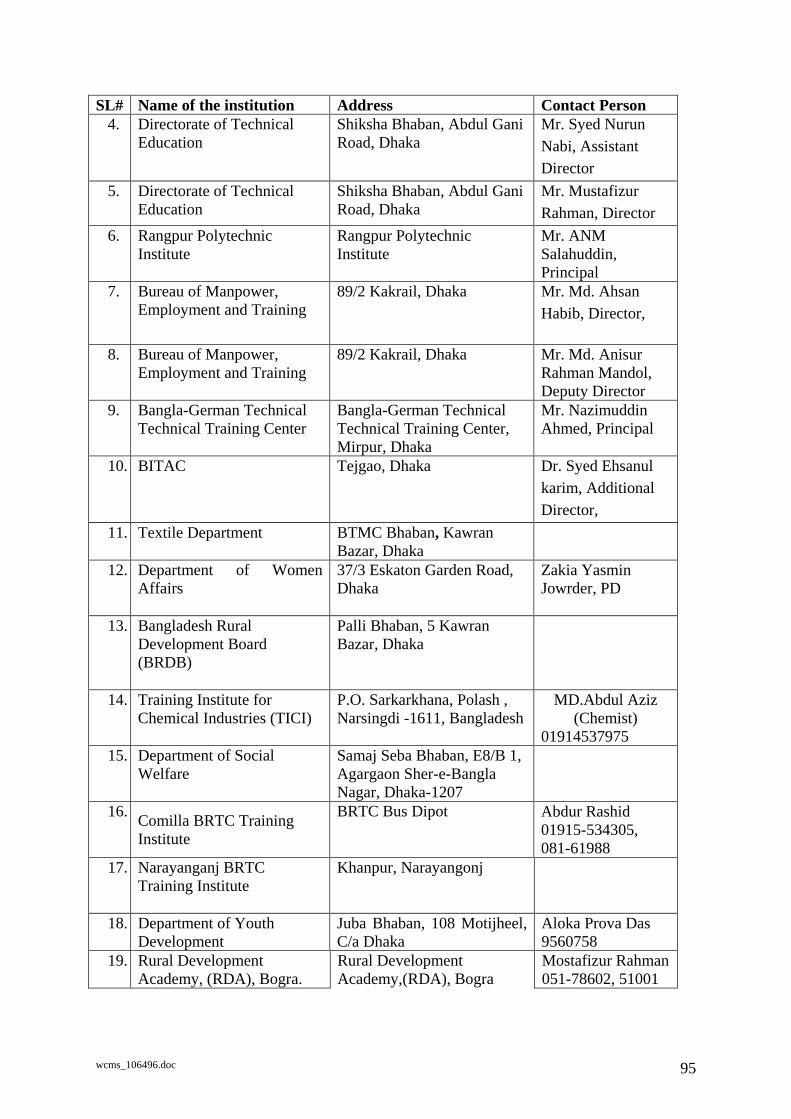
wcms_106496.doc 95
SL# Name of the institution Address Contact Person 4. Directorate of Technical
Education Shiksha Bhaban, Abdul Gani Road, Dhaka
Mr. Syed Nurun Nabi, Assistant Director
5. Directorate of Technical Education
Shiksha Bhaban, Abdul Gani Road, Dhaka
Mr. Mustafizur Rahman, Director
6. Rangpur Polytechnic Institute
Rangpur Polytechnic Institute
Mr. ANM Salahuddin, Principal
7. Bureau of Manpower, Employment and Training
89/2 Kakrail, Dhaka Mr. Md. Ahsan Habib, Director,
8. Bureau of Manpower, Employment and Training
89/2 Kakrail, Dhaka Mr. Md. Anisur Rahman Mandol, Deputy Director
9. Bangla-German Technical Technical Training Center
Bangla-German Technical Technical Training Center, Mirpur, Dhaka
Mr. Nazimuddin Ahmed, Principal
10. BITAC Tejgao, Dhaka Dr. Syed Ehsanul karim, Additional Director,
11. Textile Department BTMC Bhaban, Kawran Bazar, Dhaka
12. Department of Women Affairs
37/3 Eskaton Garden Road, Dhaka
Zakia Yasmin Jowrder, PD
13. Bangladesh Rural Development Board (BRDB)
Palli Bhaban, 5 Kawran Bazar, Dhaka
14. Training Institute for Chemical Industries (TICI)
P.O. Sarkarkhana, Polash , Narsingdi -1611, Bangladesh
MD.Abdul Aziz (Chemist)
01914537975 15. Department of Social
Welfare Samaj Seba Bhaban, E8/B 1, Agargaon Sher-e-Bangla Nagar, Dhaka-1207
16. Comilla BRTC Training Institute
BRTC Bus Dipot Abdur Rashid 01915-534305, 081-61988
17. Narayanganj BRTC Training Institute
Khanpur, Narayangonj
18. Department of Youth Development
Juba Bhaban, 108 Motijheel, C/a Dhaka
Aloka Prova Das 9560758
19. Rural Development Academy, (RDA), Bogra.
Rural Development Academy,(RDA), Bogra
Mostafizur Rahman 051-78602, 51001
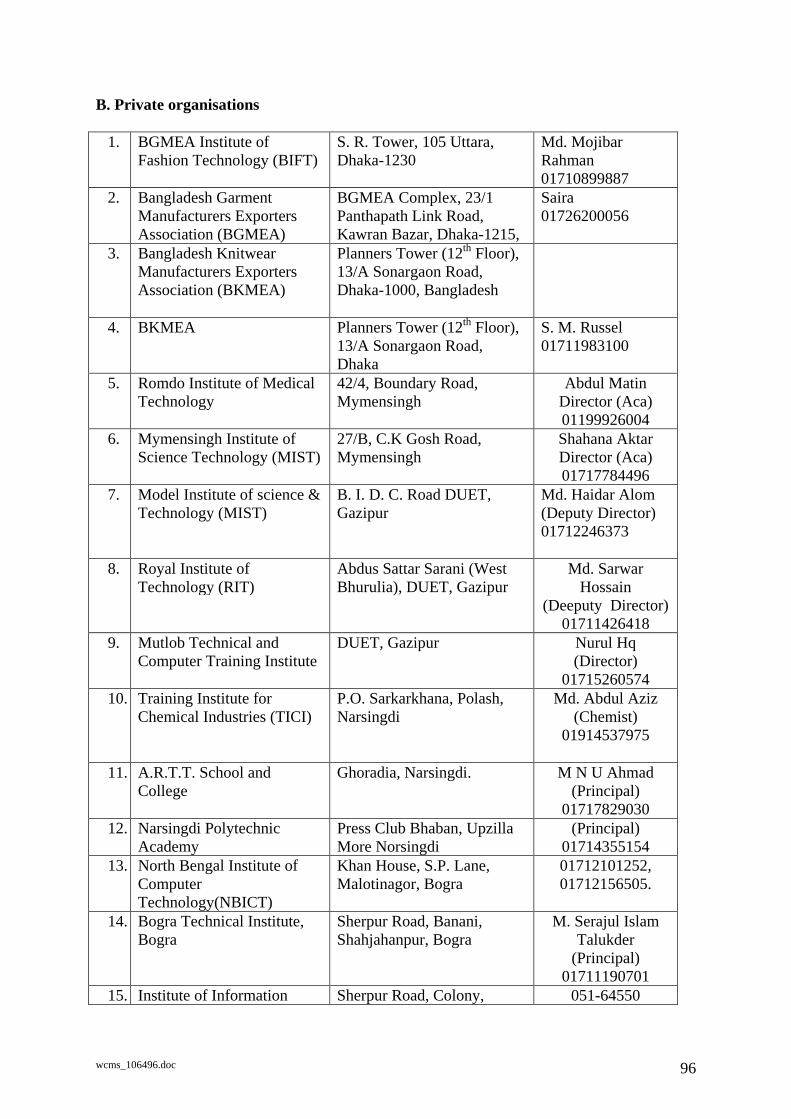
wcms_106496.doc 96
B. Private organisations
1. BGMEA Institute of Fashion Technology (BIFT)
S. R. Tower, 105 Uttara, Dhaka-1230
Md. Mojibar Rahman 01710899887
2. Bangladesh Garment Manufacturers Exporters Association (BGMEA)
BGMEA Complex, 23/1 Panthapath Link Road, Kawran Bazar, Dhaka-1215,
Saira 01726200056
3. Bangladesh Knitwear Manufacturers Exporters Association (BKMEA)
Planners Tower (12th Floor), 13/A Sonargaon Road, Dhaka-1000, Bangladesh
4. BKMEA Planners Tower (12th Floor), 13/A Sonargaon Road, Dhaka
S. M. Russel 01711983100
5. Romdo Institute of Medical Technology
42/4, Boundary Road, Mymensingh
Abdul Matin Director (Aca) 01199926004
6. Mymensingh Institute of Science Technology (MIST)
27/B, C.K Gosh Road, Mymensingh
Shahana Aktar Director (Aca) 01717784496
7. Model Institute of science & Technology (MIST)
B. I. D. C. Road DUET, Gazipur
Md. Haidar Alom (Deputy Director) 01712246373
8. Royal Institute of Technology (RIT)
Abdus Sattar Sarani (West Bhurulia), DUET, Gazipur
Md. Sarwar Hossain
(Deeputy Director) 01711426418
9. Mutlob Technical and Computer Training Institute
DUET, Gazipur Nurul Hq (Director)
01715260574 10. Training Institute for
Chemical Industries (TICI)
P.O. Sarkarkhana, Polash, Narsingdi
Md. Abdul Aziz (Chemist)
01914537975
11. A.R.T.T. School and College
Ghoradia, Narsingdi.
M N U Ahmad (Principal)
01717829030 12. Narsingdi Polytechnic
Academy Press Club Bhaban, Upzilla More Norsingdi
(Principal) 01714355154
13. North Bengal Institute of Computer Technology(NBICT)
Khan House, S.P. Lane, Malotinagor, Bogra
01712101252, 01712156505.
14. Bogra Technical Institute, Bogra
Sherpur Road, Banani, Shahjahanpur, Bogra
M. Serajul Islam Talukder
(Principal) 01711190701
15. Institute of Information Sherpur Road, Colony, 051-64550
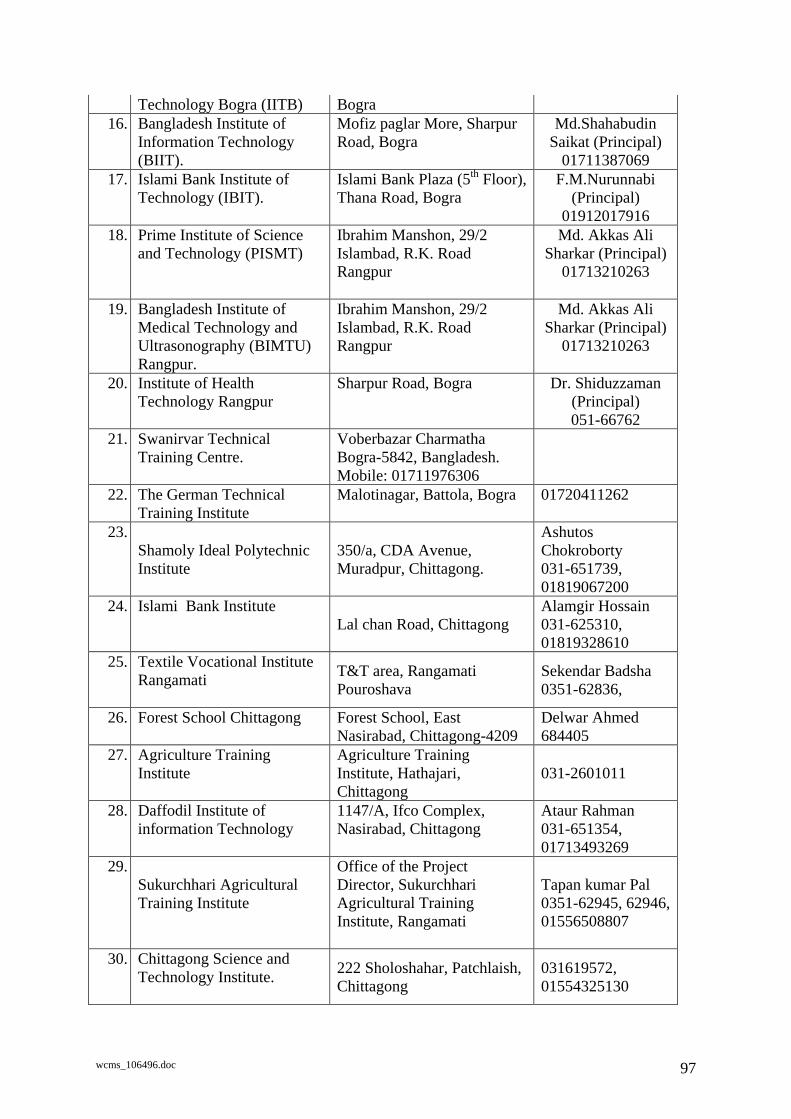
wcms_106496.doc 97
Technology Bogra (IITB) Bogra 16. Bangladesh Institute of
Information Technology (BIIT).
Mofiz paglar More, Sharpur Road, Bogra
Md.Shahabudin Saikat (Principal)
01711387069 17. Islami Bank Institute of
Technology (IBIT). Islami Bank Plaza (5th Floor), Thana Road, Bogra
F.M.Nurunnabi (Principal)
01912017916 18. Prime Institute of Science
and Technology (PISMT)
Ibrahim Manshon, 29/2 Islambad, R.K. Road Rangpur
Md. Akkas Ali Sharkar (Principal)
01713210263
19. Bangladesh Institute of Medical Technology and Ultrasonography (BIMTU) Rangpur.
Ibrahim Manshon, 29/2 Islambad, R.K. Road Rangpur
Md. Akkas Ali Sharkar (Principal)
01713210263
20. Institute of Health Technology Rangpur
Sharpur Road, Bogra Dr. Shiduzzaman (Principal) 051-66762
21. Swanirvar Technical Training Centre.
Voberbazar Charmatha Bogra-5842, Bangladesh. Mobile: 01711976306
22. The German Technical Training Institute
Malotinagar, Battola, Bogra 01720411262
23.Shamoly Ideal Polytechnic Institute
350/a, CDA Avenue, Muradpur, Chittagong.
Ashutos Chokroborty 031-651739, 01819067200
24. Islami Bank Institute Lal chan Road, Chittagong
Alamgir Hossain 031-625310, 01819328610
25. Textile Vocational Institute Rangamati
T&T area, Rangamati Pouroshava
Sekendar Badsha 0351-62836,
26. Forest School Chittagong
Forest School, East Nasirabad, Chittagong-4209
Delwar Ahmed 684405
27. Agriculture Training Institute
Agriculture Training Institute, Hathajari, Chittagong
031-2601011
28. Daffodil Institute of information Technology
1147/A, Ifco Complex, Nasirabad, Chittagong
Ataur Rahman 031-651354, 01713493269
29.Sukurchhari Agricultural Training Institute
Office of the Project Director, Sukurchhari Agricultural Training Institute, Rangamati
Tapan kumar Pal 0351-62945, 62946, 01556508807
30. Chittagong Science and Technology Institute.
222 Sholoshahar, Patchlaish, Chittagong
031619572, 01554325130
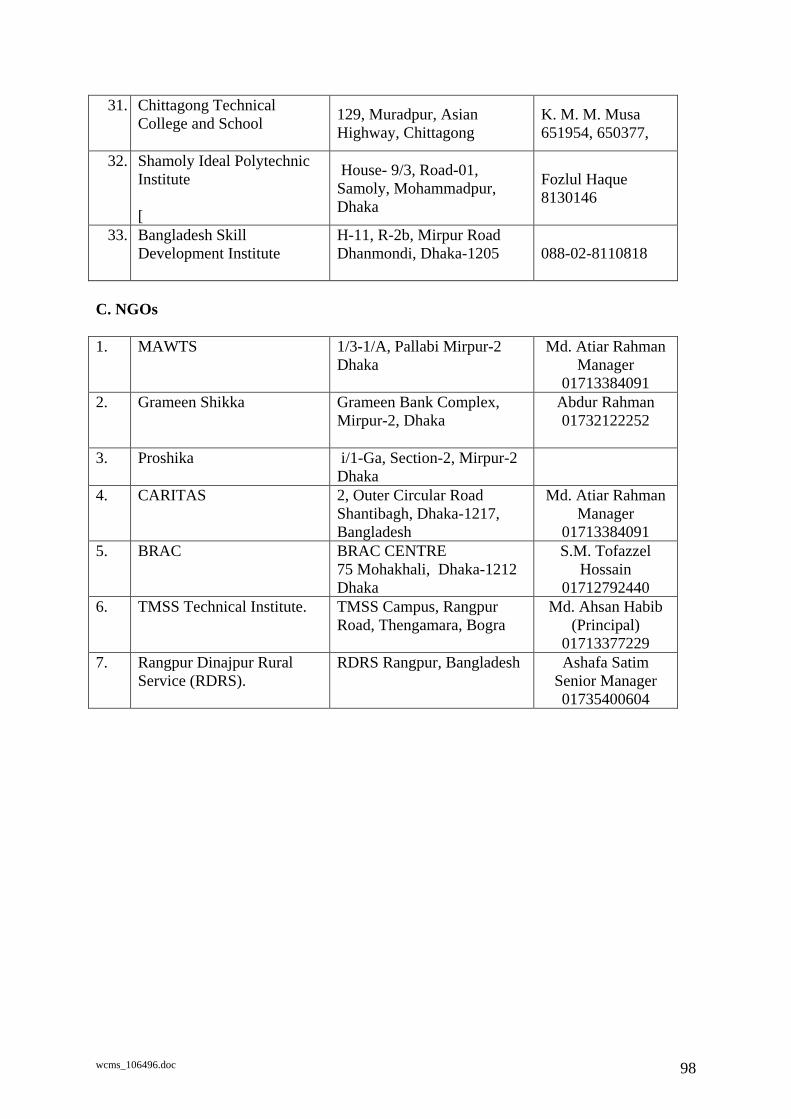
wcms_106496.doc 98
31. Chittagong Technical College and School
129, Muradpur, Asian Highway, Chittagong
K. M. M. Musa 651954, 650377,
32. Shamoly Ideal Polytechnic Institute [
House- 9/3, Road-01, Samoly, Mohammadpur, Dhaka
Fozlul Haque 8130146
33. Bangladesh Skill Development Institute
H-11, R-2b, Mirpur Road Dhanmondi, Dhaka-1205
088-02-8110818
C. NGOs 1. MAWTS 1/3-1/A, Pallabi Mirpur-2
Dhaka Md. Atiar Rahman
Manager 01713384091
2. Grameen Shikka Grameen Bank Complex, Mirpur-2, Dhaka
Abdur Rahman 01732122252
3. Proshika
i/1-Ga, Section-2, Mirpur-2 Dhaka
4. CARITAS
2, Outer Circular Road Shantibagh, Dhaka-1217, Bangladesh
Md. Atiar Rahman Manager
01713384091 5. BRAC
BRAC CENTRE 75 Mohakhali, Dhaka-1212 Dhaka
S.M. Tofazzel Hossain
01712792440 6. TMSS Technical Institute. TMSS Campus, Rangpur
Road, Thengamara, Bogra Md. Ahsan Habib
(Principal) 01713377229
7. Rangpur Dinajpur Rural Service (RDRS).
RDRS Rangpur, Bangladesh
Ashafa Satim Senior Manager 01735400604
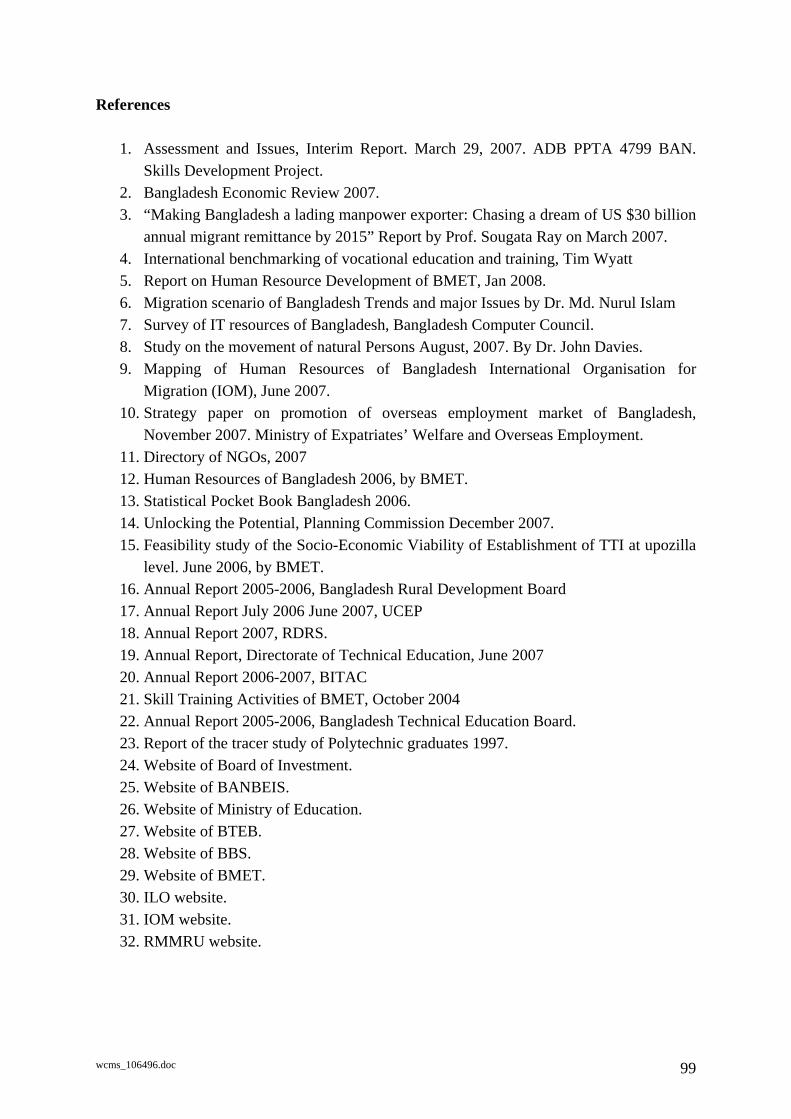
wcms_106496.doc 99
References
1. Assessment and Issues, Interim Report. March 29, 2007. ADB PPTA 4799 BAN. Skills Development Project.
2. Bangladesh Economic Review 2007. 3. “Making Bangladesh a lading manpower exporter: Chasing a dream of US $30 billion
annual migrant remittance by 2015” Report by Prof. Sougata Ray on March 2007. 4. International benchmarking of vocational education and training, Tim Wyatt 5. Report on Human Resource Development of BMET, Jan 2008. 6. Migration scenario of Bangladesh Trends and major Issues by Dr. Md. Nurul Islam 7. Survey of IT resources of Bangladesh, Bangladesh Computer Council. 8. Study on the movement of natural Persons August, 2007. By Dr. John Davies. 9. Mapping of Human Resources of Bangladesh International Organisation for
Migration (IOM), June 2007. 10. Strategy paper on promotion of overseas employment market of Bangladesh,
November 2007. Ministry of Expatriates’ Welfare and Overseas Employment. 11. Directory of NGOs, 2007 12. Human Resources of Bangladesh 2006, by BMET. 13. Statistical Pocket Book Bangladesh 2006. 14. Unlocking the Potential, Planning Commission December 2007. 15. Feasibility study of the Socio-Economic Viability of Establishment of TTI at upozilla
level. June 2006, by BMET. 16. Annual Report 2005-2006, Bangladesh Rural Development Board 17. Annual Report July 2006 June 2007, UCEP 18. Annual Report 2007, RDRS. 19. Annual Report, Directorate of Technical Education, June 2007 20. Annual Report 2006-2007, BITAC 21. Skill Training Activities of BMET, October 2004 22. Annual Report 2005-2006, Bangladesh Technical Education Board. 23. Report of the tracer study of Polytechnic graduates 1997. 24. Website of Board of Investment. 25. Website of BANBEIS. 26. Website of Ministry of Education. 27. Website of BTEB. 28. Website of BBS. 29. Website of BMET. 30. ILO website. 31. IOM website. 32. RMMRU website.