Embed Size (px)
Citation preview

ISSN 2549-3922 EISSN 2549-3930 Journal of Regional and Rural Development Planning Oktober 2018, 2 (3): 283-293
DOI: http://dx.doi.org/10.29244/jp2wd.2018.2.3.283-293
283
Availability of Urban Infrastructure in Efforts to Establish Semarang Smart City in 2017
Irma Fajariyah1, Ariyani Indrayati1 & Nur ‘Izzatul Hikmah1*
1Geography Department, Universitas Negeri Semarang, Building C5 2nd Floor, Sekaran, Campus, Gunungpati, Semarang 50229, Indonesia; *Corresponding Author. e-mail: [email protected]
(Received: 29 March 2018; Accepted: 8 August 2018)
ABSTRACT
Semarang city government has made efforts to digitize public services and provide Information and Communication Technology (ICT) infrastructure to establish Semarang as a smart city, but there are remaining problems. The objectives of this research are (1) to identify the availability of smart city infrastructure in Semarang; (2) to understand human resources that support the operation and utilization of infrastructure; (3) to provide direction for improvement and development of smart city infrastructure based on spatial approach. The variable of the research is the availability of urban ICT infrastructure, which consists of sub-variables of each infrastructure types. Analysis used in this research is secondary data analysis, together with district unit analysis using Guttman scale analysis, Scalogram analysis, and Centrality Index analysis. The result stated that there are no centrality of smart city infrastructure because the IS value is discovered 35.14 (medium), which is divided into 4 hierarchies of area services. The completeness level of facilities in each district ranged between medium (50-70%) and high (>75%). Therefore, the development of smart city infrastructure needs to be directed to southern and western regions that are in hierarchy service III and IV, balanced with the synergy between government and society in its implementation.
Keywords: Centrality Index, Guttman Scale analysis, Hierarchy Services, ICT infrastructures, Smart city
INTRODUCTION
One of the program of the Government of Indonesian order to solve urban problems besides considering the future of the city is to create sustainable city by implementing Sustainable Development Goals (SDGs) which begin in 2015. The program of the Government of Indonesian needs 5 pillars of sustainable city concept and city's future competitiveness in 2045 through liveable city, green city, smart and competitive city. Nowadays, smart city has become a trend in big cities and also applied almost in all cities in Indonesia (Purnomo et al., 2015). In this case, Semarang City has implemented the concept of smart city with the
effort of digitalization of public services and provision of Information and Communications Technology (ICT) infrastructure as a solution to overcome the problems of the city. However, facts in the field show that there are still problems related to infrastructure, such as PDAM (clean water) distribution until 2011 only serves 56.95% of the population (Yuliani and Rahdriawan, 2015), traffic jams that occur in the nodes of access to Semarang City (Siswanto, et al., 2012), less optimal electric services as indicated by the decrease non electrification ratio from 87.10% in 2014 to 86.08% in 2015 (Local Regulation 6/2016 on Semarang City Mid-Term Development Plan year 2016-2021/ Peraturan Daerah Nomor 6

Journal of Regional and Rural Development Planning, Oktober 2018, 2 (3): 283-293
I. Fajariyah, A. Indrayati & N. Hikmah 284
Tahun 2016 tentang RPJMD Kota Semarang Tahun 2016-2021), not yet optimally handling municipal waste problem (Hariyanto, 2014), as well as less optimal utilization of disaster detection devices on urban drainage networks such as handling coastal flood case (Sariffuddin, 2015). Moreover, the capacity of drainage system and water pumps in the Sub City Center III area has not been well utilized (Hayati, 2013).
Smart city is a concept of urban development and management with the use of technology to connect, monitor, and control various resources within the city more effectively in order to maximize services to its citizens and to support sustainable development (Supangkat et al., 2015). Referring to the concept of Hammond's geography study (1985) in Indrayati (2010), spatial organization by humans and Geographic Information System (GIS) technology can support the implementation of smart city, as the opinion of Roche (2014):
“GIScience can also support smart cities by dramatically enhancing the digital city dimension, and in particular the urban informational infrastructure.”
Dusseldrop in Setiawan et al. (2016) suggests that one important factor in regional development is the space aspect. Therefore, spatial understanding is needed to identify and analyze the availability of smart city infrastructure as an effort to understand how far the implementation of smart city concept has been.
Problems in smart city infrastructure that caused the gap in infrastructure provision in each district in Semarang City demanded the need of good city infrastructure management (Indrayati, 2011). This research was conducted in 2017 with objectives: (1) to identify the availability of smart city infrastructure in Semarang City, (2) to understand human resources support in infrastructure operation and utilization in general, and (3) to provide direction for improvement and development of spatial infrastructure in smart city concept in Semarang City.
METHODOLOGY
This research uses quantitative descriptive research with secondary data analysis in order to understand the availability of urban infrastructure and qualitative analysis to understand human resource support. Semarang City was chosen as a research location because it is one of the city being intensively applying the concept of smart city, with ICT-based urban infrastructure component that supports the implementation of smart city. Unit of analysis related to the focus of research in this case is 16 districts in Semarang City. The variable in this research is the availability of smart city infrastructure with sub-variable: (1) road network infrastructures, which includes Area Traffic Control System (ATCS), Bus Rapid Transit (BRT) shelters, and automatic parking machines, (2) drainage infrastructures, which includes pump houses and early warning system, (3) clean water infrastructures, which includes reservoirs and online payment booths, (4) waste infrastructures, which includes Material Recovery Facility (MRF), biogas processing facilities, and garbage trucks, (5) electricity infrastructures, which includes power plants and online payment booths, (6) other public infrastructures, which includes free internet area and CCTV. Data were collected through secondary data collection from related institutions such as Transportation Agency, Information and Communication Services (Dinas Komunikasi dan Informatika), Public Works Service (Dinas Pekerjaan Umum), Development Planning Agency At Sub-National Level (Badan Perencanaan dan Pembangunan Daerah), Environmental Services (Dinas Lingkungan Hidup), Regional Revenue Agency (Badan Pendapatan Daerah), Spatial Planning Agency (Dinas Tata Ruang), Regional Disaster Management Agency (Badan Penanggulangan Bencana Daerah), National Electricity Company (Perusahaan Listrik Negara) and Local Water Company (Perusahaan Daerah Air Minum), interview with informants at each agency, together with field observation. Data analysis techniques used
Journal of Regional and Rural Development Planning, Oktober 2018, 2 (3): 283-293
285 Availability of Urban Infrastructure...
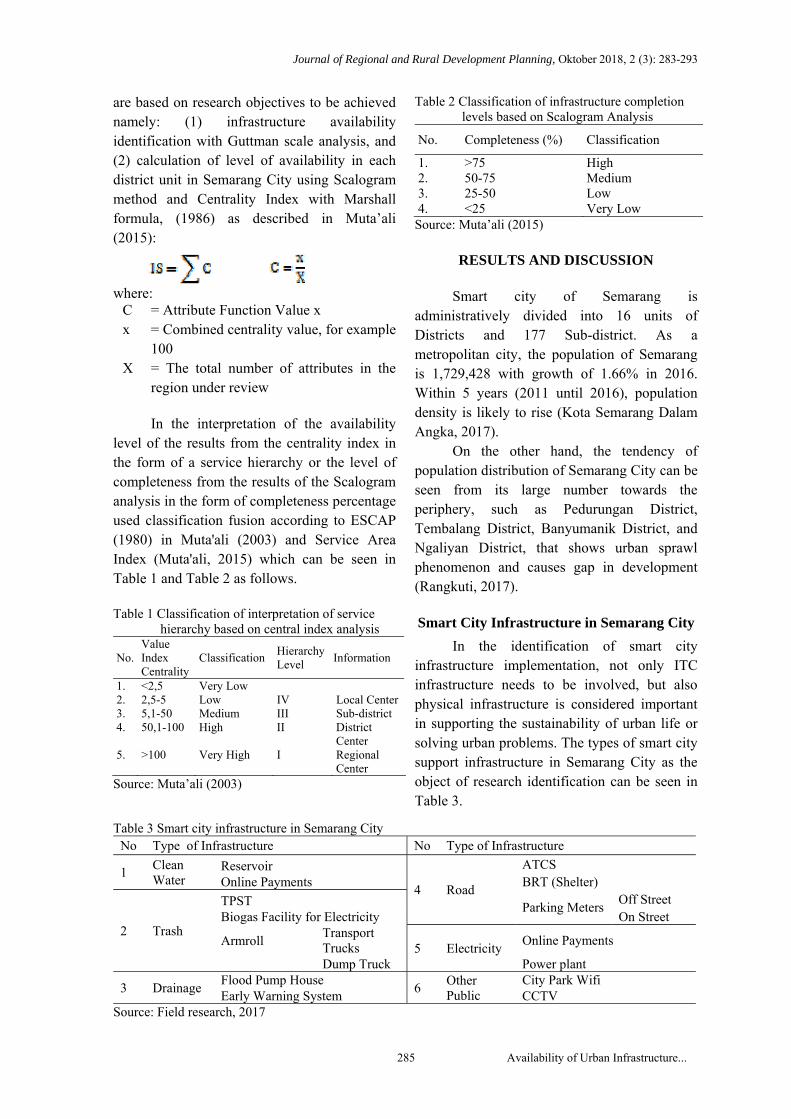
are based on research objectives to be achieved namely: (1) infrastructure availability identification with Guttman scale analysis, and (2) calculation of level of availability in each district unit in Semarang City using Scalogram method and Centrality Index with Marshall formula, (1986) as described in Muta’ali (2015):
where:
C = Attribute Function Value x x = Combined centrality value, for example
100 X = The total number of attributes in the
region under review
In the interpretation of the availability level of the results from the centrality index in the form of a service hierarchy or the level of completeness from the results of the Scalogram analysis in the form of completeness percentage used classification fusion according to ESCAP (1980) in Muta'ali (2003) and Service Area Index (Muta'ali, 2015) which can be seen in Table 1 and Table 2 as follows. Table 1 Classification of interpretation of service
hierarchy based on central index analysis
No. Value Index Centrality
Classification Hierarchy Level
Information
1. <2,5 Very Low 2. 2,5-5 Low IV Local Center 3. 5,1-50 Medium III Sub-district 4. 50,1-100 High II District
Center 5. >100 Very High I Regional
Center Source: Muta’ali (2003)
Table 2 Classification of infrastructure completion levels based on Scalogram Analysis
No. Completeness (%) Classification
1. >75 High 2. 50-75 Medium 3. 25-50 Low 4. <25 Very Low
Source: Muta’ali (2015)
RESULTS AND DISCUSSION
Smart city of Semarang is administratively divided into 16 units of Districts and 177 Sub-district. As a metropolitan city, the population of Semarang is 1,729,428 with growth of 1.66% in 2016. Within 5 years (2011 until 2016), population density is likely to rise (Kota Semarang Dalam Angka, 2017).
On the other hand, the tendency of population distribution of Semarang City can be seen from its large number towards the periphery, such as Pedurungan District, Tembalang District, Banyumanik District, and Ngaliyan District, that shows urban sprawl phenomenon and causes gap in development (Rangkuti, 2017). Smart City Infrastructure in Semarang City
In the identification of smart city infrastructure implementation, not only ITC infrastructure needs to be involved, but also physical infrastructure is considered important in supporting the sustainability of urban life or solving urban problems. The types of smart city support infrastructure in Semarang City as the object of research identification can be seen in Table 3.
Table 3 Smart city infrastructure in Semarang City No Type of Infrastructure No Type of Infrastructure
1 Clean Water
Reservoir
4 Road
ATCS Online Payments BRT (Shelter)
2 Trash
TPST Parking Meters Off Street
Biogas Facility for Electricity On Street
Armroll
Transport Trucks 5 Electricity
Online Payments
Dump Truck Power plant
3 Drainage Flood Pump House
6 Other Public
City Park Wifi Early Warning System CCTV
Source: Field research, 2017
Journal of Regional and Rural Development Planning, Oktober 2018, 2 (3): 283-293
I. Fajariyah, A. Indrayati & N. Hikmah 286
Availability of Smart City Infrastructure with Guttman Scale Analysis
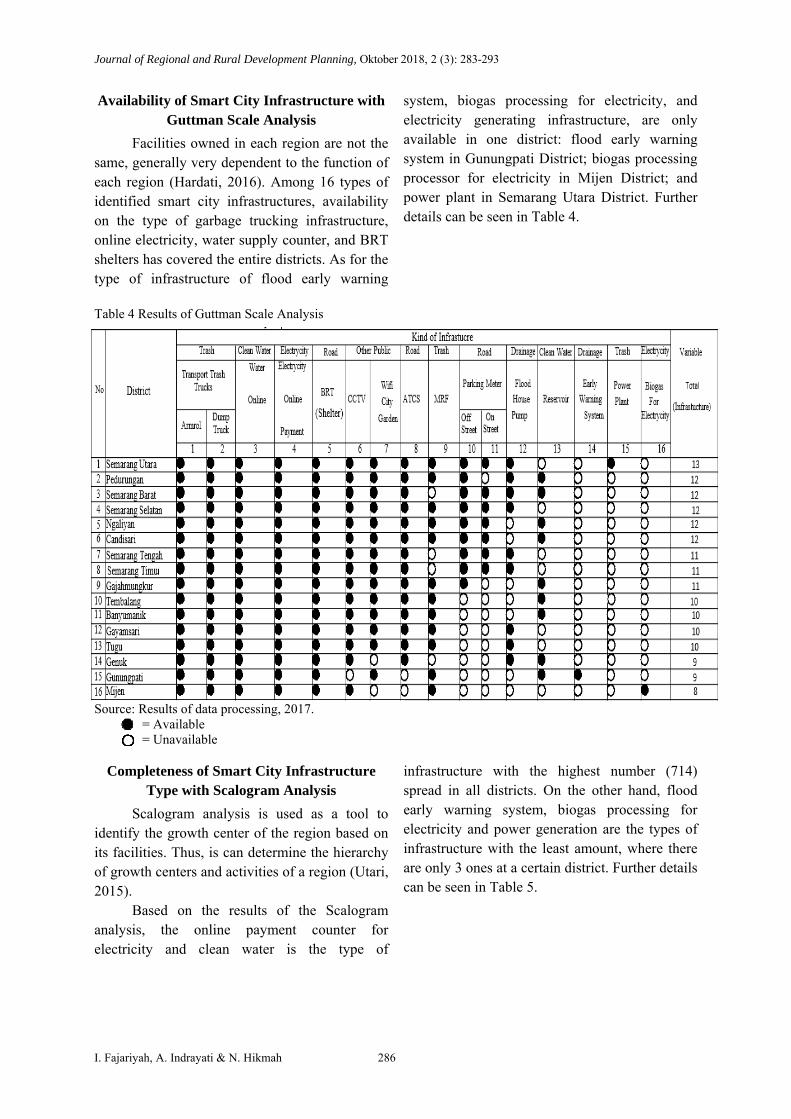
Facilities owned in each region are not the same, generally very dependent to the function of each region (Hardati, 2016). Among 16 types of identified smart city infrastructures, availability on the type of garbage trucking infrastructure, online electricity, water supply counter, and BRT shelters has covered the entire districts. As for the type of infrastructure of flood early warning
system, biogas processing for electricity, and electricity generating infrastructure, are only available in one district: flood early warning system in Gunungpati District; biogas processing processor for electricity in Mijen District; and power plant in Semarang Utara District. Further details can be seen in Table 4.
Table 4 Results of Guttman Scale Analysis
Source: Results of data processing, 2017. = Available
= Unavailable
Completeness of Smart City Infrastructure Type with Scalogram Analysis
Scalogram analysis is used as a tool to identify the growth center of the region based on its facilities. Thus, is can determine the hierarchy of growth centers and activities of a region (Utari, 2015).
Based on the results of the Scalogram analysis, the online payment counter for electricity and clean water is the type of
infrastructure with the highest number (714) spread in all districts. On the other hand, flood early warning system, biogas processing for electricity and power generation are the types of infrastructure with the least amount, where there are only 3 ones at a certain district. Further details can be seen in Table 5.

Journal of Regional and Rural Development Planning, Oktober 2018, 2 (3): 283-293
287 Availability of Urban Infrastructure...
Table 5 Results of Scalogram for Centrality Index Analysis Table 5 Advanced
Source: Results of data processing, 2017. Completeness level (%) ≥75: High; 50-75: Medium; 25-50: Low; <25: Very Low

Journal of Regional and Rural Development Planning, Oktober 2018, 2 (3): 283-293
I. Fajariyah, A. Indrayati & N. Hikmah 288
From the calculation results, it is found that there is no district that has the level of completeness of facilities of 100%. The classification of the level of completeness of infrastructure in each district in Semarang City ranges between medium (50% -75%) and high (> 75%) can be seen in Figure 1.
The Hierarchy of Smart City Infrastructure Services with Central Index
Analysis
The calculation of Centrality Index and interpretation of results referring to the classification of ESCAP (1980) in Muta’ali (2015) can be seen in Table 4. The hierarchy of areas in Semarang City is classified into 4.
Figure 1 Map of infrastructure completeness level of smart city of Semarang City

Journal of Regional and Rural Development Planning, Oktober 2018, 2 (3): 283-293
289 Availability of Urban Infrastructure...
Table 6 Determination of regional hierarchy and classification of infrastructure
Source: Results of data processing, 2017
Referring to the views of Hariyanto and Tukidi (2007), unloading the concept of regional development in Indonesia is based on several theories. In line with that statement, the emergence of the service hierarchy is the development of Christaller's service center theory (1993) that can be used as the basis for identifying smart city implementation. In addition, GIS technology can support the implementation of smart city, as Roche’s opinion (2014):
“GIScience can also support smart cities by dramatically enhancing the digital city dimension, and in particular the urban informational infrastructure.”
Districts in hierarchy I have centrality index more than 1336.79, which consists of Pedurungan District, Semarang Tengah, and Tembalang Districts. Districts in hierarchy II
have centrality index between 983.98 and 1335.79, which are North Semarang District, South Semarang District, Banyumanik District, and West Semarang District. Districts in hierarchy III have centrality index between 631.17 and 982.98, which are Ngaliyan District, East Semarang District, Candisari District, and Gayamsari District. Districts in hierarchy IV have centrality index below 630.17, which are Genuk District, Gajahmungkur District, Mijen District, Tugu District, and Gunungpati District. Pedurungan District has the highest Centrality Index of 1685.60 with the largest population of 203,866 inhabitants and located in the hierarchy I. Meanwhile, Gunungpati District has the lowest Centrality Index of 278.36 with a population of 109,445 inhabitants andlocated in hierarchy IV. The hierarchy of service areas is presented in the map seen in Figure 2.
No District Total Population
Centrality Index
Hierarchy Centrality Value
Centrality
1 Pedurungan 203866 1685.60 I 4.13 Low 2 Semarang Tengah 60375 1546.13 I 3.79 Low 3 Tembalang 194231 1355.55 I 3.32 Low 4 Semarang Utara 118158 1296.39 II 3.18 Low 5 Semarang Selatan 69684 1217.19 II 2.98 Low 6 Banyumanik 155994 1200.06 II 2.94 Low 7 Semarang Barat 161054 1173.34 II 2.87 Low 8 Ngaliyan 153844 791.68 III 1.94 Very Low 9 Candisari 75946 643.26 III 1.58 Very Low 10 Gayamsari 79394 641.59 III 1.57 Very Low
11 Semarang Timur 74861 640.21 III 1.57 Very Low 12 Genuk 110786 580.34 IV 1.42 Very Low 13 Gajahmungkur 59960 558.03 IV 1.37 Very Low 14 Mijen 69789 411.25 IV 1.01 Very Low 15 Tugu 32041 322.94 IV 0.79 Very Low 16 Gunungpati 109445 278.36 IV 0.68 Very Low Semarang City 1729428 14341.92 35.14 Medium

Journal of Regional and Rural Development Planning, Oktober 2018, 2 (3): 283-293
I. Fajariyah, A. Indrayati & N. Hikmah 290
Figure 2 Map of service area hierarchy based on Semarang City Centrality Index
All Districts in Semarang City have Centrality Indexes ranging from very low to low category, while Semarang City's Centrality Index is in the medium category with a value of 35.14.
Direction of Basic Urban Infrastructure Development in Efforts to Implement Smart City Concept in Semarang City
Based on the analysis of completeness and the centrality value of Semarang City, it is discovered that despite the Centrality Index of Semarang City is on medium classification, there is no centralization in one district, but infrastructure development is rather focused in some districts close to the city center or
governmental areas and areas with the highest concentration of population. The development of smart city infrastructure needs to be directed to the southern and western regions (the service hierarchy III and IV). This direction is in accordance with research conducted by Firmansyah et al. (2016) that the development of outskirts or areas outside the center of Semarang City allows to emerge a new growth center. The southern region of Gunungpati District a threshold population (Universitas Negeri Semarang) as Sub City Center VIII with the main function as education development area, so it is necessary to develop smart city infrastructure with the purpose of services effectiveness. Secondly, the western region of

Journal of Regional and Rural Development Planning, Oktober 2018, 2 (3): 283-293
291 Availability of Urban Infrastructure...
Mijen Districts, Tugu Districts, and Ngaliyan Districts have a primary function as the development of public service offices and industrial development, and with large areas can allow to accommodate the population flows from the city core/city center. The rapid development of urban areas is strongly influenced by factors of proximity to other urban areas with higher hierarchy (Riyanto et al., 2014). Direction of Human Resources Development
in Effort to Realize Smart City of Semarang City
The direction of human resource development in the effort to establish the smart city of Semarang City as support and improve the effectiveness of the utilization of infrastructure can be realized by conducting technology training to the operator as needed and socialization to the community in terms of: (1) the existence and manner of utilization of smart city infrastructure, both physical infrastructure and software applications; (2) discipline in usage and maintenance of infrastructure. Based on the results of interview and qualitative analysis, the Area Traffic Control System (ATCS) infrastructure of human resources throughout the district needs to be developed on the knowledge of the application usage. Free internet area infrastructure and quality of human resources that needs to be improved is in Pedurungan District and Gajahmungkur District with socialization in terms of the use and maintenance discipline. In the early warning system infrastructure, the need for training and socialization in terms of use and maintenance, especially is in Gunungpati District. While in Garbage Power Plant (PLTSa) infrastructure in Mijen District which has not reached operational stage.
Improvement of the quality of human resources role needs to be done by training the use and maintenance as well as socialization of the existence of the tool.
CONCLUSION AND RECOMMENDATIONS
Based on the research that has been
conducted in Semarang City, the conclusions are as follows: 1. The availability of smart city infrastructure
in Semarang City is included in medium category with IS = 35.14. That is, the availability is spread evenly in each district or there is no concentration of facilities in one district, where the 16 districts are divided into 4 hierarchy of service areas. The completeness of the 16 districts identified types of infrastructure ranged from medium (50-75%) to high (>75%).
2. Human resources support can be seen in involvement in smart city infrastructure operations, from development stage to monitoring stage. In addition, the utilization of smart city infrastructure in general in Semarang City can be quite effective as in Area Traffic Control System (ATCS), off-street meter parking, early warning system, online payment counter, and free Wi-Fi area, while for Garbage Power Plant (PLTSa), CCTV, and parking meter on- street have not been known the effectiveness because they have not reached the operational stage yet.
The development of smart city
infrastructure needs to be directed to the southern and western regions located in the III and IV service hierarchy such as Gunungpati District, Mijen District, Tugu District, and Ngaliyan District, so that smart city infrastructure implementation can be more evenly distributed in Semarang City.

Journal of Regional and Rural Development Planning, Oktober 2018, 2 (3): 283-293
I. Fajariyah, A. Indrayati & N. Hikmah 292
REFERENCES Firmansyah, R. A., Hariyanto, & Ariyani I.
(2016). Dinamika Sistem Kota-Kota dan Pemilihan Alternatif Pusat Pertumbuhan Baru di Kota Semarang. Jurnal Geo Image 5 (2), 46-51.
Hardati, P. (2016). Hirarki Pusat Pelayanan Di Kecamatan Ungaran Barat dan Ungaran Timur Kabupaten Semarang. Jurnal Geografi, 13 (2) 205-224.
Hariyanto. (2014). Pengelolaan Sampah di Kota Semarang Untuk Menuju Kota Bersih. Jurnal Geografi, 11 (2), 237-246.
Hariyanto & Tukidi. (2007). Konsep Pengembangan Wilayah dan Penataan Ruang Indonesia di Era Otonomi Daerah. Jurnal Geografi, 4 (1), 1-10.
Hayati, R. (2013). Kajian Kerentanan Penghidupan Terhadap Fenomena Rob di Bagian Wilayah Kota (BWK) III Kota Semarang. Jurnal Geomedia, 11 (2), 171-181.
Indrayati, A. (2010). Studi Manajemen Infrastruktur Perkotaan Berbasis Komunitas Kasus: Manajemen MCK Komunal di Bantaran Sungai Kota Yogyakarta. Tesis. Yogyakarta: Universitas Gadjah Mada.
Indrayati, A. (2011). Pola Distribusi Keruangan MCK Komunal dan Hubungannya dengan Kawasan Kumuh di Perkotaan Yogyakarta. Jurnal Geografi, 8 (1), 54-63.
Muta’ali, L. (2003). Studi Penentuan Desa-Desa Pusat Pertumbuhan Di Propinsi Daerah Istimewa Yogyakarta. Majalah Geografi Indonesia, 17 (1), 33-51.
Muta’ali, L. (2015). Teknik Analisis Regional Untuk Perencanaan Wilayah, Tata Ruang dan Lingkungan. Yogyakarta: Badan Penerbit Fakultas Geografi Universitas Gadjah Mada.
Purnomo, F. Meyliana, & Harjanto P. (2015). Smart City Indicators: A Systematic Literature Review. Journal of Telecomunication, Electronic and Computer Engineering, 8 (3), 161-164.
Rangkuti, H. A., Erni S. & Rahma H. (2017). Analisis Pertumbuhan Urban Sprawl di Kecamatan Banyumanik Tahun 2005-2015. Jurnal Geo Image 6 (2),.82-88.
Riyanto, M. W., Moch. A., & Sriyono. (2014). Analisis Pengaruh Pertumbuhan Penduduk Terhadap Perkembangan Permukiman di Kecamatan Gajahmungkur Kota Semarang Tahun 2002-2012. Jurnal Geo Image 3 (2), 1-7.
Roche, S. (2014). Geographic Information Science I: Why does a smart city need to be spatially enabled? Progress in Human Geography Journal, 38 (5), 703-711.
Sariffuddin, S. (2015). Peluang Pengembangan Smart City Untuk Mewujudkan Kota Tangguh di Kota Semarang. Teknik, 36 (1), 32-38.
Setiawan, Didi., Z. S., & Ulfa M. (2016). Analisis Fungsi Pelayanan Kecamatan-Kecamatan di Bagian Timur Kabupaten Konawe Selatan. Jurnal Ekonomi, 1 (1), 44-55.
Siswanto, A., Saptono P, & Heri T. (2012). Kajian Tingkat Kemacetan Lalulintas Pada Jaringan Jalan Yang Menjadi Akses Masuk Kota Semarang. Jurnal Geo Image 1 (1). 82-88.
Supangkat, S. H., et al. (2015). Pengenalan dan Pengembangan Smart City. Bandung: e-Indonesia Initiatives Institut Teknologi Bandung.
Utari, M. G. Endang S. (2015). Analisis Sistem Pusat Pelayanan Permukiman di Kota Yogyakarta Tahun 2014. Journal of Economics and Policy, 8 (1), 62-72.

Journal of Regional and Rural Development Planning, Oktober 2018, 2 (3): 283-293
293 Availability of Urban Infrastructure...
Yuliani, Y. & Marwi R. (2015). Kinerja Pelayanan Air Bersih Berbasis Masyarakat Di Kelurahan Tugurejo Kota Semarang. Jurnal Pengembangan Kota, 3 (1), 11-25.
Badan Pusat Statistik Kota Semarang. (2017). Kota Semarang Dalam Angka 2017. Accessed from https://semarangkota. bps.go.id/publication/2017/08/22/cd4154b3f544577a453a252a/kota-semarang-dalam-angka-2017.html (12 Okt.2017)
Pemerintah Kota Semarang. (2016). Rencana Pembangunan Jangka menengah Daerah Kota Semarang Tahun 2016-2021. Accessed from http://bappeda. semarangkota.go.id/rpjmd (24 Nov. 2016).