Embed Size (px)
Citation preview
Acta Geodyn. Geomater., Vol. 11, No. 4 (176), 305–315, 2014
DOI: 10.13168/AGG.2014.0016
journal homepage: http://www.irsm.cas.cz/acta
ORIGINAL PAPER
PRELIMINARY INTERPRETATION OF DETERMINED MOVEMENTS OF KSIA AND KSI1 GPS STATIONS IN CONTEXT OF COLLECTED INFORMATION ABOUT
ŚWIEBODZICE TROUGH TECTONICS
Ryszard ZDUNEK 1)*, Marek KACZOROWSKI 1), Damian KASZA 2) and Roman WRONOWSKI 1)
1) Space Research Centre, Polish Academy of Sciences, Bartycka 18A Str., 00-716 Warsaw, Poland 2) Wroclaw University of Technology, Institute of Mining Engineering, Na Grobli 15 Str., 50-421 Wroclaw, Poland
*Corresponding author‘s e-mail: [email protected]
ABSTRACT
The new contribution is continuation and extension of the investigations associated with GPS permanent station of the Geodynamic Laboratory in Książ (LG), which were published in ActaGeodynamica et. Geomaterialia (Zdunek, 2012). The GPS Station in Książ (KSIA) was established in 2010 to support our investigations of recent tectonic activity of ŚwiebodziceDepression. After two years long epoch of very weak tectonic signals, the instruments of LG observed the following epoch of tectonic activity, which was manifested by strong effects of tiltings and vertical motions of foundation. Strong irregular non-tidal signals, registered after 2009, show that the tectonic components changed their characteristics in time as well as in amplitudes domains. On the basis of results of 3 years long GPS data series we determined velocity vector of KSIA station and it was compared with velocity vectors of selected reference stations. Those stations are located in different azimuths and different distances from the KSIA station and are established on different tectonic units. Velocities of all selected GPS stationswere compared with velocities obtained from other solutions and with vectors calculated on the basis of existing geodynamic and satellite models of tectonic plates. On account of furtherinterpretation, in the underground, the geodetic network was established in order to determine trends and dips of recognized faults in the LG corridors. Some of the faults manifestcontemporary activity. The results of 3 years long GPS data elaboration show different displacements of the Świebodzice Depression, Książ unit in relation to selected GPS stations. Significant deformation of the Pełcznica river meander, geological indicators such as trends and dips of faults as well as kinematic models of deformations of Książ massif indicate possible interpretation of the reasons of differences of KSIA GPS station displacements. The obtained results suggest directions and methods of further research of tectonic activity using newmeasurement technics and technologies applied inside and outside the Laboratory.
ARTICLE INFO
Article history:
Received 24 February 2014 Accepted 6 September 2014 Available online 6 October
Keywords: GPS technique Station velocity vector Non-tidal signals Recent tectonic activity Tectonic geology Long water-tube tiltmeters Tectonic faults Sudeten tectonic activity
saturation is very stable in time, such strong hydrological effects are not possible. Similarly loading effect of air pressure variations were excluded because of magnitudes and time of duration of the phenomena. Also activity of mines was excluded on account of too long distance between Książ laboratory and the mines (>50 km). The phenomenon of gravity spilled of Książ massif also does not explain the observed effects, which show clear relaxation phase.Collected information on the phenomenon, as well as increasing of length of data series confirmed that irregularly occuring periodic non-tidal signals registered by WT are of tectonic origin. The effects of tiltings and vertical motions of foundation are observed during the tectonic events. Characteristic course of the phenomena and their high repeatability can confirm relationship between observed effects and tectonic motions in the Sudeten Mountains region (Kaczorowski, 2009a). Observed by WT tectonic deformations of sub-millimeter order, limits the possibility of application of GPS/GNSS satellite technique for direct verification and comparative works of tectonic phenomena. Nevertheless, this
1. INTRODUCTION
The registration of geodynamic signals in Geodynamic Laboratory in Książ (LG) started in 1974. Since that time strong signals were irregularly occuring, which changed positions of equilibrium of the pendulums. These effects reminded us the tilting of foundation, but on account of constitution of quartz pendulums, it was difficult to separate these signals from the instrumental drift (Chojnicki, Blum, 1996). Installation in 2003 in LG laboratory of two long water-tube tiltmeters (WT) radically changed this situation. The new instruments have sensitivity of three orders higher than the sensitivity of the pendulums and the possibility of reducing the instrumental drift (Kaczorowski, 2006). Shortly after beginning of measurements it turned out that the irregular signals of strong variations of water level in hydrodynamic system of WT correspond to tilting of foundation of 300 m.a.s. magnitude. All the effects except tectonic activity were practically excluded as the source of these signals. Because the structure of Książ massif consists of non-absorbent rocks or, if they are even partly saturated rocks – their level of
R. Zdunek et al.
306
Fig. 1 Plots of tectonic signals from channels 01-02. In the figure the increase of numbers of tectonic events in period 2009-2013 is shown. Red dots indicates very strong (500 m.a.s.) event.
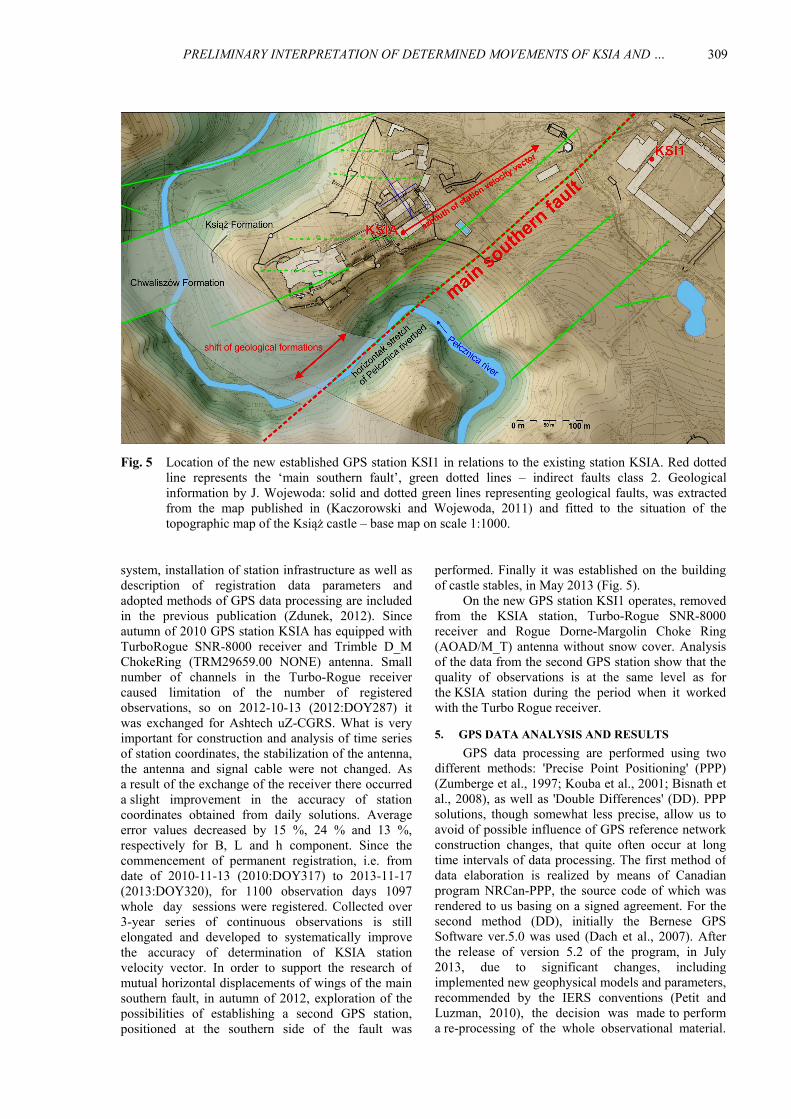
the ‘main southern fault’, provides us with new information about tectonic processes. Activity of the ‘main southern fault’ can stimulate activity of indirect faults of the massif, which are distributed under hydrodynamic system of WT. At present, the only possibility of monitoring tectonic effects on the ‘main fault’ is provided by application of GPS permanent stations, which are located in relatively short distance (400m) and on the opposite wings of the ‘main southern fault’. The new GPS station (KSI1) was established on the building of castle stables in May 2013. We expect that both GPS stations (KSIA and KSI1) will provide us with information on the ‘main fault’ tectonic motions and will help us in evaluation of the effect of regional stresses accumulation.
2. TECTONIC SIGNALS REGISTERED BY THE
WATER-TUBES TILTMETERS
The water-tube tiltmeters are the main source of information concerning tectonic activity in LG. In period of 2004-2007 the water-tube tiltmeters registered five events of very strong signals with maximum amplitude of 300 mas (ten times greater than the tidal signals). The signals of water level changes had a very similar and characteristic course of events which presents a very complicated picture (Kaczorowski, 2007).
The tectonic phenomena affect the water-tube tiltmeters through tiltings and vertical motions of foundation. In data series of tectonic signals it was possible to distinguish significant double-phase character of tectonic phenomenon as well as simultaneous appearance of tectonic signals on both tiltmeters, situated perpendicularly each other. Until 2007 the signals observed on tiltmeter 01-02 contained events of simultaneous decreasing of water level on both ends of the tube of instrument. In several
satellite technique was applied for determination of KSIA station velocities, expressed in the geocentric reference frame (ITRF2008) and for their comparison with velocities of selected referential stations. These stations, which were selected for further discussion, are distributed in different distances and in different azimuths from KSIA station and are situated on regional geological units. Until the end of 2013 KSIA station registered over three years long data series on the basis of which velocity vector was determined and applied by us in the first attempt of interpretation. The analyses of GPS data series provided us with important geodynamic information in respect to the possibility of stresses accumulation in unit of Świebodzice Depression, as caused by changes of relative distances between surrounding tectonic units and Świebodzice Tough (Teisseyre, 1951; Teisseyre et al., 1965). Generally, accumulation of stresses in orogen manifests in form of tectonic activity. In this issue we consider no seismic process of displacements on faults in Książ massif. After two years of low tectonic activity, i.e. since 2009, there was initiated significant increasing of the number of tectonic events and changes of proportions between magnitudes of signals registered on both tiltmeters as well as in order of these signals appearance. One of the main components of tectonic structure in Książ massif and in the surroundings of Geodynamic Laboratory is the provisionally called by us and only for our local kinematic model purposes ‘main southern fault’. We expect that displacements of wings of the ‘main fault’ may be ten times or more greater than the displacements observed by WT on the indirect faults. Displacements on the indirect faults are only transformation of horizontal motion component and therefore ought to be much smaller. This circumstance enhances chance, that the GPS stations, monitoring of
PRELIMINARY INTERPRETATION OF DETERMINED MOVEMENTS OF KSIA AND … .
307
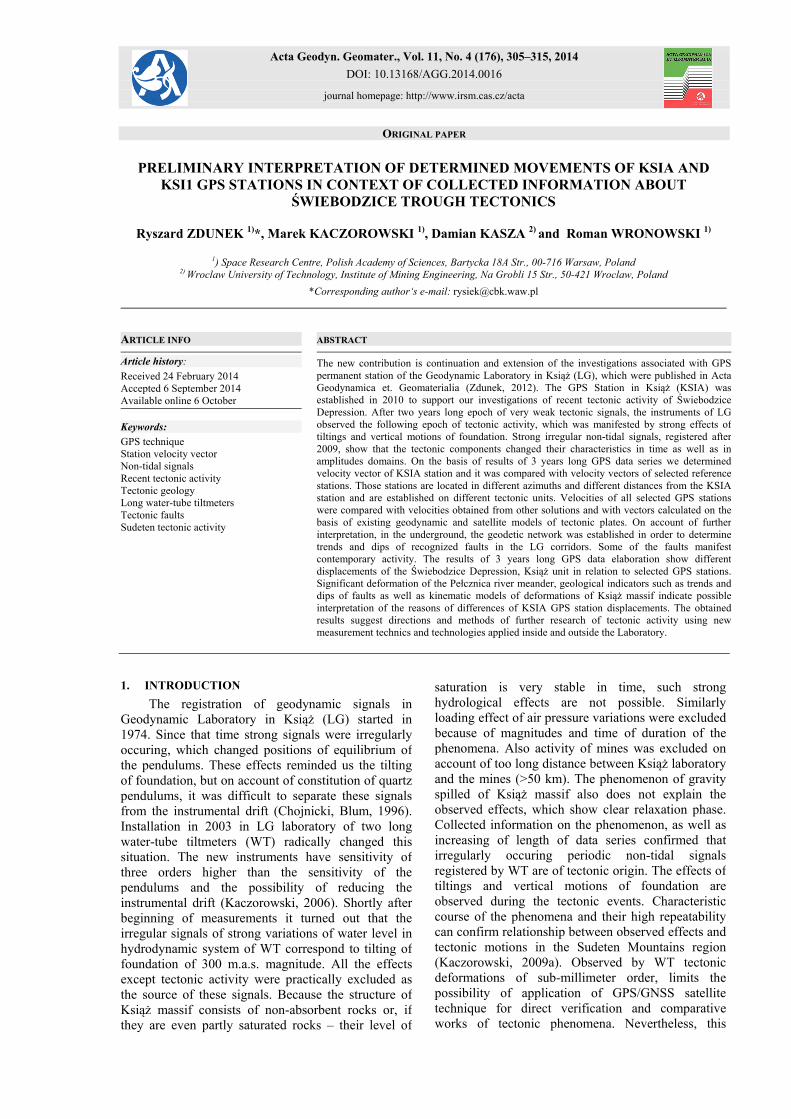
Fig. 2 Plots of tectonic signals from channels 3-04. In the figure the increase of numbers of tectonic events in period 2009-2013 is shown.
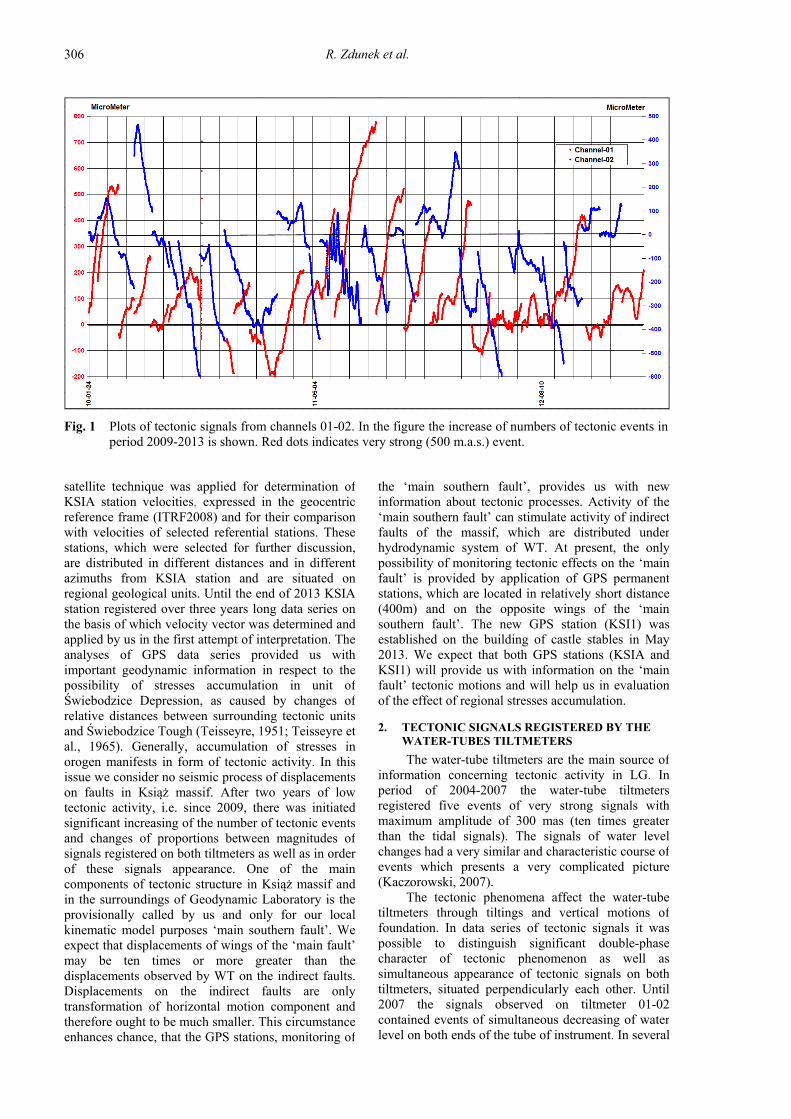
Fig. 3 Event from February 2010 with similar course of events from the preceding epoch.
foundation. In the period of 2007-2009 there occurs an interval of low level of tectonic activity, during which almost no tectonic signals were observed. Since 2009 there follows significant increase of frequency of tectonic events (Fig. 1 and Fig. 2). In March 2010 one extremely strong effect amounting to 500 m.a.s., occurred on tiltmeter 01-02 (Fig. 1), the previous signals on which were weaker than the signals on tiltmeter 03-04. In this time strong tectonic effects indicate small changes in the course of events. On tiltmeter 01-02 there was a slight increase inamplitude of registered signals, compared to the previous period, before 2007. However, after 2009 we still can observe events, the course of which reminded the events from the previous epoch (Fig. 3).
cases the tilting effects preceded the effects of vertical motions of foundation. Together with increase of the number of registered tectonic events and acquire of knowledge about geological structure of Książ massif, improvements were made in kinematic models describing the tectonic phenomenon. Initial model with simple tilting of foundation as well as model with vertical motions on single fault, which crossed tubes of tiltmeters, did not allow to explain the observed water level variations (Kaczorowski and Wojewoda, 2011). Until 2007 the five-elements model provided correct description of water level variations during the tectonic event and it also explained all characteristic moments of water level variations in tiltmeters, caused by vertical motions and tiltings of
R. Zdunek et al.
308
This thesis is motivated by changes of faults activity observed after 2009 by WT tiltmeters (see Chapter 2.).
We construct the three dimensional kinematic model of Książ castle hill massif with strike of faults in order to better recognize this situation. The kinematic model will provide us with better determination of influence of tectonic activity on water-tube tiltmeters. At the present stage of ourresearch on the phenomena and effects recorded by the measuring equipment installed in LG Książ, an attempt was made to build the simplest kinematic model describing the behavior of the fragments of the massif (block) of rock, in which are hollowed the underground corridors of our laboratory and which at the same time would be able to describe and explainthe complexity of these strong signals. This model, of course, must be at the most consistent with the realconditions that exist in this physical space. Massif, on which the Książ castle is built is surrounded on three sides by the valley of Pełcznica river. To a depth ofapprox. 100 meters (LG lab is sitted at a depth ofapprox. 50 m under the buildings of the castle) we cantreat it as partially relaxed rock mass and attempt tomodel the mutual displacements of individualfragments of rock, carried out on existing crackssurfaces and faults. In this part the massif would not be subject to any rheological processes directly, that does not mean that they may not occur in the deeper layers, located under the level of the Pełcznica river bed. From the study of the terrain topography we canexpect that the only direction of the origin of source ofstress in the upper layer of rock-mass is North or North-East. From the same analysis of topography, we noted a strong deformation of the meander of the Pełcznica river, which, from the South-East in relationto the Książ castle, instead of bending the line of close to cycloid shape, it bends almost at right angles. Such a meander shape indicates the possibility of the occurrence of the fault location, on which would occurthis type of deformation. In the literature, there are geological notes and maps, on which are inscribed the faults routes which can confirm this thesis. If that is the case, then the generated stress in the upper layers of the crust could be compensated (discharged) through the interaction of the two wings of the fault. In view of our current research capabilities, first we try to detect possible activity of the ‘main southern fault’, with potentially the greatest deformations, especially in horizontal component, and due to the fact that we have two GPS receivers installed on both wings of the so-called ‘main southern fault’. We have also made the effort to place the precise measuring equipment inside the LG, which possibly indicates the existence of much smaller movements on the indirect faults, which are recognized and measured inside the underground corridors of the laboratory.
4. GPS STATIONS IN LG (KSIA AND KSI1)
Detailed description of conditions of selection of the site for installation and mounting of GPS antenna
3. INVENTORY OF RECOGNIZED FAULTS IN MASSIF OF KSIĄŻ LG
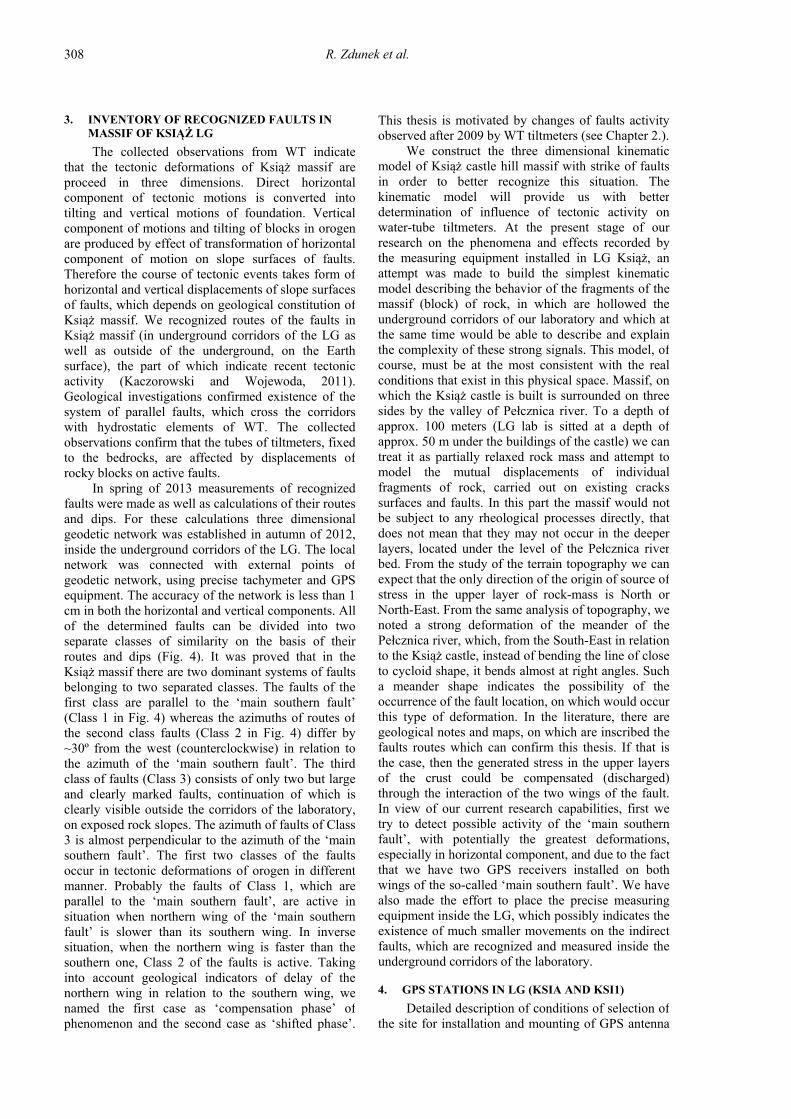
The collected observations from WT indicate that the tectonic deformations of Książ massif are proceed in three dimensions. Direct horizontal component of tectonic motions is converted into tilting and vertical motions of foundation. Vertical component of motions and tilting of blocks in orogen are produced by effect of transformation of horizontal component of motion on slope surfaces of faults. Therefore the course of tectonic events takes form of horizontal and vertical displacements of slope surfaces of faults, which depends on geological constitution of Książ massif. We recognized routes of the faults in Książ massif (in underground corridors of the LG as well as outside of the underground, on the Earth surface), the part of which indicate recent tectonic activity (Kaczorowski and Wojewoda, 2011). Geological investigations confirmed existence of the system of parallel faults, which cross the corridors with hydrostatic elements of WT. The collected observations confirm that the tubes of tiltmeters, fixed to the bedrocks, are affected by displacements of rocky blocks on active faults.
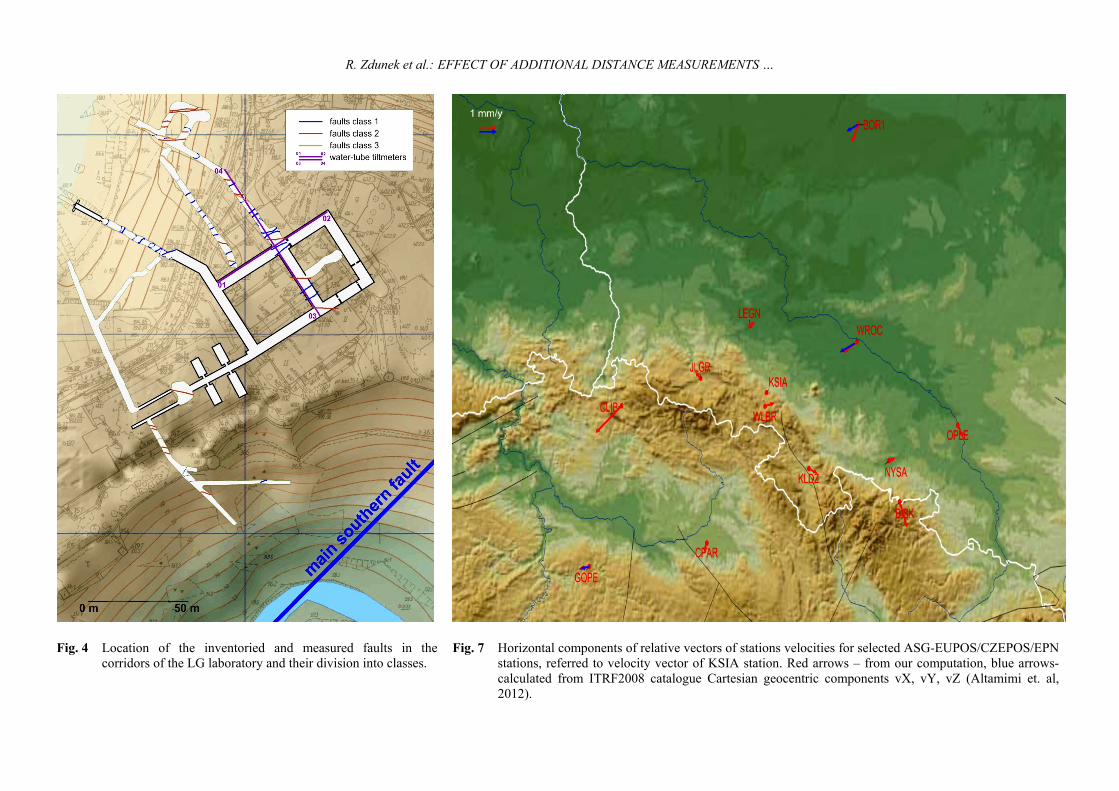
In spring of 2013 measurements of recognized faults were made as well as calculations of their routes and dips. For these calculations three dimensional geodetic network was established in autumn of 2012, inside the underground corridors of the LG. The local network was connected with external points of geodetic network, using precise tachymeter and GPS equipment. The accuracy of the network is less than 1 cm in both the horizontal and vertical components. All of the determined faults can be divided into two separate classes of similarity on the basis of their routes and dips (Fig. 4). It was proved that in the Książ massif there are two dominant systems of faults belonging to two separated classes. The faults of the first class are parallel to the ‘main southern fault’ (Class 1 in Fig. 4) whereas the azimuths of routes of the second class faults (Class 2 in Fig. 4) differ by ~30º from the west (counterclockwise) in relation to the azimuth of the ‘main southern fault’. The third class of faults (Class 3) consists of only two but large and clearly marked faults, continuation of which is clearly visible outside the corridors of the laboratory, on exposed rock slopes. The azimuth of faults of Class 3 is almost perpendicular to the azimuth of the ‘main southern fault’. The first two classes of the faults occur in tectonic deformations of orogen in different manner. Probably the faults of Class 1, which are parallel to the ‘main southern fault’, are active in situation when northern wing of the ‘main southern fault’ is slower than its southern wing. In inverse situation, when the northern wing is faster than the southern one, Class 2 of the faults is active. Taking into account geological indicators of delay of the northern wing in relation to the southern wing, we named the first case as ‘compensation phase’ of phenomenon and the second case as ‘shifted phase’.
PRELIMINARY INTERPRETATION OF DETERMINED MOVEMENTS OF KSIA AND … .
309
Fig. 5 Location of the new established GPS station KSI1 in relations to the existing station KSIA. Red dotted line represents the ‘main southern fault’, green dotted lines – indirect faults class 2. Geological information by J. Wojewoda: solid and dotted green lines representing geological faults, was extractedfrom the map published in (Kaczorowski and Wojewoda, 2011) and fitted to the situation of the topographic map of the Książ castle – base map on scale 1:1000.
performed. Finally it was established on the building of castle stables, in May 2013 (Fig. 5).
On the new GPS station KSI1 operates, removedfrom the KSIA station, Turbo-Rogue SNR-8000 receiver and Rogue Dorne-Margolin Choke Ring (AOAD/M_T) antenna without snow cover. Analysis of the data from the second GPS station show that thequality of observations is at the same level as for the KSIA station during the period when it workedwith the Turbo Rogue receiver.
5. GPS DATA ANALYSIS AND RESULTS
GPS data processing are performed using two different methods: 'Precise Point Positioning' (PPP)(Zumberge et al., 1997; Kouba et al., 2001; Bisnath et al., 2008), as well as 'Double Differences' (DD). PPP solutions, though somewhat less precise, allow us to avoid of possible influence of GPS reference network construction changes, that quite often occur at long time intervals of data processing. The first method of data elaboration is realized by means of Canadian program NRCan-PPP, the source code of which was rendered to us basing on a signed agreement. For the second method (DD), initially the Bernese GPS Software ver.5.0 was used (Dach et al., 2007). After the release of version 5.2 of the program, in July 2013, due to significant changes, including implemented new geophysical models and parameters, recommended by the IERS conventions (Petit and Luzman, 2010), the decision was made to perform a re-processing of the whole observational material.
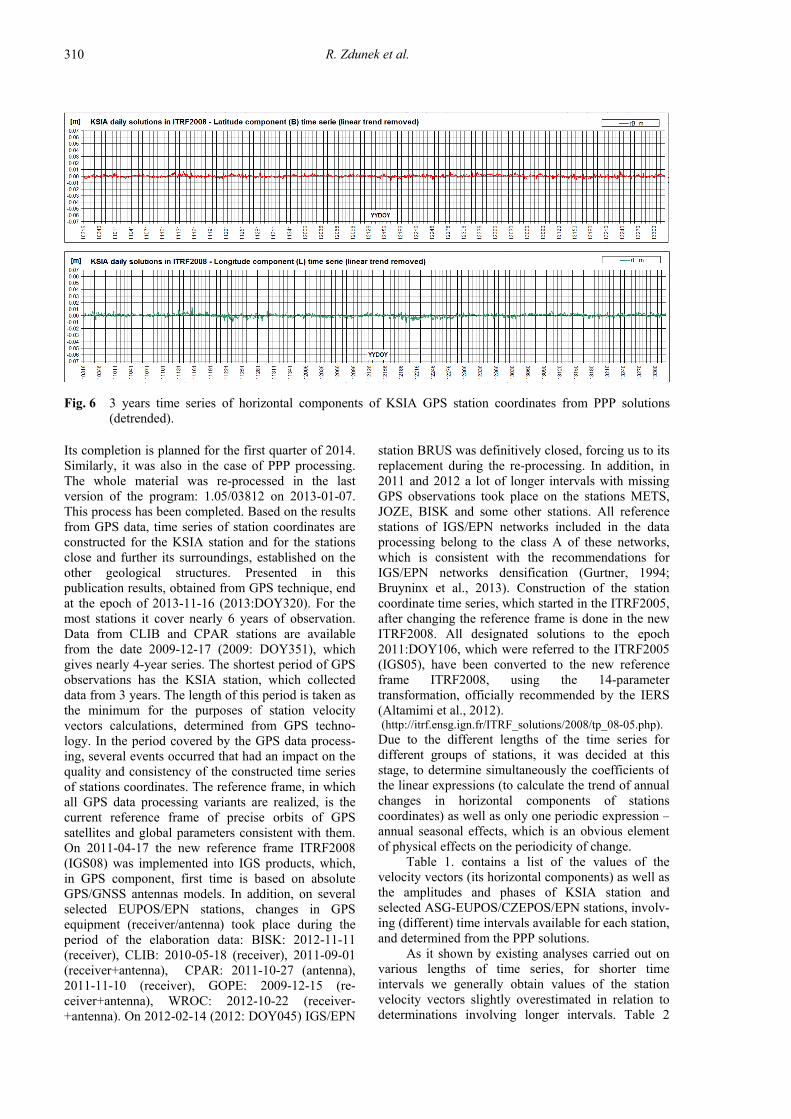
system, installation of station infrastructure as well as description of registration data parameters and adopted methods of GPS data processing are included in the previous publication (Zdunek, 2012). Since autumn of 2010 GPS station KSIA has equipped with TurboRogue SNR-8000 receiver and Trimble D_M ChokeRing (TRM29659.00 NONE) antenna. Small number of channels in the Turbo-Rogue receiver caused limitation of the number of registered observations, so on 2012-10-13 (2012:DOY287) it was exchanged for Ashtech uZ-CGRS. What is very important for construction and analysis of time series of station coordinates, the stabilization of the antenna,the antenna and signal cable were not changed. As a result of the exchange of the receiver there occurred a slight improvement in the accuracy of stationcoordinates obtained from daily solutions. Averageerror values decreased by 15 %, 24 % and 13 %, respectively for B, L and h component. Since the commencement of permanent registration, i.e. from date of 2010-11-13 (2010:DOY317) to 2013-11-17 (2013:DOY320), for 1100 observation days 1097 whole day sessions were registered. Collected over 3-year series of continuous observations is still elongated and developed to systematically improvethe accuracy of determination of KSIA station velocity vector. In order to support the research of mutual horizontal displacements of wings of the mainsouthern fault, in autumn of 2012, exploration of the possibilities of establishing a second GPS station, positioned at the southern side of the fault was
R. Zdunek et al.
310
Fig. 6 3 years time series of horizontal components of KSIA GPS station coordinates from PPP solutions (detrended).
station BRUS was definitively closed, forcing us to its replacement during the re-processing. In addition, in 2011 and 2012 a lot of longer intervals with missing GPS observations took place on the stations METS, JOZE, BISK and some other stations. All reference stations of IGS/EPN networks included in the data processing belong to the class A of these networks, which is consistent with the recommendations forIGS/EPN networks densification (Gurtner, 1994;Bruyninx et al., 2013). Construction of the stationcoordinate time series, which started in the ITRF2005, after changing the reference frame is done in the new ITRF2008. All designated solutions to the epoch2011:DOY106, which were referred to the ITRF2005(IGS05), have been converted to the new reference frame ITRF2008, using the 14-parameter transformation, officially recommended by the IERS (Altamimi et al., 2012). (http://itrf.ensg.ign.fr/ITRF_solutions/2008/tp_08-05.php). Due to the different lengths of the time series for different groups of stations, it was decided at this stage, to determine simultaneously the coefficients of the linear expressions (to calculate the trend of annual changes in horizontal components of stations coordinates) as well as only one periodic expression –annual seasonal effects, which is an obvious element of physical effects on the periodicity of change.
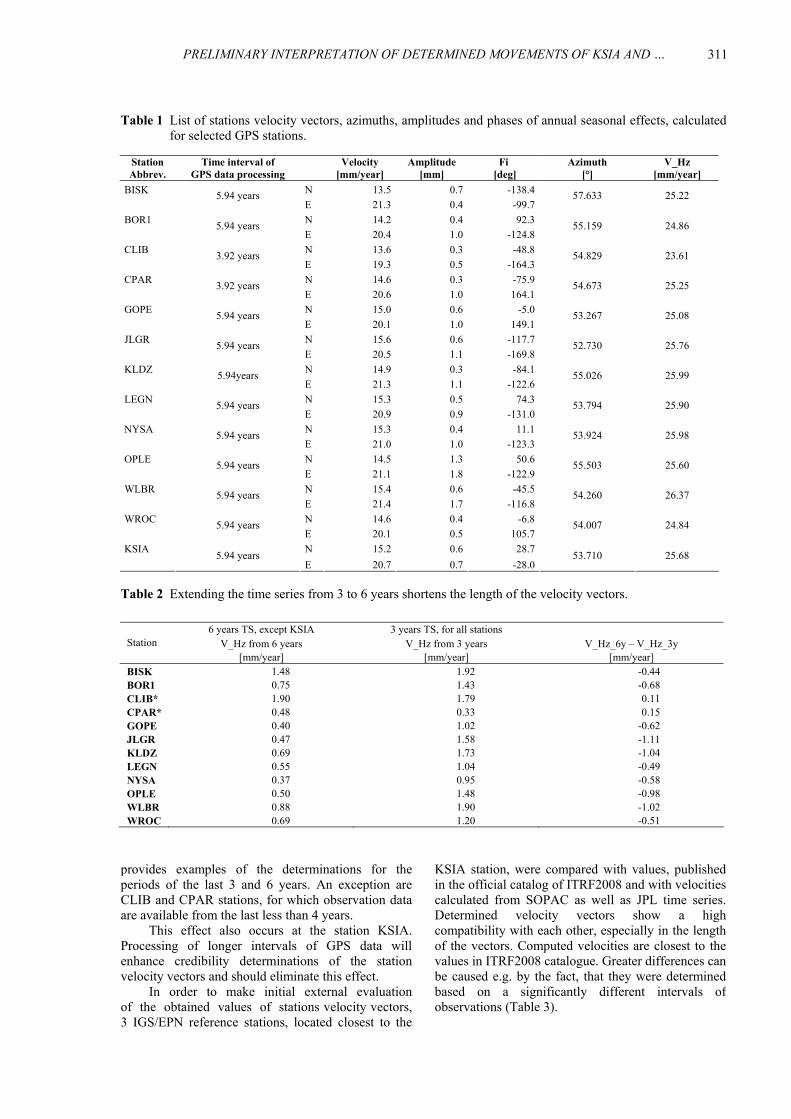
Table 1. contains a list of the values of the velocity vectors (its horizontal components) as well as the amplitudes and phases of KSIA station andselected ASG-EUPOS/CZEPOS/EPN stations, involv-ing (different) time intervals available for each station, and determined from the PPP solutions.
As it shown by existing analyses carried out on various lengths of time series, for shorter time intervals we generally obtain values of the station velocity vectors slightly overestimated in relation to determinations involving longer intervals. Table 2
Its completion is planned for the first quarter of 2014. Similarly, it was also in the case of PPP processing. The whole material was re-processed in the last version of the program: 1.05/03812 on 2013-01-07. This process has been completed. Based on the results from GPS data, time series of station coordinates are constructed for the KSIA station and for the stations close and further its surroundings, established on the other geological structures. Presented in this publication results, obtained from GPS technique, end at the epoch of 2013-11-16 (2013:DOY320). For the most stations it cover nearly 6 years of observation. Data from CLIB and CPAR stations are available from the date 2009-12-17 (2009: DOY351), which gives nearly 4-year series. The shortest period of GPS observations has the KSIA station, which collected data from 3 years. The length of this period is taken as the minimum for the purposes of station velocity vectors calculations, determined from GPS techno-logy. In the period covered by the GPS data process-ing, several events occurred that had an impact on the quality and consistency of the constructed time series of stations coordinates. The reference frame, in which all GPS data processing variants are realized, is the current reference frame of precise orbits of GPS satellites and global parameters consistent with them. On 2011-04-17 the new reference frame ITRF2008 (IGS08) was implemented into IGS products, which, in GPS component, first time is based on absolute GPS/GNSS antennas models. In addition, on several selected EUPOS/EPN stations, changes in GPS equipment (receiver/antenna) took place during the period of the elaboration data: BISK: 2012-11-11 (receiver), CLIB: 2010-05-18 (receiver), 2011-09-01 (receiver+antenna), CPAR: 2011-10-27 (antenna), 2011-11-10 (receiver), GOPE: 2009-12-15 (re-ceiver+antenna), WROC: 2012-10-22 (receiver-+antenna). On 2012-02-14 (2012: DOY045) IGS/EPN
PRELIMINARY INTERPRETATION OF DETERMINED MOVEMENTS OF KSIA AND … .
311
Table 1 List of stations velocity vectors, azimuths, amplitudes and phases of annual seasonal effects, calculatedfor selected GPS stations.
Station Abbrev.
Time interval of GPS data processing
Velocity
[mm/year] Amplitude
[mm] Fi
[deg] Azimuth
[°] V_Hz
[mm/year]
BISK N 13.5 0.7 -138.4
5.94 years
E 21.3 0.4 -99.757.633 25.22
BOR1 N 14.2 0.4 92.3
5.94 years
E 20.4 1.0 -124.855.159 24.86
CLIB N 13.6 0.3 -48.8
3.92 years
E 19.3 0.5 -164.354.829 23.61
CPAR N 14.6 0.3 -75.9
3.92 years
E 20.6 1.0 164.154.673 25.25
GOPE N 15.0 0.6 -5.0
5.94 years
E 20.1 1.0 149.153.267 25.08
JLGR N 15.6 0.6 -117.7
5.94 years
E 20.5 1.1 -169.852.730 25.76
KLDZ N 14.9 0.3 -84.1
5.94years
E 21.3 1.1 -122.655.026 25.99
LEGN N 15.3 0.5 74.3
5.94 years
E 20.9 0.9 -131.053.794 25.90
NYSA N 15.3 0.4 11.1
5.94 years
E 21.0 1.0 -123.353.924 25.98
OPLE N 14.5 1.3 50.6
5.94 years
E 21.1 1.8 -122.955.503 25.60
WLBR N 15.4 0.6 -45.5
5.94 years
E 21.4 1.7 -116.854.260 26.37
WROC N 14.6 0.4 -6.8
5.94 years
E 20.1 0.5 105.754.007 24.84
KSIA N 15.2 0.6 28.7
5.94 years
E 20.7 0.7 -28.053.710 25.68
Table 2 Extending the time series from 3 to 6 years shortens the length of the velocity vectors.
6 years TS, except KSIA 3 years TS, for all stations V_Hz from 6 years V_Hz from 3 years V_Hz_6y – V_Hz_3y Station
[mm/year] [mm/year] [mm/year] BISK 1.48 1.92 -0.44 BOR1 0.75 1.43 -0.68 CLIB* 1.90 1.79 0.11 CPAR* 0.48 0.33 0.15 GOPE 0.40 1.02 -0.62 JLGR 0.47 1.58 -1.11 KLDZ 0.69 1.73 -1.04 LEGN 0.55 1.04 -0.49 NYSA 0.37 0.95 -0.58 OPLE 0.50 1.48 -0.98 WLBR 0.88 1.90 -1.02 WROC 0.69 1.20 -0.51
KSIA station, were compared with values, published in the official catalog of ITRF2008 and with velocities calculated from SOPAC as well as JPL time series. Determined velocity vectors show a high compatibility with each other, especially in the length of the vectors. Computed velocities are closest to the values in ITRF2008 catalogue. Greater differences can be caused e.g. by the fact, that they were determined based on a significantly different intervals of observations (Table 3).
provides examples of the determinations for the periods of the last 3 and 6 years. An exception are CLIB and CPAR stations, for which observation data are available from the last less than 4 years.
This effect also occurs at the station KSIA. Processing of longer intervals of GPS data willenhance credibility determinations of the station velocity vectors and should eliminate this effect.
In order to make initial external evaluation of the obtained values of stations velocity vectors, 3 IGS/EPN reference stations, located closest to the
R. Zdunek et al.
312
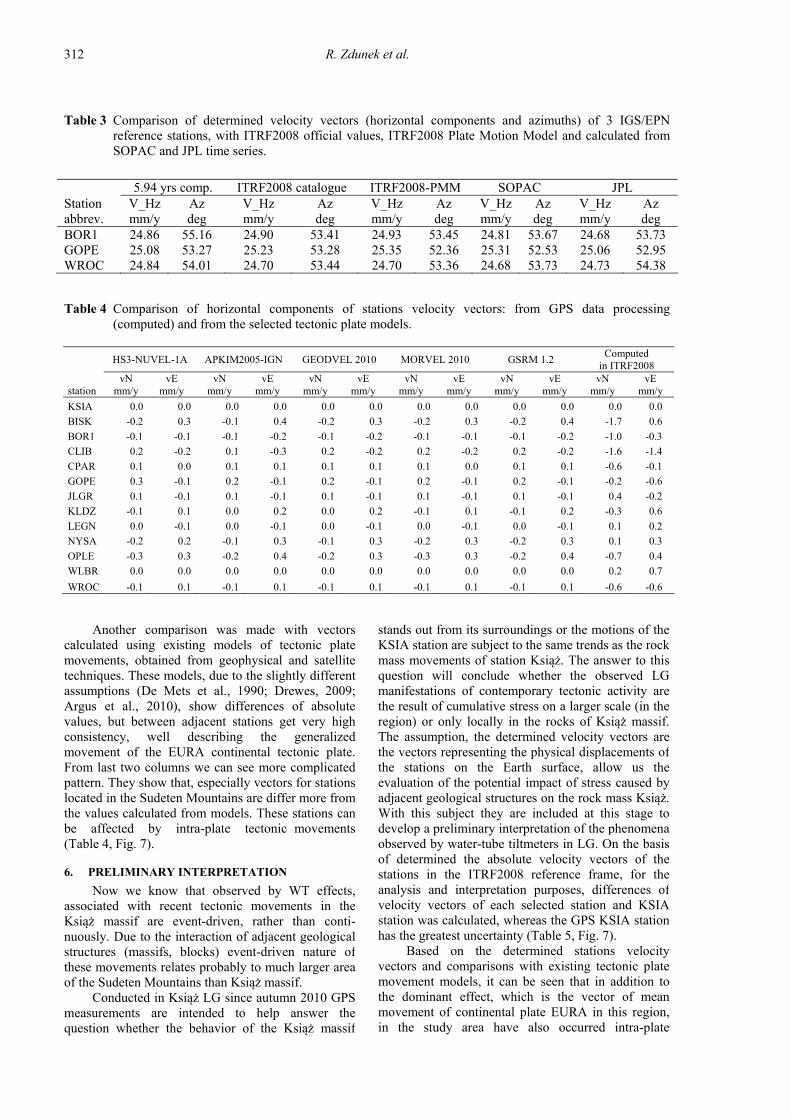
Table 3 Comparison of determined velocity vectors (horizontal components and azimuths) of 3 IGS/EPN reference stations, with ITRF2008 official values, ITRF2008 Plate Motion Model and calculated from SOPAC and JPL time series.
5.94 yrs comp. ITRF2008 catalogue ITRF2008-PMM SOPAC JPL Station abbrev.
V_Hz mm/y
Az deg
V_Hz mm/y
Az deg
V_Hz mm/y
Az deg
V_Hz mm/y
Az deg
V_Hz mm/y
Az deg
BOR1 24.86 55.16 24.90 53.41 24.93 53.45 24.81 53.67 24.68 53.73 GOPE 25.08 53.27 25.23 53.28 25.35 52.36 25.31 52.53 25.06 52.95 WROC 24.84 54.01 24.70 53.44 24.70 53.36 24.68 53.73 24.73 54.38
Table 4 Comparison of horizontal components of stations velocity vectors: from GPS data processing (computed) and from the selected tectonic plate models.
HS3-NUVEL-1A APKIM2005-IGN GEODVEL 2010 MORVEL 2010 GSRM 1.2
Computed in ITRF2008
station vN
mm/y vE
mm/y vN
mm/y vE
mm/y vN
mm/y vE
mm/y vN
mm/y vE
mm/y vN
mm/y vE
mm/y vN
mm/y vE
mm/y
KSIA 0.0 0.0 0.0 0.0 0.0 0.0 0.0 0.0 0.0 0.0 0.0 0.0
BISK -0.2 0.3 -0.1 0.4 -0.2 0.3 -0.2 0.3 -0.2 0.4 -1.7 0.6
BOR1 -0.1 -0.1 -0.1 -0.2 -0.1 -0.2 -0.1 -0.1 -0.1 -0.2 -1.0 -0.3
CLIB 0.2 -0.2 0.1 -0.3 0.2 -0.2 0.2 -0.2 0.2 -0.2 -1.6 -1.4
CPAR 0.1 0.0 0.1 0.1 0.1 0.1 0.1 0.0 0.1 0.1 -0.6 -0.1
GOPE 0.3 -0.1 0.2 -0.1 0.2 -0.1 0.2 -0.1 0.2 -0.1 -0.2 -0.6
JLGR 0.1 -0.1 0.1 -0.1 0.1 -0.1 0.1 -0.1 0.1 -0.1 0.4 -0.2
KLDZ -0.1 0.1 0.0 0.2 0.0 0.2 -0.1 0.1 -0.1 0.2 -0.3 0.6
LEGN 0.0 -0.1 0.0 -0.1 0.0 -0.1 0.0 -0.1 0.0 -0.1 0.1 0.2
NYSA -0.2 0.2 -0.1 0.3 -0.1 0.3 -0.2 0.3 -0.2 0.3 0.1 0.3
OPLE -0.3 0.3 -0.2 0.4 -0.2 0.3 -0.3 0.3 -0.2 0.4 -0.7 0.4
WLBR 0.0 0.0 0.0 0.0 0.0 0.0 0.0 0.0 0.0 0.0 0.2 0.7
WROC -0.1 0.1 -0.1 0.1 -0.1 0.1 -0.1 0.1 -0.1 0.1 -0.6 -0.6
stands out from its surroundings or the motions of the KSIA station are subject to the same trends as the rock mass movements of station Książ. The answer to thisquestion will conclude whether the observed LGmanifestations of contemporary tectonic activity are the result of cumulative stress on a larger scale (in the region) or only locally in the rocks of Książ massif.The assumption, the determined velocity vectors are the vectors representing the physical displacements ofthe stations on the Earth surface, allow us the evaluation of the potential impact of stress caused byadjacent geological structures on the rock mass Książ. With this subject they are included at this stage to develop a preliminary interpretation of the phenomena observed by water-tube tiltmeters in LG. On the basisof determined the absolute velocity vectors of the stations in the ITRF2008 reference frame, for the analysis and interpretation purposes, differences ofvelocity vectors of each selected station and KSIA station was calculated, whereas the GPS KSIA station has the greatest uncertainty (Table 5, Fig. 7).
Based on the determined stations velocity vectors and comparisons with existing tectonic plate movement models, it can be seen that in addition tothe dominant effect, which is the vector of mean movement of continental plate EURA in this region,in the study area have also occurred intra-plate
Another comparison was made with vectorscalculated using existing models of tectonic plate movements, obtained from geophysical and satellite techniques. These models, due to the slightly differentassumptions (De Mets et al., 1990; Drewes, 2009;Argus et al., 2010), show differences of absolute values, but between adjacent stations get very highconsistency, well describing the generalizedmovement of the EURA continental tectonic plate. From last two columns we can see more complicated pattern. They show that, especially vectors for stations located in the Sudeten Mountains are differ more from the values calculated from models. These stations can be affected by intra-plate tectonic movements (Table 4, Fig. 7).
6. PRELIMINARY INTERPRETATION
Now we know that observed by WT effects, associated with recent tectonic movements in the Książ massif are event-driven, rather than conti-nuously. Due to the interaction of adjacent geological structures (massifs, blocks) event-driven nature ofthese movements relates probably to much larger areaof the Sudeten Mountains than Książ massif.
Conducted in Książ LG since autumn 2010 GPS measurements are intended to help answer the question whether the behavior of the Książ massif
PRELIMINARY INTERPRETATION OF DETERMINED MOVEMENTS OF KSIA AND … .
313
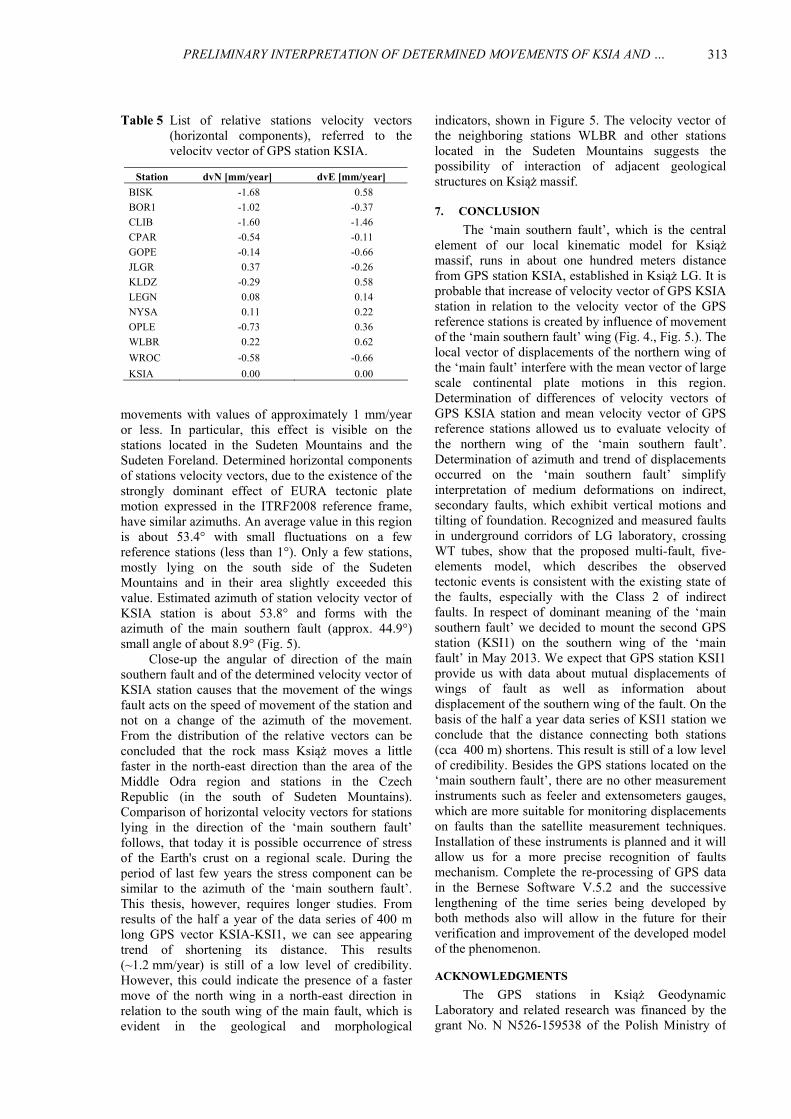
Table 5 List of relative stations velocity vectors (horizontal components), referred to the velocity vector of GPS station KSIA.
Station dvN [mm/year] dvE [mm/year]
BISK -1.68 0.58
BOR1 -1.02 -0.37
CLIB -1.60 -1.46
CPAR -0.54 -0.11
GOPE -0.14 -0.66
JLGR 0.37 -0.26
KLDZ -0.29 0.58
LEGN 0.08 0.14
NYSA 0.11 0.22
OPLE -0.73 0.36
WLBR 0.22 0.62
WROC -0.58 -0.66
KSIA 0.00 0.00
indicators, shown in Figure 5. The velocity vector ofthe neighboring stations WLBR and other stations located in the Sudeten Mountains suggests the possibility of interaction of adjacent geological structures on Książ massif.
7. CONCLUSION
The ‘main southern fault’, which is the central element of our local kinematic model for Książ massif, runs in about one hundred meters distance from GPS station KSIA, established in Książ LG. It is probable that increase of velocity vector of GPS KSIA station in relation to the velocity vector of the GPS reference stations is created by influence of movement of the ‘main southern fault’ wing (Fig. 4., Fig. 5.). The local vector of displacements of the northern wing of the ‘main fault’ interfere with the mean vector of large scale continental plate motions in this region.Determination of differences of velocity vectors of GPS KSIA station and mean velocity vector of GPS reference stations allowed us to evaluate velocity of the northern wing of the ‘main southern fault’. Determination of azimuth and trend of displacements occurred on the ‘main southern fault’ simplify interpretation of medium deformations on indirect, secondary faults, which exhibit vertical motions and tilting of foundation. Recognized and measured faults in underground corridors of LG laboratory, crossingWT tubes, show that the proposed multi-fault, five-elements model, which describes the observedtectonic events is consistent with the existing state of the faults, especially with the Class 2 of indirect faults. In respect of dominant meaning of the ‘main southern fault’ we decided to mount the second GPS station (KSI1) on the southern wing of the ‘main fault’ in May 2013. We expect that GPS station KSI1 provide us with data about mutual displacements of wings of fault as well as information about displacement of the southern wing of the fault. On the basis of the half a year data series of KSI1 station we conclude that the distance connecting both stations (cca 400 m) shortens. This result is still of a low level of credibility. Besides the GPS stations located on the ‘main southern fault’, there are no other measurement instruments such as feeler and extensometers gauges, which are more suitable for monitoring displacements on faults than the satellite measurement techniques. Installation of these instruments is planned and it will allow us for a more precise recognition of faults mechanism. Complete the re-processing of GPS datain the Bernese Software V.5.2 and the successivelengthening of the time series being developed by both methods also will allow in the future for theirverification and improvement of the developed modelof the phenomenon. ACKNOWLEDGMENTS
The GPS stations in Książ Geodynamic Laboratory and related research was financed by the grant No. N N526-159538 of the Polish Ministry of
movements with values of approximately 1 mm/yearor less. In particular, this effect is visible on the stations located in the Sudeten Mountains and the Sudeten Foreland. Determined horizontal components of stations velocity vectors, due to the existence of the strongly dominant effect of EURA tectonic plate motion expressed in the ITRF2008 reference frame, have similar azimuths. An average value in this region is about 53.4° with small fluctuations on a fewreference stations (less than 1°). Only a few stations, mostly lying on the south side of the Sudeten Mountains and in their area slightly exceeded this value. Estimated azimuth of station velocity vector of KSIA station is about 53.8° and forms with the azimuth of the main southern fault (approx. 44.9°) small angle of about 8.9° (Fig. 5).
Close-up the angular of direction of the mainsouthern fault and of the determined velocity vector of KSIA station causes that the movement of the wingsfault acts on the speed of movement of the station and not on a change of the azimuth of the movement.From the distribution of the relative vectors can be concluded that the rock mass Książ moves a little faster in the north-east direction than the area of the Middle Odra region and stations in the Czech Republic (in the south of Sudeten Mountains). Comparison of horizontal velocity vectors for stations lying in the direction of the ‘main southern fault’ follows, that today it is possible occurrence of stress of the Earth's crust on a regional scale. During the period of last few years the stress component can be similar to the azimuth of the ‘main southern fault’. This thesis, however, requires longer studies. From results of the half a year of the data series of 400 m long GPS vector KSIA-KSI1, we can see appearing trend of shortening its distance. This results (~1.2 mm/year) is still of a low level of credibility. However, this could indicate the presence of a fastermove of the north wing in a north-east direction in relation to the south wing of the main fault, which is evident in the geological and morphological
R. Zdunek et al.
314
Kaczorowski, M.: 2006, High-resolution wide-rangetiltmeter: observations of Earth free oscillations excited by the 26 December 2004 Sumatra–Andaman earthquake. In: Earthquake Source Asymmetry, Structural Media and Rotation Effects, Springer-Verlag, Berlin, 493−520.
Kaczorowski, M.: 2007, Preliminary results of investigations of long lasting non-tidal signals observed by horizontal pendulums and long water tube tiltmeters in Low Silesian Geodynamic Laboratory of Polish Academy of Sciences in Książ. Acta Geodyn. Geomater., 4, No. 4 (148), 109–119.
Kaczorowski, M.: 2008, Non-tidal plumb line variations observed with help of the long water-tube and horizontal pendulums tiltmeters in Geodynamic Laboratory of PAS in Książ. Reports on Geodesy, 85, 2, 79–86.
Kaczorowski, M.: 2009a, Discussion on strong non-tidalsignals registered by horizontal pendulums and water tube tiltmeters in Geodynamic Laboratory of PAS in Książ. Acta Geodyn. Geomater., 6, No. 3(155), 369–381.
Kaczorowski, M.: 2009b, Non-tidal signals of plumb line variations observed with help of the long water-tube tiltmeter in Geodynamic Laboratory of PAS in Książ. 16th International Symposium on Earth Tides, 1–5 September 2008, Jena. Bulletin d'Information des Marées Terrestres (BIM), 144, 11605–11613.
Kaczorowski, M. and Wojewoda, J.: 2011, Neotectonic activity interpreted from a long water-tube tiltmeter record at the SRC Geodynamic Laboratory in Książ, Central Sudetes, SW Poland. Acta Geodyn. Geomater., 8, No. 3 (163), 249–261.
Kouba, J. and Héroux, P.: 2001, Precise Point Positioning using IGS orbit and clock products. GPS Solutions, 5, 2, 12–28. DOI: 10.1007/PL00012883
Petit, G. and Luzman, B: 2010, IERS Conventions (2010). IERS Technical Note No. 36, Frankfurt am Main. Verlag des Bundesamts für Kartographie und Geodäsie, 179 pp., paperback.
Teisseyre, H.: 1951, The geological structure of Świebodzice Depression. Annales Societatis Geologorum Poloniae, 21, 4, 380−386, (in Polish).
Teisseyre, H. and Gawroński, O.: 1965, Świebodzice Sheet – Geological Detailed Map of Sudetes onscale 1:25 000, Państwowy Instytut Geologiczny, Warszawa.
Zdunek, R.: 2012, Permanent GPS Station in Książ Geodynamic Laboratory for supporting investigations of neo-tectonic motions in Książ Massif. Acta Geodyn. Geomater., 9. No. 3 (167), 371−377.
Zumberge, J.F., Heflin, M.B., Jefferson, D.C., Watkins, M.M. and Webb, F.H.: 1997, Precise Point Processing for the efficient and robust analysis of GPS data from large networks. J. Geophys. Res., Solid Earth, 102(B3). 5005-5017. DOI: 10.1029/96JB03860
Scientific Research and Information Technology. The water-tube tiltmeters was founded by grants 4-T12E-011-28, N N526- 160536 and earlier.
REFERENCES
Altamimi, Z., Métivier, L. and Collilieux, X.: 2012, ITRF2008 plate-motion model. J. Geophys. Res., 117, B07402. DOI:10.1029/2011JB008930
Altamimi, Z., Collilieux, X. and Métivier, L.: 2012, Analysis and results of ITRF2008. IERS Technical Note No. 37. Verlag des Bundesamts für Kartographie und Geodäsie, Frankfurt am Main.
Altamimi, Z., Collilieux, X., Legrand, J., Garayt, B. and Boucher, C.: 2007, ITRF2005: A new release of the International Terrestrial Reference Frame based on time series of station positions and Earth Orientation Parameters. J. Geophys. Res., 112, B09401. DOI: 10.1029/2007JB004949
Argus, D.F., Gordon, R.G., Heflin, M.B., Ma,C., Eanes, R.J., Willis, P., Peltier, W.R. and Owen, S.E.: 2010, The angular velocities of the plates and the velocity of Earth’s centre from space geodesy. Geophys. J. Int., 180(3), 916–960. DOI:10.1111/j.1365-246X.2009.04463.x
Bisnath, S. and Gao, Y.: 2008, Current state of precise point positioning and future prospects and limitations. International Association of Geodesy Symposia 133.
Bruyninx, C., Altamimi, Z., Caporali, A., Kenyeres, A., Lidberg, M., Stangl, G. and Torres, J. A.: 2013, Guidelines for EUREF densifications. Version 5", (http://www.epncb.oma.be/_documentation/guidelines/Guidelines_for_EUREF_Densifications.pdf )
Chojnicki, T. and Blum, P.A.: 1996, Analysis of ground movements at the Książ observatory in 1974-1993. Artificial Satellites, 31, no. 3, 123−129.
Dach, R., Hugentobler, U., Fridez, S. and Meindl, M. (eds.): 2007, Bernese GPS software version 5.0, Astonomical Institute, University of Bern.
De Mets, C., Gordon, R.G., Argus, D.F. and Stein, S.: 1990, Current plate motion. Geophys. J. Int., 101, no. 2, 425-478. DOI: 10.1111/j.1365-246X.1990.tb06579.x
Drewes, H.: 2009, The actual plate kinematic and crustal deformation model APKIM2005 as basis for a non-rotation ITRF. Geodetic Reference Frames, IAG Symposia, no 134, 95−99.
Gurtner, W.: 1994, The use of IGS products for the densification of regional/local networks. EUREF Publication No. 3, Veröffentlichungen der Bayerischen Kommission für die Internationale Erdmessung, Bayerischen Akademie der Wissenschaften, Munich, 184−199.
Huber, K., Heuberger, F., Abart, Ch., Karabatic, A., Weber, R. and Berglez, P.: 2010, PPP: Precise Point Positioning – constraints and opportunities, FIG Congress 2010, 11-16 April, Sydney, Australia.
R. Zdunek et al.: EFFECT OF ADDITIONAL DISTANCE MEASUREMENTS …
Fig. 4 Location of the inventoried and measured faults in the corridors of the LG laboratory and their division into classes.
Fig. 7 Horizontal components of relative vectors of stations velocities for selected ASG-EUPOS/CZEPOS/EPN stations, referred to velocity vector of KSIA station. Red arrows – from our computation, blue arrows- calculated from ITRF2008 catalogue Cartesian geocentric components vX, vY, vZ (Altamimi et. al, 2012).