Embed Size (px)
Citation preview
Available online at http://afca.apeejay.edu
ENVISION – International Journal of Commerce and Management ISSN: 0973-5976 (Print), 2456-4575 (Online), UGC –Sr. No.62481
VOL-11, 2017
Page | 138
Testing the Weak Form Efficiency of the Indian Stock Market: A Case of
Manufacturing Firms listed on BSE 500 Gurloveleen Kaur
ABSTRACT
The study observed the weak form efficiency of the Indian Stock Market. The existence of
Random walk model had also been studied. The daily data of closing stock prices of 150
manufacturing firms listed on BSE 500 was used. The Descriptive Statistics, ADF test, PP
test, Runs test, Autocorrelation, Correlogram and ARMA model had been applied. The basic
characteristic of the data was checked through descriptive statistics, ADF test and PP test.
The Correlogram was created to see the stationarity and randomness in the data. Similarly,
autocorrelation was applied for observing the random walk of stock market. The weak form
of capital market efficiency had been checked with Runs test and ARMA Model. The study
found that the Indian stock market was weak form efficient and it also followed the random
walk process. Every investor has equal information of the market. The abnormal profits
because of having the extra information cannot be earned by investors.
Keywords: Indian Stock Market, Weak Form Efficient, ADF test, Autocorrelation. ARMA
Model
1. Introduction of Efficient Market Hypothesis
EMH states that the stock market is efficient in adjusting the new information. Whenever,
information that has impact on the performance of the stocks came in the market, the market
immediately adjusts with that and starts behaving according to that. In this case, the investors
are not capable to earn higher profits by using the past information. The same information is
available to all the market participants and everyone have equal access to that. In the words
of Fama, an efficient market is a market where large numbers of rational profit maximizers
actively competing with each other, trying to predict the future market and current
information is almost freely and equally available to all the participants (Bhatt, 2011). The
research work conducted by the prominent researchers like Jules Regnault, 1863, Louis
Bachelier,1900, Alfred Cowles, 1930 and Maurice Kendall, 1953, etc. have proved a close
link in EMH, Random Walk Model and Martingale model.
The concept of EMH was developed by Professor Eugene Fama, University of Chicago
Booth School of Business in his Ph.D. work in 1960. His research work found that the stock
market may be weak form efficient, semi-strong form efficient and strong form efficient
according to the availability of the information. The market participants have to consider this
while investing in the stock market, so that they can save themselves from big losses. A
market is said to be weak form efficient, if historical or past information has no use in
predicting the stock prices. The investors have no need to go for technical and fundamental
analysis to find the profitable stocks. They need to consider the present prices of stocks only
for further investment. In semi strong form, the past plus public information of the companies
is already circulating in the market. This information is available to all the market
participants; no biasness exists in the accessibility of that information in the stock market.
When all past, public and private information is existing in the stock market, no-one is in the
position of earning abnormal profits by using that information and the market is said to be
strong form efficient.
Assistant Professor, Sri Guru Granth Sahib World University, Fatehgarh Sahib, Email: [email protected]

Testing the Weak Form Efficiency of the Indian Stock Market: A Case of Manufacturing Firms listed on BSE 500
ENVISION - International Journal of Commerce and Management, Vol. (11), 2017 Page | 139
In the terms of Fama research work, Weak-form efficiency means ‘How well the past returns
can be used to predict the future returns?’, Semi-strong-form efficiency ‘How speedily do the
security prices replicate the public information related to the announcements of the
companies?’ and Strong-form efficiency ‘Do any investor have private or insider information
that can be used in earning the abnormal profits?’.
A French mathematician Bachelier's had already invented a new theory related to efficiency
of stock market known as ‘Theory of Speculation’ in 1900. His work was almost ignored
until Paul Cootner has edited and published his work in 1964. He started circulating the work
of Bachelier's. Fama also came up with the publication of his research work, claiming for the
random walk model in 1965. He made modifications in his previous work and brought some
evidence proving the efficiency of the market. He has changed the title of the three forms of
efficiency later in his research work and enlarged the scope of information to be considered
while testing the efficiency of the stock markets. Fama renamed weak form efficiency to test
for return predictability, semi-strong to event studies and strong form to tests for private
information in 1970.
In the layman language, EMH theory describes that the performance of stock prices is
entirely free from its historical performance; no-one can predict the prices of stocks by
considering the past data and earns abnormal profits. Any information that will impact the
stock prices is available in the market and everyone has equal option to access the same.
2. Review of Literature
Worthington and Higgs (2006) studied the weak form of market efficiency for ten emerging
markets i.e. China, Indonesia, India, Malaysia, Korea, Philippines, Pakistan, Taiwan, Sri
Lanka and Thailand and five developed markets i.e. Australia, Hong Kong, Japan, New
Zealand and Singapore. The runs test concluded that all the stock markets were observed
weak form inefficient. But, the unit root test found all the markets weak form efficient except
Australia and Taiwan. The results of variance ratio tests indicated that none of the emerging
markets followed any characteristics of the random walk theory and found inefficient. The
markets of Hong Kong, Japan and New Zealand depicted the properties of random walk
model and found efficient.
Joshi (2007) had examined the daily closing price data to explore the dynamics of co-
movement of stock markets of U.S, Brazil, Mexico, China and India. The author used the
daily, weekly and monthly data to analyze the speed of adjustment coefficients from January
1996 to July 2007. The efficiency of the stock market was examined after the major decisions
taken by NSE and SEBI. The long-term relationships among the markets were analyzed using
the Johansen and Juselius multivariate cointegration approach. Short-run dynamics were
captured through vector error correction models. The results revealed that there was an
evidence of co-integration among the markets. It was also found that the speed of adjustment
of Indian stock market was higher than the other stock markets of the world. The results of
event methodology revealed that the stock market had become efficient at information
processing system in recent times after the various regulatory measures taken by the SEBI.
Ray and Sharma (2008) analyzed the efficiency of Indian capital market by selecting the
daily closing prices of two major stock exchanges i.e. BSE and NSE. The researcher selected
the few companies to adjudge the results by focusing on the individual securities index as
compare to market index. The goodness of fit test and runs test for randomness were used to
find the results. The results shown that Indian stock market was weak- form efficient.
Dima and Laura (2009) reviewed the available literature on EMH. The study also tested the
EMH for Bucharest Stock Exchange from 2000 to 2009. The data distribution was found
non-normally distributed through skewness and kurtosis. The portmanteau BDS test was used
Testing the Weak Form Efficiency of the Indian Stock Market: A Case of Manufacturing Firms listed on BSE 500
ENVISION - International Journal of Commerce and Management, Vol. (11), 2017 Page | 140
to find out whether the residuals were independent and identically distributed (iid). The
relationship of superior-order autocorrelation between the data was checked with
correlogram. The Q-statistics highlighted the existence of some superior order
autocorrelation. The null hypothesis constructed to check the independent and identically
distributed (iid) position was rejected. The author asserted that the Romanian stock market
was weak form efficient.
Khan et al. (2011) tested the Indian capital market efficiency in its weak form by employing
the daily closing prices of BSE and NSE. The study was conducted for 10 years from April
2000 to March 2010. The results of run test claimed that the Indian stock market did not
exhibit the random walk process and found weak form inefficient.
Zafar (2012) checked the existence of Efficient Market Hypothesis for BSE listed companies
before the recession. To execute this study, the objective to check the applicability of
efficient market theory in Indian stock market was framed. To fulfilled the objective, the
weekly market prices of thirty listed companies of BSE were collected and analyzed through
Runs test and Autocorrelation test. The low correlation was found with least value changes in
the collected data of 1st January, 2008 to 31
st December, 2008. It was observed that the Indian
stock market was weak form efficient and it followed the theory of random walk.
Arora (2013) tested the weak form efficiency of Indian stock market and random walk model
by taking the daily log returns of CNX Nifty an Index of NSE from 1st Januray, 2000 to 31
st
December, 2011. The results revealed the presence of linear dependence as well as non-
linear dependence and high volatility in the return series. The author did not observe the
existence of random walk model and opined that market was not performing efficiently.
Jain et al. (2013) analyzed the weak form efficiency of Indian stock market by considering
four major stock indices like S & P CNX Nifty, BSE, CNX 100 and S& P CNX 500 during
the global financial crisis period. The entire study was divided into three parts- pre recession
period, recession period and post recession period. The Indian capital market was examined
weak form efficient in all the cases and it followed random walk theory.
Mishra et al. (2014) tested the efficient market hypothesis by employing three unit root tests
along with two structural breaks in the Indian stock market. The monthly data of 19 years for
six indices was used. These indices were NSE Nifty, NSE Nifty Junior, NSE Defty, NSE
CNX 500, BSE Sensex and NSE CNX 500. The study found that the Indian stock indices
were mean reverting.
Njuguna (2016) examined the weak form efficiency of the Tanzania stock market by using
the daily and weekly data from 2006 to 2015. The serial correlation test, unit root tests, runs
test and variance ratio test were used to check the efficiency of Dar es Salaam Stock
Exchange (DSE). The market was found weak form efficient with variance ratio tests and
inefficient with the serial correlation test, unit root tests and runs test. The study produced
mixed results, but assured that efficiency of the market was increased with passage of time.
Hawaldar et al. (2017) studied the weak form of capital market efficiency for individual
stocks listed on Bahrain Bourse for the period of 2011 to 2015. The Kolmogorov-Smirnov
goodness of fit test, runs test and autocorrelation test were employed. The study brought
mixed results, hence, it was difficult to conclude that the market was weak form efficient or
not. The runs test showed that the share prices of seven companies did not follow random
walk and autocorrelation tests found low to moderate correlation in the stock returns.
3. Data and Methodology
3.1 Need of the Study
The main objective of any stock market is to provide a platform to investors and savers. A
place where an investor can easily get the fund for the investment and the savers can save for
Testing the Weak Form Efficiency of the Indian Stock Market: A Case of Manufacturing Firms listed on BSE 500
ENVISION - International Journal of Commerce and Management, Vol. (11), 2017 Page | 141
further capital appreciation. So many questions revolve in the investor’s mind at the time of
taking the investment decision like whether the past information has any relevance in
predicting the future prices or current stock prices are following the past trends, etc. The
efficient market theory states that if the market is efficient, an investor can easily take the
decision without analyzing the historical performance because it assumes all the relevant
information has already been incorporated by the capital markets. Alternatively, the historical
data and information can be analyzed to earn the abnormal profits. So, this research work was
selected for checking the weak form efficiency of Indian capital market.
The study would help the government and regulatory bodies to make the capital market more
efficient, transparent and protect the investor interests. The study might be useful for the
individual investors, institutional investors, portfolio managers and foreign investors, etc.
while taking their investment related decisions.
3.2 Objectives of the Study
The study was done to observe whether the Indian Capital Market is Weak Form Efficient
during the Global Financial Crisis Period or not. The specific objectives of the study are:
To investigate whether the Indian Capital Market is behaving Weak Form Efficient.
To study whether the Indian Capital Market follows the Random Walk Model.
3.3 Scope of the Study
A sample of 150 manufacturing firms listed on BSE 500 was considered for the research.
This sample was picked on the basis of higher closing prices of stocks traded on 31st March,
2015. The report published by National Industrial Classification, 2008 was used to identify
the manufacturing firms. According to that, total 258 firms were fall in this category, as
given below:
Table 3.1
Population Size
Size Number
Large Cap 88
Mid Cap 46
Small Cap 124
Total 258
From the population, a sample of 150 manufacturing firms was picked which can be seen
from the table no. 3.2.
Table 3.2
Sample Size
Size Number
Large Cap 51
Mid Cap 27
Small Cap 72
Total 150
The period of ten years was selected for the study from April 2006 to March 2015. The daily
closing prices of all the chosen manufacturing firms have been collected and their average
values were calculated. Next, the stock returns were calculated by employing the following
formula:
Rt= In (Yt/Yt-1)*100
Here,
Rt = Daily return in the period t, In = natural logarithm, Yt = closing value of a given index on
current trading day (t), Yt-1 = closing value of a given index on preceding trading day
The secondary data was used for the study and taken from the website of money control.

Testing the Weak Form Efficiency of the Indian Stock Market: A Case of Manufacturing Firms listed on BSE 500
ENVISION - International Journal of Commerce and Management, Vol. (11), 2017 Page | 142
The stratified random sampling technique was used. First of all, the manufacturing firms
listed on BSE 500 were picked and out of these 150 firms were selected by creating three
strata’s (large cap, mid cap and small cap) based on market capitalization of the firms. The
proportionate firms from the three strata’s were chosen as given in above table 3.2.
3.4 Research Tools and Techniques
To obtain the results, the various tools and techniques with their objectives were applied. A
brief description of the same is enlisted below:
Table 3.3
Research tools used in the study
Techniques employed Purpose
Descriptive Statistics To observe the data distribution
ADF (Augumented Dickey Fuller) test , PP (Phillips
Perron) test
To check the stationarity of the data
Runs test To detect the Random walk
Autocorrelation and box –Ljung Q Statistics To check the weak form efficiency
Correlogram To find the spikes and structure of the data
ARMA (Autoregressive moving Average) Model To see the impact of past or lagged values on the
current prices along with error terms or to find the best
model which accurately depicts this situation
The above stated research techniques were applied with the most widely used research
software’s, i.e. Eviews and SPSS.
4. Data Analysis and Interpretation
4.1 Descriptive Statistics
Table 4.1 indicates the statistical description of the daily stock prices returns traded on BSE
500 during the study period of April 2006 to March 2015. The values of descriptive statistics
like Mean, Median, Maximum, Minimum, Standard Deviation, Skewness, Kurtosis and
Jarque Bera are given. The distribution of the return series must be normal in case of the
random walk model. The following hypothesis was framed for testing the normal distribution
of data.
Ho: Data series is normally distributed
Table 4.1
Descriptive Statistics
Mean Median Maximum Minimum Std. Dev. Skewness Kurtosis Jarque-Bera Probability
100.13 100.15 224.81 44.94 3.92 15.61 531.66 2.6E+07 0
Source: Computed from the data taken from www.moneycontrol.com
The mean value of 100.13 was observed as indicated in table 4.1 with a median value of
100.15. The median value is considered to be better than the mean value, because it gives
measure that is more reliable in the outlier presence. The maximum value of 224.81 was
found along with the minimum value of 44.94 during the tenure of study. The standard
deviation discloses how far the values are from the mean. The 3.92 value for standard
deviation was analyzed and it appears to be the smaller one. The results explained the least
variation and the values were tightly bunched together.
To check the normality of the data, the Skewness, Kurtosis and Jarque Bera values were
calculated. The data distribution was not found normally distributed as can be seen from the
values of Skewness, Kurtosis and Jarque Bera. The data was observed to be positively
skewed with skewness value of 15.61. The leptokurtic distribution was seen as Kurtosis value
was greater than three. It denotes that the values were more concentrated around the mean,
but with thicker tails. The p-value of the Jarque Bera test was found lesser than the significant
value of 0.05; rejecting the Null hypothesis. Hence, the data series was not found normally
Testing the Weak Form Efficiency of the Indian Stock Market: A Case of Manufacturing Firms listed on BSE 500
ENVISION - International Journal of Commerce and Management, Vol. (11), 2017 Page | 143
distributed. So, the basic assumption of normality of random walk model was not followed by
Indian Stock Market.
4.2 Unit Root
EMH assumes that share prices in stock market follow a random walk process without a drift.
Therefore, it does not provide any opportunity to speculators to speculate the stock market.
The stock prices for the next period are random and unpredictable from the past prices. A unit
root is an essential condition for a random walk. The market can said to be weak form
efficient, if the stock prices follow a unit root. Alternatively, the stock prices are stationary by
nature.
The random walk model does not say, however, the past information is of no value in
assessing distributions of future returns. Indeed since return distributions are assumed to be
stationary through time, past returns are the best source of such information. The random
walk model does say, however, that the sequence (or the order) of the past returns is of no
consequence in assessing distributions of future returns (Fama, 1970).
To check whether the data has a unit root or not, the two tests-ADF and PP tests were
employed. The hypothesis was created as:
H0: The data is not stationary
Table 4.2 and 4.3 show the results of ADF test and PP test. The t-statistics along with its p-
values are given in the following tables from April, 2006 to March, 2015.
Table 4.2
ADF Test
Augmented Dickey-Fuller test statistic
t-Statistic 1% level 5% level 10% level Prob.*
-15.477 -3.4331 -2.8626 -2.5674 0.21
Source: Computed from the data taken from www.moneycontrol.com
The negative t-statistic value of -15.477 was observed with 0.21 p-value as indicated in the
above table. It was analyzed at 1%, 5% and 10% level of significance. The calculated p-value
was found greater than the significant values. Hence, it accepted the Null hypothesis
constructed to check the unit root. The series was observed non - stationary during the study
period. Thereby, the results exhibited the random walk process and the Indian stock market as
weak form efficient.
Table 4.3
PP Test
Phillips-Perron test statistic
Adj. t-Stat 1% level 5% level 10% level Prob.*
-67.317 -3.4331 -2.8626 -2.5674 0.57
Source: Computed from the data taken from www.moneycontrol.com
The above table 4.3 shows the results of PP test. This is a non-parametric test employed to
confirm the existence of unit root in the data. According to the results, the Null hypothesis
was accepted at 1%, 5% and 10% level of significance. The p-value of 0.57 was found
greater than the selected significant values. The data was found non- stationary and the Indian
stock market follows the random walk process. With this, the market was found weak form
efficient, which performs randomly without interruption of its historical performances.
4.3 Runs Test
The actual number of runs is converted into Z statistics through the Runs test. The Z statistics
define the probable difference in the observed and expected number of runs. The series is
considered to be randomly distributed; if the calculated Z value is lying in between +/- 1.96
or it is asymptotic, significant value is found to be significant.
To confirm the randomness or the random walk of Indian stock market, the following
hypothesis was constructed:

Testing the Weak Form Efficiency of the Indian Stock Market: A Case of Manufacturing Firms listed on BSE 500
ENVISION - International Journal of Commerce and Management, Vol. (11), 2017 Page | 144
Null Hypothesis (H0): The observed series is not random or Indian stock market does not
follow random walk
The results of Runs test for the daily stock returns of 150 manufacturing firms listed on BSE
500 are given in table 4.4.
Table 4.4
Runs Test
Test
Value
Cases <
Test Value
Cases >=
Test Value
Total
Cases
Number
of Runs Z
Asymp. Sig. (2-
tailed)
Returns 100.15 1111 1112 2223 974 -5.876 .000
Source: Computed from the data taken from www.moneycontrol.com
The 974 runs and the total 2223 observations were considered in the analysis of study from
April, 2006 to March, 2015. The results of table 4.4 indicate the Z value of -5.876 with
significant value of zero. The negative Z value outside the value of +/- 1.96 was found during
the study period, rejecting the null hypothesis and the observed series was found to be
random. The results claimed that the Indian stock market was efficient, which follows the
random walk process. Therefore, the historical data cannot be employed by the investors to
predict the future returns.
4.4 Autocorrelation Test
If a market is weak-form efficient, then there is no correlation between successive prices, i.e.
the study of historical prices of a particular security cannot consistently be used to achieve
excess returns. In other words technical analysis cannot be used to recognize undervalued or
overvalued stocks. Autocorrelation is a reliable measure for testing the linear dependence or
independence of random variables in the series. If no autocorrelation is found in the series,
the series is considered to be random (Arora, 2013).
Autocorrelation test is mostly used to check the serial dependency in the data which helps in
examining the weak form of capital market efficiency. It examines the correlation between
the return series and lagged series. Besides this, it also measures whether the correlation
coefficients are significantly equal to Zero or not over the different lags. Null hypothesis to
check the autocorrelation in the series is given below, as:
Null Hypothesis (H0): Indian Stock Market is not weak form efficient
Table 4.5 shows the results of autocorrelation and Box LJung Q Statistics for the daily returns
of BSE 500 from April 2006 to March 2015. The sixteen lags were considered for the
analysis of study.
Table 4.5
Autocorrelations and Box-LJung Q Statistic
Lag 1 2 3 4 5 6 7 8 9 10 11 12 13 14 15 16
Autocorrelation -0.292 -0.038 0.001 -0.005 0.007 -0.016 0.009 -0.004 0.077 -0.08 0.036 0.004 0.015 0.003 0 0.004
Std. Errora 0.021 0.021 0.021 0.021 0.021 0.021 0.021 0.021 0.021 0.021 0.021 0.021 0.021 0.021 0.021 0.021
Box-Ljung
Statistic/ Q
Statistics
Value 189.568 192.71 192.713 192.779 192.89 193.454 193.648 193.693 206.806 220.944 223.834 223.875 224.376 224.403 224.403 224.448
Sig.b 0 0 0 0 0 0 0 0 0 0 0 0 0 0 0 0
Source: Computed from the data taken from www.moneycontrol.com
The stock markets are considered to be weak form efficient if the calculated p-values are
lesser than the critical value of 0.05. Secondly, the entire autocorrelation coefficients are
equal to zero. If this situation persists in the market, the past information is not helpful for
ascertaining future consequences. From the table, it can be seen that the autocorrelation value
Testing the Weak Form Efficiency of the Indian Stock Market: A Case of Manufacturing Firms listed on BSE 500
ENVISION - International Journal of Commerce and Management, Vol. (11), 2017 Page | 145
for the 15th
lag was found zero. Otherwise, the negative and positive autocorrelation values
closer to zero were observed.
The Null hypothesis was rejected as the calculated p-values of Q statistics for all the lags
from lag 1 to lag 16 were found lesser than 5% level of significance. The standard error was
observed consistent over different lags. Overall, the results confirmed the randomness in
stock returns. The Indian stock market was found to be weak form efficient, which
confirmed that the historical information had no impact on the current prices and could not be
used for predicting the future prices.
The memory in stock market returns is due to its auto-correlation (ACF) and partial auto
correlation (PACF) functions, which forms a part of the identification of a suitable ARMA
(Autoregressive Integrated Moving Average) model (Arora, 2013).
4.5 ARMA MODEL
Correlogram was generated to exhibit the stationarity or non-stationarity of the data as given
in the table 4.6. The Autocorrelation (AC) and Partial Autocorrelation (PAC) function
coefficients were used to identify the structure of the data. Two insignificant spikes of AC
and PAC functions were identified in a correlogram consisting number of Moving Average
and Autoregressive terms. It displayed AC and PAC functions upto two lag orders. The Q-
statistics of all lags were also found significant which indicated serial correlation in the
residuals. This relationship was used to check whether the stock market follows the random
walk model or not. It is believed that if the calculated past values are positive, series follows
the random walk. Here, the Q statistics values for all the lags were observed positive during
the period of study. Hence, the market was found efficient, which worked randomly. The past
values cannot give a clue about the future value. We cannot project the future value of stocks
from its past value to see whether it is going to be increased or decreased.
Table 4.6: Correlogram
AC -0.72 0.243 -0.014 -0.017 0.018 -0.022 0.026 -0.048 0.094 -0.12 0.092 -0.044 0.015 -0.003 -0.003 0.003 -0.001 -0.001
PAC -0.72 -0.571 -0.462 -0.402 -0.33 -0.297 -0.224 -0.305 -0.187 -0.173 -0.143 -0.138 -0.131 -0.121 -0.104 -0.095 -0.073 -0.073
Q-Stat 1151.7 1282.6 1283 1283.7 1284.4 1285.4 1286.9 1292.1 1311.8 1343.8 1362.7 1367 1367.5 1367.5 1367.6 1367.6 1367.6 1367.6
Prob 0 0 0 0 0 0 0 0 0 0 0 0 0 0 0 0 0 0
Table 4.6: Correlogram (in continuation)
AC 0 0.005 -0.01 0.009 0 -0.004 0 0.008 -0.01 0.014 -0.024 0.013 0.029 -0.058 0.044 -0.018 0.003 -0.002
PAC -0.057 -0.03 -0.011 -0.008 0.004 0.018 0.007 0.006 -0.002 0.042 0.048 -0.039 -0.014 -0.015 -0.005 0.006 0.005 -0.023
Q-Stat 1367.6 1367.6 1367.9 1368 1368 1368.1 1368.1 1368.2 1368.5 1368.9 1370.2 1370.6 1372.6 1380.1 1384.6 1385.3 1385.4 1385.4
Prob 0 0 0 0 0 0 0 0 0 0 0 0 0 0 0 0 0 0
Source: Computed from the data taken from www.moneycontrol.com
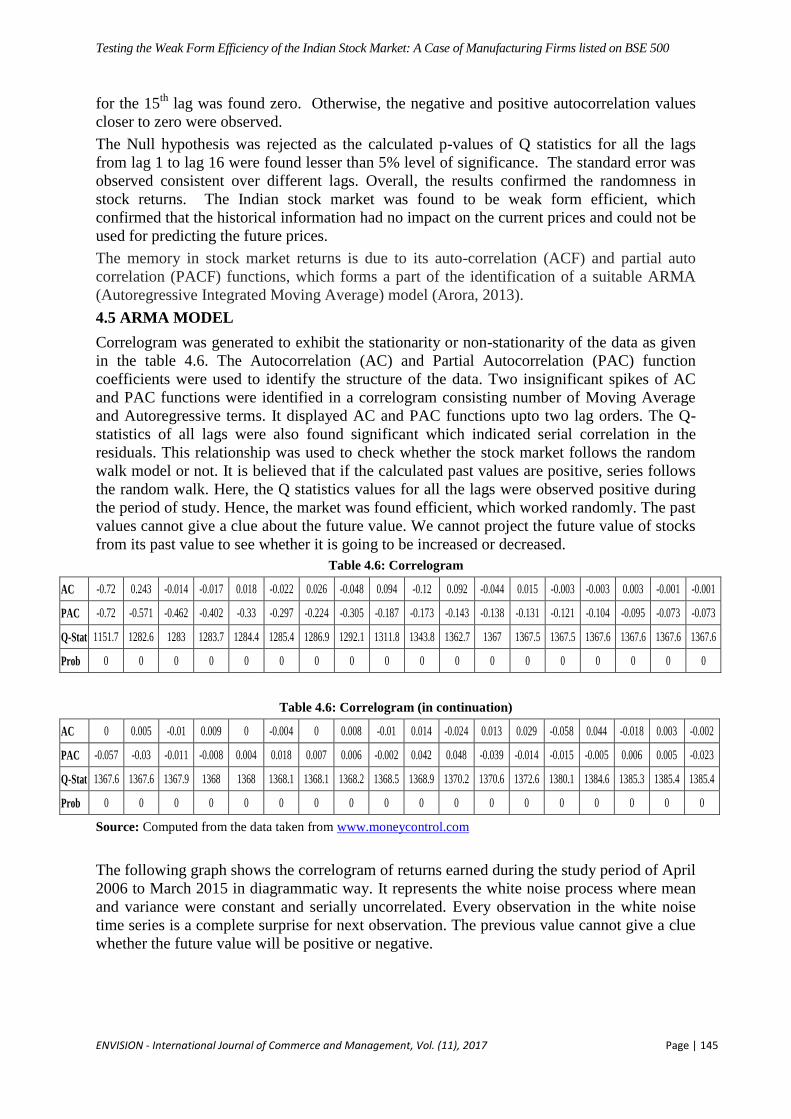
The following graph shows the correlogram of returns earned during the study period of April
2006 to March 2015 in diagrammatic way. It represents the white noise process where mean
and variance were constant and serially uncorrelated. Every observation in the white noise
time series is a complete surprise for next observation. The previous value cannot give a clue
whether the future value will be positive or negative.
Testing the Weak Form Efficiency of the Indian Stock Market: A Case of Manufacturing Firms listed on BSE 500
ENVISION - International Journal of Commerce and Management, Vol. (11), 2017 Page | 146
Figure 4.1
Daily Returns of Stock Prices
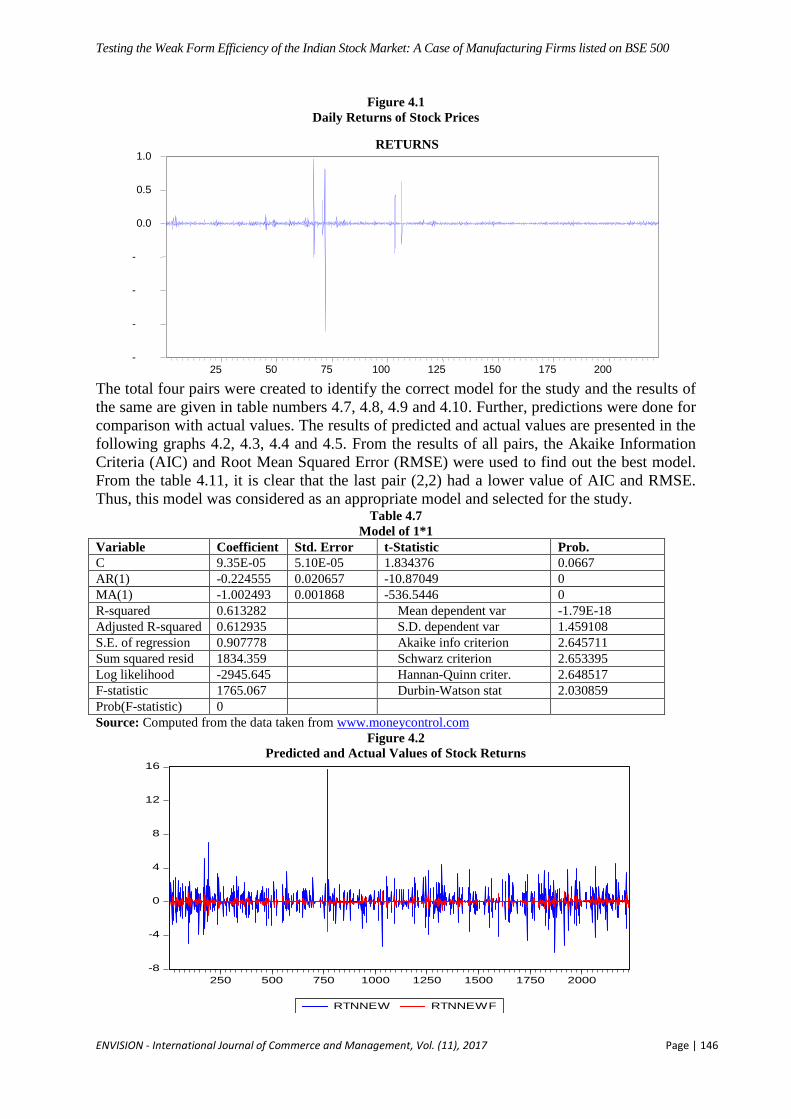
The total four pairs were created to identify the correct model for the study and the results of
the same are given in table numbers 4.7, 4.8, 4.9 and 4.10. Further, predictions were done for
comparison with actual values. The results of predicted and actual values are presented in the
following graphs 4.2, 4.3, 4.4 and 4.5. From the results of all pairs, the Akaike Information
Criteria (AIC) and Root Mean Squared Error (RMSE) were used to find out the best model.
From the table 4.11, it is clear that the last pair (2,2) had a lower value of AIC and RMSE.
Thus, this model was considered as an appropriate model and selected for the study. Table 4.7
Model of 1*1
Variable Coefficient Std. Error t-Statistic Prob.
C 9.35E-05 5.10E-05 1.834376 0.0667
AR(1) -0.224555 0.020657 -10.87049 0
MA(1) -1.002493 0.001868 -536.5446 0
R-squared 0.613282
Mean dependent var -1.79E-18
Adjusted R-squared 0.612935
S.D. dependent var 1.459108
S.E. of regression 0.907778
Akaike info criterion 2.645711
Sum squared resid 1834.359
Schwarz criterion 2.653395
Log likelihood -2945.645
Hannan-Quinn criter. 2.648517
F-statistic 1765.067
Durbin-Watson stat 2.030859
Prob(F-statistic) 0
Source: Computed from the data taken from www.moneycontrol.com
Figure 4.2
Predicted and Actual Values of Stock Returns
-8
-4
0
4
8
12
16
250 500 750 1000 1250 1500 1750 2000
RTNNEW RTNNEWF
-
-
-
-
0.0
0.5
1.0
25 50 75 100 125 150 175 200
RETURNS
Testing the Weak Form Efficiency of the Indian Stock Market: A Case of Manufacturing Firms listed on BSE 500
ENVISION - International Journal of Commerce and Management, Vol. (11), 2017 Page | 147
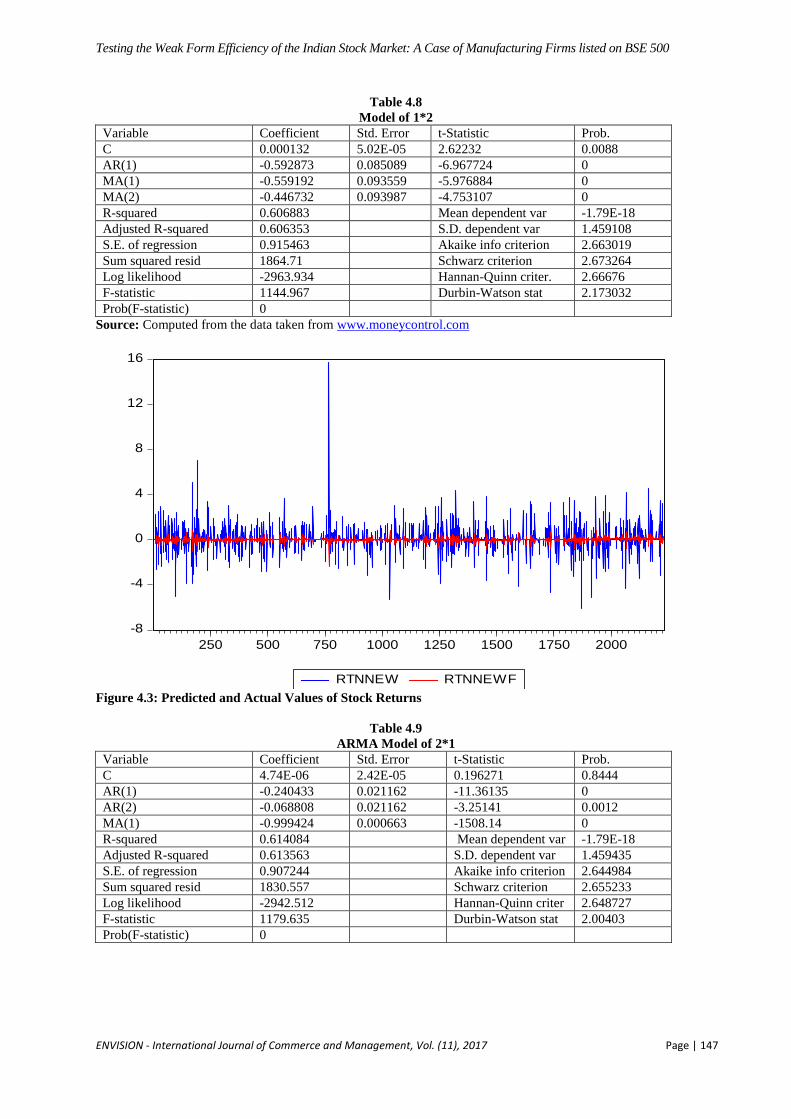
Table 4.8
Model of 1*2
Variable Coefficient Std. Error t-Statistic Prob.
C 0.000132 5.02E-05 2.62232 0.0088
AR(1) -0.592873 0.085089 -6.967724 0
MA(1) -0.559192 0.093559 -5.976884 0
MA(2) -0.446732 0.093987 -4.753107 0
R-squared 0.606883 Mean dependent var -1.79E-18
Adjusted R-squared 0.606353 S.D. dependent var 1.459108
S.E. of regression 0.915463 Akaike info criterion 2.663019
Sum squared resid 1864.71 Schwarz criterion 2.673264
Log likelihood -2963.934 Hannan-Quinn criter. 2.66676
F-statistic 1144.967 Durbin-Watson stat 2.173032
Prob(F-statistic) 0
Source: Computed from the data taken from www.moneycontrol.com
Figure 4.3: Predicted and Actual Values of Stock Returns
Table 4.9
ARMA Model of 2*1
Variable Coefficient Std. Error t-Statistic Prob.
C 4.74E-06 2.42E-05 0.196271 0.8444
AR(1) -0.240433 0.021162 -11.36135 0
AR(2) -0.068808 0.021162 -3.25141 0.0012
MA(1) -0.999424 0.000663 -1508.14 0
R-squared 0.614084
Mean dependent var -1.79E-18
Adjusted R-squared 0.613563
S.D. dependent var 1.459435
S.E. of regression 0.907244
Akaike info criterion 2.644984
Sum squared resid 1830.557
Schwarz criterion 2.655233
Log likelihood -2942.512
Hannan-Quinn criter 2.648727
F-statistic 1179.635
Durbin-Watson stat 2.00403
Prob(F-statistic) 0
-8
-4
0
4
8
12
16
250 500 750 1000 1250 1500 1750 2000
RTNNEW RTNNEWF
Testing the Weak Form Efficiency of the Indian Stock Market: A Case of Manufacturing Firms listed on BSE 500
ENVISION - International Journal of Commerce and Management, Vol. (11), 2017 Page | 148
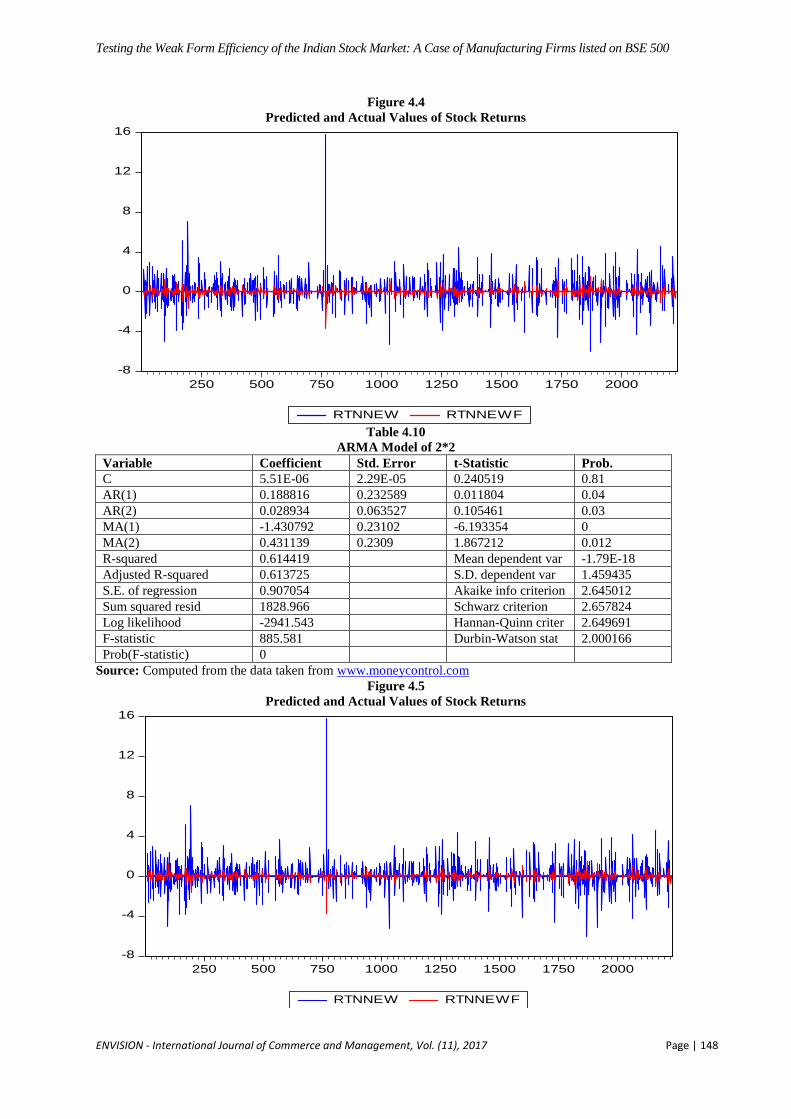
Figure 4.4
Predicted and Actual Values of Stock Returns
Table 4.10
ARMA Model of 2*2
Variable Coefficient Std. Error t-Statistic Prob.
C 5.51E-06 2.29E-05 0.240519 0.81
AR(1) 0.188816 0.232589 0.011804 0.04
AR(2) 0.028934 0.063527 0.105461 0.03
MA(1) -1.430792 0.23102 -6.193354 0
MA(2) 0.431139 0.2309 1.867212 0.012
R-squared 0.614419 Mean dependent var -1.79E-18
Adjusted R-squared 0.613725 S.D. dependent var 1.459435
S.E. of regression 0.907054 Akaike info criterion 2.645012
Sum squared resid 1828.966 Schwarz criterion 2.657824
Log likelihood -2941.543 Hannan-Quinn criter 2.649691
F-statistic 885.581 Durbin-Watson stat 2.000166
Prob(F-statistic) 0
Source: Computed from the data taken from www.moneycontrol.com
Figure 4.5
Predicted and Actual Values of Stock Returns
-8
-4
0
4
8
12
16
250 500 750 1000 1250 1500 1750 2000
RTNNEW RTNNEWF
-8
-4
0
4
8
12
16
250 500 750 1000 1250 1500 1750 2000
RTNNEW RTNNEWF
Testing the Weak Form Efficiency of the Indian Stock Market: A Case of Manufacturing Firms listed on BSE 500
ENVISION - International Journal of Commerce and Management, Vol. (11), 2017 Page | 149
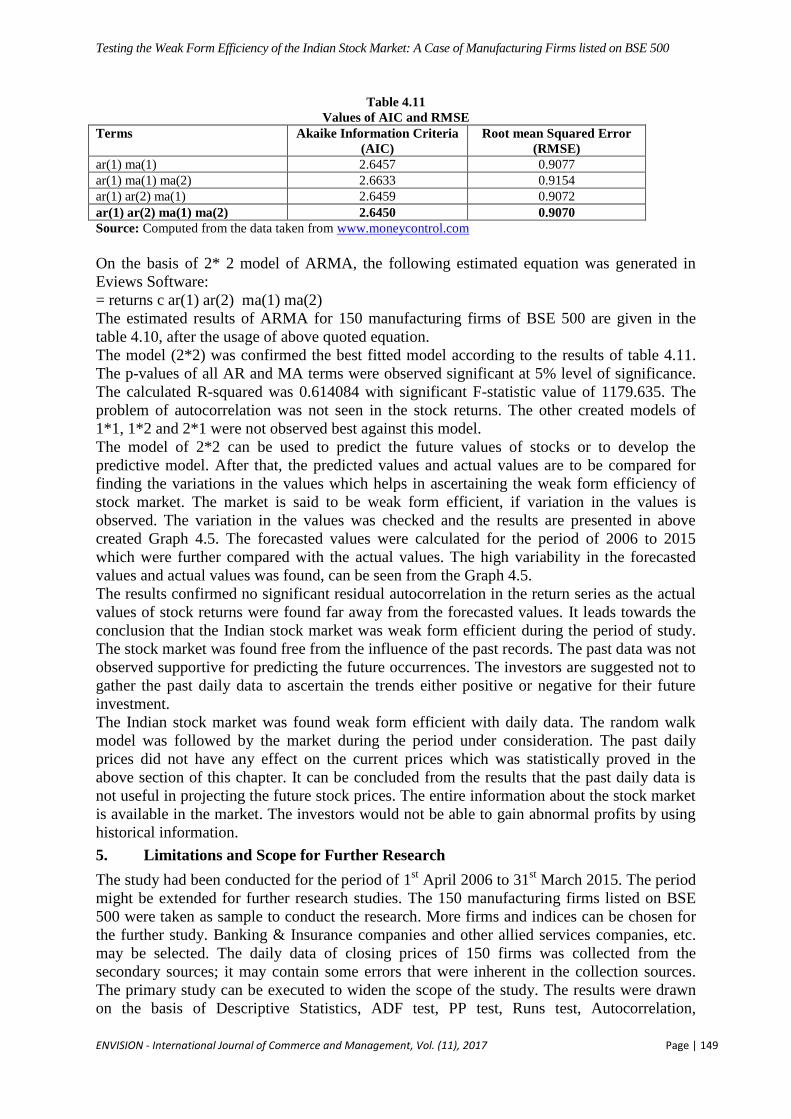
Table 4.11
Values of AIC and RMSE
Terms Akaike Information Criteria
(AIC)
Root mean Squared Error
(RMSE)
ar(1) ma(1) 2.6457 0.9077
ar(1) ma(1) ma(2) 2.6633 0.9154
ar(1) ar(2) ma(1) 2.6459 0.9072
ar(1) ar(2) ma(1) ma(2) 2.6450 0.9070
Source: Computed from the data taken from www.moneycontrol.com
On the basis of 2* 2 model of ARMA, the following estimated equation was generated in
Eviews Software:
= returns c ar(1) ar(2) ma(1) ma(2)
The estimated results of ARMA for 150 manufacturing firms of BSE 500 are given in the
table 4.10, after the usage of above quoted equation.
The model (2*2) was confirmed the best fitted model according to the results of table 4.11.
The p-values of all AR and MA terms were observed significant at 5% level of significance.
The calculated R-squared was 0.614084 with significant F-statistic value of 1179.635. The
problem of autocorrelation was not seen in the stock returns. The other created models of
1*1, 1*2 and 2*1 were not observed best against this model.
The model of 2*2 can be used to predict the future values of stocks or to develop the
predictive model. After that, the predicted values and actual values are to be compared for
finding the variations in the values which helps in ascertaining the weak form efficiency of
stock market. The market is said to be weak form efficient, if variation in the values is
observed. The variation in the values was checked and the results are presented in above
created Graph 4.5. The forecasted values were calculated for the period of 2006 to 2015
which were further compared with the actual values. The high variability in the forecasted
values and actual values was found, can be seen from the Graph 4.5.
The results confirmed no significant residual autocorrelation in the return series as the actual
values of stock returns were found far away from the forecasted values. It leads towards the
conclusion that the Indian stock market was weak form efficient during the period of study.
The stock market was found free from the influence of the past records. The past data was not
observed supportive for predicting the future occurrences. The investors are suggested not to
gather the past daily data to ascertain the trends either positive or negative for their future
investment.
The Indian stock market was found weak form efficient with daily data. The random walk
model was followed by the market during the period under consideration. The past daily
prices did not have any effect on the current prices which was statistically proved in the
above section of this chapter. It can be concluded from the results that the past daily data is
not useful in projecting the future stock prices. The entire information about the stock market
is available in the market. The investors would not be able to gain abnormal profits by using
historical information.
5. Limitations and Scope for Further Research
The study had been conducted for the period of 1st April 2006 to 31
st March 2015. The period
might be extended for further research studies. The 150 manufacturing firms listed on BSE
500 were taken as sample to conduct the research. More firms and indices can be chosen for
the further study. Banking & Insurance companies and other allied services companies, etc.
may be selected. The daily data of closing prices of 150 firms was collected from the
secondary sources; it may contain some errors that were inherent in the collection sources.
The primary study can be executed to widen the scope of the study. The results were drawn
on the basis of Descriptive Statistics, ADF test, PP test, Runs test, Autocorrelation,
Testing the Weak Form Efficiency of the Indian Stock Market: A Case of Manufacturing Firms listed on BSE 500
ENVISION - International Journal of Commerce and Management, Vol. (11), 2017 Page | 150
Correlogram and ARMA model. The different statistical techniques might be employed to do
the study.
6. Research Implications
The results of the study can be used by the Financial Analysts and various other professionals
to make the investment related decisions. Specifically, the study was done by considering the
150 manufacturing firms listed on BSE 500. They can easily judge the performance of this
sector during the research period and use it to take the decisions. The study claimed that
Indian stock market was a weak form efficient and no –one can earn extra profits by using the
historical data. The investors can keep this in their mind at the time of investing in the various
manufacturing companies' stocks. The Government and other regulatory authorities can make
their policies and plans to make the Indian stock market more effective and attractive.
7. Conclusion
This research work was executed to see whether the Indian Stock Market is weak form
efficient or not. The weak form of capital market efficiency means historical information and
performance of stock prices does not affect the performance of present stock prices. The past
information has no relevance in depicting the future stock prices. The different research
techniques like Descriptive Statistics, ADF test, PP test, Runs test, Autocorrelation,
Correlogram and ARMA model have been employed to observe this affect. The study found
that Indian stock market was weak form efficient. It has followed the random walk model
during the period under study. The entire information about the stock market is available in
the market. The investors would not be able to gain abnormal profits by using historical
information. Hence, the past prices do not affect on the current prices is statistically proved.
Fama observed that large daily price changes in stocks likely to be pursued by large changes
in future stock prices, but positive or negative cannot adjudge immediately. His study
suggested that the most important information cannot be assessed instantly. The investors
will take time to choose, the important information which has impact on the future stock
prices. For the mean time, they do trading and market exhibits those trends.
Fama confirmed serial dependence and positive consistency in the stock prices. But, this
consistency was found close to zero. The actual stock returns were seemed to be lesser than
the expected returns. This short term serial dependency, if generated marginal trading profits
would be settled with high commission paid to floor traders. However, Fama opined that this
small positive dependence and consistency did not reject the efficient market models.
References: Arora, H. (2013). Testing Weak Form of Efficiency of Indian Stock Market. Pacific
Business Review International , 5 (12), 16-23.
Bhatt, S.N.(2011). Securities Analysis and Portfolio Management (Ist ed.) New Delhi:
Biztantra.
Dima, B., and Milos, L.R. (2009). Testing the Efficiency Market hypothesis for the
Romania Stock Market. Annales Universitatis Apulensis Series Oeconomica, 11(1),
402-415.
Hawaldar, I. T., Babitha, R., and Pinto, P. (2017). Testing of Weak Form of Efficient
Market Hypothesis: Evidence from the Bahrain Bourse. Investment Management and
Financial Innovation, 14(2), 376-385.
Jain, P., Vyas, V., and Roy, A. (2013). A Study on weak form of market efficiency
during the period of global financial crisis in the form of random walk on Indian
Capital Market. Journal of Advances in Management Research , 10 (1), 122-138.
Testing the Weak Form Efficiency of the Indian Stock Market: A Case of Manufacturing Firms listed on BSE 500
ENVISION - International Journal of Commerce and Management, Vol. (11), 2017 Page | 151
Khan, A. I. (2011). Testing weak form market efficiency of Indian capital market: A
case of national stock exchange (NSE) and Bombay stock exchange (BSE). African
Journal of Marketing Management , 3 (6), 115-127.
Mishra, A. , Mishra, V., and Smyth, R. (2014). The Random-Walk Hypothesis on the
Indian Stock Market. Melbourne, Australia: Department of Economics, Monash
University.
Njuguna, J. (2016). The Market Efficiency of the Tanzania Stock Market. Banks and
Bank System, 11 (3), 75-86.
Worthington, A. H. (2006). Weak-Form Market Efficiency in Asian Emerging and
Developed Equity Markets: Comparative Tests of Random Walk Behaviour.
Accounting Research Journal , 19 (1), 54-63.
Zafar, T. ( 2012). A Systematic Study to test the Efficient Market Hypothesis on BSE
listed Companies before Recession. International Journal of Management and Social
Sciences , 1 (1), 37-47.