Embed Size (px)
Citation preview
Knight Piésold C O N S U L T I N G
AVANTI KITSAULT MINE LTD KITSAULT PROJECT
FEASIBILITY GEOTECHNICAL
SITE INVESTIGATIONS
VA101-343/6-1 Rev 0 January 13, 2011
P R E P AR E D B Y
Knight Piésold Ltd. Suite 1400 – 750 West Pender Street
Vancouver, BC V6C 2T8
P R E P AR E D F O R
Avanti Kitsault Mine Ltd 880 - 580 Hornby Street
Vancouver, BC V6C 3B6


I of III VA101-343/6-1 Rev 0 January 13, 2011
AVANTI KITSAULT MINE LTD KITSAULT PROJECT
FEASIBILITY GEOTECHNICAL SITE INVESTIGATIONS
(REF. NO. VA101-343/6-1)
EXECUTIVE SUMMARY
The Kitsault Project is a historical Molybdenum mine located in Northwestern B.C. that is proposed for redevelopment. Avanti Kitsault Mine Ltd. acquired the Kitsault Property in October 2008 and reactivated the project. Knight Piésold has been commissioned to develop the feasibility design for the Tailings Management Facility (TMF), the water management systems and to provide geotechnical support for mine site infrastructure design. In 2010 a geotechnical and hydrogeological site investigation program was undertaken from July 1 to August 23, 2010. The areas of interest investigated during the 2010 program included:
• Geotechnical foundation conditions and seepage control along the tailings embankments
• Hydrogeological conditions in the TMF basin
• Geotechnical foundation conditions at the proposed plant site, primary crusher and waste rock management facility
• Bedrock mapping of the lava flow geological structure in the project area as a potential seepage pathway
• Construction borrow materials investigations, and
• Installation of long term groundwater monitoring wells for environmental baseline studies. The site investigation program consisted of site reconnaissance, drillholes, in-situ hydraulic conductivity testing, monitoring well installations, well development, test pits, vibracore drillholes and collection of rock and overburden materials for laboratory testing. GEOTECHNICAL MATERIAL CHARACTERISTICS The geotechnical conditions of the overburden and rock mass have been assessed based on all the relevant geological and geotechnical information collected. The site is characterized by the following sequences of overburden and bedrock.
• Organic Material – Typically wet soft fibrous organic material between 0.08 and 13 metres thick overlays bedrock in the Kitsault project area. Little other overburden materials were found on site due to extensive glaciation. The organic deposits are thickest in the valleys and almost nonexistent on the topographic highs.
• Trachyandesite Lava Flows – Typically were found to have the following properties: o ‘GOOD’ to ‘VERY GOOD’ Rock Mass Rating classification (RMR 89) with values ranging from 40
to 85 with a mean of 65 o Rock Quality Designation (RQD) values range from 40 to 100% with a mean of 73% o Low permeability with hydraulic permeability results of 10-6 to 10-4 cm/s

II of III VA101-343/6-1 Rev 0 January 13, 2011
o ‘MEDIUM STRONG‘ to ‘EXTREMELY STRONG’ rock strength with UCS laboratory test results ranging from 24 to 303 MPa with a mean of 197 MPa
• Bowser Lake Group Sedimentary Rocks – Typically were found to have the following properties: o ‘FAIR’ to ‘GOOD’ Rock Mass Rating classification (RMR 89) with values ranging from 40 to 70
with a mean of 60 o Rock Quality Designation (RQD) values range from 50 to 90% with a mean of 65% o Low permeability with hydraulic permeability results of 10-7 to 10-5 cm/s o ‘MEDIUM STRONG‘ to ‘VERY STRONG’ rock strength with UCS laboratory test results ranging
from 21 to 219 MPa with a mean of 88 MPa. MINE SITE INFRASTRUCTURE FOUNDATION CONDITIONS The following is a summary of the site investigation program conclusions for each of the major mine site infrastructure components. South TMF Embankment The South TMF Embankment is strategically located to optimize the natural topography. The foundation conditions are characterized by thin colluvium cover on the side slopes in a deeply incised v-shaped valley bedrock surface. The end of the historic Patsy Waste Rock Management Facility (WRMF) is located on the right abutment of the embankment in the valley bottom and is anticipated to be approximately 10 m thick. The waste rock deposits will require removal prior to construction of the South Embankment. The bedrock geology consisted of bedded Bowser Lake Group greywacke and argillite. In situ hydraulic conductivity testing has shown the rock mass in the foundation is generally of low permeability and for the most part will not require grouting. Northeast TMF Embankment The Northeast TMF Embankment will be constructed at an elevation of approximately 760 metres to the northeast of the existing open pit. This site is strategically located with respect to the Kitsault Pit and to optimize the natural topography. The site is characterized by thin topsoil and organic peat deposits between 1 and 13 metres thick overlying an undulating greywacke argillite bedrock surface. Organic peat deposits will need to be stripped to the bedrock surface prior to embankment construction. Trachyandesite lava flows are located downstream of the western end of the embankment. The contact between the lava flow and the underlying Bowser Lake Group was found at 46 metres depth, at elevation 830 metres. Waste Rock Management Facility The East WRMF is located between the South Embankment of the TMF and the Kitsault Pit, which is also over top of the existing Patsy WRMF in an incised valley. Drillholes found loose to compact waste rock to be 10 to 20 metres thick. An organic layer is also anticipated to be encountered overlying bedrock. Organic deposits will require removal in the downstream toe area of the East WRMF. The bedrock contact is at 670 masl elevation to the west, closet to the open pit. The bedrock rises 47 metres to 717 masl elevation at the South Embankment. The bedrock is bedded greywacke and argillite for most of the area and is granodiorite closest to the pit.

III of III VA101-343/6-1 Rev 0 January 13, 2011
Primary Crusher The proposed Primary Crusher location is on an existing historic Clary WRMF at the north end of the existing open pit at an approximate elevation of 650 masl. The Primary Crusher location is situated on approximately 10 m of loose rockfill overlying competent Bowser Lake Group bedrock. The water table was encountered at 13.9 metres depth in the bedrock unit. The loose waste rock deposits will require removal to found the crusher on a competent foundation to minimize settlement. Truckshop, Warehouse and Fuel Storage The proposed Truckshop, Warehouse and Fuel Storage are situated on relatively flat slopes on the existing Clary WRMF. The surficial cover is predominantly waste rock overlying organic deposits and some swamps and bogs are located in depressions and poorly drained areas. Waste rock was up to 26 metres thick overlying a sloping siltstone/argillite bedrock surface. A very soft silty-clay was found between 3 and 11 metres depth that is most likely unsuitable waste materials stockpiled then covered with waste material during previous construction of the waste dump. An organic layer is also anticipated to be encountered overlying bedrock. These waste rock, organic and silt deposits will require removal prior to construction of the truckshop/warehouse and Fuel Storage foundations. The water table was encountered at between 5.4 and 30.2 metres depth in the bedrock unit as the bedrock surface slopes downward to the west. The water table was found in the bedrock at depths of 5.4 to 30.2 metres. Coarse Ore Stockpile The Coarse Ore Stockpile (COS) is located east of the Process Plant on thick columnar trachyandesite lava flows. The site is characterized by thin topsoil of organic peat deposits overlying relatively flat bedrock surface. The bedrock is columnar jointed trachyandesite lava fractured zones or columns are approximately 0.5 to 1 metres wide. The water table was encountered 38.1 metres depth in the bedrock unit, approximately 902 masl elevation. Process Plant and Permanent Camp The Process Plant is located approximately 150 metres west of the Coarse Ore Stockpile on thick columnar trachyandesite lava flows to the north of Widdzech Mountain. The site is characterized by thin topsoil and organic peat deposits overlying relatively flat bedrock. The water table is located at 21 to 25 metres depth below ground surface at an elevation of 902 masl elevation. The contact between lava flows and the Bowser Lake Group greywacke and argillite was found at 118 metres depth, elevation 806 masl.

i of iii VA101-343/6-1 Rev 0 January 13, 2011
AVANTI KITSAULT MINE LTD KITSAULT PROJECT
FEASIBILITY GEOTECHNICAL SITE INVESTIGATIONS
(REF. NO. VA101-343/6-1)
TABLE OF CONTENTS PAGE
EXECUTIVE SUMMARY ............................................................................................................................... I
TABLE OF CONTENTS ................................................................................................................................. i
SECTION 1.0 - INTRODUCTION ................................................................................................................. 1 1.1 PROJECT DESCRIPTION ........................................................................................................ 1 1.2 SCOPE OF REPORT ................................................................................................................ 1 1.3 PROJECT LOCATION .............................................................................................................. 2 1.4 PROJECT BACKGROUND ....................................................................................................... 2
SECTION 2.0 - SITE CHARACTERISTICS .................................................................................................. 4 2.1 SITE DESCRIPTION ................................................................................................................. 4 2.2 GEOLOGIC SETTING ............................................................................................................... 4 2.3 REGIONAL GEOMORPHOLOGY ............................................................................................. 4 2.4 REGIONAL GEOLOGY ............................................................................................................. 5 2.5 HYDROGEOLOGY .................................................................................................................... 6
SECTION 3.0 - GEOTECHNICAL SITE INVESTIGATION PROGRAM ....................................................... 7 3.1 GENERAL .................................................................................................................................. 7 3.2 GEOTECHNICAL DRILLING PROGRAM ................................................................................. 8
3.2.1 Geotechnical Logging ................................................................................................... 8 3.2.2 Hydraulic Conductivity Testing ..................................................................................... 9 3.2.3 Monitoring Well Installation........................................................................................... 9 3.2.4 Well Development ...................................................................................................... 10 3.2.5 Response (Hvorslev) Testing ..................................................................................... 10
3.3 VIBRACORE PROGRAM ........................................................................................................ 10 3.4 TEST PIT PROGRAM ............................................................................................................. 11 3.5 LAVA FLOW MAPPING .......................................................................................................... 11 3.6 LABORATORY TESTWORK ................................................................................................... 11
3.6.1 Index Testing .............................................................................................................. 12 3.6.2 Unconfined Compressive Strength Testing ................................................................ 12
SECTION 4.0 - GEOTECHNICAL CONDITIONS FOR ENGINEERING DESIGN ..................................... 14 4.1 GEOTECHNICAL MATERIAL CHARACTERISTICS .............................................................. 14
4.1.1 Organic Material ......................................................................................................... 14 4.1.2 Widdzech Mountain Lava Flows ................................................................................. 14 4.1.3 Bowser Lake Group Sedimentary Rocks ................................................................... 15

ii of iii VA101-343/6-1 Rev 0 January 13, 2011
4.2 SOUTH EMBANKMENT FOUNDATION CONDITIONS ......................................................... 15 4.3 NORTHEAST EMBANKMENT FOUNDATION CONDITIONS ............................................... 16 4.4 WASTE ROCK MANAGEMENT FACILITY FOUNDATION CONDITIONS ............................ 16 4.5 PRIMARY CRUSHER FOUNDATION CONDITIONS ............................................................. 17 4.6 TRUCKSHOP, WAREHOUSE AND FUEL STORAGE AREA FOUNDATION CONDITIONS 17 4.7 COARSE ORE STOCKPILE ................................................................................................... 18 4.8 PROCESS PLANTSITE AND PERMANENT CAMP ............................................................... 18 4.9 SUMMARY .............................................................................................................................. 19 4.10 GEOTECHNICAL PARAMETERS AND FACTORS INFLUENCING FOUNDATION DESIGN19
4.10.1 Allowable Bearing Pressures ..................................................................................... 20 4.10.2 Depth of Frost Penetration ......................................................................................... 20 4.10.3 Groundwater and Drainage Requirements ................................................................. 20 4.10.4 Shear Strength Parameters ........................................................................................ 21
SECTION 5.0 - CONCLUSIONS ................................................................................................................ 22 5.1 GEOTECHNICAL MATERIAL CHARACTERISTICS .............................................................. 22 5.2 MINE SITE INFRASTRUCTURE FOUNDATION CONDITIONS ............................................ 22
SECTION 6.0 - REFERENCES .................................................................................................................. 25
SECTION 7.0 - CERTIFICATION ............................................................................................................... 26
TABLES Table 3.1 Rev 0 2010 Geotechnical Drillhole Summary Table 3.2 Rev 0 Rock Mass Rating (RMR) Classification System Table 3.3 Rev 0 Geotechnical Vibracore Summary Table 3.4 Rev 0 Packer with Pressure Transducer Testing Summary Table 3.5 Rev 0 Summary of Soil Engineering Geotechnical Properties Table 3.6 Rev 0 Unconfined Compressive Strength Laboratory Test Results
FIGURES Figure 1.1 Rev 0 Project Location Map Figure 2.1 Rev 0 Regional Bedrock Geology Figure 3.1 Rev 0 Geotechnical and Hydrogeological Drillhole Location Plan Figure 3.2 Rev 0 2009 and 2010 Geotechnical Site Investigations - Hydraulic Conductivity vs.
Elevation Figure 3.3 Rev 0 Low Grade StockPile Figure 3.4 Rev 0 Northeast Embankment – Geotechnical Site Investigation Plan Figure 3.5 Rev 0 Lava Flow Mapping Figure 4.1 Rev 0 Tailings Management Facility - Embankment Geological Sections Figure 4.2 Rev 0 Tailings Management Facility - Longitudinal Geological Sections Figure 4.3 Rev 0 East Rock Management Facility – Geotechnical Site Investigation Plan
iii of iii VA101-343/6-1 Rev 0 January 13, 2011
APPENDICES Appendix A Geotechnical Drillhole Data A1 Geotechnical Drillhole Summary Logs A2 Bedrock Geotechnical Drillhole Logs A3 Geotechnical Drillhole Site Photographs A4 Geotechnical Drillhole Core Photographs Appendix B Hydrogeological Drillhole Data B1 Packer Hydraulic Conductivity Testing Sheets B2 Monitoring Well Installation Details B3 Response Testing Sheets Appendix C Vibracore and Test Pit Data C1 Vibracore Logs C2 Test Pit Logs C3 Vibracore and Test Pit Photographs Appendix D Laboratory Testing Results D1 Test Pit and SPT Laboratory Index Testing Results D2 Unconfined Compressive Strength Laboratory Testing Results D3 Petrographic Study of Trachyandesites and Sediments

1 of 26 VA101-343/6-1 Rev 0 January 13, 2011
AVANTI KITSAULT MINE LTD KITSAULT PROJECT
FEASIBILITY GEOTECHNICAL SITE INVESTIGATIONS
(REF. NO. VA101-343/6-1)
SECTION 1.0 - INTRODUCTION
1.1 PROJECT DESCRIPTION
The Kitsault Project is a historical Molybdenum mine located in north-western British Columbia that is proposed for redevelopment. The Project is located about 140 kilometres north of Prince Rupert, British Columbia, and south of the head of Alice Arm, an inlet on the Pacific coast of British Columbia. Avanti Kitsault Mine Ltd. (Avanti) acquired the Kitsault Property in October 2008 and has reactivated the project. A National Instrument 43-101 (NI 43-101) compliant Pre-Feasibility Study was completed by Wardrop Engineering in December 2009 (Wardrop Engineering, 2009) with calculated Proven & Probable reserves of 215.3 million tonnes grading 0.085% Mo, with a 15-year mine life, producing 368 million pounds (average annual production of 24.5 million lbs/year) of molybdenum. The Pre-Feasibility Study indicated that the Project would be a robust mine. Knight Piésold Ltd. (KPL) has been commissioned to develop the feasibility design for the Tailings Management Facility (TMF), the water management systems and to provide geotechnical support for mine site infrastructure design. 1.2 SCOPE OF REPORT
This report presents and summarizes the results of the 2010 feasibility geotechnical site investigation program. The primary objectives of the site investigation program were to evaluate geotechnical and hydrogeological conditions encountered at the proposed mine site infrastructure, the Tailings Management Facility (TMF) location and Waste Rock Management Facility (WRMF). The areas of interest investigated during the 2010 program included:
• Geotechnical and hydrogeological foundation conditions for seepage control along the tailings embankments
• Hydrogeological conditions in the TMF basin
• Geotechnical foundation conditions at the proposed plant site, primary crusher and waste rock management facility
• Bedrock mapping of the lava flow geological structure in the project area as a potential seepage pathway
• Construction borrow materials investigations, and
• Installation of long term groundwater monitoring wells for environmental baseline studies. The site investigation program consisted of site reconnaissance, drillholes, in-situ hydraulic conductivity testing, monitoring well installations, well development, test pits, vibracore drillholes and collection of samples for laboratory testing.

2 of 26 VA101-343/6-1 Rev 0 January 13, 2011
1.3 PROJECT LOCATION
The Kitsault Project is located in north-western British Columbia within the Regional District of Kitimat-Stikine (RDKS), Canada, approximately 140 kilometres northeast of Prince Rupert and south of the head of Alice Arm, an inlet of the Pacific Coastline, as shown on Figure 1.1. The Kitsault mine site is located within NTS maps 103P044 and 043, at approximately latitude 55º 25’ 19” N and longitude 129º 25’ 10” W and at about 600 metres above sea level (masl). The project can be accessed from Terrace or Smithers via existing highways, forestry and mine access roads, and by float plane air service or boat from Prince Rupert. The Kitsault claim boundary includes three known molybdenum resources; Kitsault, Bell Moly, and Roundy Creek. The principal mining feature on the property is the Kitsault open pit mine which is not in operation. The Project is located within the Nass Area and the Nass Wildlife Area as defined by the Nisga’a Final Agreement (NFA). However, the mine area falls outside of Nisga’a Lands owned by the Nisga’a Nation under the terms of the NFA, which came into effect on May 11, 2000 (Government of BC, Aboriginal Relations and Reconciliation 2000). 1.4 PROJECT BACKGROUND
The Kitsault deposit was first staked in 1911. Early stage investigations focused on a polymetallic vein, located to the southeast of the current Molybdenum deposit. Exploration continued on the project in the 1920’s and early 1930’s. No further exploration occurred until 1959 when Kennco Exploration (Western) Limited (KEL) completed a diamond drilling program. In 1964 KEL discovered an ore body of 36 million tonnes on site averaging 0.138% Mo (0.23% MoS2). KEL commenced mining the property in 1968 and approximately 9.3 million tonnes of ore was produced with about 22.9 million pounds of Molybdenum recovered until mining ceased in 1972 due to low metal prices. Climax Molybdenum Company of British Columbia purchased the property in 1973 and recommenced production in 1981. Mining was again halted because of low metal prices in 1982. Approximately 30 million lbs of Molybdenum were produced during these two periods of mining (BC MINFILE Report number 103P 120, Natural Resources Canada). The Kitsault mine was mined using conventional drill, blast, shovel and truck open pit mining methods, producing 6,000 tonnes per day at a stripping ratio of 1.5:1 waste to ore under BC Moly and 12,000 tonnes per day under CMC. The concentrator utilized a three-stage crushing circuit, two-stage grinding circuit (rod-ball mills) and rougher-scavenger-cleaner flotation for the production of a final molybdenum concentrate. The waste rock storage facilities have been reclaimed and the concentrator mill and truck shop have been dismantled and removed from the site. The Kitsault Town Site was constructed during the later mining operation, but is currently abandoned with the exception of caretakers. Avanti Kitsault Mine Ltd. (Avanti) acquired the Kitsault Property in October 2008. KPL completed a trade-off study in early 2009 of different tailings disposal options. Six tailings facility options were identified and outlined in the Tailings Disposal Options Trade-off study report, April 6, 2009 (KP Ref. VA101-343/2-1). The Lower Lime Creek Facility (Site 6) was selected as the preferred tailings disposal option for pre-feasibility design. A detailed geotechnical site investigation program was implemented in 2009 by KPL to support the pre-feasibility study (PFS) of engineering design of the Lower Lime Creek TMF and mine site infrastructure.

3 of 26 VA101-343/6-1 Rev 0 January 13, 2011
In late 2009 a second tailings disposal alternatives study was initiated to revisit tailings options considered in previous site evaluations and apply knowledge gained from the PFS to assure that the Kitsault Project incorporated the optimal location for the TMF. An assessment of six sites was completed. Order-of-magnitude cost estimates were developed for each site using the costs and unit rates developed for the pre-feasibility study as a baseline. A high-level review of the environmental and regulatory issues associated with each site was also made. The alternatives study concluded that the site with the lowest initial capital and life of mine costs was identified as Site 10B (KP Ref. VA101-343/3-5). Further investigation into Site 10B identified extensive fish riparian habitat. Considering the loss of fish habitat for the TMF in this location, Avanti chose the second identified front runner, Site 5 that covers Patsy Lake, a non-fish bearing lake east of the open pit. A detailed geotechnical site investigation program was implemented in 2010 by KPL to support feasibility engineering design of the Site 5 TMF and mine site infrastructure. The historical mine workings at the Kitsault deposit in the 1970s to early 1980s have left behind an open pit shell, the Patsy and Clary waste rock management facilities, an abandoned town located on Alice Arm and mine access roads and trails. Existing infrastructure consisting of an electricity grid and ocean and road access is available on site. The Kitsault Town Site was purchased by an independent owner, Kitsault Resort Ltd. Since mine closure reclamation work has been conducted on the old mine workings. The waste rock management facilities have been reclaimed and the concentrator mill and truck shop have been dismantled and removed from the site.

4 of 26 VA101-343/6-1 Rev 0 January 13, 2011
SECTION 2.0 - SITE CHARACTERISTICS
2.1 SITE DESCRIPTION
The Kitsault Project is located in the Boundary Range of the Coast Mountains close to Alice Arm which branches northeast from Observatory Inlet. At the height of the Pleistocene glacial period the entire region underwent extensive glaciation which left deeply carved valleys and significant topographic relief characterized by steeply inclined slopes and thin veneers of colluvium overlying bedrock. Lower elevation peaks and ridges below 2000 metres are more rounded and subdued by the effects of ice-sheet erosion. The slopes are intermittently broken with small swamp covered benches with meandering stream courses that connect pothole lakes, ponds and swamps. Interbedded greywacke and argillite sedimentary rocks outcrop on surface throughout the project. The Coast Mountain Plutonic Complex is located approximately two kilometres to the east of the site and is associated with intense igneous activity and lava flows. This intrusive activity includes the Alice Arm Intrusives that are associated with the Kitsault Molybdenum deposit emplacement along with other mineralized deposits in Alice Arm. Recent plateau-type trachyandesite lava flows (previously identified by others as basalt) dominate the topography northeast of the deposit. These lava flows form well-developed columnar jointed cliff faces over 100 metres high. 2.2 GEOLOGIC SETTING
The Kitsault site geologic setting has previously been described and mapped by Carter (1964 and 1982) and Steininger (1981). The Kitsault Molybdenum ore deposit is located within the geologic province of Cordilleran Intermontane tectonic belt in British Columbia. The Kitsault Project lies within the Boundary Range of the Coast Mountains, near the northeastern edge of the Eastern Coast Belt, lying between the Intermediate Belt to the east and the Western Coast Belt and Wrangellia to the west. The Boundary Range extends north from the Kitimat Range along the British Columbian and Alaskan border towards the Yukon Territory. Rock types present within this belt range in age from Devonian to early Cenozoic, typically consisting of sedimentary, granitic, volcanic island and continental arc formations, and glaciomarine and non-marine clasts eroded mainly from uplifting of the Omineca Belt. Significant deformation has occurred in this region of the province, primarily caused by compression and extension transitional forces. 2.3 REGIONAL GEOMORPHOLOGY
The Kitsault Project area has undergone extensive glaciation, and at the height of the Pleistocene glacial period, thick ice sheets flowed over the entire region. Pre-glacial valleys on the western side of the Coast Mountains offered an easier route for ice flowing westward to the sea. The Kitsault River valley, incised before the Pleistocene period, served as a main drainage path for the westward flow of glacial ice and was deepened by the passage of ice through it. Strongly developed lineations displayed by drift forms and sculptured bedrock provides an indication of the direction of Pleistocene ice movement. Extensive glaciation has left deeply carved valleys adjacent to higher peaks. Peaks and ridges are more rounded at lower elevations (below 2000 metres), subdued by the effects of ice-sheet erosion that has left few surficial deposits. The project area is characterized by steeply inclined slopes dissected by deeply

5 of 26 VA101-343/6-1 Rev 0 January 13, 2011
incised gullies. Bedrock typically outcrops throughout the project site and is frequently mantled by a thin veneer of colluvial deposits. The colluvium generally becomes thicker towards the toes of slopes, with the thickest deposits being the colluvial fans and cones, which develop as a result of debris flows from snow avalanches and rock falls. The colluvium is expected to be very thin or absent on the hillside spurs and on the upper hill slopes. Rock fall talus deposits are found along the bases of the columnar jointed lava flow cliff faces. Fluvial deposits, predominantly comprising sands and gravels, are found along the active fluvial channels. The steep slopes are intermittently broken with small swamp covered benches and deeply incised gullies. Meandering stream courses connect pothole lakes and ponds on swamp covered benches. Organic deposits are located throughout the project area overlying undulating bedrock benches. These are commonly saturated with water and consist mainly of the accumulated remains of mosses, sedges and other vegetation. The sea level during the Pleistocene glaciation was much higher due to the weight of glacial ice causing isostatic depression. This phenomenon is evidenced in the Kitsault area by the presence of glaciomarine deposits at elevations of up to 30 metres above the present sea level. There are glaciomarine clays, deltaic deposits and old beach deposits in Alice Arm that are at a considerable height above current sea level indicating a maximum submergence of approximately 150 metres (Holland, 1976). Glaciomarine sediments were deposited during sea level high stands in glacial periods. These deposits still remain in river deltas such as at Roundy Creek. Glaciofluvial materials, typically sand and gravel, were deposited in a series of terraces associated with different sea levels at the mouths of rivers and creeks. Interbedded gravels, sands and silts were deposited subaqueously in ice-proximal glaciomarine environments. Eventually as valley glaciers retreated and the sea level dropped and extensive meltwater braided stream plains formed in front of the glaciers, terminating in marine water, and forming large deltas (McCuaig, S. 2003a). 2.4 REGIONAL GEOLOGY
The dominant host bedrock for the project area is comprised of the Upper Jurassic to Lower Cretaceous period Bowser Lake Group sedimentary rocks. The Bowser Lake Group typically consists of interbedded greywacke and argillite with minor conglomerate and limestone metamorphosed to greenschist facies. Individual beds vary in thickness from a few centimetres to upwards of 15 metres with a ratio of roughly 80% greywacke, 19% argillite and 1% limestone and conglomerate. Regionally, the Bowser Lake Group has a northwest strike and a steep northeast dip, but numerous variations to this trend are interrupted by small scale folding. The sedimentary rocks have undergone intense intrusive activity related to the Coast Range Crystalline Complex located approximately two kilometres away from the project location. This intrusive activity includes the Alice Arm Intrusives that are associated with the Kitsault Molybdenum deposit along with other economic deposits in the Alice Arm area and swarms of northeast striking lamprophyre dykes. The intrusives were emplaced from 50 to 55 million years ago in the Bowser Lake Group sedimentary rocks surrounding Alice Arm (Carter 1982). Many of these Alice Arm Intrusives are associated with Molybdenum mineralization. The Kitsault property contains three known Molybdenum deposits: Kitsault, Bell Moly, and Roundy Creek. The Kitsault deposit is within the Lime Creek Intrusive Complex that consists of quartz diorite, grandiorite and decreased amounts of quartz monzonite. Mineralization within the deposit is related to the last two phases of the Lime Creek Complex, the Central Stock (granodiorite)

6 of 26 VA101-343/6-1 Rev 0 January 13, 2011
and the Northeast Porphyry (porphyritic granodiorite). Hornfels aureoles in the host sedimentary rocks were likely produced in reaction to intrusions along the eastern boarder of the Coast Plutonic Formation. Swarms of northeast striking lamprophyre dykes were later intruded into the sedimentary rocks between 34 to 36 Million years ago (Carter, 1964 and 1982). These swarms consist of several hundred dykes per kilometre and range in thickness from a few centimetres to 15 metres. Northeast of the deposit are 0.6 to 1.6 million-year-old olivine basalt lava flows (Carter, 1964). These plateau-type lava flows are flat lying to gently dipping and extend over considerable distances. These lava flows are displayed as well-developed columnar jointed cliff faces over 100 metres high with talus deposited at the cliff base. The regional bedrock geology was mapped by Steininger (1981) and Carter et. al. (1986) and then digitized and made available from the British Columbia Government Ministry of Energy, Mines and Petroleum Resources (MEMPR) at a scale of 1:100,000. The Kitsault Project area is displayed on Figure 2.1. 2.5 HYDROGEOLOGY
The groundwater recharge for the Kitsault Project is expected along the mountain slopes and in the headwaters of each catchment. Groundwater will flow down the slopes within the thin veneer overburden and weathered bedrock materials and within the bedrock towards stream channels. Groundwater will either discharge into streams or flow sub parallel to stream valleys in alluvial deposits.

7 of 26 VA101-343/6-1 Rev 0 January 13, 2011
SECTION 3.0 - GEOTECHNICAL SITE INVESTIGATION PROGRAM
3.1 GENERAL
The 2010 geotechnical site investigation program was conducted from July 1 to August 23, 2010. The primary objectives of the site investigation program were to evaluate geotechnical and hydrogeological conditions encountered at the TMF and other proposed mine site infrastructure to support feasibility level engineering designs and to install long-term groundwater monitoring wells to support environmental baseline studies. The 2010 geotechnical site investigation program included the following activities:
• A total of 1287 metres were drilled in 25 geotechnical drillholes (K10-01GT to K10-27GT, with the exception of drillhole K10-07GT and K10-26GT which was drilled for pit slope design and exploration by others) using diamond and ODEX drilling techniques.
• Detailed geotechnical logging of drill core was carried out in all drillholes to characterize the rock mass quality.
• Unconfined Compressive Strength testing of selected representative core samples collected from geotechnical drillholes.
• In-situ packer hydraulic conductivity testing was conducted to evaluate the permeability of the rock mass.
• Monitoring wells were installed in selected drillholes to allow for long-term groundwater sampling.
• Monitoring wells were developed to remove fines from screened zones and allow indicative groundwater quality samples to be obtained.
• Response tests were conducted in monitoring wells to estimate the hydraulic conductivity of the completion zone.
• Seventy vibracore drillholes (VC10-01 to VC10-70) were drilled to investigate overburden thickness along the Northeast TMF Embankment and Rock Management Facility Areas.
• Four test pit excavations (TP10-01 to TP10-04) were made using machine and hand dug techniques.
• Laboratory index test work on soil samples recovered from the drillhole and test pit programs.
Drillhole, vibracore and test pit locations were accessed via existing mining and forestry roads and by helicopter. Locations were chosen to get as close to planned drilling sites as possible, while minimizing the vegetation disturbance and eliminate the crossing of waterways. Accurate survey coordinates and elevations of all drillholes were obtained from McElhanney. Coordinates reference the NAD83 CSRS datum with a horizontal accuracy of +/-2 cm. Elevations are GPS derived based on project point 9936 and have a relative accuracy of +/-5 cm. Coordinates and elevations of test pit and vibracore locations were obtained from a hand held GPS (Garmin GPS Map60 GSx) using the UTM-NAD83 Zone 9 coordinate system, with an accuracy of three to seven metres depending on available satellites.

8 of 26 VA101-343/6-1 Rev 0 January 13, 2011
3.2 GEOTECHNICAL DRILLING PROGRAM
A total of 1287 linear metres of drilling was completed in 25 drillholes (K10-01GT to K10-27GT with the exception of K10-07GT and K10-26GT which were drilled for open pit design and exploration by others), ranging from 13 to 163 metres in depth. The drillholes were located with the objective of collecting geotechnical and hydrogeological data at the TMF and mine site infrastructure to support the feasibility engineering design. Six of these drillholes were located around the mine catchment with the objective of collecting hydrogeological data and installing long-term groundwater monitoring wells for environmental baseline data collection. The drillhole details are summarized in Table 3.1 and presented on Figure 3.1. Helicopter accessible geotechnical drillholes completed by Radius Drilling Corp using a helicopter portable drill rig R 1500 capable of diamond drilling. Road accessible drillholes were drilled by Geotech Drilling Services Ltd. (Geotech) using a Fraste DR232 drill rig capable of ODEX drilling in overburden and diamond drilling in bedrock. All drillholes, with the exception of K10-07GT, K10-26GT and K10-27GT, were drilled under the supervision of KP field personnel. Overburden drilling was completed using the ODEX drilling technique. Bedrock was cored with a diamond bit using a wireline standard barrel set-up. Depending on the bedrock conditions, a five or ten foot core barrel was used. This coring method allowed continuous core samples as the drillhole was advanced. All drillholes were initiated with HQ diameter equipment using a triple tube core barrel set up. Drillhole K10-90GT reduced to NQ diameter when torque resistance became too high. Drillholes were advanced primarily using water as the drilling fluid; however a biodegradable polymer WDS-120 was occasionally added to the drill water when it was required. Standard Penetration Testing (SPT) was completed in overburden at selective depth intervals in drillholes (K10-01GT, 02GT, 03GT, 04GT, 05GT, 06GT, 08GT, 10GT and 11GT). SPT’s were conducted within overburden materials at three metre increments until bedrock was encountered. SPT’s were conducted using a 140-lb automatic hammer with a 30-inch drop setup, equipped with a 24 inch split spoon sampler. Blow counts were recorded at three continuous 6-inch intervals for a total of 18-inches of sampling length, and an additional 6-inch is driven to collect a larger sample. Selected samples were collected for laboratory testing. 3.2.1 Geotechnical Logging
Detailed geotechnical logging of drill core was carried out in all drillholes to characterize the rock mass quality using Bieniawski’s Rock Mass Rating (RMR89) classification system. The following information was collected on a run by run basis:
• Core run interval
• Core recovery
• Rock Quality Designation (RQD)
• Lithological description
• Field estimated Unconfined Compressive Strength (UCS) of rock
• Number of discontinuities

9 of 26 VA101-343/6-1 Rev 0 January 13, 2011
• Discontinuity types
• Joint condition of discontinuities (i.e. roughness, aperture, alteration, infillings, etc.), and
• Infilling materials on discontinuity. The rock mass rating (RMR89) logging sheet is provided in Table 3.2. Drillhole logs and detailed geotechnical logging spreadsheets are presented in Appendices A1 and A2, respectively. Site photographs and drill core photographs are included in Appendices A3 and A4, respectively.
3.2.2 Hydraulic Conductivity Testing
In-situ packer hydraulic conductivity testing was conducted to evaluate the permeability of the rock mass. Tests using the Lugeon method were performed at approximately 25 metre intervals, where possible, while advancing the drillhole. IPI Hydraulic packer tests were carried out by first pulling the desired amount of drill rods out of the drillhole, leaving a section of drillhole open. The packer equipment was then lowered inside the drill rods to the drill bit with the wireline. The packer bladders were then inflated using water to isolate the test interval. Water was then pumped into the isolated test interval to achieve a constant differential head. Three ascending and two descending water pressure stages were applied and flow of water into the rock mass was recorded. Individual packer hydraulic conductivity testing sheets are provided in Appendix B1 and the hydraulic conductivity results are summarized in Table 3.4, and hydraulic conductivity results vs. elevation are summarized on Figure 3.2. Packer hydraulic conductivity testing and response testing conducted in monitoring well screened zones have comparably similar hydraulic conductivity testing results to the packer testing results in the same depth. Field data indicates the rock mass typically has a low permeability with hydraulic conductivities estimated by in-situ testing to be in the order of 10-7 to 10-5 cm/s. Groundwater samples will be collected from monitoring wells for long term groundwater studies. A summary of the results of all permeability testing conducted is presented in Table 3.1.
3.2.3 Monitoring Well Installation
Hydrogeological investigations were integrated into the geotechnical site investigation program to install long-term monitoring wells for groundwater baseline data collection. Groundwater monitoring wells were located around the catchment, downgradient of existing waste dumps, adjacent to proposed mine site infrastructure, and at geotechnical investigation locations. Installation of monitoring wells was completed by Geotech Drilling and Radius Drilling under the direction and supervision of KP field personnel. Monitoring well completion zones were installed in areas of interest such as bedrock contacts and/or permeable zones identified by geotechnical logging and packer testing results. The monitoring wells were constructed with 2-inch diameter, decontaminated, flush-threaded, Schedule 40 polyvinyl chloride (PVC) riser pipes. The screened completion zone sections were installed using 2-inch diameter Schedule 80 PVC screens with No. 10 (0.010 inch) machined slots. The annular space around the screen was backfilled with silica sand in the completion zones. The completion zone was sealed at either end with hydrated bentonite chips or pellets. A cement/grout mix was used to backfill the drillhole to surface above the top bentonite seal. The PVC pipe extends above ground surface with the drill casing left in
10 of 26 VA101-343/6-1 Rev 0 January 13, 2011
the drillhole or a monument installed to protect the extended PVC pipe. Aluminium caps with locks have been installed to prevent tampering with the monitoring wells. Each well was developed and response tests were conducted in screened completion zones. Monitoring well completion details are summarized in Table 3.1 and well completion detail logs are provided in Appendix B2. Packer hydraulic conductivity testing sheets, monitoring well installation details and response testing sheets are available in Appendices B1, B2, and B3, respectively.
3.2.4 Well Development
The monitoring wells were developed before they were sampled to remove fines from the completion zone, enhance the flow of formation water through the well, and to provide water samples with a minimal amount of suspended solids. Well development was conducted after the surface concrete seal had hardened and a minimum of 24 hours had passed after installation. Well development was completed with a Waterra© Hydrolift II groundwater pump, 5/8” high-density polyethylene tubing, a surge block, and a D-25 Waterra© foot valve. Development started at the beginning of the screen and was slowly moved to the bottom. Several passes were made along the screen length to ensure thorough development, to create a well-graded filter pack around the screens, and to increase the well yield for reliable sample collection.
3.2.5 Response (Hvorslev) Testing
Response testing, also referred to as slug or Hvorslev testing, was conducted to estimate the hydraulic conductivity in the completion zone of the monitoring well installations. These tests involve displacing the static water level in the monitoring well, and recording subsequent changes in the water level over time until the water level rises or falls to static conditions. The results of the individual hydraulic conductivity tests are included in Appendix B3.
3.3 VIBRACORE PROGRAM
A Vibracore drill program was conducted to determine the depth to bedrock at the Northeast Embankment of the TMF and at a proposed WRMF that has now been removed from the mine site plan. The drilling was conducted by Nations Drilling Inc. and supervised by KPL site personnel. A total of
11 drillholes were completed at the proposed North WRMF, denoted VC10‐01 to VC10‐8D.
Four drillholes (VC10‐08A to VC10‐08D) were completed one site to confirm depth to bedrock was
consistent. Sixty-one vibracore drillholes (VC10‐41 to VC10‐56) were drilled along the Northeast TMF
Embankment VC10‐09 to VC10‐70. Sixteen of these drillholes were drilled for geochemical purposes as instructed by Avanti. The UTM coordinates for all vibracore drillholes are listed in Table 3.3 and the locations are shown on Figure 3.3 and Figure 3.4 for the North WRMF and Northeast Embankment of the TMF respectively. Vibracore drilling was conducted by using five foot long, BQ’ diameter rods and a core catcher to retain the overburden material. The rods were connected to a head which created the vibrations to advance the

11 of 26 VA101-343/6-1 Rev 0 January 13, 2011
rods. The rods where rotated and extra force was added by pushing down or standing on pipe wrenches attached to the rods. Once the rods advanced through five feet of material, the head was disconnected, a new rod was connected and the head was re-connected. This process was repeated to bedrock refusal. In cases where it was not clear whether bedrock had been reached, a second or third drillhole was conducted nearby for verification purposes.
A gin‐pole was set up next to the drillhole to extract the rods. The gin‐pole base has two holes: one for the rods which are to be pulled out, and another to place a spare rod to act as an anchor. A wire cord was attached to the head and over a pulley, and was cranked by hand. Some material came out of the rods quite easily. For the stiffer material, the rods were connected to the head so that vibration could help loosen the material. For many of the deeper drillholes, a layer of coarse sand and gravel was encountered close to bedrock. The drill could not go deeper, and it was assumed that bedrock had been reached. However, it is possible that this layer extends further and the drill could not go through this coarser material; thus bedrock may be deeper than recorded. Logs for the vibracore drillholes are provided in Appendix C1 and vibracore photographs are provided in Appendix C3. 3.4 TEST PIT PROGRAM
Three test pits (TP10-01 to TP10-03) were excavated by Bear Creek Contracting Ltd. from Terrace using a 320 John Deere excavator. These test pits were conducted in the proposed truck shop area after drillhole K10-03GT encountered a soft silt layer at a shallow depth. The test pits were initiated to investigate the extent of the silt layer around the drillhole. Only one of the test pits encountered the silt layer and samples were collected. After these test pits were conducted drillholes K10-08GT, K10-10GT and K10-11GT were drilled to further investigate the silt layer. Each test pit excavation was logged and photographed by KP personnel, and samples were collected from representative materials for laboratory testing. Once completed, the test pits were backfilled and compacted using the excavator. Logs for the test pits are provided in Appendix C2 and test pit photographs are provided in Appendix C3. 3.5 LAVA FLOW MAPPING
Site reconnaissance was conducted in the project area to investigate the lava flow extent on the eastern side of the TMF as a potential seepage pathway. Site reconnaissance was conducted by KPL site personnel, J. Speed from June 17 – 29, 2010. Lava flow mapping of the contact between the lava flow and the Bowser Lake Group was estimated from topography and outcrops to be at 805 masl on the Northeast Embankment and 900 masl at the South Embankment. Results of the lava flow mapping are presented on Figure 3.5. 3.6 LABORATORY TESTWORK
Select samples from drillholes and test pits were collected for laboratory testwork, to characterize the material types found at the site as part of the site investigation program.
12 of 26 VA101-343/6-1 Rev 0 January 13, 2011
3.6.1 Index Testing
Bulk samples of potential borrow materials were collected from SPT split spoon sampler and from test pits for specialized index testing to evaluate the suitability of these materials for specific end uses. Index testing of the samples was conducted at the Knight Piésold Geotechnical Laboratory in Denver, Colorado. Particle size distributions were conducted for 11 samples (using both conventional screen and hydrometer methods), in order to assess the grading characteristics of the deposits that were encountered on site. Screen and hydrometer particle size analyses were carried out on the samples in accordance with ASTM D-422 procedures. The hydrometer analysis is used to determine the silt and clay fraction particle sizes for material with a large finer fraction. Specific Gravity testing was conducted on all samples in accordance with the ASTM test designation D-854. Atterberg limits were conducted on cohesive soil samples if over 5% was finer than the 0.002 mm grain size sieve (TP09-08, TP09-12, TP09-13, TP09-15, TP09-18, H-229718, H-229719, H-229720 and H-229720). Atterberg Limit (Plastic and Liquid Limits) testing was conducted in accordance with the ASTM test designation D-4318. The index testing results are summarized in Table 3.5. Detailed laboratory testing results are provided in Appendix D1. These samples mainly consisted of waste rock samples from the historic waste rock dumps, collected using SPT split spoon sampler. The waste rock samples are well graded gravel to silt (silt % is usually 3 to 20% and non-plastic). One sample from the truck shop area (TP10-1) contained 31% gravel (some of this is interpreted as pit infilling), 42% sand, 22% silt, and 5% clay; this is more sand than originally interpreted.
3.6.2 Unconfined Compressive Strength Testing
Core samples were collected from geotechnical drillholes for Unconfined Compressive Strength (UCS) testing and select samples were submitted to the Norman B. Keevil Institute of Mining Engineering, University of British Columbia. The samples were tested using ASTM Method D2166 (UCS) and ASTM D-3148-02 (Young’s Modulus). A summary of the UCS test results is included in Table 3.6. Detailed laboratory test results are included in Appendix D2. Samples were collected for Unconfined Compressive Strength (UCS) laboratory testing as part of the drilling program. A total of 65 UCS samples were selected on site from the geotechnical drillholes completed in 2010 at the tailings embankment and mine site infrastructure locations from drillholes at foundation locations (K10-01GT, K10-02GT, K10-03GT, K10-04GT K10-05GT, K10-09GT, K10-12GT, K10-13GT, K10-14GT, K10-15AGT, K10-16GT, K10-17GT, K10-22GT, K10-23GT, K10-24GT, and K10-25GT). These samples were selected to represent the range of the rock conditions and lithologies observed in the geotechnical drillholes. A summary of the

13 of 26 VA101-343/6-1 Rev 0 January 13, 2011
UCS test results is presented in Table 3.6 and below. Detailed laboratory test results are included in Appendix D2.
Lithology Number of
Tests UCS MPa
Young Modulus (E) GPa
Poisson Ratio (n)
Greywacke 22 range 40 to 219
mean 95 range 15 to 71
mean 49 range 0.17 to 0.42 mean 0.27
Argillite 9 range 21 to 130
mean 66 range 26 to 88
mean 51 range 0.24 to 0.37
mean 0.33
Greywacke / Argillite
16 range 31 to 189
mean 84 range 26 to 77
mean 46 range 0.14 to 0.52
mean 0.29
Trachyandesite 17 range 24 to 303
mean 197 range 13 to 75
mean 46 range 0.28 to 0.57
mean 0.40
AVERAGE Total # of tests 65
98 47 0.31

14 of 26 VA101-343/6-1 Rev 0 January 13, 2011
SECTION 4.0 - GEOTECHNICAL CONDITIONS FOR ENGINEERING DESIGN
4.1 GEOTECHNICAL MATERIAL CHARACTERISTICS
The geotechnical conditions of the overburden and rock mass have been assessed using the geological and geotechnical information from drillholes, vibracore drillholes, test pits, site reconnaissance and laboratory test results. The site is characterized by the following sequences of overburden and bedrock. 4.1.1 Organic Material
Typically wet soft fibrous organic material overlays bedrock in the Kitsault project area. Little other overburden materials were found on site due to extensive glaciation. Vibracore drilling along the Northeast Embankment found organic deposits between 0.08 and 13 metres thick. The organic deposits are thickest in the valleys and almost nonexistent on the topographic highs, averaging about 2 metres thickness along the embankment alignment. The estimated depth to bedrock has been contoured using the vibracore and drilling information as shown on Figure 3.4. This organic material will be required to be removed before construction.
4.1.2 Widdzech Mountain Lava Flows
Recent plateau-type trachyandesite lava flows dominate the topography northeast of the deposit. These lava flows form well-developed columnar jointed cliff faces over 100 metres high in places with talus accumulations at the cliff base. These plateau-type lava flows are flat lying to gently dipping and extend over considerable distances. Drillholes K10-09GT and K10-14GT drilled thru the lava flow and found a thickness of 46 to 118 metres thickness (finding the contact at an elevation of 809 masl (in northeast) to 830 masl (in south). Lava flow mapping of the contact between the lava flow and the Bowser Lake Group was estimated from topography and outcrops to be at 805 masl on the Northeast Embankment and 900 masl at the South Embankment. Drillhole K10-09GT drilled through a series of lava flows encountering four distinct layers of lava flows between 24 and 35 metres thick. At the base of each lava flow layer the rock is weaker and vuggy before transitioning back to a very strong massive rock. Drillhole K10-14GT encountered 6 metres of clay and gravel followed by 6 metres of conglomerate before the bedrock contact. The lava flow extent was mapped in the field and results are shown on Figure 3.5. The lava flows were found to have the following properties:
• The rock mass is classified as ‘GOOD’ to ‘VERY GOOD’ rock using Bieniawski’s Rock Mass Rating classification (RMR 89) with RMR values ranging from 40 to 85 and a mean value of 65. The lower values are from the weaker layers between lava flows.
• Rock Quality Designation (RQD) values range from 20 to 100% and a mean value of 73%. The lower values were from the weaker layers at the top and bottom margins of the lava flows.
• In-situ hydraulic permeability testing indicates the rock mass typically has a low permeability with hydraulic conductivities estimated by in-situ testing to be in the order of 10-6 to 10-4 cm/s.
• At the plantsite the groundwater table was found at approximately 23 m depth (902 masl elevation).

15 of 26 VA101-343/6-1 Rev 0 January 13, 2011
• At the downstream end of the Northeast Embankment the groundwater table was found at approximately 46 metres depth (841 masl elevation). This is 11 metres below the lava flow / Bowser Lake Group contact.
• UCS testing of lava flow samples produced UCS values ranging from 24 to 303 MPa, with a mean of 84 MPa; Young’s Moduli ranging from 13 to 75 GPa, with a mean value of 46 GPa; and Poisson’s Ratios ranging from 0.28 to 0.57, with a mean value of 0.40.
4.1.3 Bowser Lake Group Sedimentary Rocks
The primarily basement bedrock is Bowser Lake Group greywacke and argillite. The Bowser Lake Group typically consists of interbedded greywacke and argillite with minor limestone and conglomerate. Individual beds vary in thickness from a few centimetres to upwards of 15 metres with a ratio of roughly 80% greywacke, 19% argillite and 1% limestone and conglomerate. Regionally, the Bowser Lake Group has a northwest strike and a steep northeast dip, but numerous variations to this trend are interrupted by small scale folding. Where faulting and intense jointing do not occur, these rocks are strong and display good competency. Where faults or intense jointing occur, the rock was less competent and characterized by small blocks with minor clay seams and fault gouge. Graphite is commonly found coating joint faces and most often encountered near weaker argillite contacts. These argillite layers were generally less than 10 metres thick. In the site topography greywacke layers are seen as topographic highs and the weaker argillite layers are seen as topographic lows. The Bowser Lake Group was found to have the following properties:
• The rock mass is classified as ‘FAIR’ to ‘GOOD’ rock using Bieniawski’s Rock Mass Rating classification (RMR 89) with RMR values ranging from 50 to 70 and a mean value of 60. The lower values are from the weaker argillite layers.
• Rock Quality Designation (RQD) values range from 50 to 90% a mean value 65%. The lower values are from the weaker argillite layers.
• In-situ hydraulic permeability testing indicates the rock mass typically has a low permeability with hydraulic conductivities estimated by in-situ testing to be in the order of 10-7 to 10-5 cm/s.
• UCS testing of greywacke and argillite samples produced UCS values ranging from 21 to 303 MPa, with a mean of 98 MPa; Young’s Moduli ranging from 13 to 88 GPa, with a mean value of 51 GPa; and Poisson’s Ratios ranging from 0.14 to 0.57, with a mean value of 0.39.
4.2 SOUTH EMBANKMENT FOUNDATION CONDITIONS
The South TMF Embankment is strategically located to optimize the natural topography. Geological sections along the length of this and the Northeast Embankment are shown on Figure 4.1 and a longitudinal geological section through the TMF is shown on Figure 4.2, with the locations of these sections shown on Figure 3.1. The foundation conditions are characterized by thin colluvium cover on the side slopes in a deeply incised v-shaped valley bedrock surface. The end of the historic Patsy WRMF is located on the right abutment of the embankment in the valley bottom. Three drillholes (KP10-22GT, 04GT and 23GT) were drilled in the vicinity of the proposed South TMF Embankment. Drillhole K10-04GT located in the centre of the embankment intersected 10.6 metres of loose waste rock material from the historical Patsy WRMF. The bedrock geology consisted of bedded Bowser Lake Group

16 of 26 VA101-343/6-1 Rev 0 January 13, 2011
greywacke and argillite that is generally classified as ‘FAIR’ to ‘GOOD’ rock. RMR values range from 40 to 70 with a mean of 60. UCS testing results indicated the rock mass is strong to very strong with UCS values ranging from 100 to 200 MPa. The rock mass permeability was found to be low, with hydraulic conductivities ranging from 10-7 to 10-5 cm/s. This in-situ water testing has shown the rock mass in the foundation is generally of low permeability and for the most part will not require grouting. However, the jointed nature of the embankment foundation rock mass includes steeply dipping and sheet joints parallel to the creek valley increases significant risk of individual seepage paths through the foundations. The depth and extent of curtain grouting will have to be determined by additional geotechnical investigations during the detailed engineering stage of the embankment. 4.3 NORTHEAST EMBANKMENT FOUNDATION CONDITIONS
The Northeast TMF Embankment will be constructed at an elevation of approximately 760 metres to the northeast of the existing open pit. This site is strategically located with respect to the Kitsault Pit and to optimize the natural topography. The embankment is approximately 1560 metres in length, and a height of up to 100 metres. The starter embankment will be constructed using local quarry, with staged raises being constructed with cyclone sand. The site is characterized by thin topsoil and organic peat deposits overlying an undulating bedrock surface. Vibracore drillholes that were drilled along the embankment alignment to investigate the organic deposit thickness found between 1 and 13 metres of organics overlying bedrock that will need to be removed prior to construction. Five drillholes (KP10-14GT, 18GT, 17GT, 16GT and 15AGT) were drilled in the vicinity of the proposed Northeast TMF Embankment. Drillholes K10-15AGT, 16GT, 17GT and 18GT encountered shallow bedrock and Bowser Lake Group sedimentary rocks. The bedrock is bedded Bowser Lake Group greywacke and argillite that is generally classified as ‘FAIR’ to ‘GOOD’ rock. RMR values range from 40 to 70 with a mean of 60. UCS testing results indicated the rock mass is ‘MEDIUM STRONG’ to ‘EXTREMELY STRONG’ with UCS values ranging from 100 to 200 MPa. The rock mass permeability is low, with hydraulic conductivities ranging from 10-7 to 10-5 cm/s that are consistent with depth. Drillhole K10-14GT was drilled downstream of the TMF to investigate lava flow thickness and permeability at the northern end of the embankment. Lava flow thickness was found to be 33.7 metres thick at this drillhole. The trachyandesite lava flow is classified as ‘GOOD’ rock. RMR values range from 40 to 85 with a mean of 65. The rock mass permeability is low, with hydraulic conductivities ranging from 10-6 to 10-4 cm/s that are consistent with depth. UCS testing results indicated the rock mass is ‘MEDIUM STRONG’ to ‘EXTREMELY STRONG’ with UCS values ranging from 100 to 300 MPa. The contact between the lava flow and the underlying Bowser Lake Group was found at 46 metres depth, at elevation 830 masl. 4.4 WASTE ROCK MANAGEMENT FACILITY FOUNDATION CONDITIONS
Waste rock will be either used in the construction of the TMF South Embankment, or placed in the East Waste Rock Management Facility (WRMF). The East WRMF is located between the South Embankment of the TMF and the Kitsault Pit, encapsulating the existing Patsy WRMF. Four drillholes (K10-06GT,

17 of 26 VA101-343/6-1 Rev 0 January 13, 2011
05GT, 04GT and K09-15GT) were drilled in the vicinity of the East WRMF; the locations of these drillholes are shown of Figure 4.3. These drillholes found the waste rock to be 10.8 to 20.1 metres thick. The overlying waste rockfill is described as coarse to fine grained gravel with silt that is loose to compact. Standard Penetration Testing (SPT) N values range from 5 to 50. All drillholes encountered an organic layer 0.5 to 0.8 metres thick between the waste rock and bedrock contact. Organics will need to be removed along the final toe of the waste dump to improve stability. The bedrock contact is at 670 masl elevation to the west closet to the open pit. The bedrock rises 47 metres to 717 masl elevation at the South Embankment. The bedrock is bedded greywacke and argillite that is generally classified as ‘FAIR’ to ‘GOOD’ rock. RMR values range from 40 to 70 with a mean of 60. UCS testing results indicated the rock mass is ‘STRONG’ to ‘VERY STRONG’ with UCS values ranging from 41 to 138 MPa. The water table was encountered at 12.4 to 20.7 metres depth in the bedrock unit. In drillhole K10-06GT, a drillhole closet to the open pit area, the bedrock encountered was porphyritic granodiorite related to the Northeast Porphyry of the Kitsault deposit. The granodiorite was classified as ‘GOOD’ rock. RMR values range from 60 to 80 with a mean of 70. The groundwater level was found in the basement rock at between 11.9 to 21.9 metres depth. 4.5 PRIMARY CRUSHER FOUNDATION CONDITIONS
The proposed Primary Crusher location is on the existing historic Clary waste dump at the north end of the existing open pit at an approximate elevation of 650 masl. One drillhole (KP10-01GT) was drilled in the vicinity of the proposed Primary Crusher. The drillhole found that the Primary Crusher is situated on loose rockfill that is approximately 10 metres thick overlying competent bedrock. Standard Penetration Testing (SPT) N values range from 5 to 14. The rockfill was described as coarse to fine grained gravel with silt that is loose to compact. Bowser Lake Group bedrock was encountered at a depth of 10.2 metres. The bedrock is bedded greywacke and argillite that is generally classified as ‘FAIR’ to ‘GOOD’ rock. RMR values range from 40 to 70 with a mean of 60. UCS testing results indicated the rock mass is ‘MEDIUM STRONG’ to ‘EXTREMELY STRONG’ with UCS values ranging from 69 to 218 MPa. The water table was encountered at 13.9 metres depth in the bedrock unit. 4.6 TRUCKSHOP, WAREHOUSE AND FUEL STORAGE AREA FOUNDATION CONDITIONS
The proposed Truckshop, Warehouse and Fuel storage area is situated on relatively flat slopes on the existing Clary WRMF with thick trachyandesite lava flows and associated talus deposits of Widdzech Mountain to the east. Five drillholes (KP10-02GT, 03GT, 08GT, 10GT and 11GT) were drilled in the vicinity of the proposed Truckshop, Warehouse and Fuel storage area. The surficial cover is predominantly waste rock overlying organic deposits and some swamps and bogs located in depressions and poorly drained areas. A brief summary of the materials encountered are provided below.
• Drillhole information collected in this area indicates in excess of up to 26 metres of loose silty gravel waste rock deposits overlying a sloping siltstone/argillite bedrock surface. Bedrock depths of 4 to 11 metres were more typically found in the drillholes covered by waste rock, the depth to bedrock increases downslope towards the west. These deposits will require removal prior to construction of the truckshop/warehouse foundations.
• Drillhole K10-03GT encountered a very soft silty-clay between 3 and 11 metres depth that is most likely unsuitable waste materials stockpiled then encapsulated with additional competent waste

18 of 26 VA101-343/6-1 Rev 0 January 13, 2011
material. Three additional drillholes were drilled approximately 60 metres away surrounding this drillhole. Two of these drillholes, K10-08GT and K10-10GT, encountered between 2.7 to 4.5 metres of silt-clay before bedrock with waste rock overlain. Drillhole K10-11GT did not encounter the silty-clay layer. All the drillholes encountered an approximately 1 metre thick organic silt layer at the bedrock contact.
• The bedrock is bedded Bowser Lake Group greywacke and argillite that is generally classified as ‘FAIR’ to ‘GOOD’ rock. RMR values range from 40 to 70 with a mean of 60.
• UCS testing results indicated the rock mass is ‘MEDIUM STRONG’ to ‘EXTREMELY STRONG’ with UCS values ranging from 82 to 167 MPa.
• The water table was encountered at between 5.4 and 30.2 metres depth in the bedrock unit. The bedrock slopes west and the water table deepens with bedrock.
4.7 COARSE ORE STOCKPILE
The Coarse Ore Stockpile (COS) is located east of the Process Plant on thick columnar trachyandesite lava flows to the north of Widdzech Mountain. The site is characterized by thin topsoil of organic peat deposits overlying a relatively flat bedrock surface. One drillhole, K10-13GT, was drilled in the vicinity of the proposed COS. A summary of the geologic profile from site reconnaissance and drilling investigations is provided below:
• The bedrock is columnar jointed trachyandesite lava flows that are classified as ‘GOOD’ rock. Vertical fractured zones or columns are approximately 0.5 to 1 metres wide.
• UCS laboratory test results on the lava flows indicate the rock mass is ‘STRONG’ to ‘EXTREMELY STRONG’ with UCS values ranging from 63 to 279 MPa.
• The water table was encountered at 38.1 metres depth in the bedrock unit, approximately 902 masl elevation.
• Bedrock outcrop covers approximately 30 percent of the area.
• Topsoil stripping should assume a depth of 300 mm over 35% of the COS area and 600 mm on the remaining 35% COS area.
• A weaker, vuggy transition zone between two lava flow layers was logged in drillhole K10-13GT from 10.8 to 19.9 metres depth, however the corresponding UCS test result for this contact was >260 MPa.
4.8 PROCESS PLANTSITE AND PERMANENT CAMP
The Process Plant is located approximately 150 metres west of the Coarse Ore Stockpile on thick columnar trachyandesite lava flows to the north of Widdzech Mountain. This site is strategically located with respect to the Open Pit, the TMF, access roads and existing power line. The site is characterized by thin topsoil and organic peat deposits overlying relatively flat bedrock. Four drillholes, KP10-09GT and 12GT (at the Camp) 24GT and 25GT (at the plantsite), were drilled in the vicinity of the proposed Process Plant and Camp. A summary of the geologic profile from site reconnaissance is provided below:
• The bedrock is columnar jointed trachyandesite lava flows that are generally classified as ‘GOOD’ rock. Vertical fractured zones or columns are approximately 0.5 to 1 metres wide.
• UCS laboratory test results on the trachyandesite lava flows indicate the rock mass is ‘STRONG’ to ‘EXTREMELY STRONG’ with UCS values ranging from 72 to 303 MPa.
• The water table is located at 21.4 to 25.1 metres depth below ground surface at an elevation of 902 masl elevation in all drillholes.

19 of 26 VA101-343/6-1 Rev 0 January 13, 2011
• Drillhole K10-09GT intersected the contact between trachyandesite and the Bowser Lake Group greywacke and argillite at 118 metres depth, corresponding to elevation 806 masl.
• Bedrock outcrop covers approximately 30 percent of the area.
• Topsoil stripping should assume a depth of 300 mm over 35% of the area and 600 mm on the remaining 35% area.
4.9 SUMMARY
A geologic profile is provided for each of the components in the following table:
Location Geologic Profile Foundation Recommendation
Truckshop / Warehouse
Loose waste rock between 11 and 26 metres thick overlying topsoil, organics and soft fine grained soil
deposits 7 to 26 metres thick overlying component bedrock
Move structures southwards and into natural ground. Excavate out topsoil and organics and place foundations
on bedrock
Primary Crusher Loose waste rock up to 11 metres
thick overlying bedrock
Sub-excavate loose rockfill out at an angle of 45 degrees from the corner
of the structure and replace with compacted rockfill to improve bearing
capacity and minimize settlement.
Coarse Ore Stockpile Topsoil and organics up to 1 metre thick overlying competent bedrock
Strip topsoil and organics and place foundations on rock
Process Plant Topsoil and organics up to 1 metre thick overlying competent bedrock
Strip topsoil and organics and place foundations on rock
Northeast TMF Embankment
Topsoil and organics up to 1 to 5 metres thick overlying competent
bedrock
Strip topsoil and organics and place foundations on rock
South TMF Embankment
Loose waste rock up to 11 metres thick overlying bedrock
Excavate loose rockfill and overburden from existing waste dump
East Waste Rock Management Facility
Loose waste rock up to 11 metres thick overlying bedrock
Remove topsoil around perimeter of waste dump
4.10 GEOTECHNICAL PARAMETERS AND FACTORS INFLUENCING FOUNDATION DESIGN
The geotechnical parameters required for foundation design are summarized below:
• Allowable bearing pressures
• Depth of frost penetration estimates
• Groundwater and drainage requirements, and
• Shear strength parameters.
20 of 26 VA101-343/6-1 Rev 0 January 13, 2011
4.10.1 Allowable Bearing Pressures
An allowable bearing pressure of 300 kPa is recommended for the various footing geometries on loose rockfill and 450 kPa for dense rockfill and 1000 kPa for footings on competent rock.
4.10.2 Depth of Frost Penetration
Depth of Frost Penetration Frost heave and frost jacking are the two most troublesome consequences of soil freezing. The components which cause heaving to occur are as follows: freezing temperatures in soils, a water source, and frost-susceptible soil. Common approaches to mitigating this problem are sufficient foundation depth, over-excavation and replacement with non-frost susceptible backfill (including proper drainage), thermal protection, and footing enlargements to resist heave forces. The final foundation design to counter frost heave is governed by economic considerations. The estimated depth of frost penetration will vary with the type of foundation material and for preliminary purposes assume the following:
• Rockfill – 3 m, and
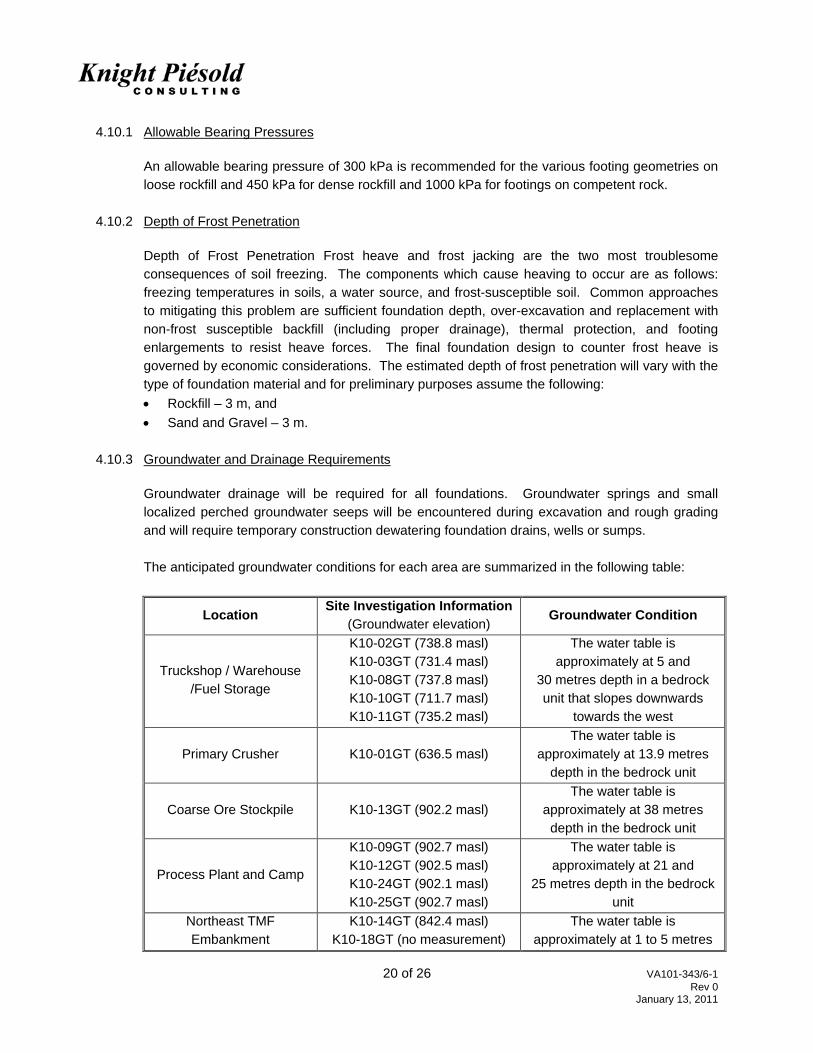
• Sand and Gravel – 3 m. 4.10.3 Groundwater and Drainage Requirements
Groundwater drainage will be required for all foundations. Groundwater springs and small localized perched groundwater seeps will be encountered during excavation and rough grading and will require temporary construction dewatering foundation drains, wells or sumps. The anticipated groundwater conditions for each area are summarized in the following table:
Location Site Investigation Information
(Groundwater elevation) Groundwater Condition
Truckshop / Warehouse /Fuel Storage
K10-02GT (738.8 masl) K10-03GT (731.4 masl) K10-08GT (737.8 masl) K10-10GT (711.7 masl) K10-11GT (735.2 masl)
The water table is approximately at 5 and
30 metres depth in a bedrock unit that slopes downwards
towards the west
Primary Crusher K10-01GT (636.5 masl) The water table is
approximately at 13.9 metres depth in the bedrock unit
Coarse Ore Stockpile K10-13GT (902.2 masl) The water table is
approximately at 38 metres depth in the bedrock unit
Process Plant and Camp
K10-09GT (902.7 masl) K10-12GT (902.5 masl) K10-24GT (902.1 masl) K10-25GT (902.7 masl)
The water table is approximately at 21 and
25 metres depth in the bedrock unit
Northeast TMF Embankment
K10-14GT (842.4 masl) K10-18GT (no measurement)
The water table is approximately at 1 to 5 metres

21 of 26 VA101-343/6-1 Rev 0 January 13, 2011
K10-17GT (811.4 masl – artesian)
K10-16GT (801.4 masl) K10-15A (796.6 masl)
depth in the bedrock unit
South TMF Embankment K10-22GT (799.9 masl) K10-04GT (708.8 masl) K10-23GT (788.1 masl)
The water table is 1 to 4 metres on slopes and 19 metres in
valley
East Waste Rock Management Facility
K10-05GT (699.3 masl) K10-06GT (679.8 masl)
The water table is approximately at 12 to 22
metres depth in the bedrock unit
4.10.4 Shear Strength Parameters
The shear strength parameters recommended for rockfill and sand and gravel is based on experience on similar materials on other projects. These parameters may be used for both in-situ and compacted materials. The results are summarized as follows:
Material Description
Internal angle of friction φ’ (degrees)
Cohesion (c)
Approximate Unit Weights (KN/m3)
Rockfill 37 0 22
Sand and Gravels
37 0 20

22 of 26 VA101-343/6-1 Rev 0 January 13, 2011
SECTION 5.0 - CONCLUSIONS
5.1 GEOTECHNICAL MATERIAL CHARACTERISTICS
The geotechnical conditions of the overburden and rock mass have been assessed based on geological and geotechnical information collected during the 2010 site investigation program. The site is characterized by the following sequences of overburden and bedrock.
• Organic Material – Typically wet soft fibrous organic material between 0.1 and 13 metres thick overlays bedrock in the Kitsault project area. Little other overburden materials were found on site due to extensive glaciation. The organic deposits were thickest in the valleys and almost nonexistent on the topographic highs.
• Trachyandesite Lava Flows – Typically was found to have the following properties: o ‘GOOD’ to ‘VERY GOOD’ Rock Mass Rating classification (RMR 89) with values ranging from
40 to 85 with a mean of 65 o Rock Quality Designation (RQD) values range from 40 to 100% with a mean of 73% o Low permeability with hydraulic permeability results of 10-6 to 10-4 cm/s, and o ‘MEDIUM STRONG‘ to ‘EXTREMELY STRONG’ rock strength with UCS laboratory test results
ranging from 24 to 303 MPa with a mean of 197 MPa.
• Bowser Lake Group Sedimentary Rocks – Typically was found to have the following properties: o ‘FAIR’ to ‘GOOD’ Rock Mass Rating classification (RMR 89) with values ranging from 40 to 70
with a mean of 60 o Rock Quality Designation (RQD) values range from 50 to 90% with a mean of 65% o Low permeability with hydraulic permeability results of 10-7 to 10-5 cm/s, and o ‘MEDIUM STRONG‘ to ‘VERY STRONG’ rock strength with UCS laboratory test results ranging
from 21 to 219 MPa with a mean of 88 MPa. 5.2 MINE SITE INFRASTRUCTURE FOUNDATION CONDITIONS
The following is a summary of the site investigation program conclusions for each of the major mine site infrastructure components. South TMF Embankment The South TMF Embankment is strategically located to optimize the natural topography. The foundation conditions are characterized by thin colluvium cover on the side slopes in a deeply incised v-shaped valley bedrock surface. The end of the historic Patsy WRMF is located on the right abutment of the embankment in the valley bottom and is anticipated to be approximately 10 metres thick. The waste rock deposits will require removal prior to construction of the South Embankment. The bedrock geology consisted of bedded Bowser Lake Group greywacke and argillite. In-situ hydraulic conductivity testing has shown the rock mass in the foundation is generally of low permeability and for the most part will not require grouting. However, the jointed nature of the embankment foundation rock mass includes steeply dipping and sheet joints parallel to the creek valley increases significant risk of individual seepage paths through the foundations. The depth and extent of curtain grouting will have to be determined by additional geotechnical investigations during the detailed engineering stage of the embankment.

23 of 26 VA101-343/6-1 Rev 0 January 13, 2011
Northeast TMF Embankment The Northeast TMF Embankment will be constructed at an elevation of approximately 760 metres to the northeast of the existing open pit. This site is strategically located with respect to the Kitsault Pit and to optimize the natural topography. The site is characterized by thin topsoil and organic peat deposits between 1 and 13 metres thick overlying an undulating greywacke argillite bedrock surface. Organic peat deposits will need to be removed prior to construction. Trachyandesite lava flows are located downstream of the western end of the embankment. The contact between the lava flow and the underlying Bowser Lake Group was found at 46 metres depth, at elevation 830 masl. Waste Rock Management Facility The East WRMF is located between the South Embankment of the TMF and the Kitsault Pit, which is also over top of the existing Patsy WRMF in an incised valley. Drillholes found loose to compact waste rock to be 10 to 20 metres thick. An organic layer is also anticipated to be encountered overlying bedrock. These waste rock and organic deposits may need to be removed before the embankment and East WRMF is emplaced. The bedrock contact is at 670 masl elevation to the west, closet to the open pit. The bedrock rises 47 metres to 717 masl elevation at the South Embankment. The bedrock is bedded greywacke and argillite for most of the area and is granodiorite closest to the pit. Primary Crusher The proposed Primary Crusher location is on an existing historic Clary WRMF at the north end of the existing open pit at an approximate elevation of 650 masl. The Primary Crusher location is situated on approximately 10 m of loose rockfill overlying competent Bowser Lake Group bedrock. The water table was encountered at 13.9 metres depth in the bedrock unit. These waste rock deposits will require removal prior to construction and replacement with compacted structural fill to the design elevation. Truckshop, Warehouse and Fuel Storage The proposed Truckshop, Warehouse and Fuel Storage area is situated on relatively flat slopes on the existing Clary WRMF. The surficial cover is predominantly waste rock overlying organic deposits and some swamps and bogs located in depressions and poorly drained areas. Waste rock was up to 26 metres thick overlying a sloping siltstone/argillite bedrock surface. A very soft silty-clay was found between 3 and 11 metres depth that is most likely unsuitable waste materials stockpiled then encapsulated with waste material during the expansion of the waste dump. An organic layer is also anticipated to be encountered overlying bedrock. These waste rock, organic and silt deposits will require removal and replacement with compacted structural fill to the design elevation prior to construction of the truckshop/warehouse and Fuel Storage foundations. The water table was encountered at between 5.4 and 30.2 metres depth in the bedrock unit. The bedrock unit slopes west and subsequently the water table was found to deepen towards the west. Coarse Ore Stockpile The Coarse Ore Stockpile (COS) is located east of the Process Plant on thick columnar trachyandesite lava flows. The site is characterized by thin topsoil of organic peat deposits overlying relatively flat bedrock surface. The bedrock is columnar jointed trachyandesite lava fractured zones or columns are approximately 0.5 to 1 metres wide. The water table was encountered at 38.1 metres depth in the bedrock unit, approximately 902 masl elevation.
24 of 26 VA101-343/6-1 Rev 0 January 13, 2011
Process Plant and Permanent Camp The Process Plant is located approximately 150 metres west of the Coarse Ore Stockpile on thick columnar trachyandesite lava flows to the north of Widdzech Mountain. The site is characterized by thin topsoil and organic peat deposits overlying relatively flat bedrock. The water table is located at 21 to 25 metres depth below ground surface at an elevation of 902 masl elevation. The contact between lava flows and the Bowser Lake Group greywacke and argillite was found at 118 metres depth, elevation 806 metres.
25 of 26 VA101-343/6-1 Rev 0 January 13, 2011
SECTION 6.0 - REFERENCES
BC Geological Survey Digital Geology Maps (version 1.0 2005). www.em.gov.bc.ca/Mining/Geolsurv/Publications/catalog/bcgeolmap.htm
Carter, N. C. 1964, Resources Annual Report, 1964. Ministry of Mines, Petroleum and Energy. Carter, N. C., 1982. Porphyry Copper and Molybdenum Deposits of West-Central British Columbia.
British Columbia, Department of Mines and Petroleum Resources, Bulletin 64. Carter, N. C., Read, P., Allen, D. G., Hodgson, C. J., and Ryback-Hadg, V. 1986. Geology of Kitsault
Area NST 103 P. Ministry of Energy, Mines and Petroleum Resources. Open File 1986/2 1:50,000-scale.
Holland, S. 1976. Landforms of British Columbia: a Physiographic Outline. British Columbia, Department
of Mines and Petroleum Resources, Bulletin 48. Knight Piésold, 2009. Pre-Feasibility Geotechnical Site Investigations. KP Ref. VA101-343/3-1,
December 1, 2009. Knight Piésold, 2009. Tailings Disposal Options Trade-Off Study. KP Ref. VA101-343/2-1, April 8, 2009. Knight Piésold, 2010. Tailings Management Facility Alternatives Study. KP Ref. VA101-343/3-5, March
11, 2010. McCuaig, S. 2003a. Surficial Geology Map (103P NW), Nass Valley, British Columbia; Geological Survey
of Canada, Open File 3901, 1:100,000-scale. McCuaig, S. 2003b. Stratigraphic Sections Nass and Kitsault Valleys, British Columbia; Geological
Survey of Canada, Open File 3901. Steininger, R.1981. Geology of the Kitsault Molybdenum Deposit, March 1981. SRK Consulting, 2009. Pre-feasibility Geotechnical Pit Slope design, Kitsault Molybdenum Project,
British Columbia, Canada. June, 2009.


Northing Easting ElevationHydraulic
Conductivity3
Standpipe (SP)Monitoring Well
(MW)
Completion Zone
Final Stickup Height
Static Water Level
(m) (m) (m) Nominal (m) (m) From To (m) (cm/s) Size (m) (m) (m)
K10-01GT Primary Crusher 6142497.79 473131.15 650.41PQ 0 - 13.1
HQ3 13.1 - 39.039.0 10.9 N/A N/A N/A 1-inch SP 15.2 - 39.0 0.84 13.91
K10-02GT Fuel Storage 6143377.97 473442.65 744.18PQ 0 - 4.3
HQ3 4.3 - 34.134.1 4.3 N/A N/A N/A 1-inch SP 27.4 - 34.1 0.88 5.39
K10-03GT Truckshop & Warehouse 6143497.51 473558.67 743.39PQ 0 - 11.3
HQ3 11.3 - 35.135.1 11.0 N/A N/A N/A 1-inch SP 11.6 - 19.8 0.52 11.97
15.1 39.0 6.8E-05
38.0 60.4 5.8E-06
58.7 80.2 1.3E-06
77.6 100.0 5.6E-05
K10-05GTDown Gradient of South
TMF Embankment 6141755.34 474299.94 712.31
PQ 0 - 20.9HQ 20.9 - 39.9
39.9 21.3 22.7 39.9 2.3E-05 2-inch MW 22.9 - 30.5 0.80 22.06
K10-06GTDown Gradient of South
TMF Embankment 6141412.65 473974.09 685.00
PQ 0 -15.5HQ3 15.5 - 35.5
35.5 15.5 18.6 35.5 3.5E-06 2-inch MW 15.8 - 23.5 0.90 5.24
Drillhole #
K10-04GT South TMF Embankment
GPS Coordinates1
14.6 - 21.9
Total Depth
19.11
Packer Zone
0.94
TABLE 3.1
2010 GEOTECHNICAL DRILLHOLE SUMMARYFEASIBILITY GEOTECHNICAL SITE INVESTIGATIONS
AVANTI KITSAULT MINE LTDKITSAULT PROJECT
474679.75PQ 0 - 11.6
HQ3 11.6 - 100.0100.0727.91
Piezometer Information
Location of DrillholeHole Size
Depth to Bedrock
11.3 1-inch SP
Packer Test (Lugeon)
6142080.22
Print Jan/13/11 12:48:52
K10-07GT Open Pit SE Wall 6141568.24 473567.06 593.24PQ 0 - 11.5
HQ3 11.5 - 194.0194.0 0.5
muilt point vibrating wire
N/A N/A N/A
K10-08GT Warehouse & Truckshop 6143452.41 473518.50 743.55PQ 0 - 7.0
HQ3 7.0 - 12.812.8 7.0 N/A N/A N/A N/A N/A N/A 5.8
42.3 65.3 5.3E-05
63.5 80.6 7.8E-05
K10-10GT Truckshop & Warehouse 6143517.60 473536.58 741.91PQ 0 - 27.1HQ3
27.1 - 33.533.5 27.1 N/A N/A N/A N/A N/A N/A 30.2
K10-11GT Truckshop & Warehouse 6143540.77 473599.76 743.37PQ 0 - 7.9
HQ3 7.9 - 12.812.8 7.9 N/A N/A N/A N/A N/A N/A 8.2
15.1 23.0 2.9E-05
21.2 36.7 7.9E-05
10.5 18.3 1.9E-04
16.6 29.0 7.8E-05
28.8 39.7 2.4E-06
39.3 50.3 9.1E-05
10.6 21.5 1.7E-05
19.8 30.6 4.8E-05
28.9 39.8 2.2E-05
38.1 48.9 1.6E-05
47.2 58.1 6.3E-05
16.6 29.0 9.0E-06
27.3 36.6 5.5E-06
34.9 48.8 5.0E-06
47.1 61.0 4.7E-06
12.1 61.0 2.9E-06
9.0 18.3 8.9E-05
18.1 27.4 2.4E-06
27.3 38.1 7.7E-06
38 0 50 3 1 0E 05
1-inch SP 3.0 - 10.1 0.60 0.931.2
HQ3 0 - 61.0 61.0
6143315.30 802.35 HQ3 0 - 61.0 61.0K10-16GTNortheast TMF Embankment
476548.24
K10-15AGTNortheast TMF Embankment
476805.24
878.78K10-14GT 6143963.65
6143060.79 797.21
Downgradient of Northeast TMF Embankment
925.18
K10-12GT Permenant Camp 6143550.60
475928.63
HQ3 0 - 36.7474326.96 36.7923.84
HQ3 0 - 50.3
HW 0 - 1.5HQ3 1.5 - 80.6
NQ 80.6 - 162.9474390.20
940.30K10-13GT Coarse Ore Stockpile 474043.256143570.28
0.7162.9 N/A N/A N/A 22.5
0.581.3
0.4
4.6 - 11.9 0.71
36.350.5729.9 - 37.8
1-inch SP
2-inch MW
17.4 - 25.31-inch SP
K10-09GT Permenant Camp
62.6HQ3 0 - 62.62
6143565.12
1-inch SP50.3 0.5
0.3 0.69 21.4
29.9 - 42.7 38.100.50
Not available
38.0 50.3 1.0E-05
50.2 61.0 2.1E-06
9.0 19.8 2.0E-05
18.1 30.5 5.2E-06
28.8 39.6 6.8E-06
37.9 50.3 1.3E-05
47.2 61.0 9.0E-06
Northeast TMF Embankment
27.0 37.8 1.7E-05
Azmuth 135 deg 37.6 48.5 4.3E-05
Dip 45 deg 46.8 57.6 1.7E-05
9.1 18.4 1.3E-05
18.1 30.5 1.6E-05
12.0 22.9 4.7E-05
22.7 30.6 4.9E-05
9.0 18.4 9.1E-05
18.3 30.6 7.1E-05
10.5 25.6 1.1E-05
23.9 39.3 3.8E-05
40.7 57.6 2.7E-05
57.8 71.3 6.3E-06
71.2 100.3 3.2E-06
7.4 22.8 1.8E-04
22.7 33.5 1.8E-04
33.3 44.2 2.1E-05
53.0 64.0 1.0E-04
53.0 75.0 6.6E-05
5.9 18.2 1.7E-06
18.1 27.4 1.5E-06
28.8 36.5 1.0E-05
K10-25GT Plant Site 6143378.59 474420.89 934.17HW 0 - 1.5
HQ3 1.5 - 36.536.8 0.3 NA NA NA NA NA NA NA
8.7 - 16.0 0.88 3.48
28.9 - 36.31-inch SP36.5Plant SiteK10-24GT 474499.476143356.44 927.21HW 0 - 1.5
HQ3 1.5 - 36.52.0 0.85 25.13
South TMF Embankment K10-23GT 474996.186141750.65 791.62HW 0 - 5.5
HQ3 5.5 - 83.883.8 4.5 2-inch MW
0.93K10-22GT South TMF Embankment 474551.516142224.78 800.87HW 0 - 5.5
HQ3 5.5 - 100.3100.3 1.2 1-inch SP 3.9 - 11.3 0.89
2.1 - 11.9 0.70 0.90
K10-21GT Borrow Area 475956.026143118.01 797.27HW 0 - 7.7
HQ3 7.7 - 30.630.6 5.6 NA
Standpipe was broken during installation
0.30
K10-20GTDowngradient of Northeast TMF Embankment
476965.466143463.42 786.09HW 0 - 9.3
HQ3 9.3 - 30.630.6 10.7 2-inch MW
NA NA NA
K10-19GTDowngradient of Northeast TMF Embankment
476472.706143944.37 753.57 HQ3 0 - 30.6 30.6 3.1 2-inch MW 9.1 - 18.0 0.59 0.71
K10-18GT 476126.246143715.05 787.32 HQ3 0 - 57.6 57.6 10.3 NA
-0.141-inch SP 3.2 - 10.7 0.542.960.9811.27 HQ3 0 - 60.9K10-17GTNortheast TMF Embankment
476331.706143458.06
HQ3 1.5 36.5
K10-26 Geology Exploration 6143943.83 476409.84 760.24
K10-27GT Borrow Area 6143358.33 476119.04 826.51 HQ3 0 - 42.1 42.1 0.6 NA NA NA NA NA NA NA
M:\1\01\00343\06\A\Report\1-SI Report\Tables\[Tab 3.1r0_Drillhole Summary 2010.xlsx]Table 3.1 - Geotech Drillholes
*** Please contact Avanti for details ***
30NOV'2010 ISSUED WiITH REPORT VA101-343/6-1 JS BB KJB0
DATE DESCRIPTION PREP'D CHK'D APP'DREV

TABLE 3.2
FEASIBILITY GEOTECHNICAL SITE INVESTIGATIONS
ROCK MASS RATING (RMR) CLASSIFICATION SYSTEM
VALUE RATING
PLST 10 8 6.5 5.5 5 4.5 3 2 1 <1
UCS, MPa 250 200 160 140 125 110 75 50 25 < 25
Field Est.
RATING 15 14 13 12 11 10 8 6 4 < 3
RQD % 100 90 80 70 60 50 40 30 20 0
RATING 20 18 16 14 12 10 9 5 4 3
Joint Js, cm > 200 160 130 90 60 40 20 15 10 <6
Spacing RATING 20 18 16 14 12 10 9 8 7 5
Set 1 Set 2 Set 3
Orientation
J Spacing
< 1 m 1 - 3m 3 - 10m 10 - 20 m > 20m
6 4 2 1 0
None < 0.1 mm 0.1 - 1.0 1 - 5 5 - 10
6 5 4 1 0
V Rough Rough SL Rough Smooth Slicks
6 5 3 1 0
< 5 mm > 5 mm < 5mm > 5 mm
6 4 3 2 0
Print Jan/12/11 15:33:49
Infilling
RATING
Roughness
RATINGJoint
Condition
RQD
None
Persistence
RATING
Aperture
single blow pocket knife
Intact Rock Strength chipped by hammer
Soft Infilling
RATING
Hard Infilling
many blows by hammer to break
AVANTI KITSAULT MINE LTD
KITSAULT PROJECT
FRESH SW MW HW CW
6 5 3 1 0
Sub-Total
Inflow
l/min/10m
RATING
M:\1\01\00343\06\A\Report\1-SI Report\Tables\[Tab 3.2r0_RMR Classification.xls]RMR-1989 Table
NOTE:
1. REFERENCE: BIENIAWSKI, 1989.
None 10 - 25 25 -125 > 125
Strike Parallel to Tunnel
Strike Perpendicular to Tunnel Axis drive against Dip
Strike Perpendicular to Tunnel Axis drive with Dip
Adjustment for Joint Orientation
Wet
0
0 - 20
Groundwater
< 10
Dry Damp Dripping Flowing
5
Weathering
RATING
20 - 45 45 - 90
DIP OF ADVERSE JOINT SET
15 10 7 4
Unfavourable Favourable Very Favourable
-10 -2 0
Unfavourable Unfavourable Fair
-10 -10 -5
ROCK CLASS
VERY GOOD GOOD FAIR
80 - 100 60 - 80 40 - 60
1
-5 -12
Unfavourable
RMR RATING 0 - 20
DESCRIPTION
Fair
2 3 4
POOR VERY POOR
20 - 40
Very Unfavourable
-10
0 20SEPT'10 JS GLSISSUED WITH REPORT VA101-343//6-1 KJB
DATE DESCRIPTION PREP'D CHK'D APP'DREV

Assay Sample
Easting (m) Northing (m) Tag Number4
VC10-01 North WRMF 473,810 6,143,858 2.44 H227982
VC10-02 North WRMF 473,553 6,143,921 1.07 H227983
VC10-03 North WRMF 473,653 6,144,320 0.76 H227984
VC10-04 North WRMF 473,659 6,144,773 0.41 H227985
VC10-05 North WRMF 473,958 6,144,938 1.52 H227986
VC10-06 North WRMF 474,092 6,144,670 1.78 H227987
VC10-07 North WRMF 473,816 6,144,200 0.37 H227988
VC10-08A North WRMF 473,883 6,144,704 0.56 H227989
VC10-08B North WRMF 473,882 6,144,671 0.46 -
VC10-08C North WRMF 473,806 6,144,649 0.71 -
VC10-08D North WRMF 473,786 6,144,663 1.14 -
VC10-09 Northeast TMF Embankment 476,141 6,143,690 6.40 -
VC10-10 Northeast TMF Embankment 476,143 6,143,685 2.59 -
VC10-11 Northeast TMF Embankment 476,160 6,143,680 0.46 -
VC10-12 Northeast TMF Embankment 476,178 6,143,672 1.75 -
VC10-13 Northeast TMF Embankment 476,193 6,143,627 1.22 -
VC10-14 Northeast TMF Embankment 476,285 6,143,579 1.83 -
VC10-15 Northeast TMF Embankment 476,319 6,143,535 0.91 -
VC10-16 Northeast TMF Embankment 476,331 6,143,544 1.98 -
VC10-17 Northeast TMF Embankment 476,376 6,143,484 0.91 -
VC10-18 Northeast TMF Embankment 476,367 6,143,450 1.52 -
TABLE 3.3
AVANTI KITSAULT MINE LTDKITSAULT PROJECT
GEOTECHNICAL VIBRACORE SUMMARY
Hole ID AreaUTM Coordinates (NAD 83)1 Depth to
Bedrock (m)
FEASIBILITY GEOTECHNICAL SITE INVESTIGATIONS
Print Jan/12/11 15:36:30
VC10-19 Northeast TMF Embankment 476,372 6,143,448 1.52 -
VC10-20 Northeast TMF Embankment 476,341 6,143,403 1.80 -
VC10-21 Northeast TMF Embankment 476,353 6,143,398 2.74 -
VC10-22 Northeast TMF Embankment 476,449 6,143,400 0.08 -
VC10-23 Northeast TMF Embankment 476,505 6,143,348 5.95 -
VC10-24 Northeast TMF Embankment 476,509 6,143,349 5.41 -
VC10-25 Northeast TMF Embankment 476,539 6,143,371 1.59 -
VC10-26 Northeast TMF Embankment 476,588 6,143,298 0.76 -
VC10-27 Northeast TMF Embankment 476,577 6,143,294 0.98 -
VC10-28 Northeast TMF Embankment 476,745 6,143,150 1.37 -
VC10-29 Northeast TMF Embankment 476,769 6,143,133 0.13 -
VC10-30 Northeast TMF Embankment 476,806 6,143,118 0.91 -
VC10-31 Northeast TMF Embankment 476,807 6,143,069 1.45 -
VC10-32 Northeast TMF Embankment 476,799 6,143,045 1.83 -
VC10-33 Northeast TMF Embankment 476,764 6,143,024 0.46 -
VC10-34 Northeast TMF Embankment 476,932 6,142,923 1.60 -
VC10-35 Northeast TMF Embankment 476,935 6,142,907 0.91 -
VC10-36 Northeast TMF Embankment 476,995 6,142,877 0.91 -
VC10-37 Northeast TMF Embankment 477,000 6,142,860 1.43 -
VC10-38 Northeast TMF Embankment 476,948 6,142,940 0.88 -
VC10-39 Northeast TMF Embankment 476,301 6,143,399 2.01 -
VC10-40 Northeast TMF Embankment 476,232 6,143,396 0.76 -
VC10-41 Northeast TMF Embankment 476,416 6,143,998 4.45 H147851
VC10-42 Northeast TMF Embankment 476,466 6,143,996 4.45 H147852
VC10-43 Northeast TMF Embankment 476,509 6,143,998 4.45 H147853
VC10-44 Northeast TMF Embankment 476,455 6,143,947 4.36 H147854
Page 1 of 2
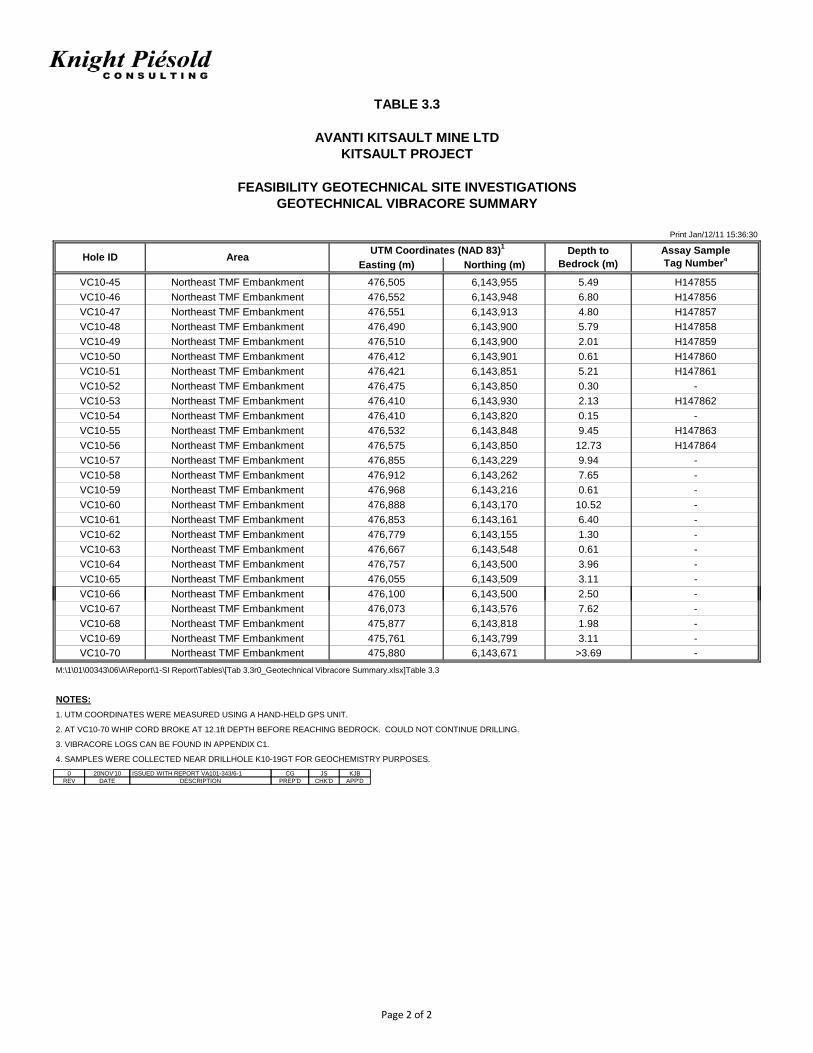
Assay Sample
Easting (m) Northing (m) Tag Number4
TABLE 3.3
AVANTI KITSAULT MINE LTDKITSAULT PROJECT
GEOTECHNICAL VIBRACORE SUMMARY
Hole ID AreaUTM Coordinates (NAD 83)1 Depth to
Bedrock (m)
FEASIBILITY GEOTECHNICAL SITE INVESTIGATIONS
Print Jan/12/11 15:36:30
VC10-45 Northeast TMF Embankment 476,505 6,143,955 5.49 H147855
VC10-46 Northeast TMF Embankment 476,552 6,143,948 6.80 H147856
VC10-47 Northeast TMF Embankment 476,551 6,143,913 4.80 H147857
VC10-48 Northeast TMF Embankment 476,490 6,143,900 5.79 H147858
VC10-49 Northeast TMF Embankment 476,510 6,143,900 2.01 H147859
VC10-50 Northeast TMF Embankment 476,412 6,143,901 0.61 H147860
VC10-51 Northeast TMF Embankment 476,421 6,143,851 5.21 H147861
VC10-52 Northeast TMF Embankment 476,475 6,143,850 0.30 -
VC10-53 Northeast TMF Embankment 476,410 6,143,930 2.13 H147862
VC10-54 Northeast TMF Embankment 476,410 6,143,820 0.15 -
VC10-55 Northeast TMF Embankment 476,532 6,143,848 9.45 H147863
VC10-56 Northeast TMF Embankment 476,575 6,143,850 12.73 H147864
VC10-57 Northeast TMF Embankment 476,855 6,143,229 9.94 -
VC10-58 Northeast TMF Embankment 476,912 6,143,262 7.65 -
VC10-59 Northeast TMF Embankment 476,968 6,143,216 0.61 -
VC10-60 Northeast TMF Embankment 476,888 6,143,170 10.52 -
VC10-61 Northeast TMF Embankment 476,853 6,143,161 6.40 -
VC10-62 Northeast TMF Embankment 476,779 6,143,155 1.30 -
VC10-63 Northeast TMF Embankment 476,667 6,143,548 0.61 -
VC10-64 Northeast TMF Embankment 476,757 6,143,500 3.96 -
VC10-65 Northeast TMF Embankment 476,055 6,143,509 3.11 -
VC10-66 Northeast TMF Embankment 476,100 6,143,500 2.50 -
VC10-67 Northeast TMF Embankment 476,073 6,143,576 7.62 -
VC10-68 Northeast TMF Embankment 475,877 6,143,818 1.98 -
VC10-69 Northeast TMF Embankment 475,761 6,143,799 3.11 -
VC10-70 Northeast TMF Embankment 475,880 6,143,671 >3.69 -
M:\1\01\00343\06\A\Report\1-SI Report\Tables\[Tab 3.3r0_Geotechnical Vibracore Summary.xlsx]Table 3.3
NOTES:
1. UTM COORDINATES WERE MEASURED USING A HAND-HELD GPS UNIT.
2. AT VC10-70 WHIP CORD BROKE AT 12.1ft DEPTH BEFORE REACHING BEDROCK. COULD NOT CONTINUE DRILLING.
3. VIBRACORE LOGS CAN BE FOUND IN APPENDIX C1.
4. SAMPLES WERE COLLECTED NEAR DRILLHOLE K10-19GT FOR GEOCHEMISTRY PURPOSES.
0 20NOV'10 CG JSISSUED WITH REPORT VA101-343/6-1 KJBDATE DESCRIPTION PREP'D CHK'D APP'DREV
Page 2 of 2

DRILLHOLE DATE TEST DESCRIPTION ROCK TYPESENSOR DEPTH
TRANSDUCER READING AT
STATIC LEVEL (m)
WATER TABEL
(m)
K- LUGEON TEST (cm/s)
K- FALLING HEAD TEST
(cm/s)CORE SIZE
4-Jul-10 Test 1 Single Packer (23.9 m interval)- Lugeon Packer Test 15.1 39.0 Bowser Lake 13.2 6.80E-05 HQ35-Jul-10 Test 2 Single Packer (22.4 m interval)- Lugeon Packer Test 38.0 60.4 Bowser Lake 11.5 5.80E-06 HQ35-Jul-10 Test 3 Single Packer (22.5 m interval)- Lugeon Packer Test 58.7 80.2 Bowser Lake 14.1 1.30E-06 HQ35-Jul-10 Test 4 Single Packer (22.4 m interval)- Lugeon Packer Test 77.6 100.0 Bowser Lake 19.7 5.60E-05 HQ3
K10-05GT 6-Jul-10 Test 1 Single Packer (17.2 m interval)- Lugeon Packer Test 22.7 39.9 Bowser Lake 22 2.30E-05 HQ3K10-06GT 8-Jul-10 Test 1 Single Packer (16.9 m interval)- Lugeon Packer Test 18.6 35.5 Bowser Lake 4 3.50E-06 HQ3
15-Jul-10 Test 1 Single Packer (23.0 m interval)- Lugeon Packer Test 42.3 65.3 Trachyandesite 20.9 5.3E-05 HQ316-Jul-10 Test 2 Single Packer (17.1 m interval) - Lugeon Packer Test 63.5 80.6 Trachyandesite 21.6 7.8E-05 HQ3
17-Jul-10 Test 3 Falling Head Test 0.0 165.9Bowser Lake / Trachyandesite
22 6.48E-06 HQ3
18-Jul-10 Test 1 Single Packer (7.9 m interval)- Lugeon Packer Test 15.1 23.0 Trachyandesite 0 2.9E-05 - HQ319-Jul-10 Test 2 Single Packer (15.5 m interval) - Lugeon Packer Test 21.2 36.7 Trachyandesite 17.3 7.9E-05 - HQ320-Jul-10 Test 1 Single Packer (7.8 m interval) - Lugeon Packer Test 10.5 18.3 Trachyandesite 0 1.9E-04 - HQ320-Jul-10 Test 2 Single Packer (12.4 m interval) - Lugeon Packer Test 16.6 29.0 Trachyandesite 0 7.8E-05 - HQ320-Jul-10 Test 3 Single Packer (10.8 m interval) - Lugeon Packer Test 28.8 39.7 Trachyandesite 30.2 2.4E-06 - HQ321-Jul-10 Test 4 Single Packer (11.0 m interval) - Lugeon Packer Test 39.3 50.3 Trachyandesite 30.2 9.1E-05 - HQ323-Jul-10 Test 1 Single Packer (10.8m interval) - Lugeon Packer Test 10.6 21.5 Trachyandesite 11.6 0.0 1.7E-05 HQ323-Jul-10 Test 2 Single Packer (10.7m interval) - Lugeon Packer/ Falling Head Tests 19.8 30.6 Trachyandesite 20.8 15.0 4.8E-05 8.40E-06 HQ323-Jul-10 Test 3 Single Packer (10.8m interval) - Lugeon Packer/ Falling Head Tests 28.9 39.8 Trachyandesite 29.9 19.0 2.2E-05 5.40E-06 HQ324-Jul-10 Test 4 Single Packer (10.8m interval) - Lugeon Packer/ Falling Head Tests 38.1 48.9 Bowser Lake 39.1 30.5 1.6E-05 1.90E-05 HQ324-Jul-10 Test 5 Single Packer (10.8m interval) - Lugeon Packer Test 47.2 58.1 Bowser Lake 48.2 30.28 30.5 6.3E-05 HQ326-Jul-10 Test 1 Falling Head Test (9.3 m interval) 9.0 18.3 Bowser Lake 10.0 0.3 8.40E-06 HQ326-Jul-10 Test 2 Single Packer (12.3 m interval)- Lugeon Packer Test 16.6 29.0 Bowser Lake 17.6 0.22 0.3 9.0E-06 HQ327-Jul-10 Test 3 Single Packer (9.3 m interval)- Lugeon Packer Test 27.3 36.6 Bowser Lake 28.3 -0.08 0.3 5.5E-06 HQ327-Jul-10 Test 4 Single Packer (13.9 m interval)- Lugeon Packer Test 34.9 48.8 Bowser Lake 35.9 -1.46 0.3 5.0E-06 HQ327-Jul-10 Test 5 Single Packer (13.9 m interval)- Lugeon Packer Test 47.1 61.0 Bowser Lake 48.1 0.3 4.7E-06 HQ327-Jul-10 Test 6 Single Packer (48.9 m interval)- Lugeon Packer Test 12.1 61.0 Bowser Lake 13.1 0.3 2.9E-06 HQ328-Jul-10 Test 1 Single Packer (9.3 m interval)- Lugeon Packer Test 9.0 18.3 Bowser Lake 10.0 -0.01 0 8.9E-05 HQ329-Jul-10 Test 2 Single Packer (9 3 m interval)- Lugeon Packer Test 18 1 27 4 Bowser Lake 19 1 0 24 0 9 2 4E-06 HQ3
FEASIBILITY GEOTECHNICAL SITE INVESTIGATIONSPACKER WITH PRESSURE TRANSUCER TESTING SUMMARY
K10-13GT
TEST INTERVAL (m)
K10-04GT
K10-12GT
TABLE 3.4
AVANTI KITSAULT MINE LTDKITSAULT PROJECT
Print Jan/12/11 15:40:34
K10-09GT
K10-14GT
K10-15AGT
29-Jul-10 Test 2 Single Packer (9.3 m interval)- Lugeon Packer Test 18.1 27.4 Bowser Lake 19.1 0.24 0.9 2.4E-06 HQ329-Jul-10 Test 3 Single Packer (10.8 m interval)- Lugeon Packer Test 27.3 38.1 Bowser Lake 28.3 0.09 0.9 7.7E-06 HQ329-Jul-10 Test 4 Single Packer (12.3 m interval)- Lugeon Packer Test 38.0 50.3 Bowser Lake 39.0 0.06 0.9 1.0E-05 HQ329-Jul-10 Test 5 Single Packer (10.8 m interval)- Lugeon Packer Test 50.2 61.0 Bowser Lake 51.2 0.25 0.9 2.1E-06 HQ330-Jul-10 Test 1 Single Packer (10.8 m interval)- Lugeon Packer Test 9.0 19.8 Bowser Lake 10.0 -0.24 0.3 2.0E-05 HQ330-Jul-10 Test 2 Single Packer (12.4 m interval) - Lugeon Packer Test 18.1 30.5 Bowser Lake 19.1 0.11 0.3 5.2E-06 HQ331-Jul-10 Test 3 Single Packer (10.8 m interval)- Lugeon Packer Test 28.8 39.6 Bowser Lake 29.8 0.18 0.3 6.8E-06 HQ331-Jul-10 Test 4 Single Packer (12.3 m interval)- Lugeon Packer Test 37.9 50.3 Bowser Lake 38.9 0.3 1.3E-05 HQ331-Jul-10 Test 5 Single Packer (13.7 m interval)- Lugeon Packer Test 47.2 61.0 Bowser Lake 48.2 0.93 0.3 9.0E-06 HQ33-Aug-10 Test 1 Single Packer (10.8 m interval)- Lugeon Packer Test 27.0 37.8 Bowser Lake 19.8 -0.89 -1.45 1.7E-05 - HQ34-Aug-10 Test 2 Single Packer (10.8 m interval)- Lugeon Packer Test 37.6 48.5 Bowser Lake 27.3 -0.79 -1.05 4.3E-05 - HQ34-Aug-10 Test 3 Single Packer (10.8 m interval)- Lugeon Packer Test 46.8 57.6 Bowser Lake 33.8 -0.01 0.00 1.7E-05 - HQ35-Aug-10 Test 1 Single Packer (9.3m interval) - Lugeon Packer/Falling Head Tests 9.1 18.4 Bowser Lake 10.1 0.13 2.00 1.3E-05 HQ35-Aug-10 Test 2 Single Packer (12.4 m interval) - Lugeon Packer/Falling Head Tests 18.1 30.5 Bowser Lake 19.1 0.26 2.00 1.6E-05 HQ3
13-Aug-10 Test 1 Single Packer (10.8 m interval) - Lugeon Packer/Falling Head Tests 12.0 22.9 Bowser Lake 13.0 1 4.7E-05 HQ313-Aug-10 Test 2 Single Packer (7.8 m interval) - Lugeon Packer/Falling Head Tests 22.7 30.6 Bowser Lake 23.7 -0.66 0.4 4.9E-05 HQ314-Aug-10 Test 1 Single Packer (9.4 m interval) - Lugeon Packer/Falling Head Tests 9.0 18.4 Bowser Lake 10.0 1.46 1.3 9.1E-05 HQ315-Aug-10 Test 2 Single Packer (12.4 m interval) - Lugeon Packer/Falling Head Tests 18.3 30.6 Bowser Lake 19.3 0.6 0.3 7.1E-05 HQ315-Aug-10 Test 1 Single Packer (15.1 m interval)- Lugeon Packer Test 10.5 25.6 Bowser Lake 11.5 0.12 0.1 1.1E-05 HQ316-Aug-10 Test 2 Single Packer (15.5 m interval) - Lugeon Packer Test 23.9 39.3 Bowser Lake 24.9 0.47 0.5 3.8E-05 HQ316-Aug-10 Test 3 Single Packer (16.9 m interval)- Lugeon Packer Test 40.7 57.6 Bowser Lake 41.7 3.3 3.3 2.7E-05 HQ317-Aug-10 Test 4 Single Packer (13.6 m interval)- Lugeon Packer Test 57.8 71.3 Bowser Lake 58.8 3.37 3.4 6.3E-06 HQ318-Aug-10 Test 5 Single Packer (29.1 m interval)- Lugeon Packer Test 71.2 100.3 Bowser Lake 72.2 0.59 0.6 3.2E-06 HQ319-Aug-10 Test 1 Single Packer (15.4 m interval)- Lugeon Packer Test 7.4 22.8 Bowser Lake 8.4 1.3 1.8E-04 HQ319-Aug-10 Test 2 Single Packer (10.8 m interval) - Lugeon Packer Test 22.7 33.5 Bowser Lake 23.7 0.3 1.8E-04 HQ319-Aug-10 Test 3 Single Packer (10.9 m interval)- Lugeon Packer Test 33.3 44.2 Bowser Lake 34.3 2.3 2.1E-05 HQ320-Aug-10 Test 4 Single Packer (9.3 m interval)- Falling Head Test 44.0 53.3 Bowser Lake 45.0 2.6 - 4.10E-05 HQ320-Aug-10 Test 5 Single Packer (11 m interval)- Lugeon Packer Test 53.0 64.0 Bowser Lake 54.0 0.4 0.4 1.0E-04 HQ320-Aug-10 Test 6 Single Packer (22 m interval)- Lugeon Packer Test 53.0 75.0 Bowser Lake 54.0 1.7 1.7 6.6E-05 HQ320-Aug-10 Test 7 Single Packer (83.8 m interval) - Falling Head Test 0.0 83.8 Bowser Lake 2.6 - 3.70E-05 HQ322-Aug-10 Test 1 Single Packer (12.3 m interval)- Lugeon Packer Test 5.9 18.2 Trachyandesite 6.9 -0.2 24.3 1.7 E 10-6 HQ322-Aug-10 Test 2 Single Packer (9.3 m interval) - Lugeon Packer Test 18.1 27.4 Trachyandesite 19.1 0.2 24.3 1.5 E 10-6 HQ322-Aug-10 Test 3 Single Packer (7.7 m interval)- Lugeon Packer Test 28.8 36.5 Trachyandesite 29.8 2.6 24.3 1.0 E 10-5 HQ3
M:\1\01\00343\06\A\Report\1-SI Report\Tables\[Tab 3.4r0_Packer Testing Summary.xls]Packer Testing Summary
K10-19GT
K10-16GT
K10-22GT
K10-23GT
K10-18GT
K10-21GT
K10-20GT
K10-17GT
K10-24GT
0 20NOV'10 BH BBISSUED WITH REPORTVA101-343/6-1 KJB
DATE DESCRIPTION PREP'D CHK'D APP'DREV

Print Jan/12/11 15:43:18
DepthSodium
Soundness
(m)P.L.%
L.L.%
P.I.%
Gravel%
+5 mm
Sand%
5 to 0.074 mm
Silt%
0.074 to0.002 mm
Clay%
-0.002 mm
Average Weighted
Loss (%)
Optimum Water
Content (%)
Max. Dry Density
(Kgm3)
TP09-12 3.0 - 4.0 7.6 2.70 NP 24 NP 48.1 43.4 - - - - Sand and Gravel
TP09-16 2.0 - 2.5 5.9 2.74 - - - 45.2 49.5 1.80E-02 2.7 - - Sand and Gravel
TP09-17 2.0 - 2.5 2.9 2.77 - - - 61.7 35.2 4.90E-01 1.7 - - Sand and Gravel
Mean 5.9 2.74 48.1 43.4 2.54E-01
TP09-13 0.6 - 1.8 19.3 2.76 17 34 17 0.3 4.6 51.0 44.1 - - 19.3 1732 Silty Clay
TP09-15 0.5 - 1.5 6.6 2.68 NP 55 NP 54.3 40.1 - - - - Sandy Gravel
Nass Forestry R d
TP09-08 0.5 - 0.7 23.8 2.74 20 52 32 0.0 3.0 34.8 62.2 - - - - Silty Clay
TABLE 3.5
AVANTI KITSAULT MINE LTDKITSAULT PROJECT
SUMMARY OF SOIL ENGINEERING GEOTECHNICAL PROPERTIESFEASIBILITY GEOTECHNICAL SITE INVESTIGATIONS
CompactionStandard Proctor
Particle Size Distribution
Description
5.6
Borrow Area BRoundy Creek
GLACIOFLUVIAL DEPOSITS
GLACIOMARINE DEPOSITS
Specific Gravity
Sample No.Sample Location
Constant Head
Permeability
(cm/s)
5.3
Borrow Area AGlaciofluvial
Deposit
8.5
5.3
3.1
NaturalMoistureContent
(%)
Atterberg Limits
RoadTP09 08 0.5 0.7 23.8 2.74 20 52 32 0.0 3.0 34.8 62.2 Silty Clay
H-229705 6.0 30.2 2.74 20 51 31 0.0 0.1 33.2 66.7 - - 25.0 1583 Clayey Silt
H-229718 2.0 26.4 2.75 18 48 30 0.0 0.6 45.0 54.4 - - 22.5 1560 Clayey Silt
H-229719 3.0 17.4 2.74 16 31 15 0.4 19.9 41.8 37.9 - - 19.7 1706 Silty Clay
H-229720 2.0 27.1 2.76 19 49 30 0.0 0.9 34.0 65.1 - - 25.4 1549 Clayey Silt
Mean 23.8 2.74 19 49 30 0.0 3.0 34.8 58.3 22.5 1583
Pasty Waste Dump
TP09-18 0.5 - 1.0 5.5 2.74 14 28 14 56.1 30.5 9.0 4.4 1.70E-01 8.1 - -Gravel with sand and some silt
M:\1\01\00343\06\A\Report\1-SI Report\Tables\[Tab 3.5r0_Lab Index Test Results.xls]Table 3.5
NOTES:
1. NP - NON PLASTIC
2. L.L. - LIQUID LIMIT
3. P.I. - PLASTIC INDEX
4. P.L. - PLASTIC LIMIT (LL -PI = PL)
OTHER SAMPLES
Access road between Tchintin
River and Kshadin Creek
0 15SEP'10 JS BBISSUED WITH REPORT VA101-343/6-1 KJB
DATE DESCRIPTION PREP'D CHK'D APP'DREV

Young Poisson
Modulus Ratio
From (m) To (m) (m) d H H/d (MPa) E (GPa) n
K10-01GT UCS 01-1 Greywacke PLT 13.41 13.41 0.14 60.57 80.49K10-01GT UCS 01-2 Greywacke PLT 18.29 18.29 0.19 60.47 69.06K10-01GT UCS 01-3 Greywacke UCS 22.56 22.76 0.20 60.51 128.80 2.13 69.19 14.63 0.20
K10-01GT UCS 01-4 Greywacke UCS 31.70 31.99 0.25 60.72 129.84 2.14 218.73 70.49 0.29
K10-02GT UCS 02-1 Greywacke UCS 4.42 4.67 0.25 60.60 129.97 2.14 89.80 30.90 0.25
K10-02GT UCS 02-2 Greywacke UCS 8.53 8.80 0.18 60.73 129.57 2.13 167.48 58.30 0.27
K10-02GT UCS 02-3 Greywacke
K10-02GT UCS 02-4 Argillite UCS 29.87 30.24 0.28 60.75 129.49 2.13 50.47 35.20 0.37
K10-03GT UCS 03-1 Greywacke UCS 12.80 13.12 0.18 60.71 128.95 2.12 128.20 60.54 0.32
K10-03GT UCS 03-2 Argillite PLT 15.85 15.85 0.20 60.77 126.28K10-03GT UCS 03-3 Greywacke / Argillite UCS 20.42 20.83 0.26 60.78 127.12 2.09 82.22 51.46 0.41
K10-03GT UCS 03-4 Argillite UCS 28.35 28.72 0.30 60.81 127.75 2.10 137.29 60.73 0.37
K10-04GT UCS 04-1 Greywacke UCS 17.98 18.32 0.26 60.78 133.49 2.20 78.51 69.75 0.33
K10-04GT UCS 04-2 Greywacke UCS 22.56 22.84 0.30 60.80 135.44 2.23 79.21 44.82 0.28
K10-04GT UCS 04-3 Argillite UCS 32.00 32.37 0.20 60.82 132.74 2.18 126.83 88.32 0.36
K10-04GT UCS 04-4 Greywacke UCS 48.77 49.02 0.20 60.70 131.68 2.17 80.39 42.11 0.25
K10-04GT UCS 04-5 Greywacke UCS 56.69 57.11 0.23 60.86 131.17 2.16 41.38 54.70 0.42
K10-04GT UCS 04-6 Greywacke
UNCONFINED COMPRESSIVE STRENGTH LABORATORY TEST RESULTS
Drillhole ID Sample # Rock Type
Print Jan/12/11 16:29:46
TABLE 3.6
AVANTI KITSAULT MINE LTDKITSAULT PROJECT
FEASIBILITY GEOTECHNICAL SITE INVESTIGATIONS
Diameter Height Ratio UCSLengthDepthTest Type
Broken during transport
Broken during transport
K10-04GT UCS 04-7 Greywacke / Argillite UCS 70.41 70.74 0.29 60.92 133.88 2.20 45.90 48.24 0.33
K10-04GT UCS 04-8 Greywacke UCS 88.39 88.68 0.31 60.54 131.71 2.18 99.61 51.31 0.29
K10-04GT UCS 04-9 Greywacke UCS 97.84 98.11 0.20 60.86 133.23 2.19 109.47 46.35 0.27
K10-05GT UCS 05-1 Argillite UCS 24.69 25.02 0.24 60.83 128.47 2.11 20.99 26.11 0.33
K10-05GT UCS 05-2 Argillite UCS 28.65 28.92 0.18 60.86 129.58 2.13 29.79 27.96 0.27
K10-05GT UCS 05-3 Greywacke PLT 37.64 37.64 0.17 60.93 138.24K10-05GT UCS 05-4 ArgilliteK10-09GT UCS 09-1 Trachyandesite UCS 21.34 21.78 0.20 60.61 130.93 2.16 220.96 52.27 0.44
K10-09GT UCS 09-2 Trachyandesite UCS 12.50 12.91 0.40 60.93 126.01 2.07 302.99 74.65 0.41
K10-12GT UCS 12-1 Trachyandesite UCS 3.35 3.68 0.30 60.71 129.81 2.14 214.83 43.66 0.33
K10-12GT UCS 12-2 Trachyandesite UCS 19.81 20.23 0.24 60.67 130.61 2.15 23.93 54.95 0.41
K10-12GT UCS 12-3 Trachyandesite UCS 28.65 28.98 0.23 60.41 129.99 2.15 177.59 37.62 0.33
K10-13GT UCS 13-1 Trachyandesite UCS 3.35 3.73 0.18 60.89 131.32 2.16 197.36 50.08 0.38
K10-13GT UCS 13-2 Trachyandesite UCS 10.73 11.17 0.30 61.02 133.02 2.18 269.57 56.33 0.44
K10-13GT UCS 13-3 Trachyandesite UCS 15.24 15.81 0.20 60.94 129.16 2.12 278.94 72.67 0.57
K10-13GT UCS 13-4 Trachyandesite UCS 22.86 23.22 0.24 60.83 130.55 2.15 231.27 39.59 0.36
K10-13GT UCS 13-5 Trachyandesite UCS 31.70 31.98 0.20 60.72 131.06 2.16 27.79 13.09 0.28
K10-13GT UCS 13-6 Trachyandesite UCS 39.38 39.73 0.31 60.71 130.22 2.14 62.83 22.15 0.35
K10-14GT UCS 14-1 Trachyandesite UCS 3.08 3.50 0.18 60.92 130.64 2.14 195.22 47.86 0.42
K10-15AGT UCS 15-1 Greywacke UCS 2.16 2.47 0.22 60.55 130.10 2.15 125.95 30.89 0.31
K10-15AGT UCS 15-2 Greywacke / Argillite UCS 9.63 9.92 0.17 60.57 131.73 2.17 97.53 76.72 0.29
Broken during transport
Page 1 of 2
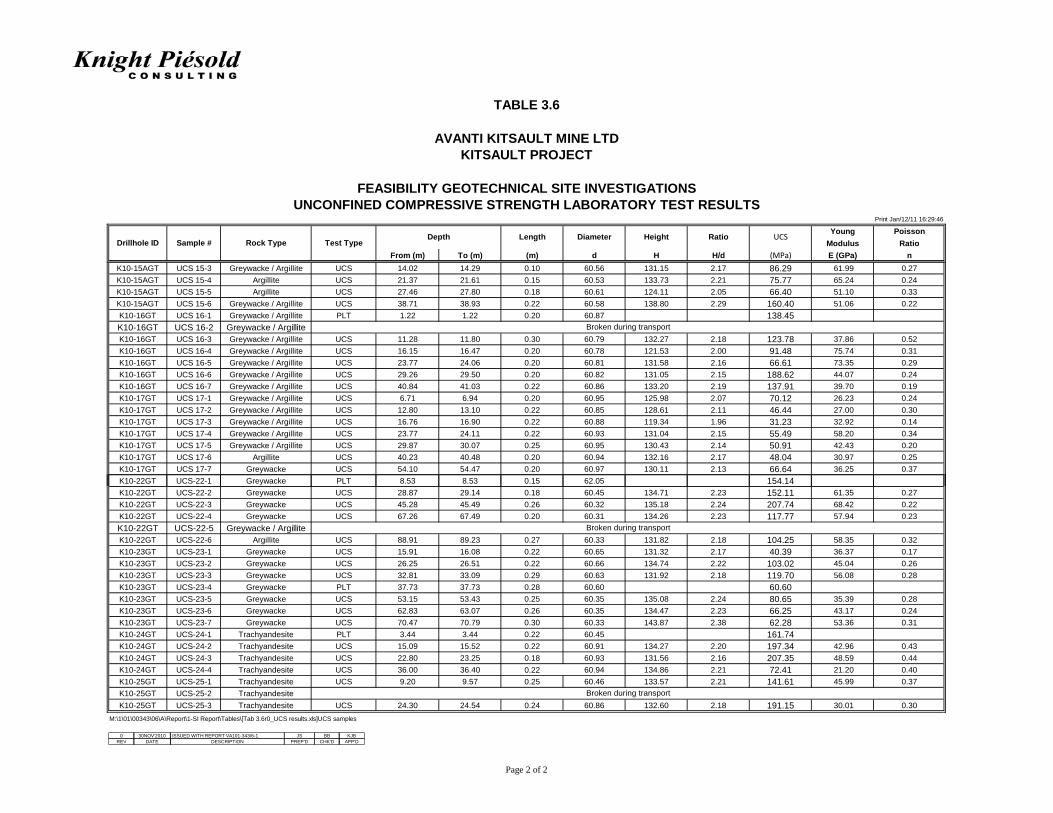
Young Poisson
Modulus Ratio
From (m) To (m) (m) d H H/d (MPa) E (GPa) n
UNCONFINED COMPRESSIVE STRENGTH LABORATORY TEST RESULTS
Drillhole ID Sample # Rock Type
Print Jan/12/11 16:29:46
TABLE 3.6
AVANTI KITSAULT MINE LTDKITSAULT PROJECT
FEASIBILITY GEOTECHNICAL SITE INVESTIGATIONS
Diameter Height Ratio UCSLengthDepthTest Type
K10-15AGT UCS 15-3 Greywacke / Argillite UCS 14.02 14.29 0.10 60.56 131.15 2.17 86.29 61.99 0.27
K10-15AGT UCS 15-4 Argillite UCS 21.37 21.61 0.15 60.53 133.73 2.21 75.77 65.24 0.24
K10-15AGT UCS 15-5 Argillite UCS 27.46 27.80 0.18 60.61 124.11 2.05 66.40 51.10 0.33
K10-15AGT UCS 15-6 Greywacke / Argillite UCS 38.71 38.93 0.22 60.58 138.80 2.29 160.40 51.06 0.22
K10-16GT UCS 16-1 Greywacke / Argillite PLT 1.22 1.22 0.20 60.87 138.45K10-16GT UCS 16-2 Greywacke / ArgilliteK10-16GT UCS 16-3 Greywacke / Argillite UCS 11.28 11.80 0.30 60.79 132.27 2.18 123.78 37.86 0.52
K10-16GT UCS 16-4 Greywacke / Argillite UCS 16.15 16.47 0.20 60.78 121.53 2.00 91.48 75.74 0.31
K10-16GT UCS 16-5 Greywacke / Argillite UCS 23.77 24.06 0.20 60.81 131.58 2.16 66.61 73.35 0.29
K10-16GT UCS 16-6 Greywacke / Argillite UCS 29.26 29.50 0.20 60.82 131.05 2.15 188.62 44.07 0.24
K10-16GT UCS 16-7 Greywacke / Argillite UCS 40.84 41.03 0.22 60.86 133.20 2.19 137.91 39.70 0.19
K10-17GT UCS 17-1 Greywacke / Argillite UCS 6.71 6.94 0.20 60.95 125.98 2.07 70.12 26.23 0.24
K10-17GT UCS 17-2 Greywacke / Argillite UCS 12.80 13.10 0.22 60.85 128.61 2.11 46.44 27.00 0.30
K10-17GT UCS 17-3 Greywacke / Argillite UCS 16.76 16.90 0.22 60.88 119.34 1.96 31.23 32.92 0.14
K10-17GT UCS 17-4 Greywacke / Argillite UCS 23.77 24.11 0.22 60.93 131.04 2.15 55.49 58.20 0.34
K10-17GT UCS 17-5 Greywacke / Argillite UCS 29.87 30.07 0.25 60.95 130.43 2.14 50.91 42.43 0.20
K10-17GT UCS 17-6 Argillite UCS 40.23 40.48 0.20 60.94 132.16 2.17 48.04 30.97 0.25
K10-17GT UCS 17-7 Greywacke UCS 54.10 54.47 0.20 60.97 130.11 2.13 66.64 36.25 0.37
Broken during transport
K10-22GT UCS-22-1 Greywacke PLT 8.53 8.53 0.15 62.05 154.14K10-22GT UCS-22-2 Greywacke UCS 28.87 29.14 0.18 60.45 134.71 2.23 152.11 61.35 0.27
K10-22GT UCS-22-3 Greywacke UCS 45.28 45.49 0.26 60.32 135.18 2.24 207.74 68.42 0.22
K10-22GT UCS-22-4 Greywacke UCS 67.26 67.49 0.20 60.31 134.26 2.23 117.77 57.94 0.23
K10-22GT UCS-22-5 Greywacke / ArgilliteK10-22GT UCS-22-6 Argillite UCS 88.91 89.23 0.27 60.33 131.82 2.18 104.25 58.35 0.32
K10-23GT UCS-23-1 Greywacke UCS 15.91 16.08 0.22 60.65 131.32 2.17 40.39 36.37 0.17
K10-23GT UCS-23-2 Greywacke UCS 26.25 26.51 0.22 60.66 134.74 2.22 103.02 45.04 0.26
K10-23GT UCS-23-3 Greywacke UCS 32.81 33.09 0.29 60.63 131.92 2.18 119.70 56.08 0.28
K10-23GT UCS-23-4 Greywacke PLT 37.73 37.73 0.28 60.60 60.60K10-23GT UCS-23-5 Greywacke UCS 53.15 53.43 0.25 60.35 135.08 2.24 80.65 35.39 0.28
K10-23GT UCS-23-6 Greywacke UCS 62.83 63.07 0.26 60.35 134.47 2.23 66.25 43.17 0.24
K10-23GT UCS-23-7 Greywacke UCS 70.47 70.79 0.30 60.33 143.87 2.38 62.28 53.36 0.31
K10-24GT UCS-24-1 Trachyandesite PLT 3.44 3.44 0.22 60.45 161.74K10-24GT UCS-24-2 Trachyandesite UCS 15.09 15.52 0.22 60.91 134.27 2.20 197.34 42.96 0.43
K10-24GT UCS-24-3 Trachyandesite UCS 22.80 23.25 0.18 60.93 131.56 2.16 207.35 48.59 0.44
K10-24GT UCS-24-4 Trachyandesite UCS 36.00 36.40 0.22 60.94 134.86 2.21 72.41 21.20 0.40
K10-25GT UCS-25-1 Trachyandesite UCS 9.20 9.57 0.25 60.46 133.57 2.21 141.61 45.99 0.37
K10-25GT UCS-25-2 Trachyandesite
K10-25GT UCS-25-3 Trachyandesite UCS 24.30 24.54 0.24 60.86 132.60 2.18 191.15 30.01 0.30
M:\1\01\00343\06\A\Report\1-SI Report\Tables\[Tab 3.6r0_UCS results.xls]UCS samples
Broken during transport
Broken during transport
0 30NOV'2010 JS BBISSUED WITH REPORT VA101-343/6-1 KJBDATE DESCRIPTION PREP'D CHK'D APP'DREV
Page 2 of 2


KITSAULT PROJECT
AVANTI KITSAULT MINE LTD
REGIONAL BEDROCK GEOLOGYP/A NO.
REV
VA101-343/6 1REF NO.
FIGURE 2.1VA
NC
OU
VE
R B
.C.
SA
VE
D:
M:\
1\0
1\0
03
43\
06\
A\G
IS\A
rcV
iew
\figu
res\
Fig
ure
2.1
_K
its_
Be
dro
ckG
eo
log
y.m
xd;
13 J
an
20
11 1
5:2
8:3
9 P
M a
din
ca
REV DATE DESCRIPTION DESIGN APP'DCHK'DDRAWNAMD0 13JAN'11 ISSUED WITH REPORT JS GLS KJB
0
KITSAULT DEPOSIT
ROUNDY CREEKDEPOSIT
ULTIMATE OPEN PIT OUTLINE
Roundy Creek
Lime Creek
Illiance River
Nass River
Clary Lake
PatsyLake
Alice
Arm
mJKB
Eg
muJHs
Qvb
Qvb
Qvb
EA
Qvb
Qvb
QvbQvb
EA
EA EA
800
900
700
600
500
400
120
0
1000
300
1300
200
100
1100
1400
1500
1600
100
400
1500
800
700
1200
900
800
800
900
900
1500
800
1500
600
700
900
600
800
600
500
1100
800
900
900
500
900
500
600
1200
1000
1300
1300
1000
700
900
1100
1300
700
900
1000
900
800
1000
800
1100
1200
500
800
1000
600
100
800
900
900
1200
1200
1300
400
900
700
800
100
0
900
900
900
1100
700
600
800
700
1000
800
1500
1400
800
1100
800
700
1200
1000
900
1200
900
900
800
1300
600
800
700
300
1300
1100
600
700
400
900
600
1100
400
900
500
900
900
800
200
200
900
800
800
800
700
800
900
900
900
700
466000
468000
470000
472000
474000
476000
478000
480000
6140000
6142000
6144000
6146000
ò" >N
LEGEND:TRANSMISSION LINE
DIVERSION CHANNEL
NE Embankment
Tailings
South Embankment
East Waste RockManagement Facility
Kitsault Pit(Approx.)
North Waste RockManagement Facility
Stockpile
100 m CONTOUR
20 m CONTOUR
400 0 400 800 1,200 1,600 2,000200 Meters
SCALE
NOTES:1. BEDROCK GEOLOGY SOURCED FROM BC GOVERNMENT. MINISTRYOF ENERGY, MINES AND PETROLEUM RESOURCES (MEMPR).
2. CO-ORDINATE GRID IS IN METRES.DATUM: NAD83PROJECTION: UTM ZONE 9
3. THIS FIGURE IS PRODUCED AT A NOMINAL SCALE OF 1:40,000FOR 11x17 (TABLOID) PAPER. ACTUAL SCALE MAY DIFFER ACCORDING TO CHANGES IN PRINTER SETTINGS ORPRINTED PAPER SIZE.
BEDROCK GEOLOGYCOAST INTRUSION GRANODIORITE, QUARTZ DIORITE
ALICE ARM INTRUSIONS
BASALTIC VOLCANIC ROCKS
BOWSER LAKE GROUP - INTERBEDDED ARGILLITES AND GREYWACKE
UNDIVIDED SEDIMENTARY ROCKS
EA
Eg
Qvb
mJKB
muJHs
RIVER/CREEK
OCEAN
LAKE
FAULT
NORMAL FAULT
FAULT
OPEN PIT
WASTE ROCK MANAGEMENT FACILITY
TAILINGS MANAGEMENT FACILITY


M:\1\01\00343\06\A\Report\1-SI Report\Figures\Figure 3.2r0_ Hydraulic Conductivity vs. Elevation Figure 3.2 Print 1/13/2011 4:41 PM
400
600
800
1000
1.00E-09 1.00E-08 1.00E-07 1.00E-06 1.00E-05 1.00E-04 1.00E-03 1.00E-02 1.00E-01
Ele
vati
on
(m
)
Hydraulic Conductivity (cm/s)
-200
0
200
Bowser Lake Group
Tuff
Trachyandesite
Diorite
2009 AND 2010 GEOTECHNICAL SITE INVESTIGATIONSHYDRAULIC CONDUCTIVITY VS. ELEVATION
FIGURE 3.2
AVANTI KITSAULT MINE LTD
KITSAULT PROJECT
REV0
PA NO. VA101-343/6
REF NO.1Knight Piésold
C O N S U L T I N G0 30NOV'10 ISSUED WITH REPORT CG BB KJB
DATE DESCRIPTION PREP'D CHK'D APP'DREV