Embed Size (px)
Citation preview

AVI LIMITED ISIN: ZAE000049433 Share code: AVI Registration number: 1944/017201/06 (“AVI” or “the Group” or “the Company”) www.avi.co.za
CONTENTS
1 OVERVIEW1 Our business1 Operating structure2 Our business highlights4 AVI objectives and strategies
6 BUSINESS REVIEW6 Chairman and CEO’s review10 Operational reviews10 ENTYCE BEVERAGES12 SNACKWORKS14 I&J16 FASHION BRANDS22 INTERNATIONAL24 Financial review32 Sustainable Development Report
60 GOVERNANCE60 Board of directors62 Corporate Governance Report72 Remuneration Report
77 ANNUAL FINANCIAL STATEMENTS
149 SHAREHOLDER INFORMATION
ABOUT THIS REPORT
AVI’s Integrated Annual Report covers the economic, environmental and social activities of the Group for the period 1 July 2014 to 30 June 2015 and aims to provide AVI’s stakeholders with a transparent, balanced and holistic view of the Group’s performance. In addition, where it is informative to add information post 30 June 2015, this has been included and noted.
This report covers the entire Group, comprising Entyce Beverages, Snackworks, I&J, and Fashion Brands. Since the release of AVI’s Integrated Annual Report for the year ended 30 June 2015, there has been no change to the structure, ownership or products and services of the Group.
In compiling the report, AVI has considered the Companies Act, No 71 of 2008, as amended; the Listings Requirements of the JSE Limited; the King
Report on Governance for South Africa 2009 and the International Financial Reporting Standards (“IFRS”) in respect to the Annual Financial Statements.
BOARD RESPONSIBILITY
The Board of directors (“the Board”) acknowledges its responsibility to ensure the integrity of the Integrated Annual Report. The Board has accordingly applied its mind to the Integrated Annual Report and in its opinion the Integrated Annual Report addresses all material issues, and presents fairly the integrated performance of the organisation and its impacts.
Any questions or comments on the report can be forwarded to [email protected].
1
OUR BUSINESS
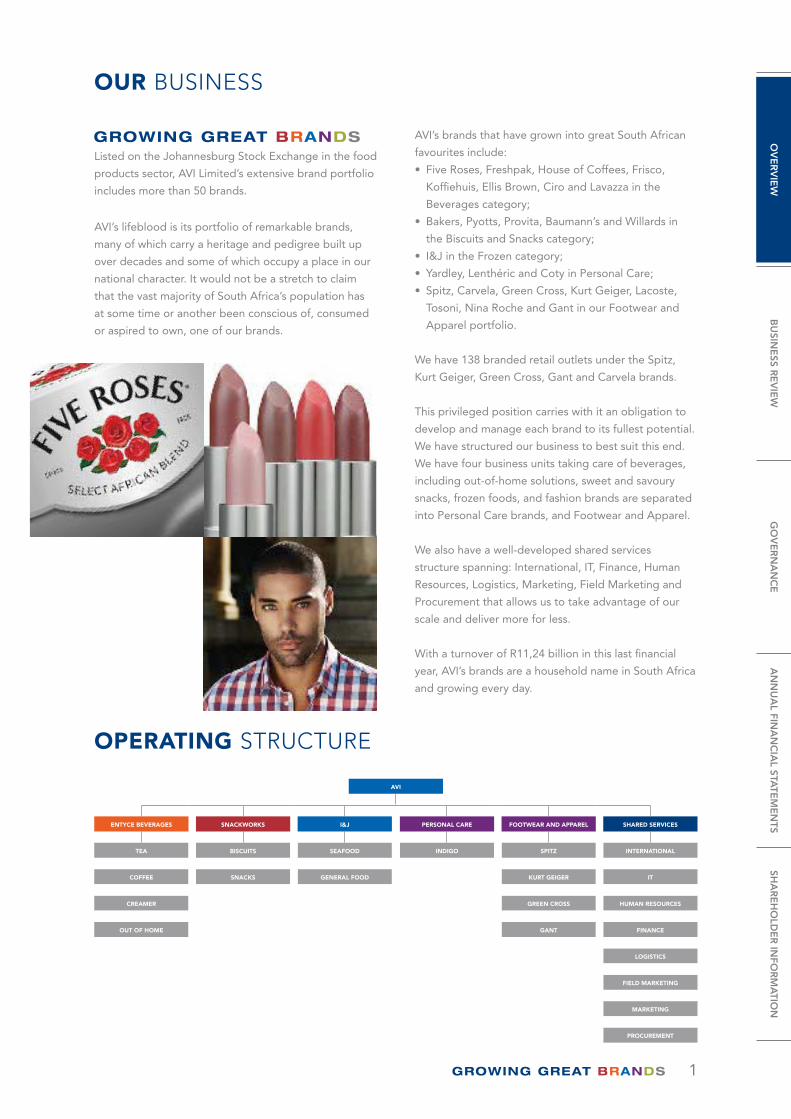
OPERATING STRUCTURE
AVI
ENTYCE BEVERAGES SNACKWORKS I&J PERSONAL CARE FOOTWEAR AND APPAREL SHARED SERVICES
TEA BISCUITS SEAFOOD INDIGO SPITZ INTERNATIONAL
COFFEE SNACKS GENERAL FOOD KURT GEIGER IT
CREAMER GREEN CROSS HUMAN RESOURCES
OUT OF HOME GANT FINANCE
LOGISTICS
FIELD MARKETING
MARKETING
PROCUREMENT
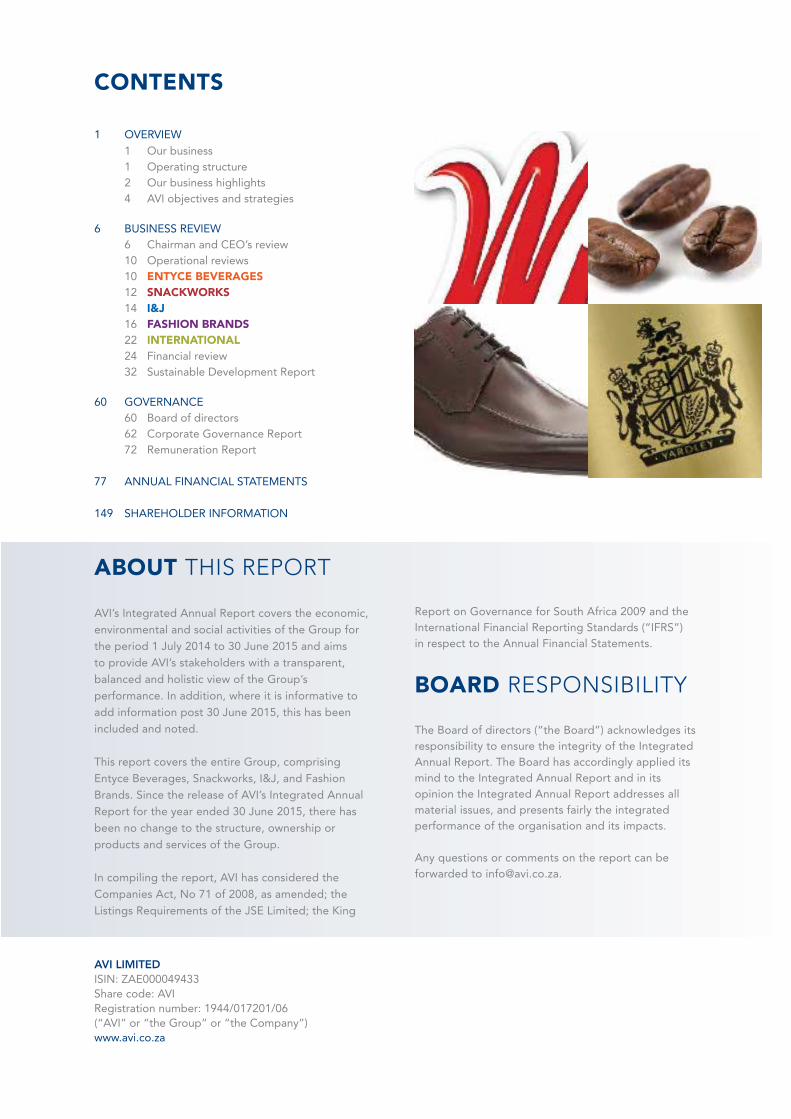
Listed on the Johannesburg Stock Exchange in the food
products sector, AVI Limited’s extensive brand portfolio
includes more than 50 brands.
AVI’s lifeblood is its portfolio of remarkable brands,
many of which carry a heritage and pedigree built up
over decades and some of which occupy a place in our
national character. It would not be a stretch to claim
that the vast majority of South Africa’s population has
at some time or another been conscious of, consumed
or aspired to own, one of our brands.
AVI’s brands that have grown into great South African
favourites include:
• Five Roses, Freshpak, House of Coffees, Frisco,
Koffiehuis, Ellis Brown, Ciro and Lavazza in the
Beverages category;
• Bakers, Pyotts, Provita, Baumann’s and Willards in
the Biscuits and Snacks category;
• I&J in the Frozen category;
• Yardley, Lenthéric and Coty in Personal Care;
• Spitz, Carvela, Green Cross, Kurt Geiger, Lacoste,
Tosoni, Nina Roche and Gant in our Footwear and
Apparel portfolio.
We have 138 branded retail outlets under the Spitz,
Kurt Geiger, Green Cross, Gant and Carvela brands.
This privileged position carries with it an obligation to
develop and manage each brand to its fullest potential.
We have structured our business to best suit this end.
We have four business units taking care of beverages,
including out-of-home solutions, sweet and savoury
snacks, frozen foods, and fashion brands are separated
into Personal Care brands, and Footwear and Apparel.
We also have a well-developed shared services
structure spanning: International, IT, Finance, Human
Resources, Logistics, Marketing, Field Marketing and
Procurement that allows us to take advantage of our
scale and deliver more for less.
With a turnover of R11,24 billion in this last financial
year, AVI’s brands are a household name in South Africa
and growing every day.
OV
ER
VIE
WB
USIN
ESS R
EV
IEW
GO
VE
RN
AN
CE
AN
NU
AL FIN
AN
CIA
L STATE
ME
NTS
SHA
RE
HO
LDE
R IN
FOR
MA
TION
2
OUR BUSINESS HIGHLIGHTS
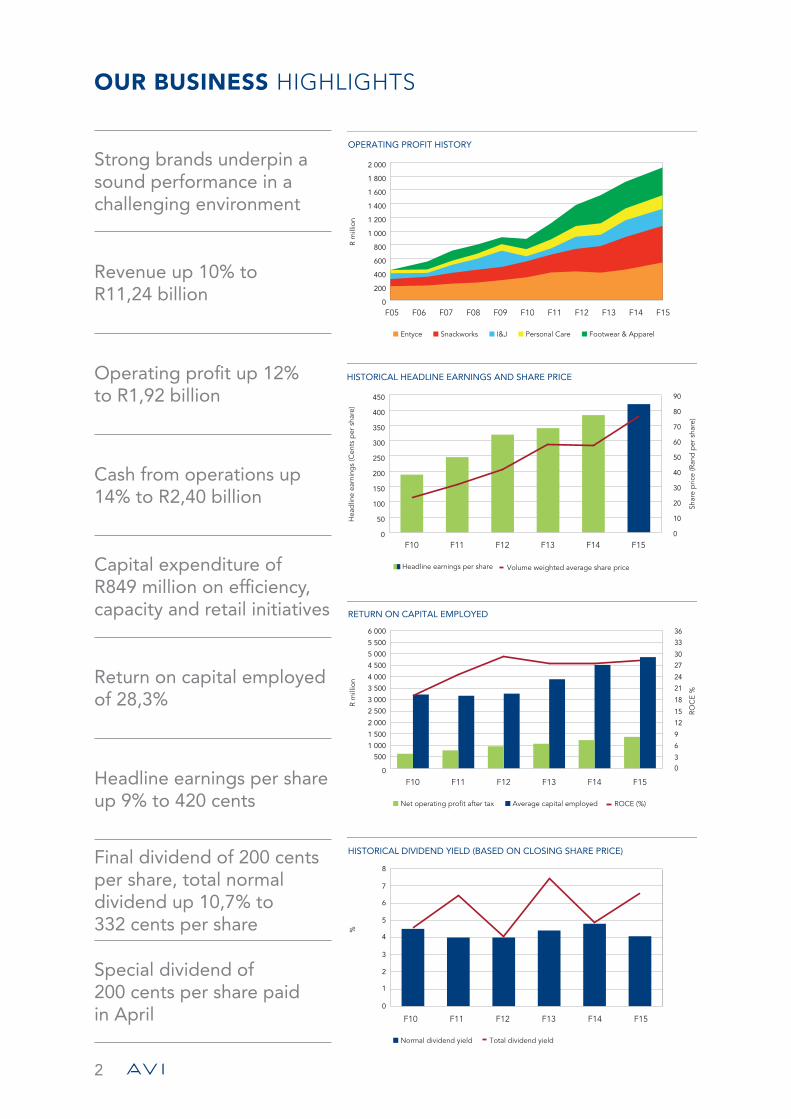
Strong brands underpin a sound performance in a challenging environment
Revenue up 10% to R11,24 billion
Operating profit up 12% to R1,92 billion
Cash from operations up 14% to R2,40 billion
Capital expenditure of R849 million on efficiency, capacity and retail initiatives
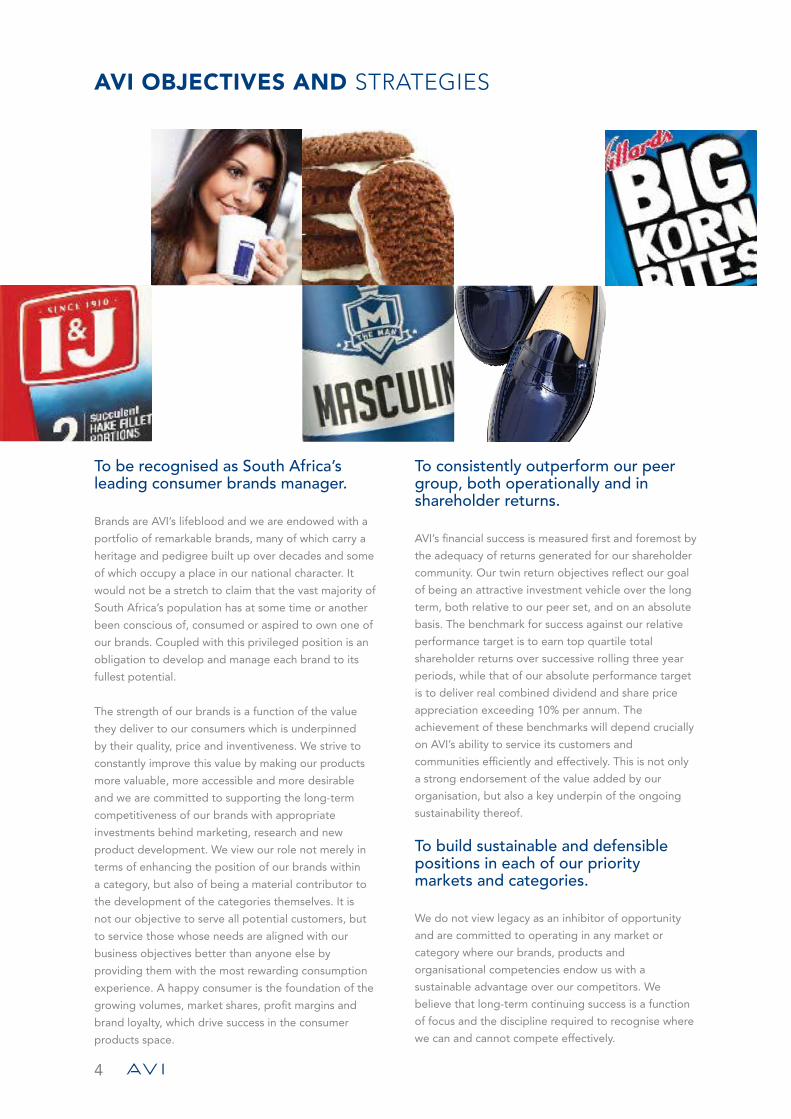
Return on capital employed of 28,3%
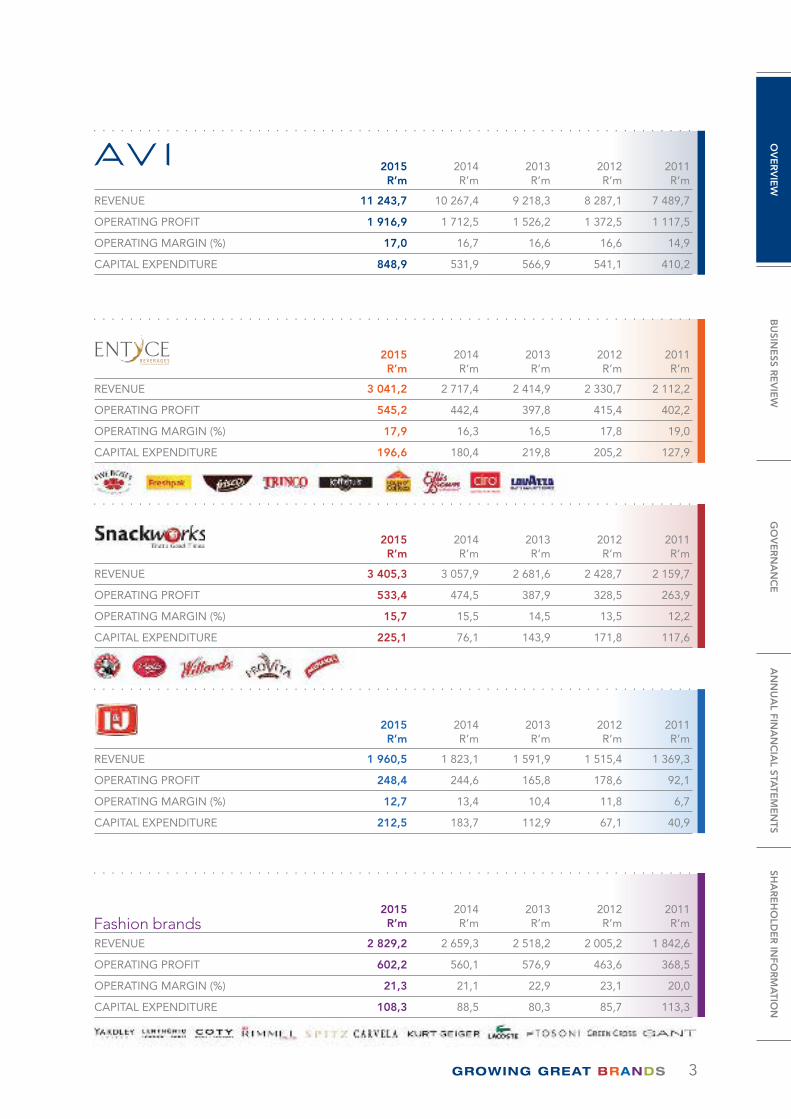
Headline earnings per share up 9% to 420 cents
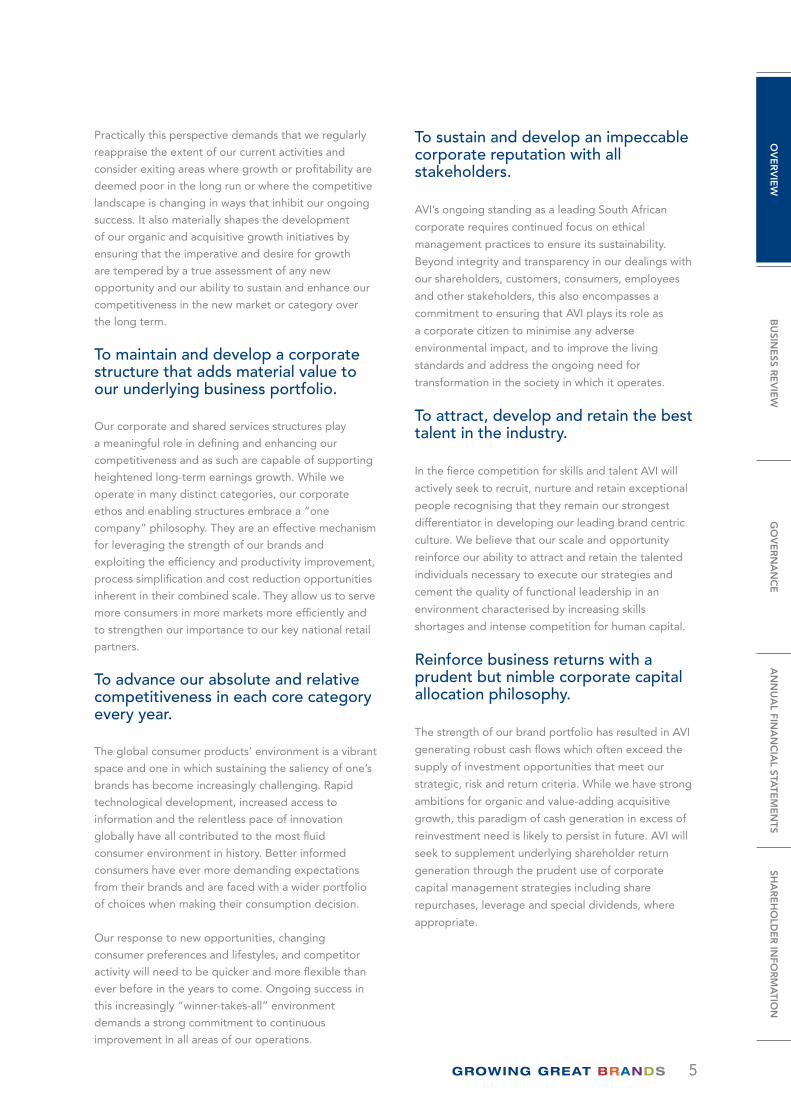
Final dividend of 200 cents per share, total normal dividend up 10,7% to 332 cents per share
Special dividend of 200 cents per share paid in April
OPERATING PROFIT HISTORY
R m
illio
n
0
200
400
600
800
1 000
1 200
1 400
1 600
1 800
2 000
F10F05 F06 F07 F08 F09 F11 F12 F13 F14 F15
Entyce Snackworks I&J Personal Care Footwear & Apparel
HISTORICAL HEADLINE EARNINGS AND SHARE PRICE
Hea
dlin
e ea
rnin
gs
(Cen
ts p
er s
hare
)
Shar
e p
rice
(Ran
d p
er s
hare
)
0
50
100
150
200
250
300
350
400
450
F10 F11 F12 F13 F14 F150
10
20
30
40
50
60
70
80
90
Headline earnings per share Volume weighted average share price
RETURN ON CAPITAL EMPLOYED
R m
illio
n
ROC
E %
Net operating profit after tax Average capital employed ROCE (%)
0
500
1 000
1 500
2 000
2 500
3 000
3 500
4 000
4 500
5 000
5 500
6 000
F10 F11 F12 F13 F14 F15
0
3
6
9
12
15
18
21
24
27
30
33
36
HISTORICAL DIVIDEND YIELD (BASED ON CLOSING SHARE PRICE)
%
Normal dividend yield Total dividend yield
0
1
2
3
4
5
6
7
8
F10 F11 F12 F13 F14 F15
3
2015R’m
2014R’m
2013R’m
2012R’m
2011R’m
REVENUE 3 041,2 2 717,4 2 414,9 2 330,7 2 112,2
OPERATING PROFIT 545,2 442,4 397,8 415,4 402,2
OPERATING MARGIN (%) 17,9 16,3 16,5 17,8 19,0
CAPITAL EXPENDITURE 196,6 180,4 219,8 205,2 127,9
2015R’m
2014R’m
2013R’m
2012R’m
2011R’m
REVENUE 11 243,7 10 267,4 9 218,3 8 287,1 7 489,7
OPERATING PROFIT 1 916,9 1 712,5 1 526,2 1 372,5 1 117,5
OPERATING MARGIN (%) 17,0 16,7 16,6 16,6 14,9
CAPITAL EXPENDITURE 848,9 531,9 566,9 541,1 410,2
2015R’m
2014R’m
2013R’m
2012R’m
2011R’m
REVENUE 3 405,3 3 057,9 2 681,6 2 428,7 2 159,7
OPERATING PROFIT 533,4 474,5 387,9 328,5 263,9
OPERATING MARGIN (%) 15,7 15,5 14,5 13,5 12,2
CAPITAL EXPENDITURE 225,1 76,1 143,9 171,8 117,6
2015R’m
2014R’m
2013R’m
2012R’m
2011R’m
REVENUE 1 960,5 1 823,1 1 591,9 1 515,4 1 369,3
OPERATING PROFIT 248,4 244,6 165,8 178,6 92,1
OPERATING MARGIN (%) 12,7 13,4 10,4 11,8 6,7
CAPITAL EXPENDITURE 212,5 183,7 112,9 67,1 40,9
Fashion brands2015R’m
2014R’m
2013R’m
2012R’m
2011R’m
REVENUE 2 829,2 2 659,3 2 518,2 2 005,2 1 842,6
OPERATING PROFIT 602,2 560,1 576,9 463,6 368,5
OPERATING MARGIN (%) 21,3 21,1 22,9 23,1 20,0
CAPITAL EXPENDITURE 108,3 88,5 80,3 85,7 113,3
OV
ER
VIE
WB
USIN
ESS R
EV
IEW
GO
VE
RN
AN
CE
AN
NU
AL FIN
AN
CIA
L STATE
ME
NTS
SHA
RE
HO
LDE
R IN
FOR
MA
TION
4
AVI OBJECTIVES AND STRATEGIES
To be recognised as South Africa’s leading consumer brands manager.
Brands are AVI’s lifeblood and we are endowed with a
portfolio of remarkable brands, many of which carry a
heritage and pedigree built up over decades and some
of which occupy a place in our national character. It
would not be a stretch to claim that the vast majority of
South Africa’s population has at some time or another
been conscious of, consumed or aspired to own one of
our brands. Coupled with this privileged position is an
obligation to develop and manage each brand to its
fullest potential.
The strength of our brands is a function of the value
they deliver to our consumers which is underpinned
by their quality, price and inventiveness. We strive to
constantly improve this value by making our products
more valuable, more accessible and more desirable
and we are committed to supporting the long-term
competitiveness of our brands with appropriate
investments behind marketing, research and new
product development. We view our role not merely in
terms of enhancing the position of our brands within
a category, but also of being a material contributor to
the development of the categories themselves. It is
not our objective to serve all potential customers, but
to service those whose needs are aligned with our
business objectives better than anyone else by
providing them with the most rewarding consumption
experience. A happy consumer is the foundation of the
growing volumes, market shares, profit margins and
brand loyalty, which drive success in the consumer
products space.
To consistently outperform our peer group, both operationally and in shareholder returns.
AVI’s financial success is measured first and foremost by
the adequacy of returns generated for our shareholder
community. Our twin return objectives reflect our goal
of being an attractive investment vehicle over the long
term, both relative to our peer set, and on an absolute
basis. The benchmark for success against our relative
performance target is to earn top quartile total
shareholder returns over successive rolling three year
periods, while that of our absolute performance target
is to deliver real combined dividend and share price
appreciation exceeding 10% per annum. The
achievement of these benchmarks will depend crucially
on AVI’s ability to service its customers and
communities efficiently and effectively. This is not only
a strong endorsement of the value added by our
organisation, but also a key underpin of the ongoing
sustainability thereof.
To build sustainable and defensible positions in each of our priority markets and categories.
We do not view legacy as an inhibitor of opportunity
and are committed to operating in any market or
category where our brands, products and
organisational competencies endow us with a
sustainable advantage over our competitors. We
believe that long-term continuing success is a function
of focus and the discipline required to recognise where
we can and cannot compete effectively.
5
Practically this perspective demands that we regularly
reappraise the extent of our current activities and
consider exiting areas where growth or profitability are
deemed poor in the long run or where the competitive
landscape is changing in ways that inhibit our ongoing
success. It also materially shapes the development
of our organic and acquisitive growth initiatives by
ensuring that the imperative and desire for growth
are tempered by a true assessment of any new
opportunity and our ability to sustain and enhance our
competitiveness in the new market or category over
the long term.
To maintain and develop a corporate structure that adds material value to our underlying business portfolio.
Our corporate and shared services structures play
a meaningful role in defining and enhancing our
competitiveness and as such are capable of supporting
heightened long-term earnings growth. While we
operate in many distinct categories, our corporate
ethos and enabling structures embrace a “one
company” philosophy. They are an effective mechanism
for leveraging the strength of our brands and
exploiting the efficiency and productivity improvement,
process simplification and cost reduction opportunities
inherent in their combined scale. They allow us to serve
more consumers in more markets more efficiently and
to strengthen our importance to our key national retail
partners.
To advance our absolute and relative competitiveness in each core category every year.
The global consumer products’ environment is a vibrant
space and one in which sustaining the saliency of one’s
brands has become increasingly challenging. Rapid
technological development, increased access to
information and the relentless pace of innovation
globally have all contributed to the most fluid
consumer environment in history. Better informed
consumers have ever more demanding expectations
from their brands and are faced with a wider portfolio
of choices when making their consumption decision.
Our response to new opportunities, changing
consumer preferences and lifestyles, and competitor
activity will need to be quicker and more flexible than
ever before in the years to come. Ongoing success in
this increasingly “winner-takes-all” environment
demands a strong commitment to continuous
improvement in all areas of our operations.
To sustain and develop an impeccable corporate reputation with all stakeholders.
AVI’s ongoing standing as a leading South African
corporate requires continued focus on ethical
management practices to ensure its sustainability.
Beyond integrity and transparency in our dealings with
our shareholders, customers, consumers, employees
and other stakeholders, this also encompasses a
commitment to ensuring that AVI plays its role as
a corporate citizen to minimise any adverse
environmental impact, and to improve the living
standards and address the ongoing need for
transformation in the society in which it operates.
To attract, develop and retain the best talent in the industry.
In the fierce competition for skills and talent AVI will
actively seek to recruit, nurture and retain exceptional
people recognising that they remain our strongest
differentiator in developing our leading brand centric
culture. We believe that our scale and opportunity
reinforce our ability to attract and retain the talented
individuals necessary to execute our strategies and
cement the quality of functional leadership in an
environment characterised by increasing skills
shortages and intense competition for human capital.
Reinforce business returns with a prudent but nimble corporate capital allocation philosophy.
The strength of our brand portfolio has resulted in AVI
generating robust cash flows which often exceed the
supply of investment opportunities that meet our
strategic, risk and return criteria. While we have strong
ambitions for organic and value-adding acquisitive
growth, this paradigm of cash generation in excess of
reinvestment need is likely to persist in future. AVI will
seek to supplement underlying shareholder return
generation through the prudent use of corporate
capital management strategies including share
repurchases, leverage and special dividends, where
appropriate.
OV
ER
VIE
WB
USIN
ESS R
EV
IEW
GO
VE
RN
AN
CE
AN
NU
AL FIN
AN
CIA
L STATE
ME
NTS
SHA
RE
HO
LDE
R IN
FOR
MA
TION
6
CHAIRMAN and CEO’S REVIEW
GAVIN R TIPPER Chairman
OverviewGlobal economic health is mixed with the apparent recovery in the United States largely offset by ongoing difficulties in parts of Europe and a slowing China. The perceived difficulties in China have increased risk aversion and impacted emerging market currencies, particularly those in commodity based economies.
Domestically the picture is also concerning. There are significant global and domestic headwinds affecting the level of economic growth: high unemployment, high levels of wage settlement, administered inflation and increasing government debt. Given the economic stress the South African consumer is under, and the likelihood of higher rates of inflation, it is unlikely that the necessary stimulus to achieve growth will be provided through consumer spending.
AVI produced a strong set of results for the year given the state of the local economy. Revenue increased by 9,5%, operating profit rose by 11,9%, and headline earnings were up by 11,2%. Unusually bad catch rates in the final quarter of the year limited I&J’s profit and in turn reduced the Group result.
Entyce delivered a strong result for the year, recovering some of the profit margin given up in the tough trading conditions experienced over the last few years and achieving good Creamer volume growth. Snackworks continued to perform well with volume growth in Biscuits and further improvements in profit margin. I&J benefited materially from the weaker Rand, supported by good processing efficiency, however, profit growth for the year was constrained by lower catch rates in the second semester, which resulted in higher hake catch costs and constrained sales volumes. At Indigo, owned brands performed well in a competitive environment and the Coty profit contribution was preserved in the new relationship. Margins in the Footwear and Apparel businesses have stabilised and profit grew as a result of a strong performance from Spitz, with growth in both footwear and clothing volumes.
AVI International performed well with revenue up 14,4% and operating profit up 20,8%. The revenue growth was achieved largely through improved distribution and some pricing. Despite significant growth in Creamer volumes, which are at a relatively lower margin, the price increases and tighter cost controls resulted in an improvement in the operating margin.

7
Financial reviewRevenue increased by 9,5%, from R10,27 billion to R11,24 billion, with the Group realising higher selling prices in all categories following significant accumulated cost pressure as a result of the weakening of the Rand over the last few years. In addition, volume growth was achieved in many of our categories and I&J’s export revenue benefited from the Rand weakness. Gross profit rose by 11,2% to R4,92 billion with the consolidated gross profit margin improving from 43,1% to 43,8%. Operating profit increased by 11,9%, from R1,71 billion to R1,92 billion with the growth in gross profit supported by good containment of selling and administrative expenses across the Group. The operating profit margin increased from 16,7% to 17,0%.
Cash generated by operations before working capital changes increased 13,9% to R2,40 billion. Working capital rose R301,7 million, reflecting volume growth, strong trading at the end of the period and higher stock values from rising input costs. Capital expenditure of R848,9 million incorporated capacity and efficiency projects in the manufacturing operations and new and refurbished stores in the retail businesses. Other material cash outflows during the period were dividends of R1,63 billion and taxation of R487,5 million. Net debt at the end of June 2015 was R1,20 billion compared to R349,0 million at the end of June 2014.
One of the ways in which we measure ourselves is through the return we generate on capital employed. We are pleased to report that the return for the current period was 28,3% and the ratio has exceeded 20% in each financial year since 2011.
DividendIn terms of the Company’s dividend policy, a final dividend of 200 cents per share has been declared. This brings the total normal dividend for the year to 332 cents, an increase of 10,7% over the prior year. In addition, a special dividend of 200 cents per share was paid in April 2015.
Investing for growthOur capital replacement and expansion programme continued in the current year with an investment of R848,9 million. Capital projects included a third creamer tower, the purchase of two biscuit lines, progress payments on the wet and freezer vessels for
Our retail partners worked hard to produce growth in a difficult environment. The major retailers face different challenges but are all heavily focused on growth, market share and improving margin. As we work with them to achieve their goals, we are careful to manage our volume:value balance in order to ensure that the most value possible is created for both parties, and the consumer is satisfied.
While the entry of a number of international clothing retailers is unlikely to have any material effect on our apparel business, there is some disruption to the general apparel market with substantially increased offerings and very little growth in the consumer’s spending power.
We invested heavily in efficiency, capacity and retail initiatives during the period. Our investments over the last few years have been an important factor in our ability to generate profitable, growing returns for shareholders and we will continue to invest to the extent that there are opportunities to responsibly drive efficiencies, improvements in quality and cost savings.
We were once again able to reduce our disabling injury frequency rate, from 0,80 to 0,60. Safety is a critical focus area and significant effort is applied to analysing areas of better and worse performance, to understanding opportunities for improvement and to applying appropriate interventions and monitoring the results thereof. Tragically, two of our van assistants lost their lives in an accident this year, following the loss of control of a vehicle by a driver on a scheduled delivery. Our condolences go to their families.
Share options under the Company’s Black Staff Empowerment Share Scheme vested during the year. Approximately 3 090 employees have benefited as participants and have received a total gross benefit of R185,9 million.
We elected to be rated for BBBEE purposes in terms of the new codes. This had the effect of reducing our rating from a level 4 to a level 8. The rating was computed as a level 7, however, we fell below the minimum points requirement for “supplier development” and the rating was discounted by one level to a level 8. We are committed to transformation and will continue to work to improve the extent of transformation in the Group and to positively impact the environments we operate in.
OV
ER
VIE
WB
USIN
ESS R
EV
IEW
GO
VE
RN
AN
CE
AN
NU
AL FIN
AN
CIA
L STATE
ME
NTS
SHA
RE
HO
LDE
R IN
FOR
MA
TION
8
CHAIRMAN and CEO’S REVIEW continued
I&J, new store openings and refurbishments of existing stores, and ongoing expenditure on backup power generation.
A benefit of the significant levels of capital expenditure over recent years is that our project management skills are effective and the majority of projects were delivered on time and on budget.
Progress on Green Cross since its acquisition has been slower than expected, however, the investments made in the factory and in-store refurbishments are bearing fruit. The new store formats and the improved range have proven very popular with customers and we expect further growth.
We will replace equipment as appropriate and will continue to identify opportunities in the businesses to drive efficiencies, savings and quality improvements through capital expenditure. Where acquisitions that are relevant to the Group and meet our investment criteria become available we will take advantage of them, however, in their absence we will target growth through investment in our existing facilities and brands.
Our project pipeline is strong and we look forward to another busy year.
Corporate governanceAVI’s Board is committed to ensuring that our success is achieved with a clear recognition of the different relationships the Company has with its stakeholders, including the need for returns to be generated in a sustainable manner. Our efforts in this regard are set out in the detailed sustainable development section of this report.
The recommendations of the King Report (“King III”) have been integrated into our Board and sub-committee charters, as have the requirements of the Companies Act. The corporate governance section of this report sets out our approach to corporate governance and our compliance with King III.
BoardThere were no changes to the Board during the financial year.
Our thanks go to our colleagues for their support and counsel.
SIMON CRUTCHLEY Chief Executive Officer
9
business has largely been stemmed. Our International business is achieving good revenue growth and continues to focus on growing profitable, branded market positions supported by our South African manufacturing capability.
We have invested approximately R45 million over the last few years to install backup power capabilities at most of our manufacturing sites and retail doors, with further mitigation in progress. Consequently the irregular power supply during the year did not have a material impact on our results, however, prolonged and severe load shedding or major power outages could result in significantly higher operating costs and lost sales. Changes to labour legislation have not had a material impact on results for the year ended 30 June 2015 as they became effective late in the year, but will be more material in the next year, putting further pressure on costs and profit margins. We continue to invest in improvements in manufacturing capability and procurement activity to ameliorate these pressures.
Despite our expectations of a difficult year, we are confident that we have the brands and people to weather the difficult trading environment. We will pursue growth opportunities from our existing portfolio while remaining vigilant for brand acquisition opportunities both domestically and regionally.
AcknowledgementsThe commitment, passion and energy of our people is crucial to our success. We thank all of our staff for their service during the year and their preparedness to go the extra mile. In addition, the partnership and contribution of all of our consumers, our customers, suppliers and service providers, as well as the support of our shareholders, is acknowledged and appreciated.
Gavin Tipper
Chairman
Simon Crutchley
Chief Executive Officer
Outlook2015 was a difficult year for the South African economy and our expectation for 2016 is worse. The South African economy is experiencing a combination of inflation, the rate of which is likely to increase as a result of the weaker Rand and high levels of administered inflation, and very low growth. Although the Reserve Bank has applied its monetary policy consistently and transparently, a continuation of the current policy is unlikely to address the fast approaching stagflationary bind. We have a National Development Plan that contains many of the elements necessary to address the chronic levels of unemployment, tepid growth and other challenges we face, however, this needs effective implementation.
As a responsible South African business we contribute to the greater environment in which we operate and recognise the importance of business working with government to address the issues we face. We hope that business will have that opportunity.
We expect the current constrained consumer demand environment to persist with the risk that category growth rates are likely to be muted, and in some cases declining volumes are a possibility. The weaker Rand will put additional pressure on input costs and selling prices will need to be adjusted to preserve gross margins, with the risk that the higher prices may further dampen demand.
Any significant further weakening of the Rand will be difficult to offset through price increases with the risk that gross profit margins may decline in the short term. I&J will introduce two additional vessels into its fishing fleet in the next few months, which will increase its catching capacity and the proportion of higher margin products. However, if the lower catch rates experienced in the last few months persist for the remainder of the year, they will have a material impact on cost efficiency and sales volumes, and will also limit I&J’s ability to benefit from the weaker Rand on its exports. Entyce and Snackworks have well established capabilities to defend market share and profit margins, and will grow sales volumes where there is opportunity. Indigo is maintaining its strong aerosol and colour cosmetics positions and is performing well in export markets. Spitz, Kurt Geiger and Green Cross retail stores will benefit from refurbishments and measured space growth, and the decline in the Green Cross wholesale
OV
ER
VIE
WB
USIN
ESS R
EV
IEW
GO
VE
RN
AN
CE
AN
NU
AL FIN
AN
CIA
L STATE
ME
NTS
SHA
RE
HO
LDE
R IN
FOR
MA
TION
10
OPERATIONAL REVIEWS
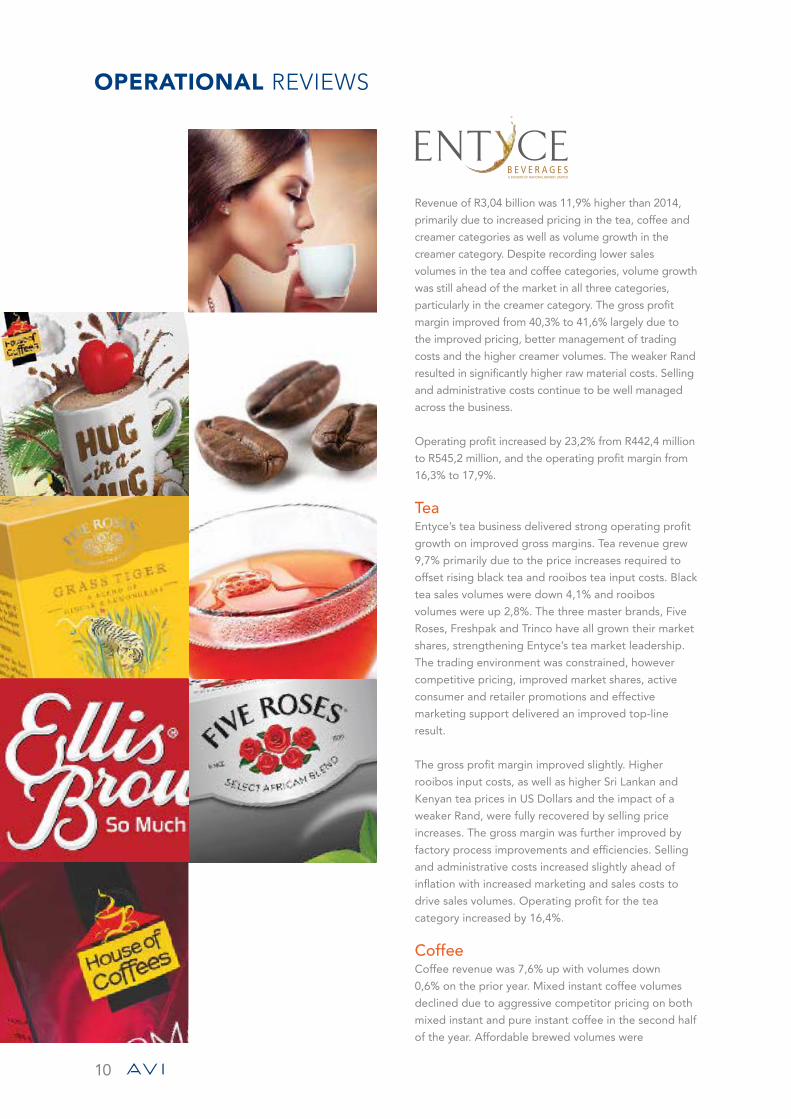
Revenue of R3,04 billion was 11,9% higher than 2014,
primarily due to increased pricing in the tea, coffee and
creamer categories as well as volume growth in the
creamer category. Despite recording lower sales
volumes in the tea and coffee categories, volume growth
was still ahead of the market in all three categories,
particularly in the creamer category. The gross profit
margin improved from 40,3% to 41,6% largely due to
the improved pricing, better management of trading
costs and the higher creamer volumes. The weaker Rand
resulted in significantly higher raw material costs. Selling
and administrative costs continue to be well managed
across the business.
Operating profit increased by 23,2% from R442,4 million
to R545,2 million, and the operating profit margin from
16,3% to 17,9%.
TeaEntyce’s tea business delivered strong operating profit
growth on improved gross margins. Tea revenue grew
9,7% primarily due to the price increases required to
offset rising black tea and rooibos tea input costs. Black
tea sales volumes were down 4,1% and rooibos
volumes were up 2,8%. The three master brands, Five
Roses, Freshpak and Trinco have all grown their market
shares, strengthening Entyce’s tea market leadership.
The trading environment was constrained, however
competitive pricing, improved market shares, active
consumer and retailer promotions and effective
marketing support delivered an improved top-line
result.
The gross profit margin improved slightly. Higher
rooibos input costs, as well as higher Sri Lankan and
Kenyan tea prices in US Dollars and the impact of a
weaker Rand, were fully recovered by selling price
increases. The gross margin was further improved by
factory process improvements and efficiencies. Selling
and administrative costs increased slightly ahead of
inflation with increased marketing and sales costs to
drive sales volumes. Operating profit for the tea
category increased by 16,4%.
CoffeeCoffee revenue was 7,6% up with volumes down
0,6% on the prior year. Mixed instant coffee volumes
declined due to aggressive competitor pricing on both
mixed instant and pure instant coffee in the second half
of the year. Affordable brewed volumes were
11
constrained as consumers continue to switch to more
convenient coffee offerings when they can afford to.
The premium roast and ground coffee category
volumes were buoyed by the successful launch of Hug
in a Mug, a speciality coffee in a convenient format.
From an input cost perspective, the Rand cost of all raw
material inputs was higher than in the prior year due to
material weakening of the Rand, notwithstanding lower
robusta and arabica coffee bean prices in US Dollar
terms.
Gross profit margins were favourably impacted by
selling price increases and factory process
improvements and efficiencies. Selling and
administrative costs increased slightly ahead of
inflation, primarily a function of higher sales and
distribution costs. Operating profit increased by 20,1%.
Creamer Creamer revenue rose by 23,8% due to volume growth
of 7,7%, price increases required to offset rising input
costs and better management of discounts. The Ellis
Brown brand grew its market share.
The gross profit margin was positively impacted by the
higher realised selling prices, higher sales volumes and
factory efficiencies, but unfavourably impacted by the
devaluation of the Rand. Selling and administrative
costs were well controlled but increased ahead of
inflation as a consequence of the higher sales volumes.
Operating profit increased by 61,0%.
Investment in creamer manufacturing capability
continued apace in 2015, with improvements to the
creamer mixing processes and the construction of
a third creamer spray drying tower, which was
commissioned in August 2015. The major creamer
processing capital expenditure has now been
completed and this business is well positioned to
benefit from volume growth in future years.
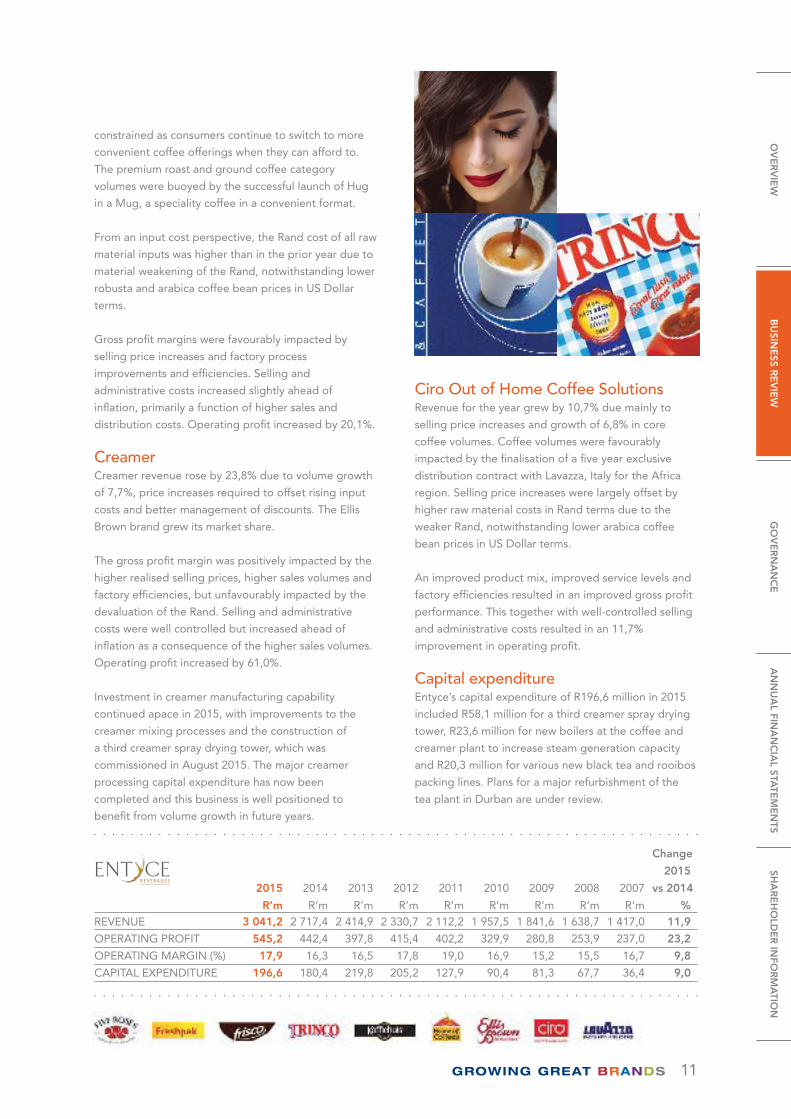
Ciro Out of Home Coffee SolutionsRevenue for the year grew by 10,7% due mainly to
selling price increases and growth of 6,8% in core
coffee volumes. Coffee volumes were favourably
impacted by the finalisation of a five year exclusive
distribution contract with Lavazza, Italy for the Africa
region. Selling price increases were largely offset by
higher raw material costs in Rand terms due to the
weaker Rand, notwithstanding lower arabica coffee
bean prices in US Dollar terms.
An improved product mix, improved service levels and
factory efficiencies resulted in an improved gross profit
performance. This together with well-controlled selling
and administrative costs resulted in an 11,7%
improvement in operating profit.
Capital expenditureEntyce’s capital expenditure of R196,6 million in 2015
included R58,1 million for a third creamer spray drying
tower, R23,6 million for new boilers at the coffee and
creamer plant to increase steam generation capacity
and R20,3 million for various new black tea and rooibos
packing lines. Plans for a major refurbishment of the
tea plant in Durban are under review.
2015
R’m
2014
R’m
2013
R’m
2012
R’m
2011
R’m
2010
R’m
2009
R’m
2008
R’m
2007
R’m
Change
2015
vs 2014
%REVENUE 3 041,2 2 717,4 2 414,9 2 330,7 2 112,2 1 957,5 1 841,6 1 638,7 1 417,0 11,9
OPERATING PROFIT 545,2 442,4 397,8 415,4 402,2 329,9 280,8 253,9 237,0 23,2
OPERATING MARGIN (%) 17,9 16,3 16,5 17,8 19,0 16,9 15,2 15,5 16,7 9,8
CAPITAL EXPENDITURE 196,6 180,4 219,8 205,2 127,9 90,4 81,3 67,7 36,4 9,0
OV
ER
VIE
WB
USIN
ESS R
EV
IEW
GO
VE
RN
AN
CE
AN
NU
AL FIN
AN
CIA
L STATE
ME
NTS
SHA
RE
HO
LDE
R IN
FOR
MA
TION

12
OPERATIONAL REVIEWS continued
Revenue of R3,41 billion was 11,4% higher than last
year mainly as a result of good growth in biscuit
revenue due to higher selling prices with lower growth
achieved in the snacks business. The gross profit
margin improved from 40,4% last year to 41,5% due
to better profitability in the Biscuit business
commensurate with higher selling prices and sales
volumes. Operating profit rose 12,4% from
R474,5 million to R533,4 million and the operating
profit margin increased from 15,5% to 15,7%.
BiscuitsBiscuit revenue grew 13,3% due to higher selling prices
supported by a 2,4% increase in sales volumes. The
introduction of new flavours and pack formats has
continued to drive overall growth, notwithstanding the
impact of selling price increases taken to recover
increasing raw material costs. In particular, the launch
of the Bakers Good Morning Breakfast Biscuit delivered
good volumes in the second semester.
Gross profit benefited from higher selling prices and
savings from procurement initiatives, with some margin
expansion notwithstanding rising input costs, caused
by the weakening of the Rand against major currencies.
Selling and administrative costs were well controlled
despite growing ahead of inflation due to increased
marketing investment in support of the Bakers
Masterbrand. Overall the Biscuit category had a very
successful year with operating profit increasing 17,1%
and further improvement in the operating profit
margin.
Snacks Snacks revenue increased 5,2% with the benefit of
higher pricing partly offset by lower sales volumes.
Gross profit margin declined with selling price increases
constrained by aggressive competitor pricing and not
fully recovering the impact of higher raw material input
costs. Costs were well controlled, however lower
profitability and the deleveraging impact of lower
volumes resulted in an operating profit decline for
the year.

13
2015
R’m
2014
R’m
2013
R’m
2012
R’m
2011
R’m
2010
R’m
2009
R’m
2008
R’m
2007
R’m
Change
2015
vs 2014
%REVENUE 3 405,3 3 057,9 2 681,6 2 428,7 2 159,7 2 080,9 2 036,8 1 677,2 1 394,2 11,4
OPERATING PROFIT 533,4 474,5 387,9 328,5 263,9 232,8 192,5 185,8 156,8 12,4
OPERATING MARGIN (%) 15,7 15,5 14,5 13,5 12,2 11,2 9,5 11,1 11,2 1,3
CAPITAL EXPENDITURE 225,1 76,1 143,9 171,8 117,6 46,6 44,8 58,3 47,3 195,8
Capital expenditureSnackworks’ capital expenditure of R225,1 million in
2015 was mainly invested in capacity and efficiency
improvement projects at both biscuit factories with
R89,7 million spent across the Isando and Westmead
sites. The Pioneer biscuit lines in Clayville were
acquired in May 2015 for a consideration of
approximately R65,0 million. These assets are in the
process of being integrated into our existing facilities
and are expected to deliver much needed capacity
during the next financial year.
R29 million was spent upgrading process and
packaging equipment at the Rosslyn snacks factory.
This project will be completed during the 2016 financial
year with benefits expected in capacity and product
quality.
OV
ER
VIE
WB
USIN
ESS R
EV
IEW
GO
VE
RN
AN
CE
AN
NU
AL FIN
AN
CIA
L STATE
ME
NTS
SHA
RE
HO
LDE
R IN
FOR
MA
TION
14
2015
R’m
2014
R’m
2013
R’m
2012
R’m
2011
R’m
2010
R’m
2009
R’m
2008
R’m
2007
R’m
Change
2015
vs 2014
%REVENUE 1 960,5 1 823,1 1 591,9 1 515,4 1 369,3 1 381,8 1 597,5 1 476,8 1 427,2 7,5
OPERATING PROFIT 248,4 244,6 165,8 178,6 92,1 74,3 237,9 160,4 112,9 1,6
OPERATING MARGIN (%) 12,7 13,4 10,4 11,8 6,7 5,4 14,9 10,9 7,9 (5,2)
CAPITAL EXPENDITURE 212,5 183,7 112,9 67,1 40,9 42,7 65,5 27,1 35,0 15,7
OPERATIONAL REVIEWS continued
Revenue increased by 7,5% from R1,82 billion to R1,96 billion due to the benefit of the weaker Rand on export sales and selling price increases both domestically and internationally, partly offset by a 2,3% reduction in sales volumes. Marginal foreign currency price increases were achieved on the export market, while price increases were taken domestically to maintain margin, albeit at the cost of volume decline. Fishing catch rates in the second half of the year were inconsistent and on average lower than in the first half and the prior year, particularly on the freezer vessels. This resulted in a decrease in international sales volumes, where the majority of product from the freezer vessels is sold.
The gross profit margin was consistent with the prior year, with the benefit of currency, selling price increases, and improved production efficiency offset by lower catch rates and cost inflation. Selling and administrative expenses were well managed, but increased ahead of inflation as a result of currency losses compared to gains in the prior year, resulting from currency movements over the year. Operating profit increased from R244,6 million to R248,4 million, while the operating profit margin decreased from 13,4% to 12,7%.
As I&J’s hake quota is allocated for calendar years, there is still an opportunity to catch, process and sell the uncaught portion of the 2015 quota allocation in the period from July to December 2015.
Simplot joint venture In addition to the operating profit reflected above, I&J’s joint ventures yielded equity earnings of R9,5 million compared to R28,5 million last year. These earnings primarily relate to the joint venture with Simplot (Australia) Proprietary Limited where earnings declined due to a poor trading performance, most notably as a result of falling prawn prices, combined with once-off restructure costs incurred at the Kelso production facility in an effort to reduce production costs and increase competitiveness.
Capital expenditureCapital expenditure of R212,5 million included payments of R100,9 million towards the new deep-sea fishing trawler being built in Spain, and the used freezer factory ship from Norway. The freezer factory ship arrived in Cape Town in August 2015, and is being refitted for local fishing before commencing operations. Delivery of the new deep-sea trawler is expected in September 2015.
Remaining capital expenditure was focused on maintenance of the existing fleet of vessels and the processing facilities, as well as enhancements to improve product quality.
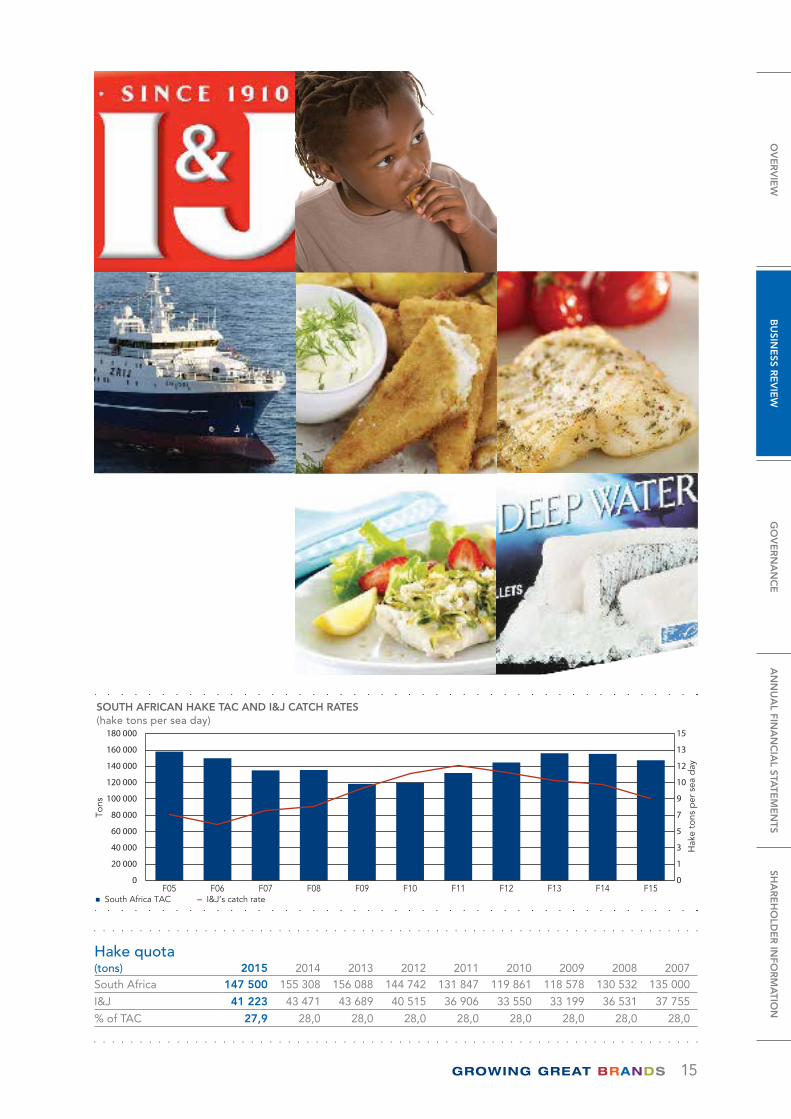
RSA hake resource Following four consecutive years of increases in the South African hake total allowable catch (“TAC”), cumulatively amounting to a 31,6% increase since the low point in 2009, 2014 saw a marginal decline of 0,5% in the TAC, followed by a further 5% decline in 2015. I&J’s quota allocation has remained constant resulting in a decrease from 43 471 tons to 41 223 tons. The RSA hake quota for calendar years 2007 to 2015 is summarised in the table below.
The changes in TAC are in accordance with a well established management programme based on research voyages and catch data recorded by quota holders. During 2015 the Marine Stewardship Council (“MSC”) recertified that the South African hake resources met the requisite environmental standards for sustainable fishing for a further five years, which will be due for review again in 2020. This certification gives assurance to buyers and consumers that the seafood comes from a well-managed and sustainable resource, which is increasingly relevant in I&J’s export markets. The South African Deep-Sea Trawling Association will continue to work closely with the Department of Agriculture, Forestry and Fisheries (“DAFF”) to maintain a sustainable fishery into the future, including activities such as research voyages, the onboard observer programme and effective patrolling of the fishery.
15
Hake quota(tons) 2015 2014 2013 2012 2011 2010 2009 2008 2007South Africa 147 500 155 308 156 088 144 742 131 847 119 861 118 578 130 532 135 000
I&J 41 223 43 471 43 689 40 515 36 906 33 550 33 199 36 531 37 755
% of TAC 27,9 28,0 28,0 28,0 28,0 28,0 28,0 28,0 28,0
0
20 000
40 000
60 000
80 000
100 000
120 000
140 000
160 000
180 000
0
1
3
5
7
9
10
12
13
15
SOUTH AFRICAN HAKE TAC AND I&J CATCH RATES(hake tons per sea day)
F05 F06 F07 F08 F09 F10 F11 F12 F13 F14 F15
Tons
Hak
e to
ns p
er s
ea d
ay
South Africa TAC I&J’s catch rate
OV
ER
VIE
WB
USIN
ESS R
EV
IEW
GO
VE
RN
AN
CE
AN
NU
AL FIN
AN
CIA
L STATE
ME
NTS
SHA
RE
HO
LDE
R IN
FOR
MA
TION

16
2015
R’m
2014
R’m
2013
R’m
2012
R’m
2011
R’m
2010
R’m
2009
R’m
2008
R’m
2007
R’m
Change
2015
vs 2014
%REVENUE 2 829,2 2 659,3 2 518,2 2 005,2 1 842,6 1 583,7 1 400,6 1 253,3 1 058,1 6,4Indigo 1 033,0 1 043,8 982,1 918,1 890,3 802,8 730,2 623,5 555,9 (1,0)Spitz 1 409,6 1 264,4 1 170,4 1 044,3 900,5 732,2 629,9 601,5 502,2 13,1Green Cross 336,0 326,5 327,5 – – – – – – 2,9Other 50,6 42,6 38,2 42,8 51,8 48,7 40,5 28,3 – 18,8OPERATING PROFIT 602,2 560,1 576,9 463,6 368,5 255,4 196,2 206,3 208,4 7,5Indigo 198,0 172,0 167,1 155,7 132,4 104,7 94,5 73,4 63,3 15,1Spitz 355,7 322,6 326,4 304,6 238,6 157,8 114,2 139,0 145,1 10,3Green Cross 45,0 58,8 79,9 – – – – – – (23,5)Other 3,5 6,7 3,5 3,3 (2,5) (7,1) (12,5) (6,1) – (47,8)OPERATING MARGIN (%) 21,3 21,1 22,9 23,1 20,0 16,1 14,0 16,5 19,7 0,9Indigo 19,2 16,5 17,0 17,0 14,9 13,0 12,9 11,8 11,4 16,3Spitz 25,2 25,9 27,9 29,2 26,5 21,6 18,1 23,1 28,9 (2,5)Green Cross 13,4 18,0 24,4 – – – – – – (25,6)Other 6,9 15,7 9,2 7,7 (4,8) (14,6) (30,9) (21,6) 0,0 (56,0)CAPITAL EXPENDITURE 108,3 88,5 80,3 85,7 113,3 138,6 49,4 89,3 55,0 22,4Indigo 19,4 24,5 31,5 35,0 71,5 127,2 26,8 24,9 17,3 (20,8)Spitz 46,9 32,6 44,0 49,3 41,6 11,2 21,1 55,3 37,7 43,9Green Cross 39,1 31,2 3,5 – – – – – – 25,2Other 2,9 0,2 1,3 1,4 0,2 0,2 1,5 9,1 – 1 350,0
Fashion brands
OPERATIONAL REVIEWS continued
17
2015
R’m
2014
R’m
2013
R’m
2012
R’m
2011
R’m
2010
R’m
2009
R’m
2008
R’m
2007
R’m
Change
2015
vs 2014
%REVENUE 1 033,0 1 043,8 982,1 918,1 890,3 802,8 730,2 623,5 555,9 (1,0)
OPERATING PROFIT 198,0 172,0 167,1 155,7 132,4 104,7 94,5 73,4 63,3 15,1
OPERATING MARGIN (%) 19,2 16,5 17,0 17,0 14,9 13,0 12,9 11,8 11,4 16,4
CAPITAL EXPENDITURE 19,4 24,5 31,5 35,0 71,5 127,2 26,8 24,9 17,3 (20,8)
In the Personal Care category, Indigo’s revenue from
owned brands grew by 10,6% due to price increases
and volume growth of 2,7%, although total revenue
declined from November 2013 following the
commencement of new trading terms with Coty.
Aerosol volumes were sound despite the competitive
environment; colour cosmetics continued to perform
well and were supported by growth in body lotions
and roll-ons.
Selling and administrative expenses were well controlled
and operating profit grew 15,1% from R172,0 million to
R198,0 million. The operating profit margin increased
from 16,5% to 19,2%, partly because of the revised Coty
trading terms which result in lower revenue but achieve
the same level of operating profit.
Capital expenditureCapital expenditure of R19,4 million included the
routine replacement of colour cosmetic in-store
merchandising units and manufacturing equipment.
OV
ER
VIE
WB
USIN
ESS R
EV
IEW
GO
VE
RN
AN
CE
AN
NU
AL FIN
AN
CIA
L STATE
ME
NTS
SHA
RE
HO
LDE
R IN
FOR
MA
TION
18
OPERATIONAL REVIEWS continued
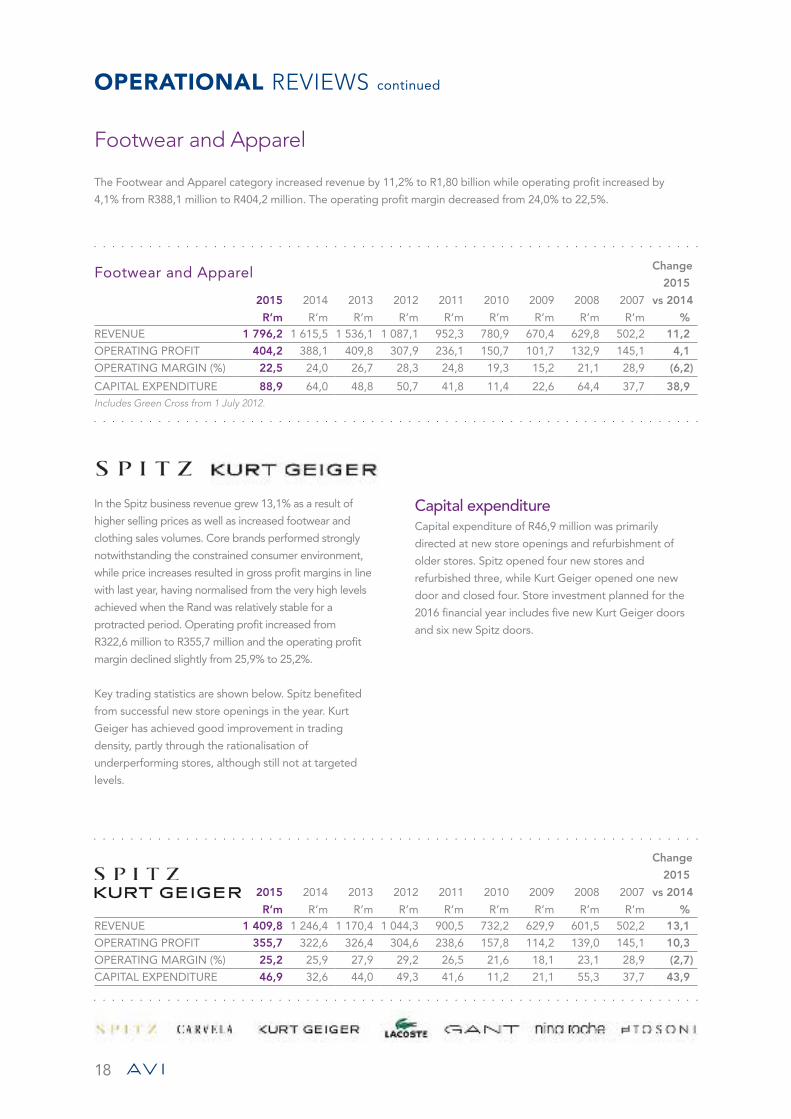
Footwear and Apparel
The Footwear and Apparel category increased revenue by 11,2% to R1,80 billion while operating profit increased by
4,1% from R388,1 million to R404,2 million. The operating profit margin decreased from 24,0% to 22,5%.
2015
R’m
2014
R’m
2013
R’m
2012
R’m
2011
R’m
2010
R’m
2009
R’m
2008
R’m
2007
R’m
Change
2015
vs 2014
%REVENUE 1 409,8 1 246,4 1 170,4 1 044,3 900,5 732,2 629,9 601,5 502,2 13,1
OPERATING PROFIT 355,7 322,6 326,4 304,6 238,6 157,8 114,2 139,0 145,1 10,3
OPERATING MARGIN (%) 25,2 25,9 27,9 29,2 26,5 21,6 18,1 23,1 28,9 (2,7)
CAPITAL EXPENDITURE 46,9 32,6 44,0 49,3 41,6 11,2 21,1 55,3 37,7 43,9
In the Spitz business revenue grew 13,1% as a result of
higher selling prices as well as increased footwear and
clothing sales volumes. Core brands performed strongly
notwithstanding the constrained consumer environment,
while price increases resulted in gross profit margins in line
with last year, having normalised from the very high levels
achieved when the Rand was relatively stable for a
protracted period. Operating profit increased from
R322,6 million to R355,7 million and the operating profit
margin declined slightly from 25,9% to 25,2%.
Key trading statistics are shown below. Spitz benefited
from successful new store openings in the year. Kurt
Geiger has achieved good improvement in trading
density, partly through the rationalisation of
underperforming stores, although still not at targeted
levels.
Capital expenditureCapital expenditure of R46,9 million was primarily
directed at new store openings and refurbishment of
older stores. Spitz opened four new stores and
refurbished three, while Kurt Geiger opened one new
door and closed four. Store investment planned for the
2016 financial year includes five new Kurt Geiger doors
and six new Spitz doors.
2015
R’m
2014
R’m
2013
R’m
2012
R’m
2011
R’m
2010
R’m
2009
R’m
2008
R’m
2007
R’m
Change
2015
vs 2014
%REVENUE 1 796,2 1 615,5 1 536,1 1 087,1 952,3 780,9 670,4 629,8 502,2 11,2
OPERATING PROFIT 404,2 388,1 409,8 307,9 236,1 150,7 101,7 132,9 145,1 4,1
OPERATING MARGIN (%) 22,5 24,0 26,7 28,3 24,8 19,3 15,2 21,1 28,9 (6,2)
CAPITAL EXPENDITURE 88,9 64,0 48,8 50,7 41,8 11,4 22,6 64,4 37,7 38,9Includes Green Cross from 1 July 2012.
Footwear and Apparel
19
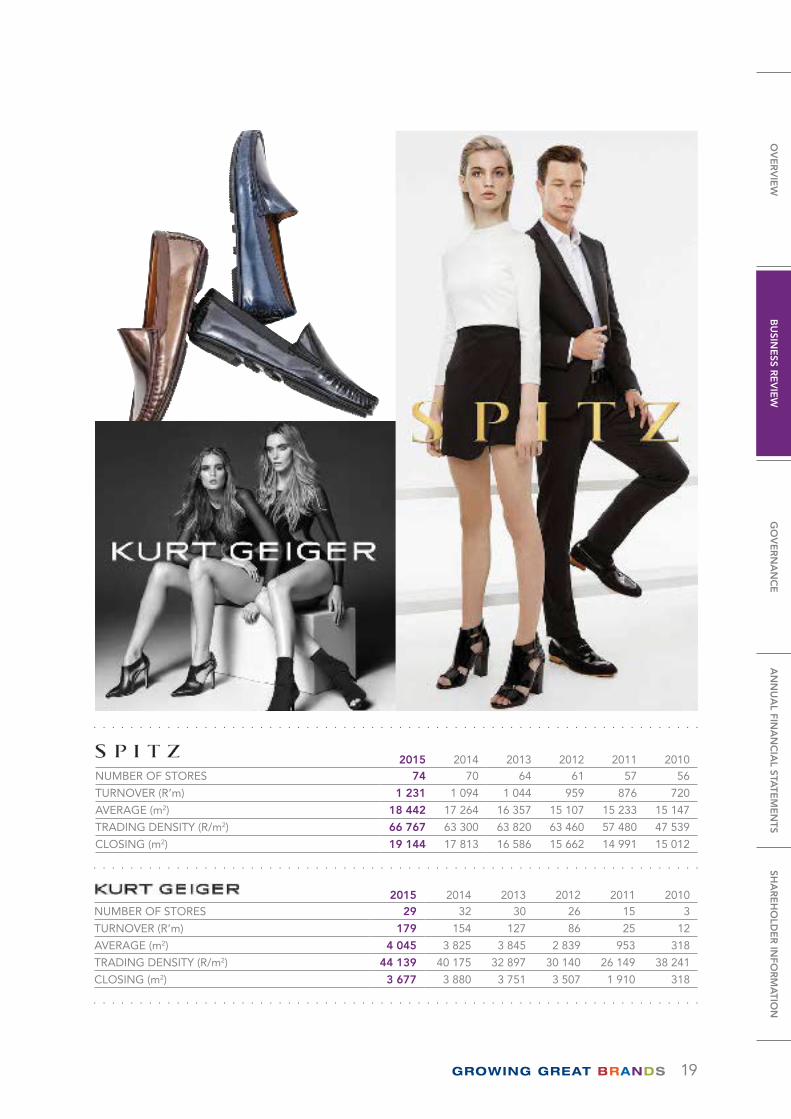
2015 2014 2013 2012 2011 2010NUMBER OF STORES 29 32 30 26 15 3
TURNOVER (R’m) 179 154 127 86 25 12
AVERAGE (m2) 4 045 3 825 3 845 2 839 953 318
TRADING DENSITY (R/m2) 44 139 40 175 32 897 30 140 26 149 38 241
CLOSING (m2) 3 677 3 880 3 751 3 507 1 910 318
2015 2014 2013 2012 2011 2010NUMBER OF STORES 74 70 64 61 57 56
TURNOVER (R’m) 1 231 1 094 1 044 959 876 720
AVERAGE (m2) 18 442 17 264 16 357 15 107 15 233 15 147
TRADING DENSITY (R/m2) 66 767 63 300 63 820 63 460 57 480 47 539
CLOSING (m2) 19 144 17 813 16 586 15 662 14 991 15 012
OV
ER
VIE
WB
USIN
ESS R
EV
IEW
GO
VE
RN
AN
CE
AN
NU
AL FIN
AN
CIA
L STATE
ME
NTS
SHA
RE
HO
LDE
R IN
FOR
MA
TION
20
OPERATIONAL REVIEWS continued
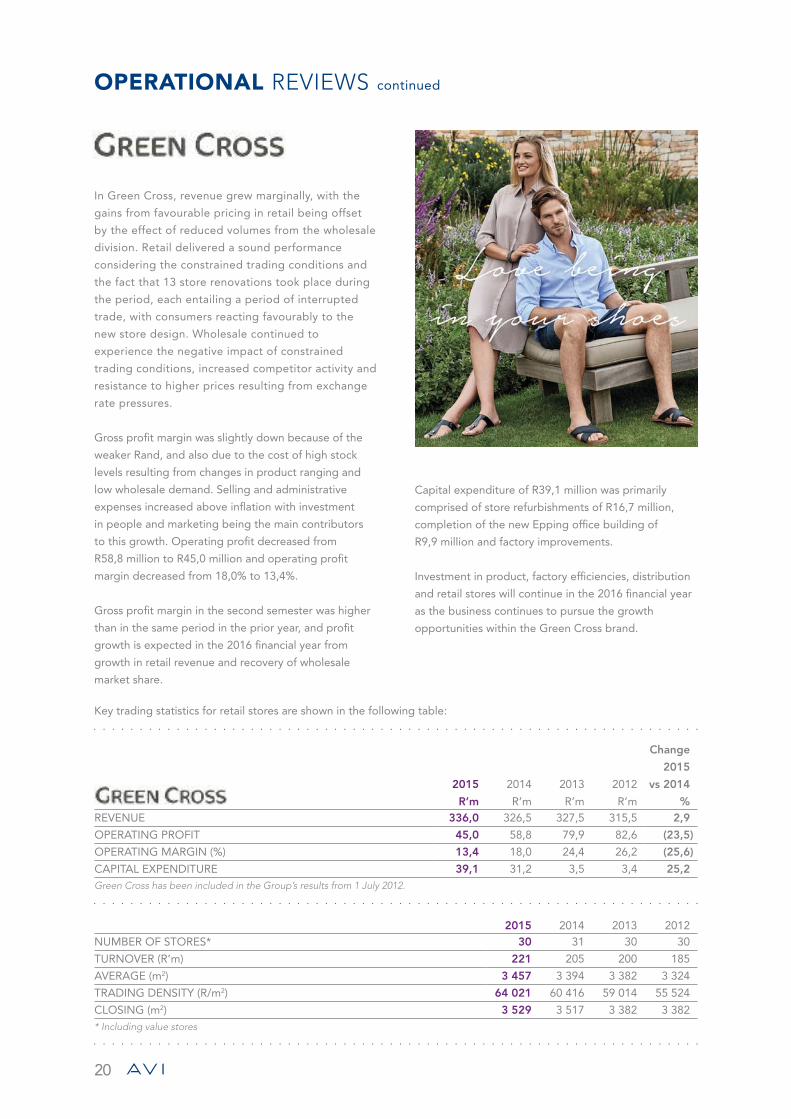
In Green Cross, revenue grew marginally, with the
gains from favourable pricing in retail being offset
by the effect of reduced volumes from the wholesale
division. Retail delivered a sound performance
considering the constrained trading conditions and
the fact that 13 store renovations took place during
the period, each entailing a period of interrupted
trade, with consumers reacting favourably to the
new store design. Wholesale continued to
experience the negative impact of constrained
trading conditions, increased competitor activity and
resistance to higher prices resulting from exchange
rate pressures.
Gross profit margin was slightly down because of the
weaker Rand, and also due to the cost of high stock
levels resulting from changes in product ranging and
low wholesale demand. Selling and administrative
expenses increased above inflation with investment
in people and marketing being the main contributors
to this growth. Operating profit decreased from
R58,8 million to R45,0 million and operating profit
margin decreased from 18,0% to 13,4%.
Gross profit margin in the second semester was higher
than in the same period in the prior year, and profit
growth is expected in the 2016 financial year from
growth in retail revenue and recovery of wholesale
market share.
2015 2014 2013 2012NUMBER OF STORES* 30 31 30 30
TURNOVER (R’m) 221 205 200 185
AVERAGE (m2) 3 457 3 394 3 382 3 324
TRADING DENSITY (R/m2) 64 021 60 416 59 014 55 524
CLOSING (m2) 3 529 3 517 3 382 3 382* Including value stores
2015
R’m
2014
R’m
2013
R’m
2012
R’m
Change
2015
vs 2014
%REVENUE 336,0 326,5 327,5 315,5 2,9
OPERATING PROFIT 45,0 58,8 79,9 82,6 (23,5)
OPERATING MARGIN (%) 13,4 18,0 24,4 26,2 (25,6)
CAPITAL EXPENDITURE 39,1 31,2 3,5 3,4 25,2Green Cross has been included in the Group’s results from 1 July 2012.
Key trading statistics for retail stores are shown in the following table:
Capital expenditure of R39,1 million was primarily
comprised of store refurbishments of R16,7 million,
completion of the new Epping office building of
R9,9 million and factory improvements.
Investment in product, factory efficiencies, distribution
and retail stores will continue in the 2016 financial year
as the business continues to pursue the growth
opportunities within the Green Cross brand.

21
OV
ER
VIE
WB
USIN
ESS R
EV
IEW
GO
VE
RN
AN
CE
AN
NU
AL FIN
AN
CIA
L STATE
ME
NTS
SHA
RE
HO
LDE
R IN
FOR
MA
TION
22
OPERATIONAL REVIEWS continued
The aggregated result of our business outside of South
Africa, excluding I&J’s export business, is summarised
below. The structure of the AVI International business
remained unaltered during the year, with subsidiary
operations in Botswana, Zambia and Namibia and the
balance of markets being serviced through a network
of third party distributors.
International revenue achieved for the year was
R879,6 million, with lower revenue growth than the prior
year at 14,4%, driven mainly by volume pressure. Pressure
arose due to macroeconomic challenges in Angola,
legislation changes restricting imports of biscuits into
Zimbabwe and drought conditions through most of the
year in Botswana pressurising consumption of tea.
However, improved servicing and wider distribution in
Mozambique, Zambia, Tanzania, Namibia and Mauritius
resulted in good growth being achieved across all product
categories. The strength of the Freshpak brand has also
successfully fended off increased competition and has
been the brand which has led the growth in the Tea
category. Biscuits and Tea remain the most significant
product categories in international markets. Simplification
of the Personal Care range and focus behind selected
brands with improved execution on shelf has resulted in
strong revenue growth for the category across all markets.
Increased tea packing capacity has been installed in
Botswana and Zambia during the year, with Botswana
successfully reintroducing Freshpak loose leaf tea to the
market, and Zambia increasing its production capacity on
market-specific loose leaf tea formats, enabling wider
distribution.
Subsequent to the establishment of our subsidiary in
Namibia, the need for a more efficient warehousing and
distribution model was addressed during the current
year. Our business model in Namibia was changed to
outsource these functions in order to achieve economies
of scale through using a distributor with significant other
principals. Our own sales force remains in place and has
made significant headway in driving revenue growth with
improved margin in the market through better discount
management and improved customer relationships.
Successful establishment of our brands and appointment
of suitable distributors are expected to drive strong
growth in Tanzania and Kenya in the future.
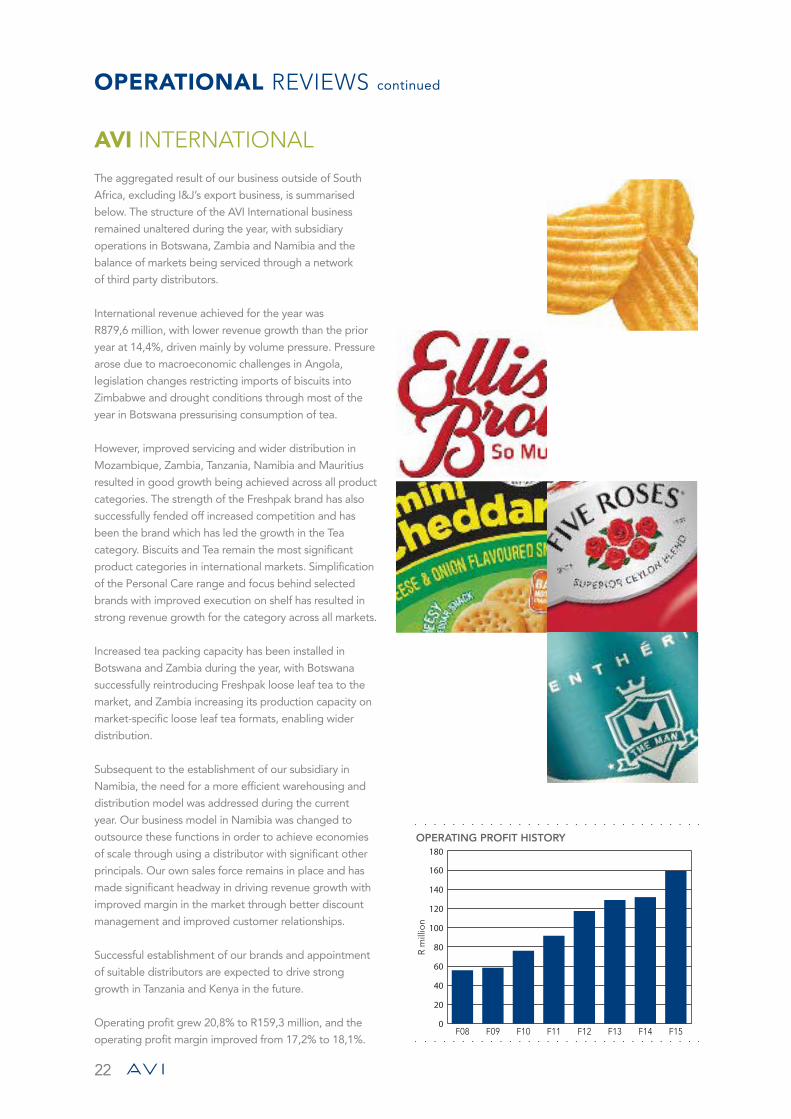
Operating profit grew 20,8% to R159,3 million, and the
operating profit margin improved from 17,2% to 18,1%.
AVI INTERNATIONAL
0
20
40
60
80
100
120
140
160
180OPERATING PROFIT HISTORY
F08 F10 F11 F13 F15F14F12F09
R m
illio
n

23
2015
R’m
2014
R’m
2013
R’m
2012
R’m
2011
R’m
2010
R’m
2009
R’m
2008
R’m
Change
2015
vs 2014
%REVENUE 879,6 769,0 639,4 557,5 497,8 446,1 392,9 315,5 14,4
OPERATING PROFIT 159,3 131,9 128,9 117,5 91,7 76,2 58,3 55,8 20,8
OPERATING MARGIN (%) 18,1 17,2 20,2 21,1 18,4 17,1 14,8 17,7 5,2This table is an aggregation of results included in Entyce Beverages, Snackworks and Indigo Brands.
AVI International
OV
ER
VIE
WB
USIN
ESS R
EV
IEW
GO
VE
RN
AN
CE
AN
NU
AL FIN
AN
CIA
L STATE
ME
NTS
SHA
RE
HO
LDE
R IN
FOR
MA
TION
24
FINANCIAL REVIEW
AVI’s results for the 12 months ended 30 June 2015 reflect a sound overall performance in a period of increasing pressure on consumer spending and rising input costs, stemming largely from the weaker Rand.
Revenue increased by 9,5%, from R10,27 billion to R11,24 billion, with the Group realising higher selling prices in all categories following significant accumulated cost pressure as a result of the weakening of the Rand over the last few years. In addition, volume growth was achieved in many of our categories and I&J’s export revenue benefited from the Rand weakness. Gross profit rose by 11,2% to R4,92 billion with the consolidated gross profit margin improving from 43,1% to 43,8%. Operating profit increased by 11,9%, from R1,71 billion to R1,92 billion with the growth in gross profit supported by good containment of selling and administrative expenses across the Group. The operating profit margin increased from 16,7% to 17,0%.
Entyce delivered a strong result for the year, recovering some of the profit margin given up in the tough trading conditions experienced over the last few years and achieving good volume growth in Creamer. Snackworks continued to perform well with volume growth in Biscuits and further improvements in profit margin. I&J benefited materially from the weaker Rand, supported by good processing efficiency, however, profit growth for the year was constrained by lower fishing catch rates in the second semester, which resulted in higher hake catch costs and constrained sales volumes. At Indigo, owned brands performed well in a competitive environment and the Coty profit contribution was preserved in the new relationship. Margins in the Footwear and Apparel businesses have stabilised and profit grew as a result of a strong performance from Spitz, with growth in both footwear and clothing volumes.
Headline earnings rose by 11,2%, from R1,20 billion to R1,34 billion with the growth in operating profit tempered by lower earnings from I&J’s joint venture with Simplot in Australia. Headline earnings per share increased 9,4% from 383,6 cents to 419,7 cents with a 1,6% increase in the weighted average number of shares in issue due to the vesting of employee share options, including the AVI Black Staff Empowerment Scheme.
Attributable earnings, including capital items, were 1,3% higher than those in last year, which included a capital payment of R150,0 million from Coty to Indigo on revision of the trading relationship between them.
Cash generated by operations before working capital changes increased 13,9% to R2,40 billion. Working capital rose R301,7 million, reflecting volume growth, strong trading at the end of the period and higher stock values from rising input costs. Capital expenditure of R848,9 million incorporated capacity and efficiency projects in the manufacturing operations and new and refurbished stores in the retail businesses. Other material cash outflows during the period were dividends of R1,63 billion and taxation of R487,5 million. Net debt at the end of June 2015 was R1,20 billion compared to R349,0 million at the end of June 2014.
25
Segmental review
Year ended 30 June
Segmental revenue Segmental operating profit
2015
R’m
2014
R’m
Change
%
2015
R’m
2014
R’m
Change
%
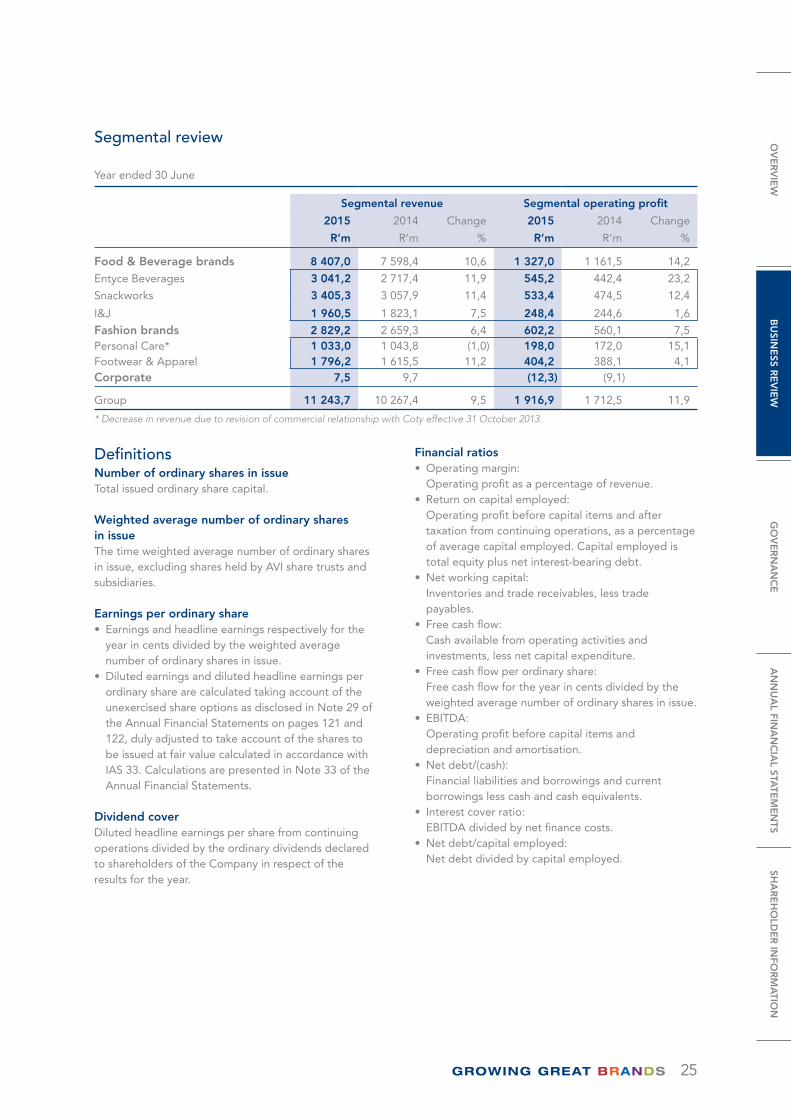
Food & Beverage brands 8 407,0 7 598,4 10,6 1 327,0 1 161,5 14,2
Entyce Beverages 3 041,2 2 717,4 11,9 545,2 442,4 23,2
Snackworks 3 405,3 3 057,9 11,4 533,4 474,5 12,4
I&J 1 960,5 1 823,1 7,5 248,4 244,6 1,6
Fashion brands 2 829,2 2 659,3 6,4 602,2 560,1 7,5Personal Care* 1 033,0 1 043,8 (1,0) 198,0 172,0 15,1Footwear & Apparel 1 796,2 1 615,5 11,2 404,2 388,1 4,1Corporate 7,5 9,7 (12,3) (9,1)
Group 11 243,7 10 267,4 9,5 1 916,9 1 712,5 11,9
* Decrease in revenue due to revision of commercial relationship with Coty effective 31 October 2013.
DefinitionsNumber of ordinary shares in issueTotal issued ordinary share capital.
Weighted average number of ordinary shares in issueThe time weighted average number of ordinary shares in issue, excluding shares held by AVI share trusts and subsidiaries.
Earnings per ordinary share• Earnings and headline earnings respectively for the
year in cents divided by the weighted average number of ordinary shares in issue.
• Diluted earnings and diluted headline earnings per ordinary share are calculated taking account of the unexercised share options as disclosed in Note 29 of the Annual Financial Statements on pages 121 and 122, duly adjusted to take account of the shares to be issued at fair value calculated in accordance with IAS 33. Calculations are presented in Note 33 of the Annual Financial Statements.
Dividend coverDiluted headline earnings per share from continuing operations divided by the ordinary dividends declared to shareholders of the Company in respect of the results for the year.
Financial ratios• Operating margin:
Operating profit as a percentage of revenue.• Return on capital employed:
Operating profit before capital items and after taxation from continuing operations, as a percentage of average capital employed. Capital employed is total equity plus net interest-bearing debt.
• Net working capital: Inventories and trade receivables, less trade payables.
• Free cash flow: Cash available from operating activities and investments, less net capital expenditure.
• Free cash flow per ordinary share: Free cash flow for the year in cents divided by the weighted average number of ordinary shares in issue.
• EBITDA: Operating profit before capital items and depreciation and amortisation.
• Net debt/(cash): Financial liabilities and borrowings and current borrowings less cash and cash equivalents.
• Interest cover ratio: EBITDA divided by net finance costs.
• Net debt/capital employed: Net debt divided by capital employed.
OV
ER
VIE
WB
USIN
ESS R
EV
IEW
GO
VE
RN
AN
CE
AN
NU
AL FIN
AN
CIA
L STATE
ME
NTS
SHA
RE
HO
LDE
R IN
FOR
MA
TION
26
FINANCIAL REVIEW continued
Key statistics for continuing operations
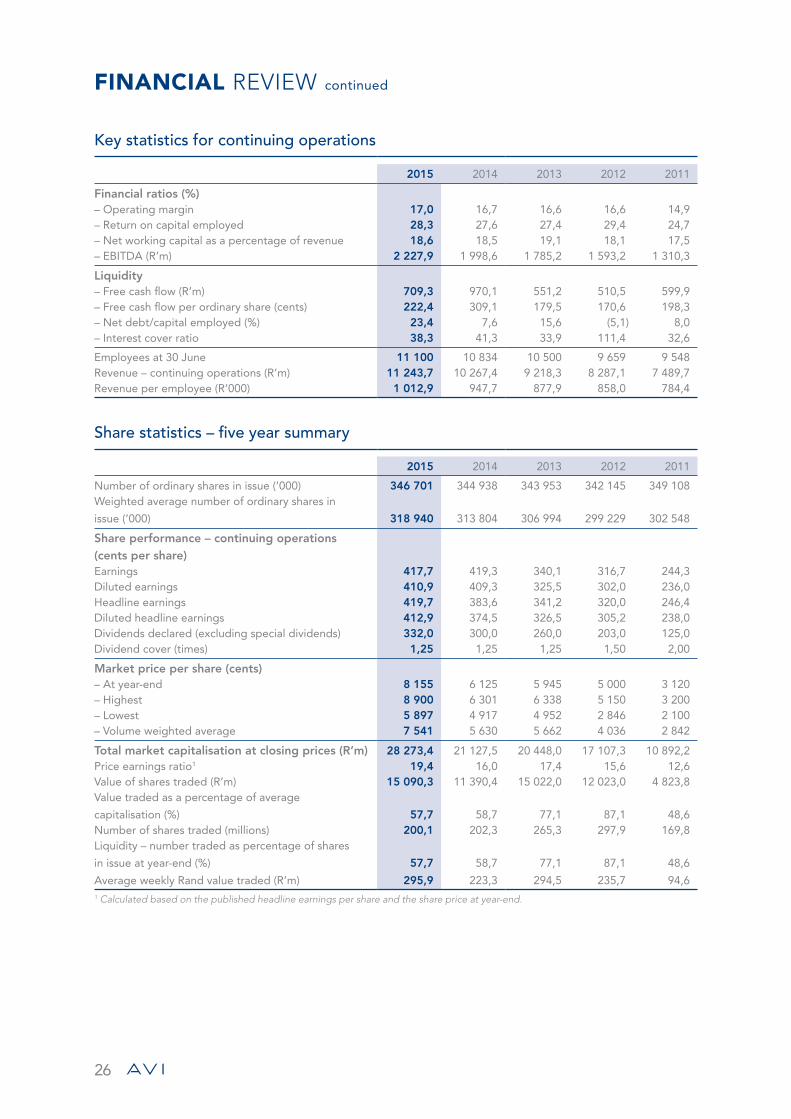
2015 2014 2013 2012 2011
Financial ratios (%)– Operating margin 17,0 16,7 16,6 16,6 14,9 – Return on capital employed 28,3 27,6 27,4 29,4 24,7 – Net working capital as a percentage of revenue 18,6 18,5 19,1 18,1 17,5 – EBITDA (R’m) 2 227,9 1 998,6 1 785,2 1 593,2 1 310,3
Liquidity– Free cash flow (R’m) 709,3 970,1 551,2 510,5 599,9 – Free cash flow per ordinary share (cents) 222,4 309,1 179,5 170,6 198,3 – Net debt/capital employed (%) 23,4 7,6 15,6 (5,1) 8,0 – Interest cover ratio 38,3 41,3 33,9 111,4 32,6
Employees at 30 June 11 100 10 834 10 500 9 659 9 548 Revenue – continuing operations (R’m) 11 243,7 10 267,4 9 218,3 8 287,1 7 489,7 Revenue per employee (R’000) 1 012,9 947,7 877,9 858,0 784,4
Share statistics – five year summary
2015 2014 2013 2012 2011
Number of ordinary shares in issue (’000) 346 701 344 938 343 953 342 145 349 108 Weighted average number of ordinary shares in
issue (’000) 318 940 313 804 306 994 299 229 302 548
Share performance – continuing operations (cents per share)Earnings 417,7 419,3 340,1 316,7 244,3 Diluted earnings 410,9 409,3 325,5 302,0 236,0 Headline earnings 419,7 383,6 341,2 320,0 246,4 Diluted headline earnings 412,9 374,5 326,5 305,2 238,0 Dividends declared (excluding special dividends) 332,0 300,0 260,0 203,0 125,0 Dividend cover (times) 1,25 1,25 1,25 1,50 2,00
Market price per share (cents)– At year-end 8 155 6 125 5 945 5 000 3 120 – Highest 8 900 6 301 6 338 5 150 3 200 – Lowest 5 897 4 917 4 952 2 846 2 100 – Volume weighted average 7 541 5 630 5 662 4 036 2 842
Total market capitalisation at closing prices (R’m) 28 273,4 21 127,5 20 448,0 17 107,3 10 892,2 Price earnings ratio1 19,4 16,0 17,4 15,6 12,6 Value of shares traded (R’m) 15 090,3 11 390,4 15 022,0 12 023,0 4 823,8 Value traded as a percentage of average
capitalisation (%) 57,7 58,7 77,1 87,1 48,6 Number of shares traded (millions) 200,1 202,3 265,3 297,9 169,8 Liquidity – number traded as percentage of shares
in issue at year-end (%) 57,7 58,7 77,1 87,1 48,6
Average weekly Rand value traded (R’m) 295,9 223,3 294,5 235,7 94,6 1 Calculated based on the published headline earnings per share and the share price at year-end.
27
Value added statement
2015 2014
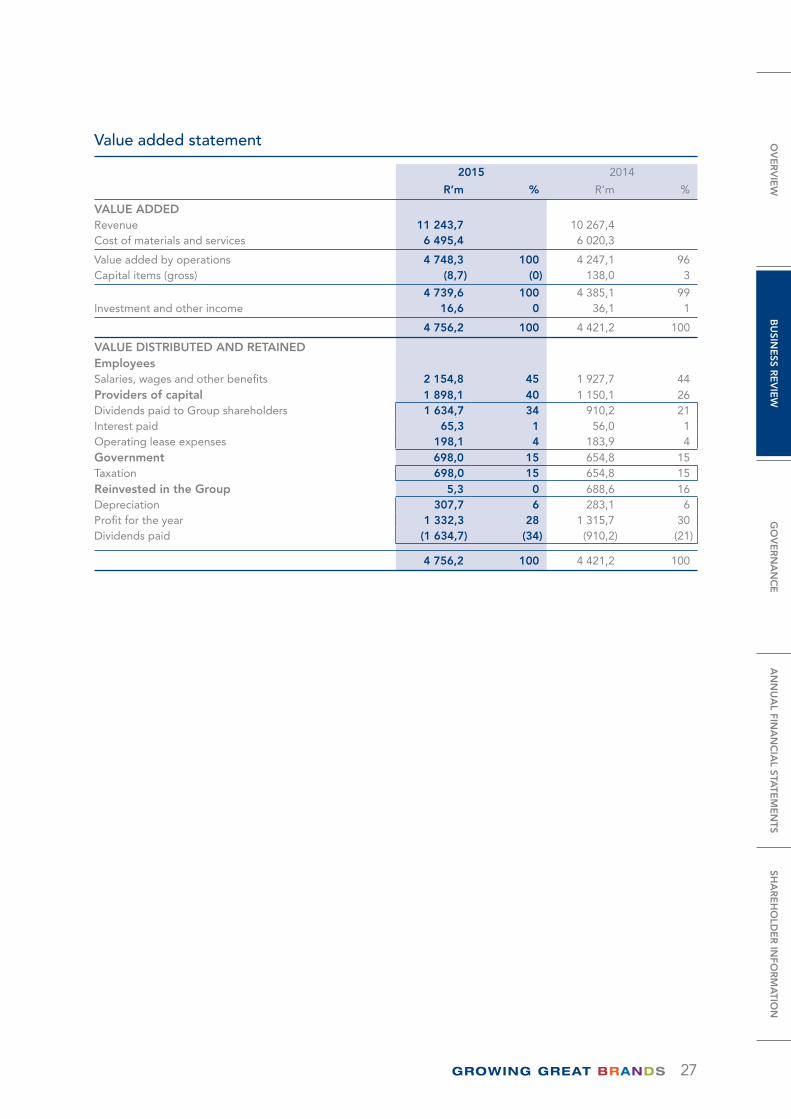
R’m % R’m %
VALUE ADDEDRevenue 11 243,7 10 267,4 Cost of materials and services 6 495,4 6 020,3
Value added by operations 4 748,3 100 4 247,1 96Capital items (gross) (8,7) (0) 138,0 3
4 739,6 100 4 385,1 99Investment and other income 16,6 0 36,1 1
4 756,2 100 4 421,2 100
VALUE DISTRIBUTED AND RETAINEDEmployeesSalaries, wages and other benefits 2 154,8 45 1 927,7 44Providers of capital 1 898,1 40 1 150,1 26Dividends paid to Group shareholders 1 634,7 34 910,2 21Interest paid 65,3 1 56,0 1Operating lease expenses 198,1 4 183,9 4Government 698,0 15 654,8 15Taxation 698,0 15 654,8 15Reinvested in the Group 5,3 0 688,6 16Depreciation 307,7 6 283,1 6Profit for the year 1 332,3 28 1 315,7 30Dividends paid (1 634,7) (34) (910,2) (21)
4 756,2 100 4 421,2 100
OV
ER
VIE
WB
USIN
ESS R
EV
IEW
GO
VE
RN
AN
CE
AN
NU
AL FIN
AN
CIA
L STATE
ME
NTS
SHA
RE
HO
LDE
R IN
FOR
MA
TION
28
FINANCIAL REVIEW continued
Group at a glance
2015
R’m
2014
R’m
2013
R’m
2012
R’m
2011
R’m
Change
2015 vs
2014
%
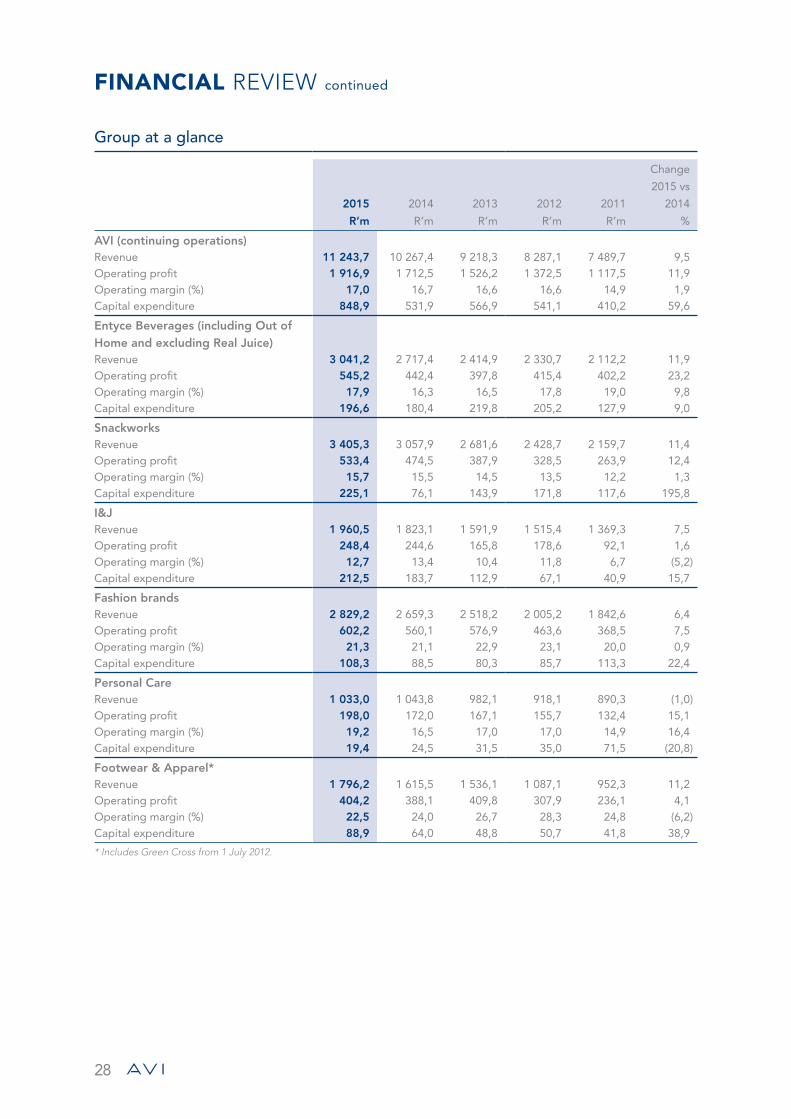
AVI (continuing operations)Revenue 11 243,7 10 267,4 9 218,3 8 287,1 7 489,7 9,5 Operating profit 1 916,9 1 712,5 1 526,2 1 372,5 1 117,5 11,9 Operating margin (%) 17,0 16,7 16,6 16,6 14,9 1,9 Capital expenditure 848,9 531,9 566,9 541,1 410,2 59,6
Entyce Beverages (including Out of Home and excluding Real Juice)Revenue 3 041,2 2 717,4 2 414,9 2 330,7 2 112,2 11,9 Operating profit 545,2 442,4 397,8 415,4 402,2 23,2 Operating margin (%) 17,9 16,3 16,5 17,8 19,0 9,8 Capital expenditure 196,6 180,4 219,8 205,2 127,9 9,0
SnackworksRevenue 3 405,3 3 057,9 2 681,6 2 428,7 2 159,7 11,4 Operating profit 533,4 474,5 387,9 328,5 263,9 12,4 Operating margin (%) 15,7 15,5 14,5 13,5 12,2 1,3 Capital expenditure 225,1 76,1 143,9 171,8 117,6 195,8
I&JRevenue 1 960,5 1 823,1 1 591,9 1 515,4 1 369,3 7,5 Operating profit 248,4 244,6 165,8 178,6 92,1 1,6 Operating margin (%) 12,7 13,4 10,4 11,8 6,7 (5,2)Capital expenditure 212,5 183,7 112,9 67,1 40,9 15,7
Fashion brandsRevenue 2 829,2 2 659,3 2 518,2 2 005,2 1 842,6 6,4 Operating profit 602,2 560,1 576,9 463,6 368,5 7,5 Operating margin (%) 21,3 21,1 22,9 23,1 20,0 0,9 Capital expenditure 108,3 88,5 80,3 85,7 113,3 22,4
Personal CareRevenue 1 033,0 1 043,8 982,1 918,1 890,3 (1,0)Operating profit 198,0 172,0 167,1 155,7 132,4 15,1 Operating margin (%) 19,2 16,5 17,0 17,0 14,9 16,4 Capital expenditure 19,4 24,5 31,5 35,0 71,5 (20,8)
Footwear & Apparel*Revenue 1 796,2 1 615,5 1 536,1 1 087,1 952,3 11,2 Operating profit 404,2 388,1 409,8 307,9 236,1 4,1 Operating margin (%) 22,5 24,0 26,7 28,3 24,8 (6,2)Capital expenditure 88,9 64,0 48,8 50,7 41,8 38,9
* Includes Green Cross from 1 July 2012.

29
2015
R’m
2014
R’m
2013
R’m
2012
R’m
2011
R’m
AVI (discontinued operations)Revenue – – 33,6 146,2 880,2 Operating profit – – 0,6 8,1 23,2 Operating margin (%) – – 1,8 5,6 2,6Capital expenditure – – – – 11,8
DennyRevenue – – – – 385,2 Operating profit – – – – 50,0 Operating margin (%) – – – – 13,0Capital expenditure – – – – 9,0
AlpescaRevenue – – – – 298,4 Operating loss – – – – (37,5)Operating margin (%) – – – – (12,6)Capital expenditure – – – – 0,3
Real Juice*Revenue – – 33,6 146,2 196,6 Operating profit – – 0,6 8,1 10,7 Operating margin (%) – – 1,8 5,6 5,4Capital expenditure – – – – 2,5
* 2013 includes Real Juice up to 1 October 2012.
OV
ER
VIE
WB
USIN
ESS R
EV
IEW
GO
VE
RN
AN
CE
AN
NU
AL FIN
AN
CIA
L STATE
ME
NTS
SHA
RE
HO
LDE
R IN
FOR
MA
TION
30
FINANCIAL REVIEW continued
Group balance sheets – five year summary
2015
R’m
2014
R’m
2013
R’m
2012
R’m
2011
R’m
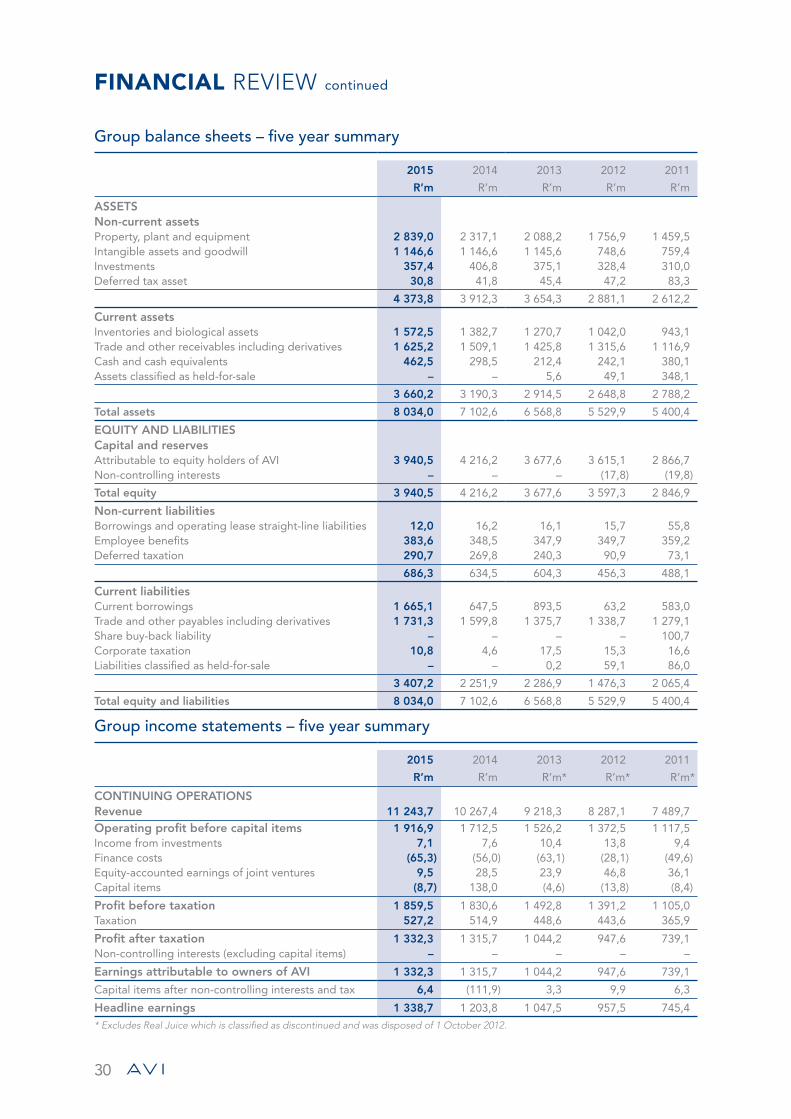
ASSETSNon-current assetsProperty, plant and equipment 2 839,0 2 317,1 2 088,2 1 756,9 1 459,5 Intangible assets and goodwill 1 146,6 1 146,6 1 145,6 748,6 759,4 Investments 357,4 406,8 375,1 328,4 310,0 Deferred tax asset 30,8 41,8 45,4 47,2 83,3
4 373,8 3 912,3 3 654,3 2 881,1 2 612,2
Current assetsInventories and biological assets 1 572,5 1 382,7 1 270,7 1 042,0 943,1 Trade and other receivables including derivatives 1 625,2 1 509,1 1 425,8 1 315,6 1 116,9 Cash and cash equivalents 462,5 298,5 212,4 242,1 380,1 Assets classified as held-for-sale – – 5,6 49,1 348,1
3 660,2 3 190,3 2 914,5 2 648,8 2 788,2
Total assets 8 034,0 7 102,6 6 568,8 5 529,9 5 400,4
EQUITY AND LIABILITIESCapital and reservesAttributable to equity holders of AVI 3 940,5 4 216,2 3 677,6 3 615,1 2 866,7 Non-controlling interests – – – (17,8) (19,8)
Total equity 3 940,5 4 216,2 3 677,6 3 597,3 2 846,9
Non-current liabilitiesBorrowings and operating lease straight-line liabilities 12,0 16,2 16,1 15,7 55,8 Employee benefits 383,6 348,5 347,9 349,7 359,2 Deferred taxation 290,7 269,8 240,3 90,9 73,1
686,3 634,5 604,3 456,3 488,1
Current liabilitiesCurrent borrowings 1 665,1 647,5 893,5 63,2 583,0 Trade and other payables including derivatives 1 731,3 1 599,8 1 375,7 1 338,7 1 279,1 Share buy-back liability – – – – 100,7 Corporate taxation 10,8 4,6 17,5 15,3 16,6 Liabilities classified as held-for-sale – – 0,2 59,1 86,0
3 407,2 2 251,9 2 286,9 1 476,3 2 065,4
Total equity and liabilities 8 034,0 7 102,6 6 568,8 5 529,9 5 400,4
Group income statements – five year summary
2015
R’m
2014
R’m
2013
R’m*
2012
R’m*
2011
R’m*
CONTINUING OPERATIONSRevenue 11 243,7 10 267,4 9 218,3 8 287,1 7 489,7
Operating profit before capital items 1 916,9 1 712,5 1 526,2 1 372,5 1 117,5 Income from investments 7,1 7,6 10,4 13,8 9,4 Finance costs (65,3) (56,0) (63,1) (28,1) (49,6)Equity-accounted earnings of joint ventures 9,5 28,5 23,9 46,8 36,1 Capital items (8,7) 138,0 (4,6) (13,8) (8,4)
Profit before taxation 1 859,5 1 830,6 1 492,8 1 391,2 1 105,0 Taxation 527,2 514,9 448,6 443,6 365,9
Profit after taxation 1 332,3 1 315,7 1 044,2 947,6 739,1 Non-controlling interests (excluding capital items) – – – – –
Earnings attributable to owners of AVI 1 332,3 1 315,7 1 044,2 947,6 739,1
Capital items after non-controlling interests and tax 6,4 (111,9) 3,3 9,9 6,3
Headline earnings 1 338,7 1 203,8 1 047,5 957,5 745,4
* Excludes Real Juice which is classified as discontinued and was disposed of 1 October 2012.
31
Group cash flow statements – five year summary
2015
R’m
2014
R’m
2013
R’m*
2012
R’m*
2011
R’m*
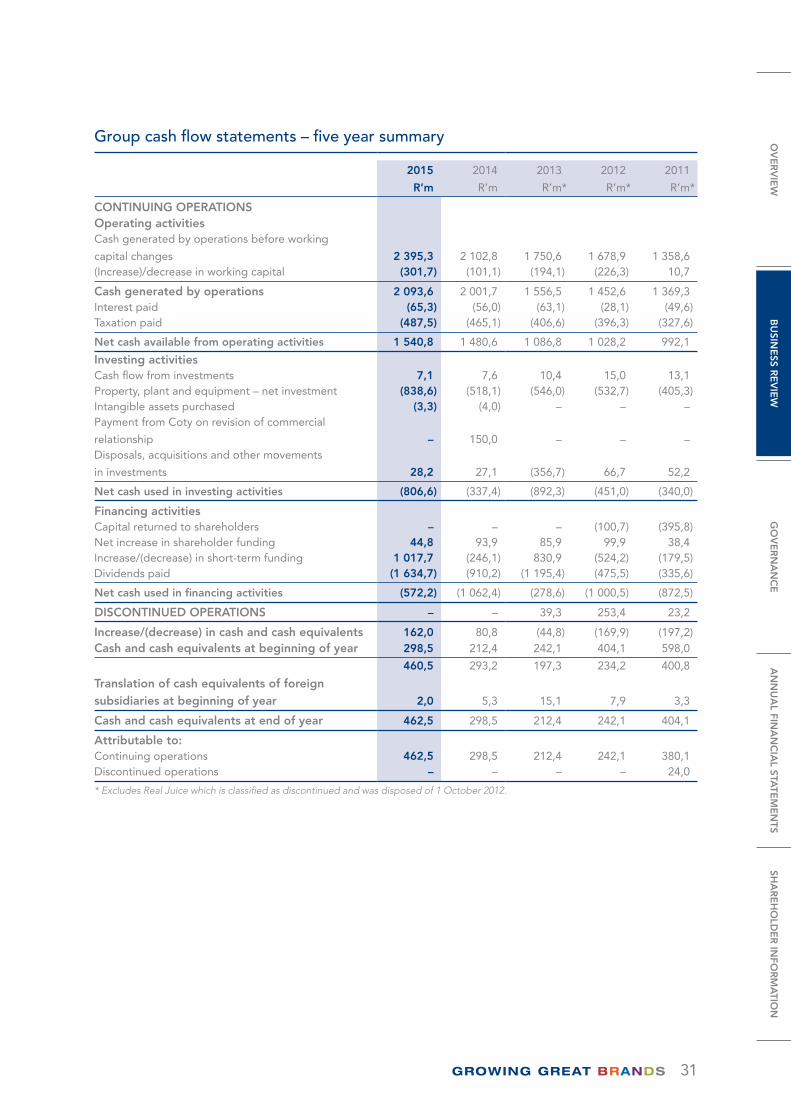
CONTINUING OPERATIONSOperating activitiesCash generated by operations before working
capital changes 2 395,3 2 102,8 1 750,6 1 678,9 1 358,6 (Increase)/decrease in working capital (301,7) (101,1) (194,1) (226,3) 10,7
Cash generated by operations 2 093,6 2 001,7 1 556,5 1 452,6 1 369,3 Interest paid (65,3) (56,0) (63,1) (28,1) (49,6)Taxation paid (487,5) (465,1) (406,6) (396,3) (327,6)
Net cash available from operating activities 1 540,8 1 480,6 1 086,8 1 028,2 992,1
Investing activitiesCash flow from investments 7,1 7,6 10,4 15,0 13,1 Property, plant and equipment – net investment (838,6) (518,1) (546,0) (532,7) (405,3)Intangible assets purchased (3,3) (4,0) – – – Payment from Coty on revision of commercial
relationship – 150,0 – – – Disposals, acquisitions and other movements
in investments 28,2 27,1 (356,7) 66,7 52,2
Net cash used in investing activities (806,6) (337,4) (892,3) (451,0) (340,0)
Financing activitiesCapital returned to shareholders – – – (100,7) (395,8)Net increase in shareholder funding 44,8 93,9 85,9 99,9 38,4 Increase/(decrease) in short-term funding 1 017,7 (246,1) 830,9 (524,2) (179,5)Dividends paid (1 634,7) (910,2) (1 195,4) (475,5) (335,6)
Net cash used in financing activities (572,2) (1 062,4) (278,6) (1 000,5) (872,5)
DISCONTINUED OPERATIONS – – 39,3 253,4 23,2
Increase/(decrease) in cash and cash equivalents 162,0 80,8 (44,8) (169,9) (197,2)Cash and cash equivalents at beginning of year 298,5 212,4 242,1 404,1 598,0
460,5 293,2 197,3 234,2 400,8
Translation of cash equivalents of foreign subsidiaries at beginning of year 2,0 5,3 15,1 7,9 3,3
Cash and cash equivalents at end of year 462,5 298,5 212,4 242,1 404,1
Attributable to:Continuing operations 462,5 298,5 212,4 242,1 380,1 Discontinued operations – – – – 24,0
* Excludes Real Juice which is classified as discontinued and was disposed of 1 October 2012.
OV
ER
VIE
WB
USIN
ESS R
EV
IEW
GO
VE
RN
AN
CE
AN
NU
AL FIN
AN
CIA
L STATE
ME
NTS
SHA
RE
HO
LDE
R IN
FOR
MA
TION
32
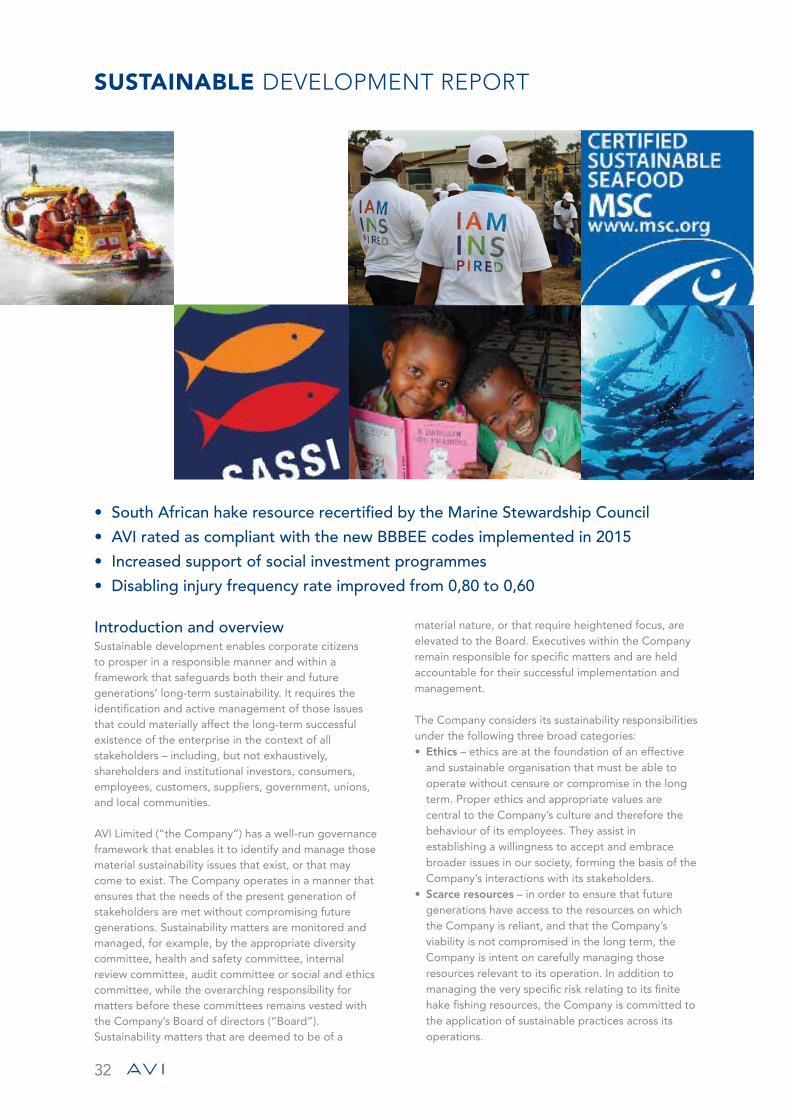
SUSTAINABLE DEVELOPMENT REPORT
Introduction and overviewSustainable development enables corporate citizens to prosper in a responsible manner and within a framework that safeguards both their and future generations’ long-term sustainability. It requires the identification and active management of those issues that could materially affect the long-term successful existence of the enterprise in the context of all stakeholders – including, but not exhaustively, shareholders and institutional investors, consumers, employees, customers, suppliers, government, unions, and local communities.
AVI Limited (“the Company”) has a well-run governance framework that enables it to identify and manage those material sustainability issues that exist, or that may come to exist. The Company operates in a manner that ensures that the needs of the present generation of stakeholders are met without compromising future generations. Sustainability matters are monitored and managed, for example, by the appropriate diversity committee, health and safety committee, internal review committee, audit committee or social and ethics committee, while the overarching responsibility for matters before these committees remains vested with the Company’s Board of directors (“Board”). Sustainability matters that are deemed to be of a
material nature, or that require heightened focus, are elevated to the Board. Executives within the Company remain responsible for specific matters and are held accountable for their successful implementation and management.
The Company considers its sustainability responsibilities under the following three broad categories:• Ethics – ethics are at the foundation of an effective
and sustainable organisation that must be able to operate without censure or compromise in the long term. Proper ethics and appropriate values are central to the Company’s culture and therefore the behaviour of its employees. They assist in establishing a willingness to accept and embrace broader issues in our society, forming the basis of the Company’s interactions with its stakeholders.
• Scarce resources – in order to ensure that future generations have access to the resources on which the Company is reliant, and that the Company’s viability is not compromised in the long term, the Company is intent on carefully managing those resources relevant to its operation. In addition to managing the very specific risk relating to its finite hake fishing resources, the Company is committed to the application of sustainable practices across its operations.
• South African hake resource recertified by the Marine Stewardship Council
• AVI rated as compliant with the new BBBEE codes implemented in 2015
• Increased support of social investment programmes
• Disabling injury frequency rate improved from 0,80 to 0,60
33
• Transformation and good corporate citizenship – the Company recognises the moral, social and economic imperative to embrace and support transformation in South Africa and to be regarded as a valuable participant in the South African economy and society. The Company also recognises the need to be, and to be seen as, a good corporate and socially responsible citizen that it is desirable to do business with.
Guiding frameworkThe following guidelines and/or standards were consulted when compiling this report:• The King Report on Corporate Governance for
South Africa, 2009 (“King III Report”).• The Listings Requirements of the JSE Limited
(“Listings Requirements”).• The JSE Socially Responsible Investment Index
(“JSE SRI”) criteria; and• The Global Reporting Initiative (“GRI”) framework.
While the King III Report and Listings Requirements require the Company to prepare an Integrated Annual Report, various other reporting frameworks deal with the underlying sustainability reporting criteria. The GRI framework and JSE SRI have been identified by the Company as appropriate frameworks for reporting on these issues based on the Company’s specific needs, its areas of operation and stakeholder concerns.
During the year the Company identified material Group wide issues for reporting purposes and an index indicating where these issues are referenced throughout this Integrated Annual Report can be found on page 50. While these issues have been categorised according to the GRI framework, the Company has not undertaken a detailed self assessment nor been formally assessed and the decision to use the GRI and JSE SRI frameworks for guidance in compiling this report is not intended to declare compliance as understood in either framework. The Company remains committed to ongoing review and reassessment of the scope of its reporting, as well as to the advisability and need for formal reporting or assessment against the accepted frameworks.
Disclosures on the Company’s approach to managing the matters reflecting on the Company’s sustainability can be found throughout the report either as an introduction to the relevant sections or as specific disclosures on relevant issues.
Social and Ethics CommitteeThe Social and Ethics Committee was constituted in August 2011 in terms of the Companies Act No 71 of 2008, as amended, and the Regulations thereto (“the Companies Act”), and adopted formal terms of reference, delegated to it by the Board, as its charter. The charter is subject to the provisions of the Companies Act (in particular section 72 as read with Regulation 43). The Committee has discharged its functions in terms of its charter, and in particular performed the following duties:• Reviewed the Company’s activities, having regard to
relevant legislation and other legal requirements and best practice, relating to:– social and economic development;– good corporate citizenship;– the environment, health and public safety;– consumer relationships; – labour and employment; and– the Company’s ethics codes and performance.
The Committee has unrestricted access to all Company information, employees and directors and is authorised, after discussion with the Chairman of the Board or the Chief Executive Officer where necessary, to investigate any matters within its terms of reference; seek external professional advice; secure the attendance of relevant consultants at its meetings; and implement policies approved by the Board. In addition the committee has the mandate to bring matters within its remit to the attention of the Board and to report back to shareholders at the Annual General Meeting.
For further details regarding the composition and meetings of the Committee, shareholders are referred to the Corporate Governance Report on page 62.
Stakeholder engagementStakeholder engagement is an important aspect of the Company’s sustainability responsibilities and it formally identifies and recognises the material stakeholders with legitimate interests with whom it engages on relevant issues. Engagement with these stakeholders takes a variety of forms, depending on the matter at hand, and may vary in frequency. Where key topics and concerns are raised through such stakeholder engagements, the Company responds to the relevant stakeholders in a variety of ways, including directly or through its annual reporting. The table on the next page lists the more obvious stakeholders and provides examples of the nature of the engagements that the Company has with them.
OV
ER
VIE
WB
USIN
ESS R
EV
IEW
GO
VE
RN
AN
CE
AN
NU
AL FIN
AN
CIA
L STATE
ME
NTS
SHA
RE
HO
LDE
R IN
FOR
MA
TION
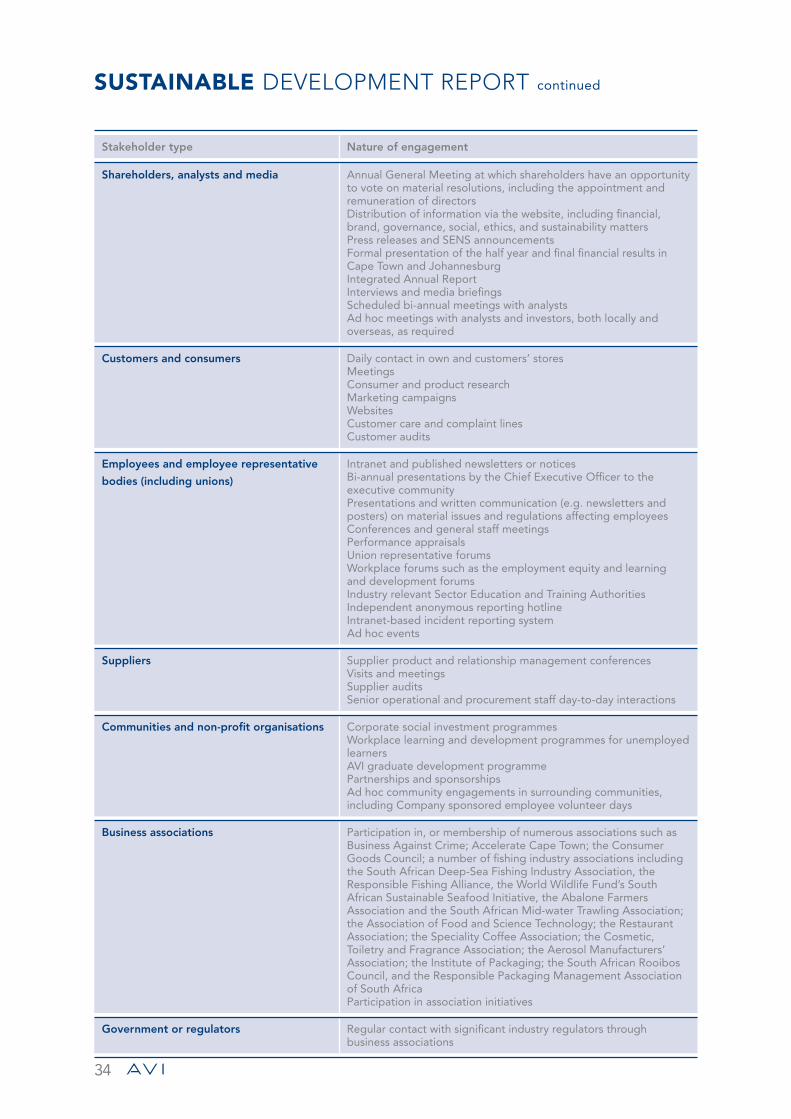
34
SUSTAINABLE DEVELOPMENT REPORT continued
Stakeholder type Nature of engagement
Shareholders, analysts and media Annual General Meeting at which shareholders have an opportunity to vote on material resolutions, including the appointment and remuneration of directorsDistribution of information via the website, including financial, brand, governance, social, ethics, and sustainability mattersPress releases and SENS announcementsFormal presentation of the half year and final financial results in Cape Town and JohannesburgIntegrated Annual ReportInterviews and media briefings Scheduled bi-annual meetings with analysts Ad hoc meetings with analysts and investors, both locally and overseas, as required
Customers and consumers Daily contact in own and customers’ storesMeetingsConsumer and product researchMarketing campaignsWebsitesCustomer care and complaint linesCustomer audits
Employees and employee representative
bodies (including unions)
Intranet and published newsletters or noticesBi-annual presentations by the Chief Executive Officer to the executive communityPresentations and written communication (e.g. newsletters and posters) on material issues and regulations affecting employeesConferences and general staff meetingsPerformance appraisalsUnion representative forumsWorkplace forums such as the employment equity and learning and development forumsIndustry relevant Sector Education and Training AuthoritiesIndependent anonymous reporting hotline Intranet-based incident reporting systemAd hoc events
Suppliers Supplier product and relationship management conferences Visits and meetingsSupplier auditsSenior operational and procurement staff day-to-day interactions
Communities and non-profit organisations Corporate social investment programmesWorkplace learning and development programmes for unemployed learnersAVI graduate development programmePartnerships and sponsorships Ad hoc community engagements in surrounding communities, including Company sponsored employee volunteer days
Business associations Participation in, or membership of numerous associations such as Business Against Crime; Accelerate Cape Town; the Consumer Goods Council; a number of fishing industry associations including the South African Deep-Sea Fishing Industry Association, the Responsible Fishing Alliance, the World Wildlife Fund’s South African Sustainable Seafood Initiative, the Abalone Farmers Association and the South African Mid-water Trawling Association; the Association of Food and Science Technology; the Restaurant Association; the Speciality Coffee Association; the Cosmetic, Toiletry and Fragrance Association; the Aerosol Manufacturers’ Association; the Institute of Packaging; the South African Rooibos Council, and the Responsible Packaging Management Association of South AfricaParticipation in association initiatives
Government or regulators Regular contact with significant industry regulators through business associations
35
EthicsThe Company has a well-established and comprehensive Code of Conduct and Ethics (“the code”) that applies to all directors and employees and provides clear guidance on what is considered to be acceptable conduct. The code requires all directors and employees to maintain the highest ethical standards and ensure that the Company’s affairs are conducted in a manner which is beyond reproach. The code is communicated to all new employees as part of their induction training, published on the intranet for access at all times by employees, and published on the external website for public access. The code is aligned with the recommendations in the King III Report and is regularly reviewed to ensure that it remains up to date and relevant.
In order to monitor ongoing compliance with the code, the Company has a formal governance framework. Within the governance framework material issues are highlighted in management reports that are reviewed by the operating executives. If appropriate, matters are elevated to the Company’s Board or Audit and Risk Committee. This formal framework is supported by the Company’s internal audit function, which is responsible for investigating identified areas of concern and reporting its findings to the Company’s Chief Financial Officer and the Audit and Risk Committee. The Company believes that an independent and professional hotline disclosure service is an important component of an ethical environment and subscribes to “Be Heard”. This service facilitates confidential reporting on fraud and other unethical conduct. Communication drives are undertaken from time to time to remind employees of this “whistle-blowing” service. In addition the Company has implemented an in-house intranet based incident reporting service that requires employees to report incidents, or potential incidents, which have caused, or could have caused, harm to the Company’s property or people on the Company’s premises. A senior employee actively manages the incident management reporting system and also engages with the “Be Heard” service providers. All anonymous reports and other reported incidents are reviewed on a daily basis, and, if appropriate, thoroughly investigated. The Company has a proven track record of dealing appropriately with matters arising from the “Be Heard” and incident management reporting systems. Investigations and disciplinary hearings have been held and, where appropriate, civil and criminal action has been taken.
In addition to the formal framework, it is imperative to promote a culture that is consistent with the ethical values that the Company aspires to. This is achieved through the example set by the Board and executive management, consistent enforcement of these values, and the careful selection of employees that display the desired attributes and values. The Company continues to communicate formally with suppliers and customers
to secure their support for and compliance with its ethical standards.
During the course of the year a Company wide Organisational Effectiveness Survey was conducted. Overall the results were pleasing and gave valuable insights into opportunities for the improvement and monitoring of the social and ethical health of the Company.
Scarce resources and biodiversityThe Company’s primary exposure to scarce resources that could materially impact its business is the performance of its fishing resources in South Africa. I&J has secured long-term hake fishing rights at a level that can support economic returns provided that the resource remains healthy.
The health of the South African fishing resource is managed by the Department of Agriculture, Forestry and Fisheries (“the Department”). The Department sets an industry wide annual “total allowable catch” (“the TAC”) for each species under management and, for certain species, also sets a “total allowance effort” (“the TAE”) in which a limit is placed on the number of boats, number of men, and the number of days per year that each boat is licensed to fish. In addition to the TAC, hake trawling sector and effort limitations apply which seek to ensure that the capacity of the deep-sea trawling fleet does not grow too big for the available resources.
In response to falling catch rates and a high proportion of juvenile fish in the catches – as evidenced by scientific surveys – the TAC was substantially reduced between 2002 and 2009, followed by a period of sustained health and growth in the hake resource resulting in TAC increases annually from 2011 to 2013. Again in response to scientific data showing a poor recovery of hake, the TAC was reduced by 0,5% in 2014 and by 5% in 2015, resulting in an I&J quota of 41 223 tons. Of concern is the continued unavailability of the Departmental research vessel, the RV Africana, used to maintain the scientific input underlying the TAC calculations. The SA Deep-Sea Trawling Association continues to assist the Fisheries’ Branch by making an industry vessel available to do the research voyages as and when necessary.
In May 2015 the Marine Stewardship Council (“MSC”) recertified that the South African hake resources met the requisite environmental standards for sustainable fishing for a further five years. This certification gives assurance to buyers and consumers that the seafood comes from a well managed and sustainable resource, which is increasingly relevant in I&J’s export markets.
I&J strives to lead initiatives to manage fishing effort and protect breeding areas off the South African coast. Effort control measures, such as the ring-fencing
OV
ER
VIE
WB
USIN
ESS R
EV
IEW
GO
VE
RN
AN
CE
AN
NU
AL FIN
AN
CIA
L STATE
ME
NTS
SHA
RE
HO
LDE
R IN
FOR
MA
TION
36
SUSTAINABLE DEVELOPMENT REPORT continued
initiative for the demarcation of trawling grounds, are being monitored and I&J continues to partner with the Department to ensure compliance and enforcement thereof. I&J has a good working relationship with the World Wildlife Fund South Africa (“WWF-SA”) which has resulted in the development of projects such as the responsible fisheries training programme and initiatives to reduce the incidental mortality of sea birds. During 2009 WWF-SA and I&J, together with other major South African fishing companies, formed the Responsible Fisheries Alliance (“RFA”). The alliance is intended to ensure that all stakeholders understand and support the implementation of an Ecosystem Approach to Fisheries (“EAF”) management in South Africa’s fisheries. EAF seeks to protect and enhance the health of marine ecosystems. The goals of the RFA include promoting responsible fisheries practices, influencing policy on fishery governance, and supporting skills development and research in the industry.
I&J is the signatory to a Participation Agreement with WWF-SA’s Sustainable Seafood Initiative (“WWF-SASSI”) which provides that by the end of 2015 all seafood sold by I&J will be either:• certified by the MSC for wild caught products; or• certified by the Aquaculture Stewardship Council
(“ASC”) for farmed products; or• green-listed by the WWF-SASSI; or• the subject of a credible, time bound improvement
project.
I&J’s commitments have been incorporated into the I&J Sustainable Seafood Policy (“SSP”), a comprehensive document that sets out the standards to which I&J strives to adhere and the standards expected from its suppliers. With the policy in place customers are assured that all I&J seafood products are derived from sustainably managed fisheries or aquaculture operations or fisheries working under an improvement programme. However, notwithstanding this policy, during I&J’s fishing operations there will be incidences where species with sustainability concerns may be caught as unavoidable by-catch. I&J cannot completely avoid or exclude these species from its fishing operations but it is committed to ensuring that these species are included in an effective By-Catch Management Plan and best practice solutions are proactively implemented to manage and mitigate the impact on these vulnerable species. I&J’s Danger Point abalone farm is situated immediately adjacent to the sea and is the Company’s only property in or adjacent to an area of high biodiversity. South Africa’s high energy coastline is generally unsuitable for offshore fish farming and land-based aquaculture allows for better control over environmental factors so that the impact on the environment can be limited. Although abalone aquaculture has a relatively low impact on the environment, in order to minimise any potential harm
the global abalone farming industry, including I&J, has engaged with the WWF to develop a set of standards. The Danger Point abalone farm has adopted these recently developed Global Abalone Standards and has been audited by the Aquaculture Stewardship Council. Once certification is achieved, an eco label will be used to guarantee that I&J’s abalone products are and continue to be raised in an environmentally responsible manner.
Transformation and good corporate citizenship Transformation The Company recognises the moral, social and economic imperative to embrace and support transformation in South Africa and to be a valuable participant in the South African economy and society. A transformed company in the South African context is not only one that has a workforce that is representative of the country’s racial and gender demographics and that operates with a bias towards broad-based empowerment opportunities, but one that also embraces diversity.
The Company continues to focus on its transformation and remains intent on providing a workplace that encourages diversity. Transformation is considered in the context of Broad-Based Black Economic Empowerment (“BBBEE”) and is measured annually by an external verification agency against the generic BBBEE scorecard. A central senior manager actively coordinates the Company’s efforts and ensures that the subsidiaries are well educated on the various facets of transformation. The subsidiaries’ progress is monitored and they are centrally assisted in the implementation of targets and various initiatives. During the year under review significant time and funds were invested in advancing the transformation plans that had been developed during the previous years. The progress of these plans was reviewed at half year where appropriate and revised activities were agreed upon, where necessary.
From FY10 to FY14, on the “old” BBBEE Codes of Good Practice, AVI materially improved its rating from a level 6 contributor (at 53,78%) to a level 4 contributor (at 70,25%). With the implementation of the “new” Codes early in 2015 the Company’s June 2015 verification was accordingly done against the “new” Codes. The consolidated score was level 7, discounted to level 8 for failing to achieve the required 40% threshold on supplier development. The other minimum thresholds for equity ownership, skills development, preferential procurement and enterprise development were all met.
The “new” Codes differ significantly from the “old” Codes and a comparison of the FY15 scorecard elements to previous years would be inappropriate.
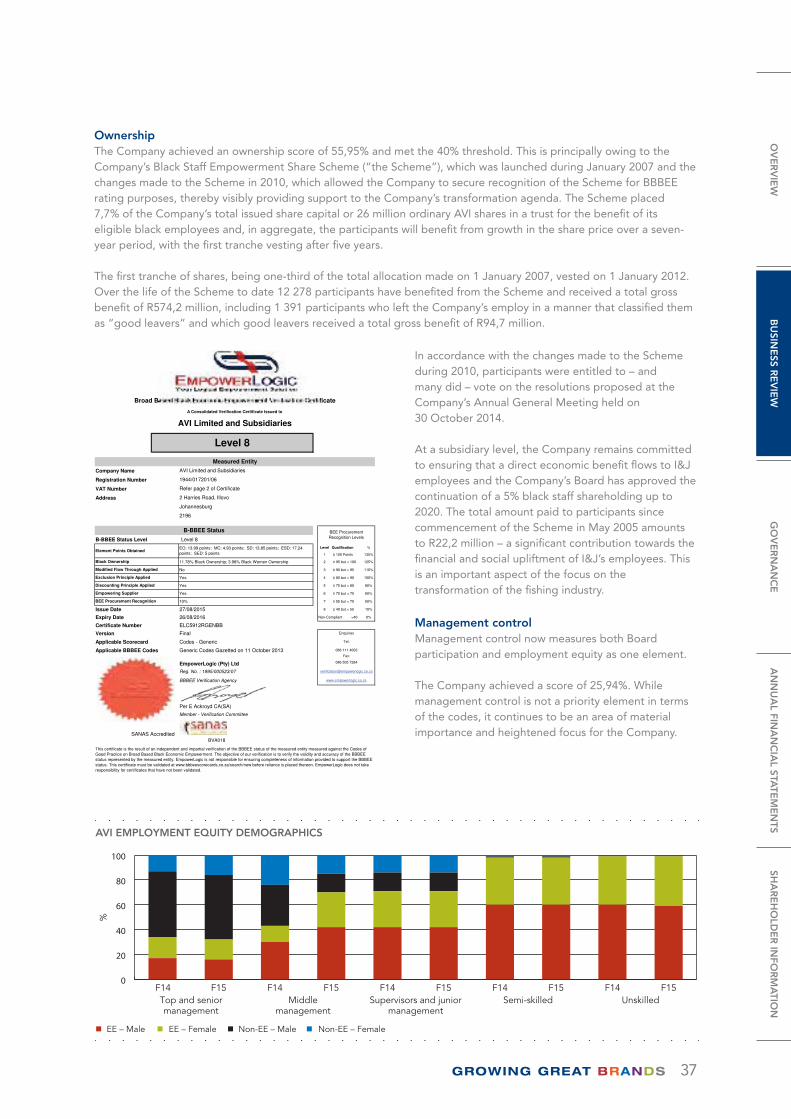
37
OwnershipThe Company achieved an ownership score of 55,95% and met the 40% threshold. This is principally owing to the Company’s Black Staff Empowerment Share Scheme (“the Scheme”), which was launched during January 2007 and the changes made to the Scheme in 2010, which allowed the Company to secure recognition of the Scheme for BBBEE rating purposes, thereby visibly providing support to the Company’s transformation agenda. The Scheme placed 7,7% of the Company’s total issued share capital or 26 million ordinary AVI shares in a trust for the benefit of its eligible black employees and, in aggregate, the participants will benefit from growth in the share price over a seven-year period, with the first tranche vesting after five years.
The first tranche of shares, being one-third of the total allocation made on 1 January 2007, vested on 1 January 2012. Over the life of the Scheme to date 12 278 participants have benefited from the Scheme and received a total gross benefit of R574,2 million, including 1 391 participants who left the Company’s employ in a manner that classified them as “good leavers” and which good leavers received a total gross benefit of R94,7 million.
In accordance with the changes made to the Scheme during 2010, participants were entitled to – and many did – vote on the resolutions proposed at the Company’s Annual General Meeting held on 30 October 2014.
At a subsidiary level, the Company remains committed to ensuring that a direct economic benefit flows to I&J employees and the Company’s Board has approved the continuation of a 5% black staff shareholding up to 2020. The total amount paid to participants since commencement of the Scheme in May 2005 amounts to R22,2 million – a significant contribution towards the financial and social upliftment of I&J’s employees. This is an important aspect of the focus on the transformation of the fishing industry.
Management control Management control now measures both Board participation and employment equity as one element.
The Company achieved a score of 25,94%. While management control is not a priority element in terms of the codes, it continues to be an area of material importance and heightened focus for the Company.
Company Name
Registration Number
VAT Number
Address
B-BBEE Status Level Level 8
Level Qualification %
1 100 Points 135%
11.78% Black Ownership; 3.98% Black Women Ownership 2 95 but < 100 125%
No 3 90 but < 95 110%
Yes 4 80 but < 90 100%
Yes 5 75 but < 80 80%
Yes 6 70 but < 75 60%
10% 7 55 but < 70 50%
Issue Date 27/08/2015 8 40 but < 55 10%
Expiry Date 26/08/2016 Non-Compliant <40 0%
Certificate Number ELC5912RGENBB
Version Final
Applicable Scorecard Codes - Generic
Applicable BBBEE Codes Generic Codes Gazetted on 11 October 2013
EmpowerLogic (Pty) LtdReg. No. : 1995/000523/07
BBBEE Verification Agency
Per E Ackroyd CA(SA)
Member - Verification Committee
SANAS Accredited BVA018
Black Ownership
BEE Procurement Recognition
Empowering Supplier
2 Harries Road, Illovo
Broad Based Black Economic Empowerment Verification Certificate
A Consolidated Verification Certificate Issued to
AVI Limited and Subsidiaries
Level 8
Measured Entity
AVI Limited and Subsidiaries
1944/017201/06
Refer page 2 of Certificate
Johannesburg
2196
B-BBEE Status
Element Points ObtainedEO: 13.99 points; MC: 4.93 points; SD: 13.85 points; ESD: 17.24 points; SED: 5 points
BEE Procurement Recognition Levels
This certificate is the result of an independent and impartial verification of the BBBEE status of the measured entity measured against the Codes of Good Practice on Broad Based Black Economic Empowerment. The objective of our verification is to verify the validity and accuracy of the BBBEE status represented by the measured entity. EmpowerLogic is not responsible for ensuring completeness of information provided to support the BBBEE status. This certificate must be validated at www.bbbeescorecards.co.za/search/new before reliance is placed thereon. EmpowerLogic does not take responsibility for certificates that have not been validated.
Modified Flow Through Applied
Exclusion Principle Applied
086 505 7284
www.empowerlogic.co.za
Fax:
Discounting Principle Applied
Enquiries
Tel:
086 111 4003
0
20
40
60
80
100
EE – Male EE – Female Non-EE – Male Non-EE – Female
Top and seniormanagement
Middlemanagement
Supervisors and juniormanagement
UnskilledSemi-skilledF15F14 F15F14 F15F14 F15F14 F15F14
AVI EMPLOYMENT EQUITY DEMOGRAPHICS
%
OV
ER
VIE
WB
USIN
ESS R
EV
IEW
GO
VE
RN
AN
CE
AN
NU
AL FIN
AN
CIA
L STATE
ME
NTS
SHA
RE
HO
LDE
R IN
FOR
MA
TION
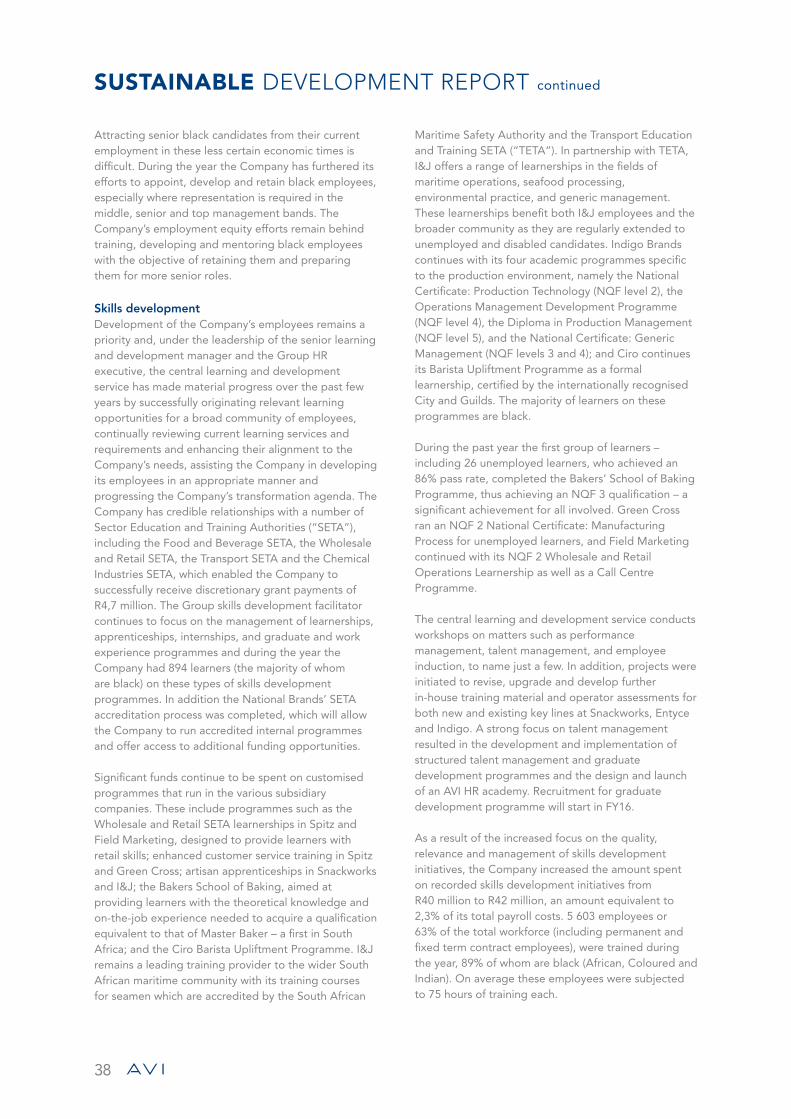
38
SUSTAINABLE DEVELOPMENT REPORT continued
Attracting senior black candidates from their current employment in these less certain economic times is difficult. During the year the Company has furthered its efforts to appoint, develop and retain black employees, especially where representation is required in the middle, senior and top management bands. The Company’s employment equity efforts remain behind training, developing and mentoring black employees with the objective of retaining them and preparing them for more senior roles.
Skills developmentDevelopment of the Company’s employees remains a priority and, under the leadership of the senior learning and development manager and the Group HR executive, the central learning and development service has made material progress over the past few years by successfully originating relevant learning opportunities for a broad community of employees, continually reviewing current learning services and requirements and enhancing their alignment to the Company’s needs, assisting the Company in developing its employees in an appropriate manner and progressing the Company’s transformation agenda. The Company has credible relationships with a number of Sector Education and Training Authorities (“SETA”), including the Food and Beverage SETA, the Wholesale and Retail SETA, the Transport SETA and the Chemical Industries SETA, which enabled the Company to successfully receive discretionary grant payments of R4,7 million. The Group skills development facilitator continues to focus on the management of learnerships, apprenticeships, internships, and graduate and work experience programmes and during the year the Company had 894 learners (the majority of whom are black) on these types of skills development programmes. In addition the National Brands’ SETA accreditation process was completed, which will allow the Company to run accredited internal programmes and offer access to additional funding opportunities.
Significant funds continue to be spent on customised programmes that run in the various subsidiary companies. These include programmes such as the Wholesale and Retail SETA learnerships in Spitz and Field Marketing, designed to provide learners with retail skills; enhanced customer service training in Spitz and Green Cross; artisan apprenticeships in Snackworks and I&J; the Bakers School of Baking, aimed at providing learners with the theoretical knowledge and on-the-job experience needed to acquire a qualification equivalent to that of Master Baker – a first in South Africa; and the Ciro Barista Upliftment Programme. I&J remains a leading training provider to the wider South African maritime community with its training courses for seamen which are accredited by the South African
Maritime Safety Authority and the Transport Education and Training SETA (“TETA”). In partnership with TETA, I&J offers a range of learnerships in the fields of maritime operations, seafood processing, environmental practice, and generic management. These learnerships benefit both I&J employees and the broader community as they are regularly extended to unemployed and disabled candidates. Indigo Brands continues with its four academic programmes specific to the production environment, namely the National Certificate: Production Technology (NQF level 2), the Operations Management Development Programme (NQF level 4), the Diploma in Production Management (NQF level 5), and the National Certificate: Generic Management (NQF levels 3 and 4); and Ciro continues its Barista Upliftment Programme as a formal learnership, certified by the internationally recognised City and Guilds. The majority of learners on these programmes are black.
During the past year the first group of learners – including 26 unemployed learners, who achieved an 86% pass rate, completed the Bakers’ School of Baking Programme, thus achieving an NQF 3 qualification – a significant achievement for all involved. Green Cross ran an NQF 2 National Certificate: Manufacturing Process for unemployed learners, and Field Marketing continued with its NQF 2 Wholesale and Retail Operations Learnership as well as a Call Centre Programme.
The central learning and development service conducts workshops on matters such as performance management, talent management, and employee induction, to name just a few. In addition, projects were initiated to revise, upgrade and develop further in-house training material and operator assessments for both new and existing key lines at Snackworks, Entyce and Indigo. A strong focus on talent management resulted in the development and implementation of structured talent management and graduate development programmes and the design and launch of an AVI HR academy. Recruitment for graduate development programme will start in FY16.
As a result of the increased focus on the quality, relevance and management of skills development initiatives, the Company increased the amount spent on recorded skills development initiatives from R40 million to R42 million, an amount equivalent to 2,3% of its total payroll costs. 5 603 employees or 63% of the total workforce (including permanent and fixed term contract employees), were trained during the year, 89% of whom are black (African, Coloured and Indian). On average these employees were subjected to 75 hours of training each.
39
Measured on the “new” Codes the Company achieved a score of 69,26% in the June 2015 verification and met the required 40% threshold. Skills development remains a priority area for the Company and one of the focus areas over the next 12 months will be employed and unemployed learnerships and the absorption of unemployed learners into employment at the end of the learnership programmes.
Enterprise and supplier developmentUnder the “new” Codes, this element now comprises preferential procurement, enterprise development and supplier development.
The revised codes introduced a number of far-reaching changes. The appointment of a Chief Procurement Officer as well as the collaboration of specialist procurers in the Company and a focus on favouring local empowering suppliers (as defined in the “new” Codes) plays a large role in the Company’s enterprise and supplier development strategy. Measured on the new codes the Company scored 43,09%. The Company met the 40% threshold in both preferential procurement (46,85%) and enterprise development (100%) but failed to meet the threshold in supplier development.
The Company continues to engage with suppliers regarding their transformation needs and to require its suppliers to register on the Department of Trade and Industry IT portal, which provides a single national catalogue of vendors and their BBBEE profiles. In addition the Company has started engaging with suppliers regarding their empowering supplier status and will assist suppliers where necessary to achieve this requirement.
The Company has appointed a dedicated Group Supplier Development Manager to partner with all relevant stakeholders and to develop and implement sustainable supplier development initiatives.
The subsidiaries have procurement policies in place addressing such matters as BBBEE targets, origin of materials, environmental awareness and sustainability, as well as labour practices and ethics. Potential suppliers are required to undergo a thorough vendor evaluation and selection process in which they address these issues. Wherever possible, locally based suppliers are preferred over international suppliers. The Company makes every effort to ensure that it only does business with suppliers who comply with all applicable legislation and has not identified any of its suppliers where employees’ labour and human rights are, or are at risk of, being violated.
Good corporate citizenshipThe Company recognises the benefits of being a good corporate citizen with a commitment to contributing to sustainable economic, social and environmental development through working with employees, their families, the local communities and society at large to improve quality of life, and being an organisation that it is desirous to do business with.
Labour data and practices
2015 2014
Number of permanent
employees (South Africa at
30 June) 8 324 8 051
Gender split (%)Male 60 61Female 40 39
Ethnic split (%) African 61 58White 9 9Indian/Chinese 5 5Coloured 24 27Non-South African 1 1
Ethnic and gender split (%) Black (African, Indian/Chinese
and Coloured) male 55 55White male 5 5Black female 35 35
White female 5 5
Approximately 38,5% of the Company’s permanent employees are members of recognised trade unions covered by collective agreements defining the terms of the relationship between the Company, the unions and the members, as well as their engagement on matters ranging from operational changes to annual negotiations on wages and other substantive issues. Union engagement is managed at an executive level within the subsidiaries, with oversight from the Company, in particular from the Group HR executive.
The Company requires the subsidiaries to have appropriate policies and procedures in place to address employee and industrial relations issues and to ensure that these policies and procedures are communicated to all employees and other relevant stakeholders. The Company complies with all applicable labour and employment legislation, including legislation pertaining to freedom of association, child labour, and forced and compulsory labour, and is committed to the protection of all employees’ human rights, the provision of decent work, and fair and sustainable labour practices. During the year no infringements of these rights or incidents of discrimination were reported.
OV
ER
VIE
WB
USIN
ESS R
EV
IEW
GO
VE
RN
AN
CE
AN
NU
AL FIN
AN
CIA
L STATE
ME
NTS
SHA
RE
HO
LDE
R IN
FOR
MA
TION
40
SUSTAINABLE DEVELOPMENT REPORT continued
Health, safety and wellness The Company provides a healthy and safe work environment to its employees as a basic right and recognises that a healthy and safe workplace enhances employee morale and productivity. It is also recognised that a healthy and safe workplace is essential in the food handling industry and ensures that consumers are protected and product quality assured.
Health and safety requirements are firstly monitored and reviewed within the risk management framework of the Company and legislative compliance is required as a minimum standard. The requisite health and safety committees are in place and training occurs on an ongoing basis. These on-site committees deal with issues as and when required, and if necessary they elevate matters to the internal review committees that they report to. If necessary, matters are referred to the Company’s Board of directors or Audit and Risk Committee. In addition the Social and Ethics Committee monitors these matters. There are also various supplementary health and wellness initiatives that form part of the Company’s employee engagement framework.
It is with deep sadness and regret that we report the deaths on 7 April 2015 of two temporary employment service employees in the Company’s Logistics division. Amon Madondo and Sikholiwe Somi died from injuries sustained when the heavy duty vehicle in which they were travelling overturned when the driver lost control on entering the Gillooly’s interchange overpass.
Statistically the Company’s safety record is viewed against the industry standard disabling injury frequency rate (“DIFR”), which measures the percentage of employees that suffer a disabling injury for every 200 000 man hours worked. A disabling injury is an injury that causes an employee to miss a shift following the one on which they were injured. At a Group level the Company experienced 80 disabling injuries (compared to 105 in the previous year) resulting in 1 144 lost days and achieved a DIFR of 0,60 for the year, an improvement over the previous year’s rating of 0,80. Steps are continually being taken to proactively identify and prevent potentially harmful situations and improve employee training.
As Company wide statistics can mask events, the Company categorises all injuries into one of three classes. Class 1 being damage that permanently alters a person’s life ranging to class 3 that inconveniences a person’s life. During the year under review there was a decrease in class 3 injuries with many of the injuries resulting from employees failing to take due care. Six
of the Company’s employees suffered class 1 injuries, including the two deaths referred to earlier. The other four class 1 injuries comprised severe lacerations, fractures and partial finger amputations due to the incorrect use or maintenance of equipment. The businesses in question have implemented additional safety measures and retrained employees.
The high safety standards adopted by the operations are continually being enhanced by accreditation with independent standard regulating authorities.
Regrettably store robberies in the retail sector remain a reality and both Spitz and Green Cross are taking all possible measures to limit the probabilities of and risks associated with robberies in their stores. In addition they maintain a close relationship with the AVI Employee Wellness Programme to ensure that all affected staff receive counselling after any traumatic event. With the exception of the Durban tea and Rosslyn snacks’ factories, which are ISO 22000 (food safety quality management system) certified, all of the Company’s tea, coffee, biscuit and cosmetics manufacturing sites remain ISO 9001 (quality management system) certified. In addition the Indigo Brands cosmetics factory is SANS 1851 (Control of Quality: Trade Metrology Act) certified, the Isando biscuit factory is OHSAS 18001 certified, the Rosslyn snacks factory is ISO 22000 (food safety management system) certified, the Durban tea factory is SANS 10330 (food safety) certified, both the Durban tea and Isando coffee factories are Hazard Analysis and Critical Control Points (“HACCP”), a systematic preventive approach to food safety from biological, chemical, and physical hazards in production processes that can cause the finished product to be unsafe, and designs measurements to reduce these risks to a safe level) certified, and all three biscuit and snack factories have their Certificates of Acceptability from the local authorities. The Isando and Westmead biscuit factories maintained certification to the American Institute of Baking (“AIB”) Food Safety Standard and the FSSC 22000:2010, an international standard for the certification of Food Safety Management Systems. The Isando coffee and creamer factory, the Durban tea factory, and the Isando and Westmead biscuit factories, are all ISO 14001 (environmental management system) certified. The I&J Woodstock and Valued Added Processing sites have “A” listed British Retail Consortium (“BRC”) for Global Standards, Higher Level International Food Standard (“IFS”) global food safety certification, Marine Stewardship Council (“MSC”) Chain of Custody Certification (a sustainability
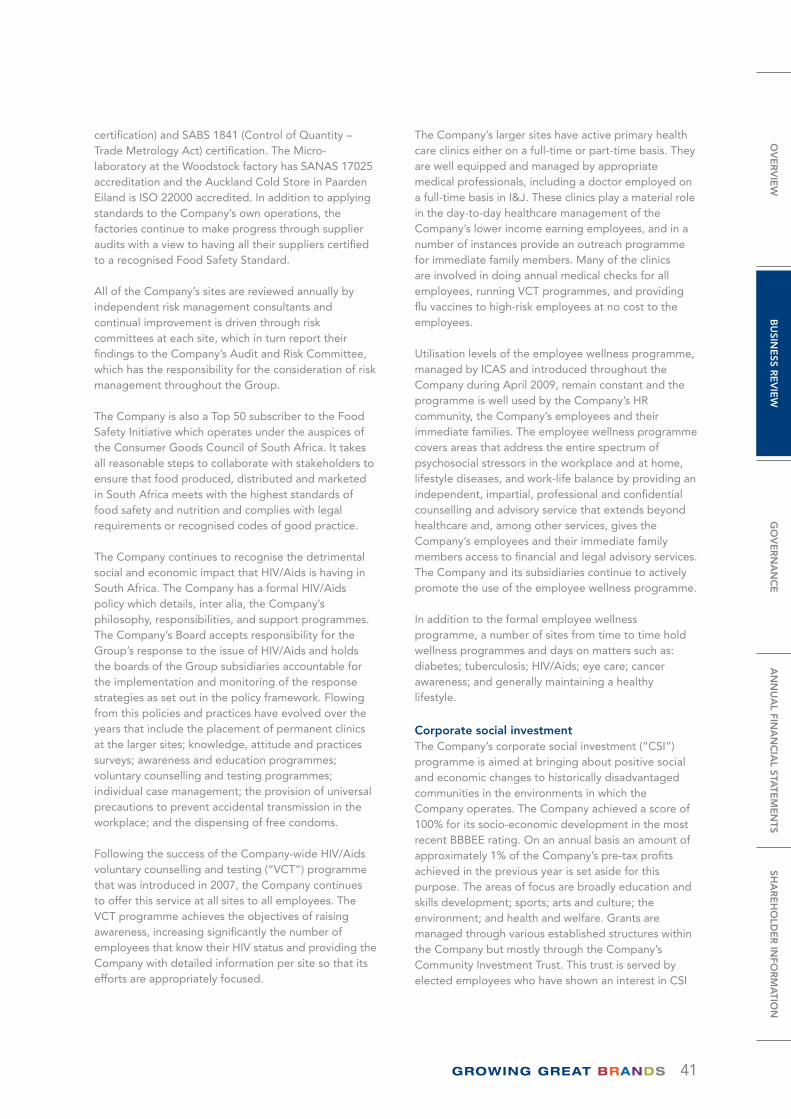
41
certification) and SABS 1841 (Control of Quantity – Trade Metrology Act) certification. The Micro-laboratory at the Woodstock factory has SANAS 17025 accreditation and the Auckland Cold Store in Paarden Eiland is ISO 22000 accredited. In addition to applying standards to the Company’s own operations, the factories continue to make progress through supplier audits with a view to having all their suppliers certified to a recognised Food Safety Standard. All of the Company’s sites are reviewed annually by independent risk management consultants and continual improvement is driven through risk committees at each site, which in turn report their findings to the Company’s Audit and Risk Committee, which has the responsibility for the consideration of risk management throughout the Group.
The Company is also a Top 50 subscriber to the Food Safety Initiative which operates under the auspices of the Consumer Goods Council of South Africa. It takes all reasonable steps to collaborate with stakeholders to ensure that food produced, distributed and marketed in South Africa meets with the highest standards of food safety and nutrition and complies with legal requirements or recognised codes of good practice.
The Company continues to recognise the detrimental social and economic impact that HIV/Aids is having in South Africa. The Company has a formal HIV/Aids policy which details, inter alia, the Company’s philosophy, responsibilities, and support programmes. The Company’s Board accepts responsibility for the Group’s response to the issue of HIV/Aids and holds the boards of the Group subsidiaries accountable for the implementation and monitoring of the response strategies as set out in the policy framework. Flowing from this policies and practices have evolved over the years that include the placement of permanent clinics at the larger sites; knowledge, attitude and practices surveys; awareness and education programmes; voluntary counselling and testing programmes; individual case management; the provision of universal precautions to prevent accidental transmission in the workplace; and the dispensing of free condoms.
Following the success of the Company-wide HIV/Aids voluntary counselling and testing (“VCT”) programme that was introduced in 2007, the Company continues to offer this service at all sites to all employees. The VCT programme achieves the objectives of raising awareness, increasing significantly the number of employees that know their HIV status and providing the Company with detailed information per site so that its efforts are appropriately focused.
The Company’s larger sites have active primary health care clinics either on a full-time or part-time basis. They are well equipped and managed by appropriate medical professionals, including a doctor employed on a full-time basis in I&J. These clinics play a material role in the day-to-day healthcare management of the Company’s lower income earning employees, and in a number of instances provide an outreach programme for immediate family members. Many of the clinics are involved in doing annual medical checks for all employees, running VCT programmes, and providing flu vaccines to high-risk employees at no cost to the employees.
Utilisation levels of the employee wellness programme, managed by ICAS and introduced throughout the Company during April 2009, remain constant and the programme is well used by the Company’s HR community, the Company’s employees and their immediate families. The employee wellness programme covers areas that address the entire spectrum of psychosocial stressors in the workplace and at home, lifestyle diseases, and work-life balance by providing an independent, impartial, professional and confidential counselling and advisory service that extends beyond healthcare and, among other services, gives the Company’s employees and their immediate family members access to financial and legal advisory services. The Company and its subsidiaries continue to actively promote the use of the employee wellness programme.
In addition to the formal employee wellness programme, a number of sites from time to time hold wellness programmes and days on matters such as: diabetes; tuberculosis; HIV/Aids; eye care; cancer awareness; and generally maintaining a healthy lifestyle.
Corporate social investment The Company’s corporate social investment (“CSI”) programme is aimed at bringing about positive social and economic changes to historically disadvantaged communities in the environments in which the Company operates. The Company achieved a score of 100% for its socio-economic development in the most recent BBBEE rating. On an annual basis an amount of approximately 1% of the Company’s pre-tax profits achieved in the previous year is set aside for this purpose. The areas of focus are broadly education and skills development; sports; arts and culture; the environment; and health and welfare. Grants are managed through various established structures within the Company but mostly through the Company’s Community Investment Trust. This trust is served by elected employees who have shown an interest in CSI
OV
ER
VIE
WB
USIN
ESS R
EV
IEW
GO
VE
RN
AN
CE
AN
NU
AL FIN
AN
CIA
L STATE
ME
NTS
SHA
RE
HO
LDE
R IN
FOR
MA
TION
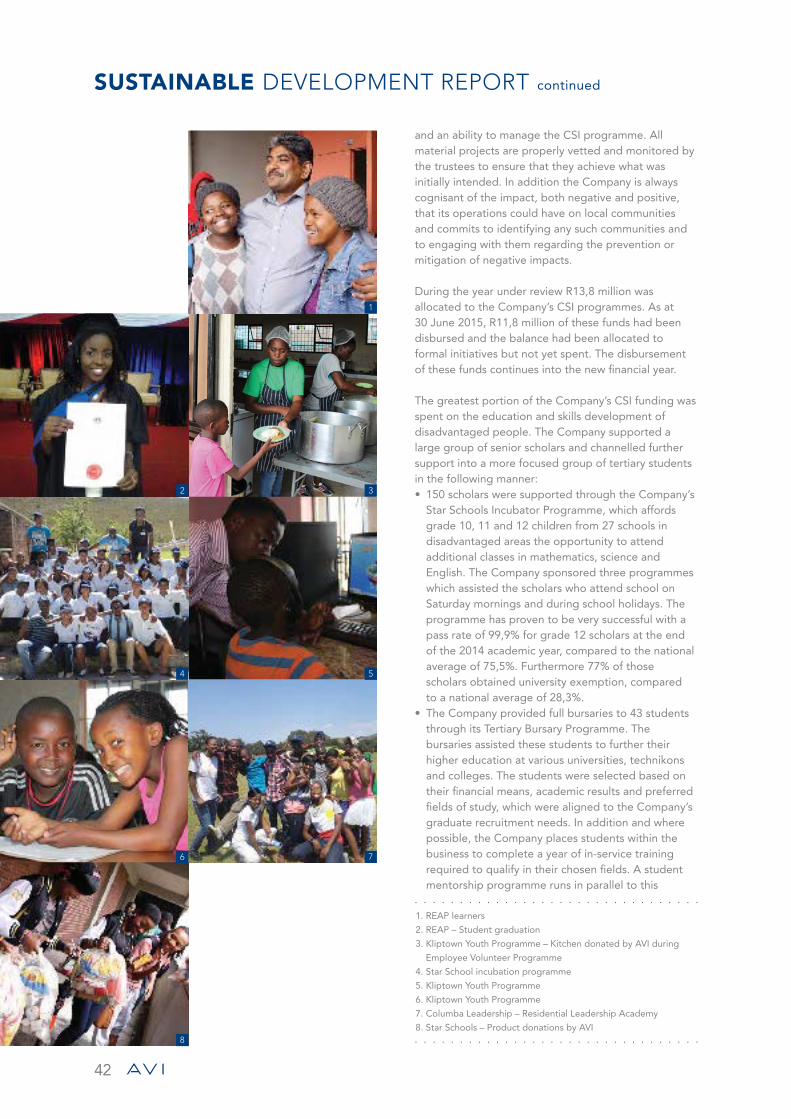
42
SUSTAINABLE DEVELOPMENT REPORT continued
and an ability to manage the CSI programme. All material projects are properly vetted and monitored by the trustees to ensure that they achieve what was initially intended. In addition the Company is always cognisant of the impact, both negative and positive, that its operations could have on local communities and commits to identifying any such communities and to engaging with them regarding the prevention or mitigation of negative impacts.
During the year under review R13,8 million was allocated to the Company’s CSI programmes. As at 30 June 2015, R11,8 million of these funds had been disbursed and the balance had been allocated to formal initiatives but not yet spent. The disbursement of these funds continues into the new financial year.
The greatest portion of the Company’s CSI funding was spent on the education and skills development of disadvantaged people. The Company supported a large group of senior scholars and channelled further support into a more focused group of tertiary students in the following manner:• 150 scholars were supported through the Company’s
Star Schools Incubator Programme, which affords grade 10, 11 and 12 children from 27 schools in disadvantaged areas the opportunity to attend additional classes in mathematics, science and English. The Company sponsored three programmes which assisted the scholars who attend school on Saturday mornings and during school holidays. The programme has proven to be very successful with a pass rate of 99,9% for grade 12 scholars at the end of the 2014 academic year, compared to the national average of 75,5%. Furthermore 77% of those scholars obtained university exemption, compared to a national average of 28,3%.
• The Company provided full bursaries to 43 students through its Tertiary Bursary Programme. The bursaries assisted these students to further their higher education at various universities, technikons and colleges. The students were selected based on their financial means, academic results and preferred fields of study, which were aligned to the Company’s graduate recruitment needs. In addition and where possible, the Company places students within the business to complete a year of in-service training required to qualify in their chosen fields. A student mentorship programme runs in parallel to this
1. REAP learners
2. REAP – Student graduation
3. Kliptown Youth Programme – Kitchen donated by AVI during
Employee Volunteer Programme
4. Star School incubation programme
5. Kliptown Youth Programme
6. Kliptown Youth Programme
7. Columba Leadership – Residential Leadership Academy
8. Star Schools – Product donations by AVI
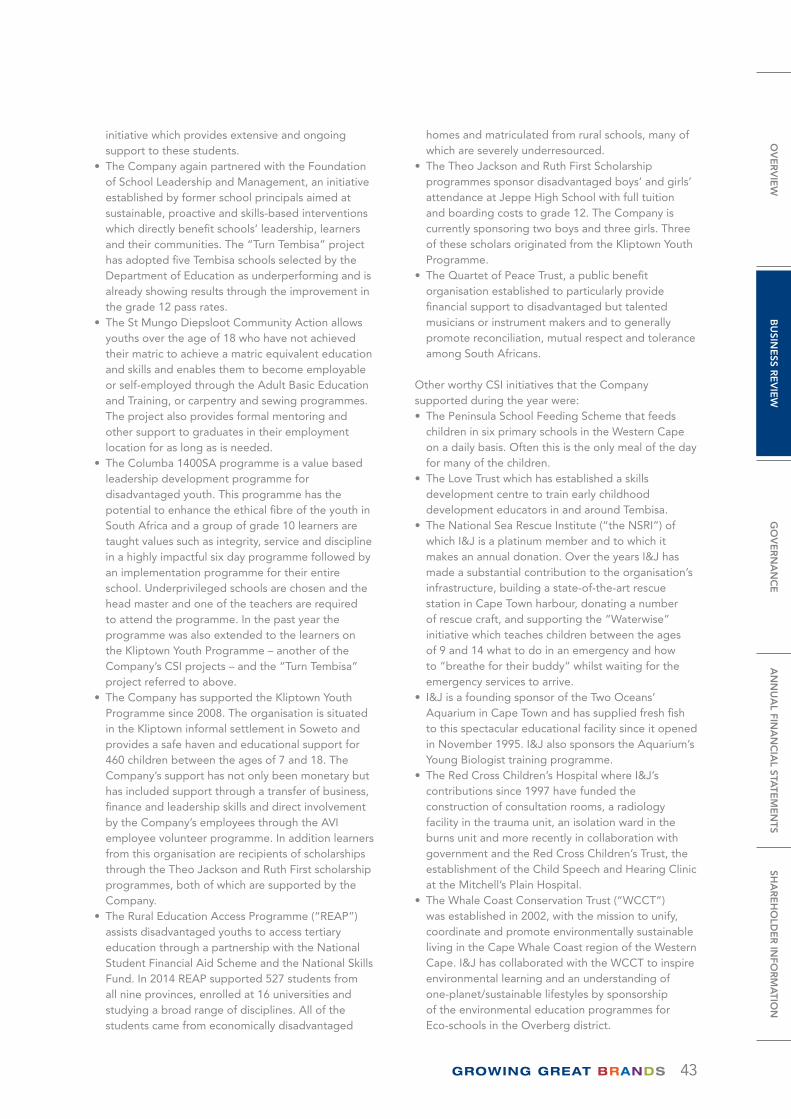
43
initiative which provides extensive and ongoing support to these students.
• The Company again partnered with the Foundation of School Leadership and Management, an initiative established by former school principals aimed at sustainable, proactive and skills-based interventions which directly benefit schools’ leadership, learners and their communities. The “Turn Tembisa” project has adopted five Tembisa schools selected by the Department of Education as underperforming and is already showing results through the improvement in the grade 12 pass rates.
• The St Mungo Diepsloot Community Action allows youths over the age of 18 who have not achieved their matric to achieve a matric equivalent education and skills and enables them to become employable or self-employed through the Adult Basic Education and Training, or carpentry and sewing programmes. The project also provides formal mentoring and other support to graduates in their employment location for as long as is needed.
• The Columba 1400SA programme is a value based leadership development programme for disadvantaged youth. This programme has the potential to enhance the ethical fibre of the youth in South Africa and a group of grade 10 learners are taught values such as integrity, service and discipline in a highly impactful six day programme followed by an implementation programme for their entire school. Underprivileged schools are chosen and the head master and one of the teachers are required to attend the programme. In the past year the programme was also extended to the learners on the Kliptown Youth Programme – another of the Company’s CSI projects – and the “Turn Tembisa” project referred to above.
• The Company has supported the Kliptown Youth Programme since 2008. The organisation is situated in the Kliptown informal settlement in Soweto and provides a safe haven and educational support for 460 children between the ages of 7 and 18. The Company’s support has not only been monetary but has included support through a transfer of business, finance and leadership skills and direct involvement by the Company’s employees through the AVI employee volunteer programme. In addition learners from this organisation are recipients of scholarships through the Theo Jackson and Ruth First scholarship programmes, both of which are supported by the Company.
• The Rural Education Access Programme (“REAP”) assists disadvantaged youths to access tertiary education through a partnership with the National Student Financial Aid Scheme and the National Skills Fund. In 2014 REAP supported 527 students from all nine provinces, enrolled at 16 universities and studying a broad range of disciplines. All of the students came from economically disadvantaged
homes and matriculated from rural schools, many of which are severely underresourced.
• The Theo Jackson and Ruth First Scholarship programmes sponsor disadvantaged boys’ and girls’ attendance at Jeppe High School with full tuition and boarding costs to grade 12. The Company is currently sponsoring two boys and three girls. Three of these scholars originated from the Kliptown Youth Programme.
• The Quartet of Peace Trust, a public benefit organisation established to particularly provide financial support to disadvantaged but talented musicians or instrument makers and to generally promote reconciliation, mutual respect and tolerance among South Africans.
Other worthy CSI initiatives that the Company supported during the year were:• The Peninsula School Feeding Scheme that feeds
children in six primary schools in the Western Cape on a daily basis. Often this is the only meal of the day for many of the children.
• The Love Trust which has established a skills development centre to train early childhood development educators in and around Tembisa.
• The National Sea Rescue Institute (“the NSRI”) of which I&J is a platinum member and to which it makes an annual donation. Over the years I&J has made a substantial contribution to the organisation’s infrastructure, building a state-of-the-art rescue station in Cape Town harbour, donating a number of rescue craft, and supporting the “Waterwise” initiative which teaches children between the ages of 9 and 14 what to do in an emergency and how to “breathe for their buddy” whilst waiting for the emergency services to arrive.
• I&J is a founding sponsor of the Two Oceans’ Aquarium in Cape Town and has supplied fresh fish to this spectacular educational facility since it opened in November 1995. I&J also sponsors the Aquarium’s Young Biologist training programme.
• The Red Cross Children’s Hospital where I&J’s contributions since 1997 have funded the construction of consultation rooms, a radiology facility in the trauma unit, an isolation ward in the burns unit and more recently in collaboration with government and the Red Cross Children’s Trust, the establishment of the Child Speech and Hearing Clinic at the Mitchell’s Plain Hospital.
• The Whale Coast Conservation Trust (“WCCT”) was established in 2002, with the mission to unify, coordinate and promote environmentally sustainable living in the Cape Whale Coast region of the Western Cape. I&J has collaborated with the WCCT to inspire environmental learning and an understanding of one-planet/sustainable lifestyles by sponsorship of the environmental education programmes for Eco-schools in the Overberg district.
OV
ER
VIE
WB
USIN
ESS R
EV
IEW
GO
VE
RN
AN
CE
AN
NU
AL FIN
AN
CIA
L STATE
ME
NTS
SHA
RE
HO
LDE
R IN
FOR
MA
TION
44
SUSTAINABLE DEVELOPMENT REPORT continued
• Enactus, which is an international non-profit organisation that brings together student, academic and business leaders who are committed to using the power of entrepreneurial action to improve the quality of life and standard of living for people in need. The Company supported the Enactus teams at the University of Fort Hare, the CIDA City Campus and the Tertiary School in Business Administration (“TSiBA”).
• Afrika Tikkun, which provides education, health and social services to vulnerable children, youth and their families through centres in six South African communities with the aim to ensure a sustainable future for the children and empower the communities to develop generations of productive citizens.
The Company has also been involved in or made donations to a number of smaller but just as important initiatives, such as the Rapport Onderwysfonds, Living Link, Inkanyezi Crèche, Whale Coast Conservation, and Look Good Feel Better.
At a more personal level, the Company’s employees are encouraged to become involved with their local communities on Company sponsored employee volunteer days branded as “I am Inspired”. All of the projects are selected from organisations with which the Company has established relationships and the Company gives employees time off to provide their services to these projects.
Environmental policy The Company recognises that its use of natural resources has a socio-economic and physical impact on the environment, accepts responsibility for such impact, and pursues responsible environmental and climate change practices. This involves:• Reducing the Company’s environmental impact and
continually improving the Company’s environmental performance as an integral part of the Company’s business strategy and operating methods;
• Compliance with all applicable environmental legislation or standards;
• The practice of responsible environmental management related to inputs (material, energy and water) and outputs (emissions, effluents and waste) affecting ecosystems and communities;
• Independent annual environmental audits at each manufacturing site measuring the impact that the particular operation has on its environment and reviewing compliance with legislation and Company policy;
• Providing a framework for setting and reviewing objectives and targets;
• Ensuring that all employees understand the environmental policy and conform to the standards it requires; and
• Reporting in the Company’s Integrated Annual Report on performance against targets.
The Company’s Board of directors is responsible for the environmental policy and for ensuring that its principles are taken into consideration in formulating the Company’s business plans, and the Company’s Chief Executive Officer and senior management are in turn responsible for implementation of the business plans and communication of the policy. The Board of directors has delegated the responsibility for monitoring compliance with the policy to the Company’s audit and risk committee. Certain aspects of this subject are also considered by the Social and Ethics Committee.
The Company remains committed to the responsible management of all applicable environmental matters, including those which impact on climate change and relate to responsible and sustainable environmental practices, such as greenhouse gas emissions; raw materials usage and recycling; resource usage and efficiency (including water and electricity); impacts on biodiversity; and emissions, effluents and waste management. In particular the Company is alert to the impact that climate change could have on natural resources and the effect that legislative changes could have on the way the Company does business. The Company monitors relevant global and local legislation, regulations and emission-reduction targets.
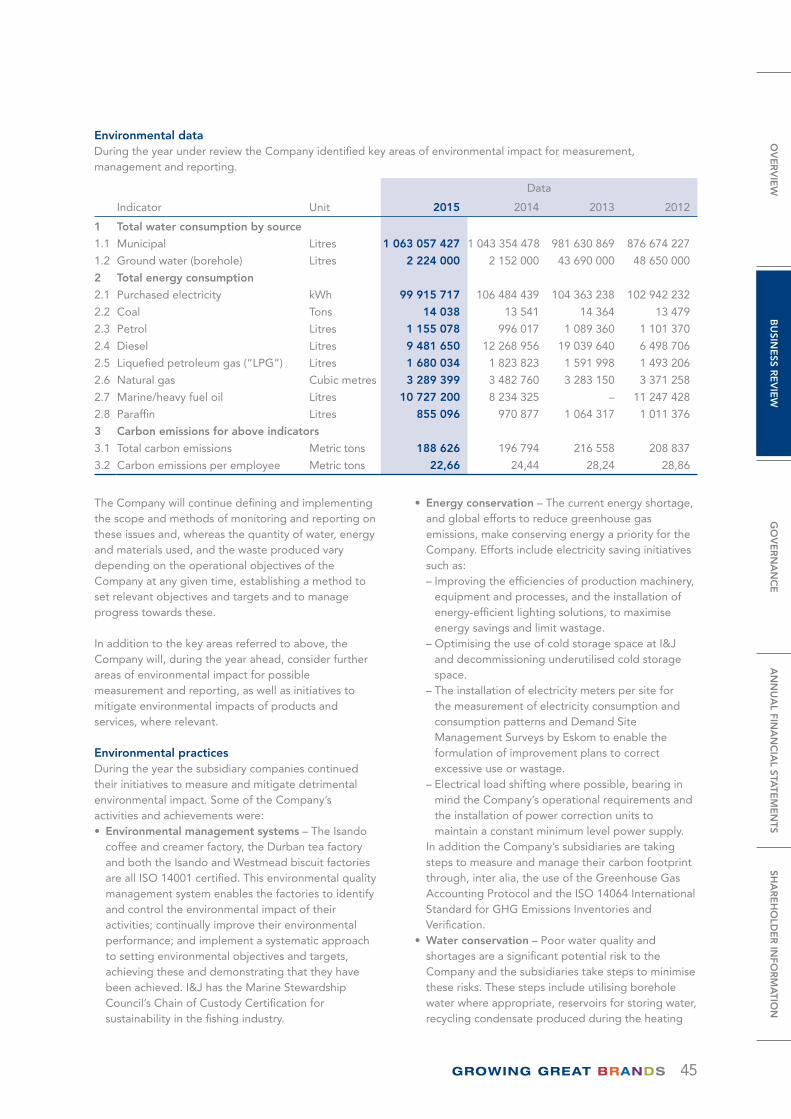
45
Environmental dataDuring the year under review the Company identified key areas of environmental impact for measurement, management and reporting.
Indicator Unit
Data
2015 2014 2013 2012
1 Total water consumption by source
1.1 Municipal Litres 1 063 057 427 1 043 354 478 981 630 869 876 674 227
1.2 Ground water (borehole) Litres 2 224 000 2 152 000 43 690 000 48 650 000
2 Total energy consumption
2.1 Purchased electricity kWh 99 915 717 106 484 439 104 363 238 102 942 232
2.2 Coal Tons 14 038 13 541 14 364 13 479
2.3 Petrol Litres 1 155 078 996 017 1 089 360 1 101 370
2.4 Diesel Litres 9 481 650 12 268 956 19 039 640 6 498 706
2.5 Liquefied petroleum gas (“LPG”) Litres 1 680 034 1 823 823 1 591 998 1 493 206
2.6 Natural gas Cubic metres 3 289 399 3 482 760 3 283 150 3 371 258
2.7 Marine/heavy fuel oil Litres 10 727 200 8 234 325 – 11 247 428
2.8 Paraffin Litres 855 096 970 877 1 064 317 1 011 376
3 Carbon emissions for above indicators
3.1 Total carbon emissions Metric tons 188 626 196 794 216 558 208 837
3.2 Carbon emissions per employee Metric tons 22,66 24,44 28,24 28,86
The Company will continue defining and implementing the scope and methods of monitoring and reporting on these issues and, whereas the quantity of water, energy and materials used, and the waste produced vary depending on the operational objectives of the Company at any given time, establishing a method to set relevant objectives and targets and to manage progress towards these.
In addition to the key areas referred to above, the Company will, during the year ahead, consider further areas of environmental impact for possible measurement and reporting, as well as initiatives to mitigate environmental impacts of products and services, where relevant.
Environmental practicesDuring the year the subsidiary companies continued their initiatives to measure and mitigate detrimental environmental impact. Some of the Company’s activities and achievements were:• Environmental management systems – The Isando
coffee and creamer factory, the Durban tea factory and both the Isando and Westmead biscuit factories are all ISO 14001 certified. This environmental quality management system enables the factories to identify and control the environmental impact of their activities; continually improve their environmental performance; and implement a systematic approach to setting environmental objectives and targets, achieving these and demonstrating that they have been achieved. I&J has the Marine Stewardship Council’s Chain of Custody Certification for sustainability in the fishing industry.
• Energy conservation – The current energy shortage, and global efforts to reduce greenhouse gas emissions, make conserving energy a priority for the Company. Efforts include electricity saving initiatives such as:– Improving the efficiencies of production machinery,
equipment and processes, and the installation of energy-efficient lighting solutions, to maximise energy savings and limit wastage.
– Optimising the use of cold storage space at I&J and decommissioning underutilised cold storage space.
– The installation of electricity meters per site for the measurement of electricity consumption and consumption patterns and Demand Site Management Surveys by Eskom to enable the formulation of improvement plans to correct excessive use or wastage.
– Electrical load shifting where possible, bearing in mind the Company’s operational requirements and the installation of power correction units to maintain a constant minimum level power supply.
In addition the Company’s subsidiaries are taking steps to measure and manage their carbon footprint through, inter alia, the use of the Greenhouse Gas Accounting Protocol and the ISO 14064 International Standard for GHG Emissions Inventories and Verification.
• Water conservation – Poor water quality and shortages are a significant potential risk to the Company and the subsidiaries take steps to minimise these risks. These steps include utilising borehole water where appropriate, reservoirs for storing water, recycling condensate produced during the heating
OV
ER
VIE
WB
USIN
ESS R
EV
IEW
GO
VE
RN
AN
CE
AN
NU
AL FIN
AN
CIA
L STATE
ME
NTS
SHA
RE
HO
LDE
R IN
FOR
MA
TION
46
SUSTAINABLE DEVELOPMENT REPORT continued
processes back to the boilers, and adopting environmentally friendly stormwater reticulation, while simultaneously taking measures to measure and manage water consumption.
• Fuel consumption – Within its distribution operations there is ongoing focus on optimisation of delivery routes and consideration of distribution networks through the utilisation of routing and scheduling software throughout the Company, the deployment of onboard technology, advanced fuel management systems, more efficient engines and matching of loads to vehicles, as well as driver training academies, which all remain key issues in reducing fuel consumption and the Company’s carbon footprint.
• Emissions, effluents and waste – The Company is committed to an overall waste management strategy, reducing the use of raw materials, reducing waste, reusing waste wherever possible, and recycling waste that cannot be eliminated or reused. Key to managing waste is the monitoring and analysis of waste volumes and component parts to give the Company the information it needs to manage waste effectively. The Company also recognises its responsibility in terms of the Air Quality Act of 2004 and is committed to efficient and effective air quality management and thus ensures that all ovens, paraffin and oil-fired boilers, and boiler stacks are correctly operated, well maintained and routinely inspected. In addition the factories engage with approved inspection authorities and conduct air emission surveys. – Effluent management at the Snackworks’ factories
involves flocculation and removal of solids from the water, and reduction of the pH and chemical oxygen demand (“COD”) levels. At the distribution centres all vehicles are washed using biodegradable chemicals and grease traps are cleaned regularly to prevent contamination of the main sewer system. In general, waste materials are classified for possible reuse, recycling or disposal and disposals are done through registered waste disposal and recycling companies.
– Where appropriate the factories are installing new equipment and modifying old equipment in order to reduce emissions.
– I&J routinely recycles corrugated cartons, used sunflower oil and used marine oil. Entyce Beverages has implemented various initiatives to reduce the weight (and resultant waste) of packaging by downgauging of flexible packaging and tin and removing excess packaging. In addition it is encouraging consumers to recycle by including recycle logos and categorisation on packaging.
– Indigo Brands has committed itself to being part of the local government’s initiative regarding waste management for its sector. A site waste management survey has been completed which
will result in a formal waste management plan with the view to introducing waste reduction and management actions. In addition it recycles corrugated cartons, aerosol cans and glass bottles.
• Raw materials – The Company’s use of sustainable raw materials, including recycled and recyclable materials and materials derived from ethical and sustainable sources as certified by bodies such as the Roundtable on Sustainable Palm Oil (“RSPO”), the Forestry Stewardship Council (“FSC”) (for packaging materials produced from sustainable forests), the Convention on Biological Diversity, and the Right Rooibos initiative, is an integral part of the Company’s sustainability strategy. The Company is a member of and has representation on the Board of the South African Rooibos Council, a non-profit organisation whose goal is to protect the Rooibos industry and to ensure the sustainability of this scarce raw material. All of the palm oil procured by the Company is from RSPO-certified suppliers and the yellow maize procured for the manufacture of liquid glucose is certified free of genetically modified organisms. The high performance paperboard used in I&J retail packs is produced from a certified, renewable resource and all paperboard materials can be recycled multiple times. These retail cartons are packed into outer cartons supplied by local companies that meet the environmental management standard ISO 14001 and are certified by the FSC, and all I&J outer cartons are 100% recyclable. All paperboard materials used by National Brands are produced from sustainable forests which are FSC compliant, contain no heavy metals or mineral oils, and no fossil fuel energy is used in the production of these products. These materials are also 100% recyclable. Ciro sells a range of Fairtrade, Organic, Rain Forest Alliance and UTZ (an international standard for sustainable farming of coffee, cocoa and tea) certified products, and a partnership with Mbokomu Rural Cooperative Society in Tanzania assists farmers and farming communities to improve the quality of their coffee and improve processing to reduce waste.
Five non-compliance notices were issued to the Westmead biscuit factory by the eThekwini Municipality’s Pollution Control Division and Water and Sanitation Division for high COD and sugar levels in the wastewater. R1 000 fines were levied and paid for each notice. Non-compliance notices were issued to the I&J Value-Added Processing plant in Cape Town for contamination of the stormwater drain and to the I&J Fisheries Division for fuel spillage caused during fuelling operations on one of the fishing vessels. Fines of R1 000 and R50 000 respectively were issued and paid. Corrective actions were taken to remedy all non-compliances and to prevent future non-compliances. Other than the notices and fines referred
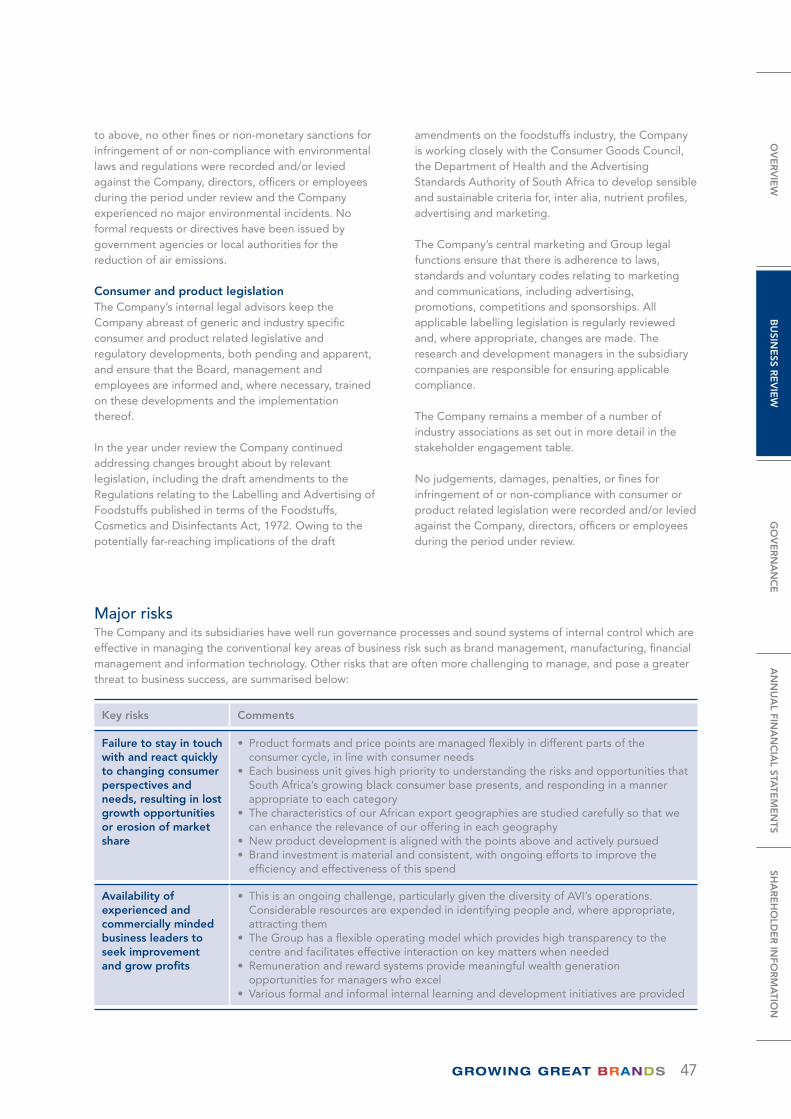
47
to above, no other fines or non-monetary sanctions for infringement of or non-compliance with environmental laws and regulations were recorded and/or levied against the Company, directors, officers or employees during the period under review and the Company experienced no major environmental incidents. No formal requests or directives have been issued by government agencies or local authorities for the reduction of air emissions.
Consumer and product legislation The Company’s internal legal advisors keep the Company abreast of generic and industry specific consumer and product related legislative and regulatory developments, both pending and apparent, and ensure that the Board, management and employees are informed and, where necessary, trained on these developments and the implementation thereof.
In the year under review the Company continued addressing changes brought about by relevant legislation, including the draft amendments to the Regulations relating to the Labelling and Advertising of Foodstuffs published in terms of the Foodstuffs, Cosmetics and Disinfectants Act, 1972. Owing to the potentially far-reaching implications of the draft
amendments on the foodstuffs industry, the Company is working closely with the Consumer Goods Council, the Department of Health and the Advertising Standards Authority of South Africa to develop sensible and sustainable criteria for, inter alia, nutrient profiles, advertising and marketing.
The Company’s central marketing and Group legal functions ensure that there is adherence to laws, standards and voluntary codes relating to marketing and communications, including advertising, promotions, competitions and sponsorships. All applicable labelling legislation is regularly reviewed and, where appropriate, changes are made. The research and development managers in the subsidiary companies are responsible for ensuring applicable compliance.
The Company remains a member of a number of industry associations as set out in more detail in the stakeholder engagement table.
No judgements, damages, penalties, or fines for infringement of or non-compliance with consumer or product related legislation were recorded and/or levied against the Company, directors, officers or employees during the period under review.
Major risks The Company and its subsidiaries have well run governance processes and sound systems of internal control which are effective in managing the conventional key areas of business risk such as brand management, manufacturing, financial management and information technology. Other risks that are often more challenging to manage, and pose a greater threat to business success, are summarised below:
Key risks Comments
Failure to stay in touch with and react quickly to changing consumer perspectives and needs, resulting in lost growth opportunities or erosion of market share
• Product formats and price points are managed flexibly in different parts of the consumer cycle, in line with consumer needs
• Each business unit gives high priority to understanding the risks and opportunities that South Africa’s growing black consumer base presents, and responding in a manner appropriate to each category
• The characteristics of our African export geographies are studied carefully so that we can enhance the relevance of our offering in each geography
• New product development is aligned with the points above and actively pursued• Brand investment is material and consistent, with ongoing efforts to improve the
efficiency and effectiveness of this spend
Availability of experienced and commercially minded business leaders to seek improvement and grow profits
• This is an ongoing challenge, particularly given the diversity of AVI’s operations. Considerable resources are expended in identifying people and, where appropriate, attracting them
• The Group has a flexible operating model which provides high transparency to the centre and facilitates effective interaction on key matters when needed
• Remuneration and reward systems provide meaningful wealth generation opportunities for managers who excel
• Various formal and informal internal learning and development initiatives are provided
OV
ER
VIE
WB
USIN
ESS R
EV
IEW
GO
VE
RN
AN
CE
AN
NU
AL FIN
AN
CIA
L STATE
ME
NTS
SHA
RE
HO
LDE
R IN
FOR
MA
TION
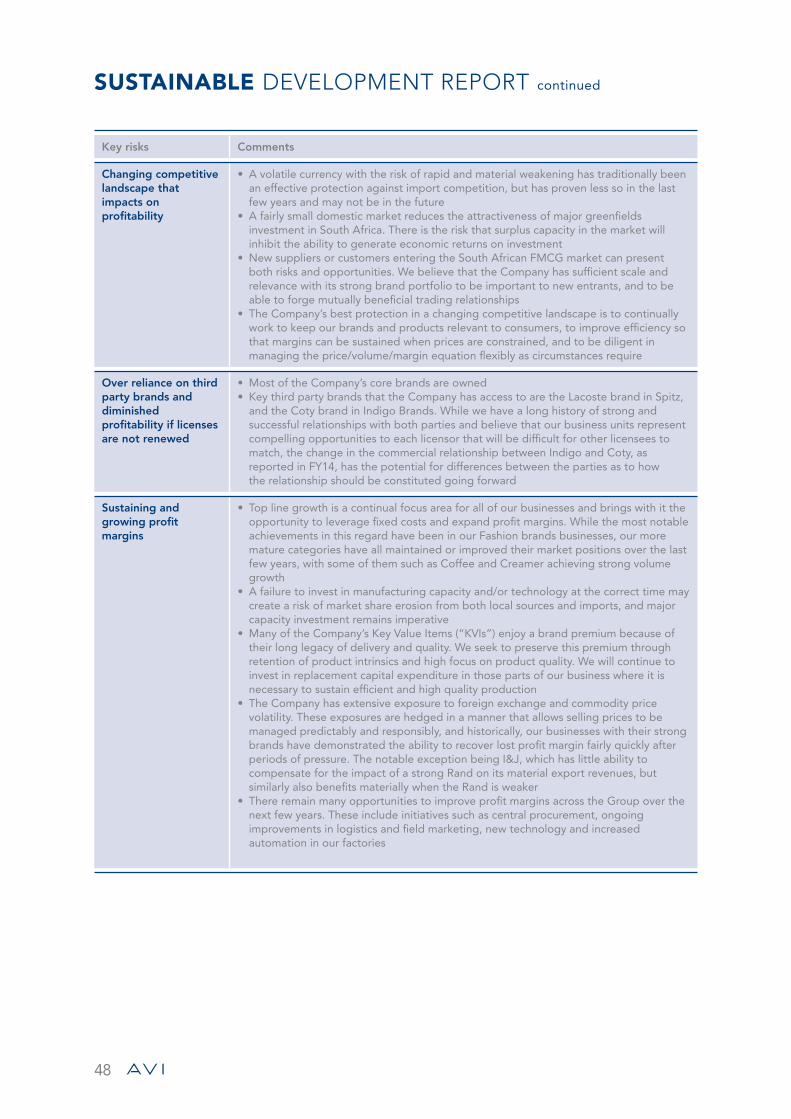
48
SUSTAINABLE DEVELOPMENT REPORT continued
Key risks Comments
Changing competitive landscape that impacts on profitability
• A volatile currency with the risk of rapid and material weakening has traditionally been an effective protection against import competition, but has proven less so in the last few years and may not be in the future
• A fairly small domestic market reduces the attractiveness of major greenfields investment in South Africa. There is the risk that surplus capacity in the market will inhibit the ability to generate economic returns on investment
• New suppliers or customers entering the South African FMCG market can present both risks and opportunities. We believe that the Company has sufficient scale and relevance with its strong brand portfolio to be important to new entrants, and to be able to forge mutually beneficial trading relationships
• The Company’s best protection in a changing competitive landscape is to continually work to keep our brands and products relevant to consumers, to improve efficiency so that margins can be sustained when prices are constrained, and to be diligent in managing the price/volume/margin equation flexibly as circumstances require
Over reliance on third party brands and diminished profitability if licenses are not renewed
• Most of the Company’s core brands are owned• Key third party brands that the Company has access to are the Lacoste brand in Spitz,
and the Coty brand in Indigo Brands. While we have a long history of strong and successful relationships with both parties and believe that our business units represent compelling opportunities to each licensor that will be difficult for other licensees to match, the change in the commercial relationship between Indigo and Coty, as reported in FY14, has the potential for differences between the parties as to how the relationship should be constituted going forward
Sustaining and growing profit margins
• Top line growth is a continual focus area for all of our businesses and brings with it the opportunity to leverage fixed costs and expand profit margins. While the most notable achievements in this regard have been in our Fashion brands businesses, our more mature categories have all maintained or improved their market positions over the last few years, with some of them such as Coffee and Creamer achieving strong volume growth
• A failure to invest in manufacturing capacity and/or technology at the correct time may create a risk of market share erosion from both local sources and imports, and major capacity investment remains imperative
• Many of the Company’s Key Value Items (“KVIs”) enjoy a brand premium because of their long legacy of delivery and quality. We seek to preserve this premium through retention of product intrinsics and high focus on product quality. We will continue to invest in replacement capital expenditure in those parts of our business where it is necessary to sustain efficient and high quality production
• The Company has extensive exposure to foreign exchange and commodity price volatility. These exposures are hedged in a manner that allows selling prices to be managed predictably and responsibly, and historically, our businesses with their strong brands have demonstrated the ability to recover lost profit margin fairly quickly after periods of pressure. The notable exception being I&J, which has little ability to compensate for the impact of a strong Rand on its material export revenues, but similarly also benefits materially when the Rand is weaker
• There remain many opportunities to improve profit margins across the Group over the next few years. These include initiatives such as central procurement, ongoing improvements in logistics and field marketing, new technology and increased automation in our factories
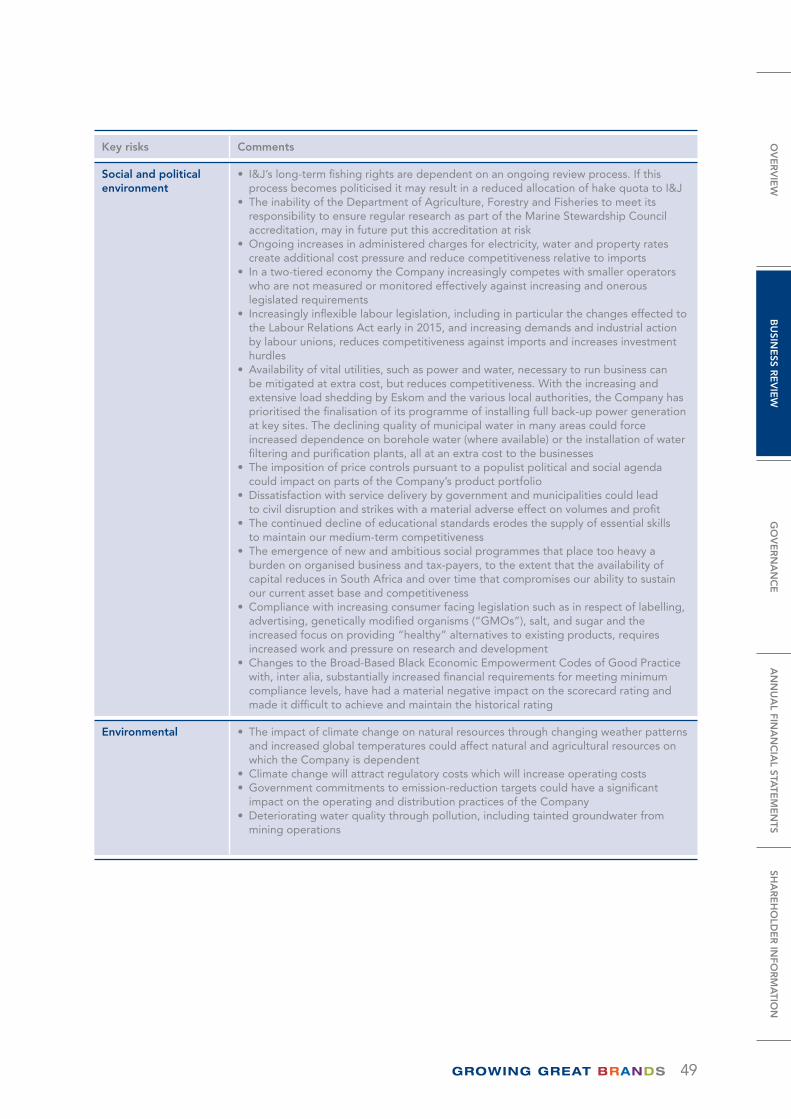
49
Key risks Comments
Social and political environment
• I&J’s long-term fishing rights are dependent on an ongoing review process. If this process becomes politicised it may result in a reduced allocation of hake quota to I&J
• The inability of the Department of Agriculture, Forestry and Fisheries to meet its responsibility to ensure regular research as part of the Marine Stewardship Council accreditation, may in future put this accreditation at risk
• Ongoing increases in administered charges for electricity, water and property rates create additional cost pressure and reduce competitiveness relative to imports
• In a two-tiered economy the Company increasingly competes with smaller operators who are not measured or monitored effectively against increasing and onerous legislated requirements
• Increasingly inflexible labour legislation, including in particular the changes effected to the Labour Relations Act early in 2015, and increasing demands and industrial action by labour unions, reduces competitiveness against imports and increases investment hurdles
• Availability of vital utilities, such as power and water, necessary to run business can be mitigated at extra cost, but reduces competitiveness. With the increasing and extensive load shedding by Eskom and the various local authorities, the Company has prioritised the finalisation of its programme of installing full back-up power generation at key sites. The declining quality of municipal water in many areas could force increased dependence on borehole water (where available) or the installation of water filtering and purification plants, all at an extra cost to the businesses
• The imposition of price controls pursuant to a populist political and social agenda could impact on parts of the Company’s product portfolio
• Dissatisfaction with service delivery by government and municipalities could lead to civil disruption and strikes with a material adverse effect on volumes and profit
• The continued decline of educational standards erodes the supply of essential skills to maintain our medium-term competitiveness
• The emergence of new and ambitious social programmes that place too heavy a burden on organised business and tax-payers, to the extent that the availability of capital reduces in South Africa and over time that compromises our ability to sustain our current asset base and competitiveness
• Compliance with increasing consumer facing legislation such as in respect of labelling, advertising, genetically modified organisms (“GMOs”), salt, and sugar and the increased focus on providing “healthy” alternatives to existing products, requires increased work and pressure on research and development
• Changes to the Broad-Based Black Economic Empowerment Codes of Good Practice with, inter alia, substantially increased financial requirements for meeting minimum compliance levels, have had a material negative impact on the scorecard rating and made it difficult to achieve and maintain the historical rating
Environmental • The impact of climate change on natural resources through changing weather patterns and increased global temperatures could affect natural and agricultural resources on which the Company is dependent
• Climate change will attract regulatory costs which will increase operating costs• Government commitments to emission-reduction targets could have a significant
impact on the operating and distribution practices of the Company• Deteriorating water quality through pollution, including tainted groundwater from
mining operations
OV
ER
VIE
WB
USIN
ESS R
EV
IEW
GO
VE
RN
AN
CE
AN
NU
AL FIN
AN
CIA
L STATE
ME
NTS
SHA
RE
HO
LDE
R IN
FOR
MA
TION
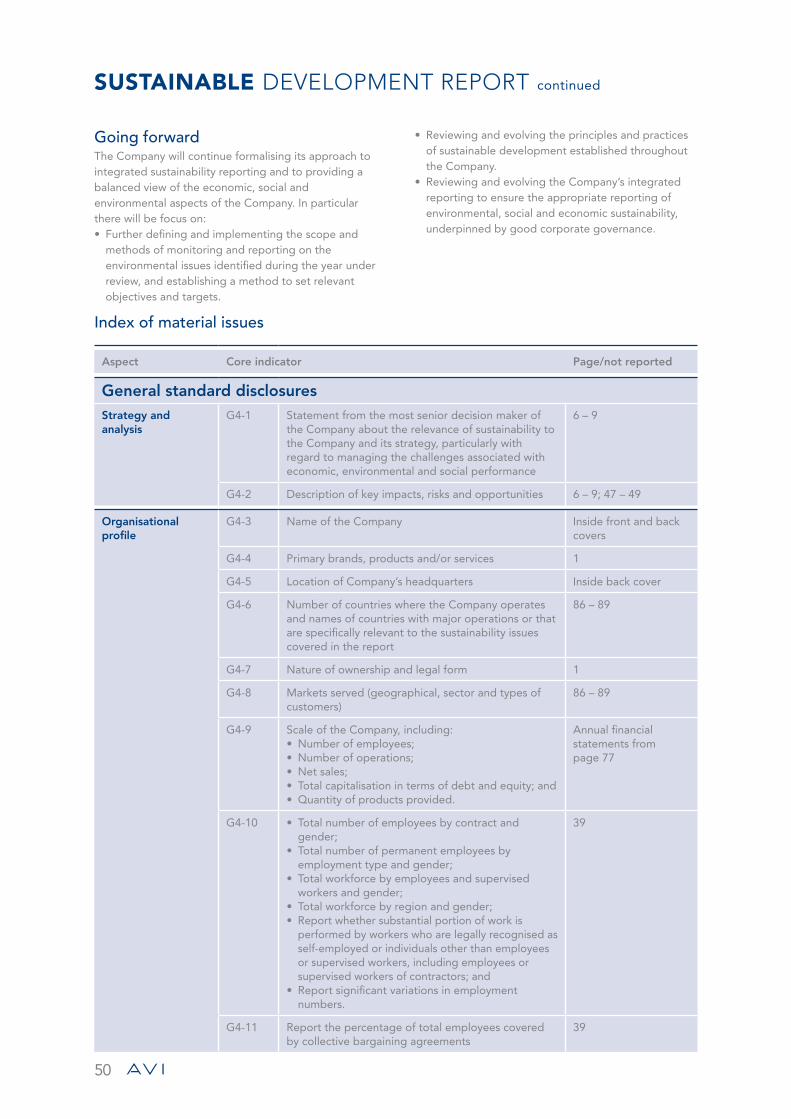
50
SUSTAINABLE DEVELOPMENT REPORT continued
Going forwardThe Company will continue formalising its approach to integrated sustainability reporting and to providing a balanced view of the economic, social and environmental aspects of the Company. In particular there will be focus on:• Further defining and implementing the scope and
methods of monitoring and reporting on the environmental issues identified during the year under review, and establishing a method to set relevant objectives and targets.
• Reviewing and evolving the principles and practices of sustainable development established throughout the Company.
• Reviewing and evolving the Company’s integrated reporting to ensure the appropriate reporting of environmental, social and economic sustainability, underpinned by good corporate governance.
Index of material issues
Aspect Core indicator Page/not reported
General standard disclosuresStrategy and analysis
G4-1 Statement from the most senior decision maker of the Company about the relevance of sustainability to the Company and its strategy, particularly with regard to managing the challenges associated with economic, environmental and social performance
6 – 9
G4-2 Description of key impacts, risks and opportunities 6 – 9; 47 – 49
Organisational profile
G4-3 Name of the Company Inside front and back covers
G4-4 Primary brands, products and/or services 1
G4-5 Location of Company’s headquarters Inside back cover
G4-6 Number of countries where the Company operates and names of countries with major operations or that are specifically relevant to the sustainability issues covered in the report
86 – 89
G4-7 Nature of ownership and legal form 1
G4-8 Markets served (geographical, sector and types of customers)
86 – 89
G4-9 Scale of the Company, including:• Number of employees;• Number of operations;• Net sales;• Total capitalisation in terms of debt and equity; and• Quantity of products provided.
Annual financial statements from page 77
G4-10 • Total number of employees by contract and gender;
• Total number of permanent employees by employment type and gender;
• Total workforce by employees and supervised workers and gender;
• Total workforce by region and gender;• Report whether substantial portion of work is
performed by workers who are legally recognised as self-employed or individuals other than employees or supervised workers, including employees or supervised workers of contractors; and
• Report significant variations in employment numbers.
39
G4-11 Report the percentage of total employees covered by collective bargaining agreements
39
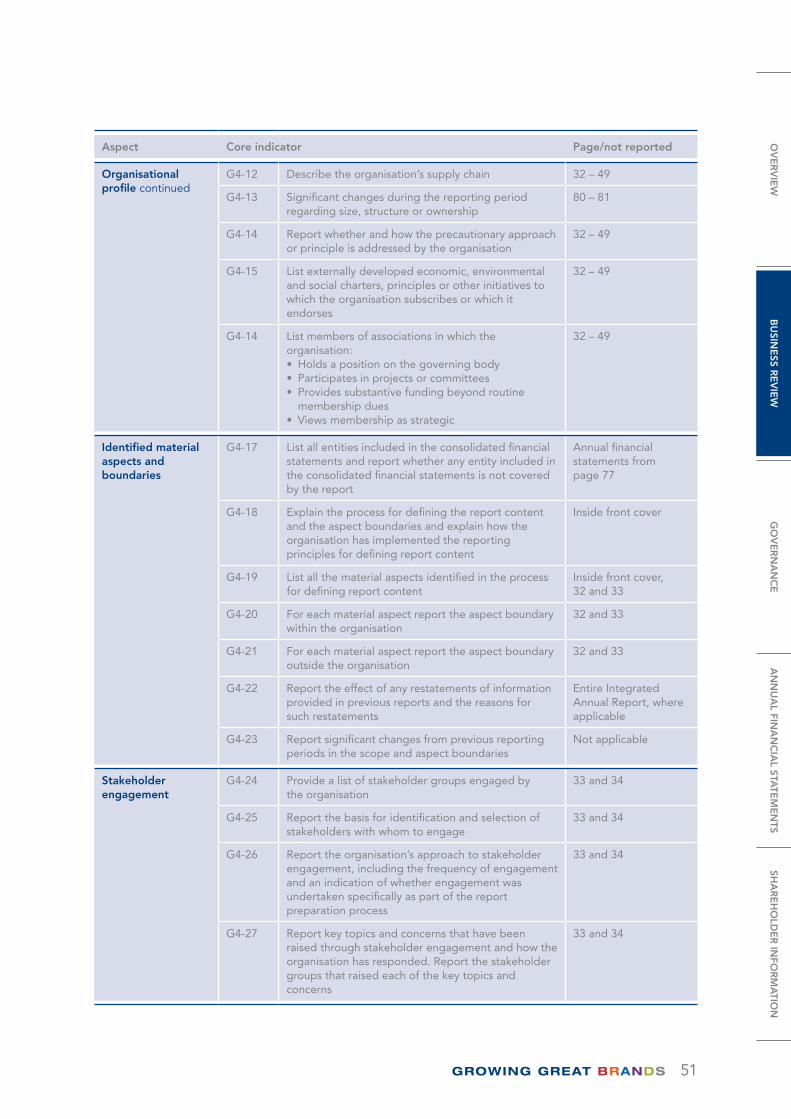
51
Aspect Core indicator Page/not reported
Organisational profile continued
G4-12 Describe the organisation’s supply chain 32 – 49
G4-13 Significant changes during the reporting period regarding size, structure or ownership
80 – 81
G4-14 Report whether and how the precautionary approach or principle is addressed by the organisation
32 – 49
G4-15 List externally developed economic, environmental and social charters, principles or other initiatives to which the organisation subscribes or which it endorses
32 – 49
G4-14 List members of associations in which the organisation:• Holds a position on the governing body• Participates in projects or committees• Provides substantive funding beyond routine
membership dues• Views membership as strategic
32 – 49
Identified material aspects and boundaries
G4-17 List all entities included in the consolidated financial statements and report whether any entity included in the consolidated financial statements is not covered by the report
Annual financial statements from page 77
G4-18 Explain the process for defining the report content and the aspect boundaries and explain how the organisation has implemented the reporting principles for defining report content
Inside front cover
G4-19 List all the material aspects identified in the process for defining report content
Inside front cover, 32 and 33
G4-20 For each material aspect report the aspect boundary within the organisation
32 and 33
G4-21 For each material aspect report the aspect boundary outside the organisation
32 and 33
G4-22 Report the effect of any restatements of information provided in previous reports and the reasons for such restatements
Entire Integrated Annual Report, where applicable
G4-23 Report significant changes from previous reporting periods in the scope and aspect boundaries
Not applicable
Stakeholder engagement
G4-24 Provide a list of stakeholder groups engaged by the organisation
33 and 34
G4-25 Report the basis for identification and selection of stakeholders with whom to engage
33 and 34
G4-26 Report the organisation’s approach to stakeholder engagement, including the frequency of engagement and an indication of whether engagement was undertaken specifically as part of the report preparation process
33 and 34
G4-27 Report key topics and concerns that have been raised through stakeholder engagement and how the organisation has responded. Report the stakeholder groups that raised each of the key topics and concerns
33 and 34
OV
ER
VIE
WB
USIN
ESS R
EV
IEW
GO
VE
RN
AN
CE
AN
NU
AL FIN
AN
CIA
L STATE
ME
NTS
SHA
RE
HO
LDE
R IN
FOR
MA
TION
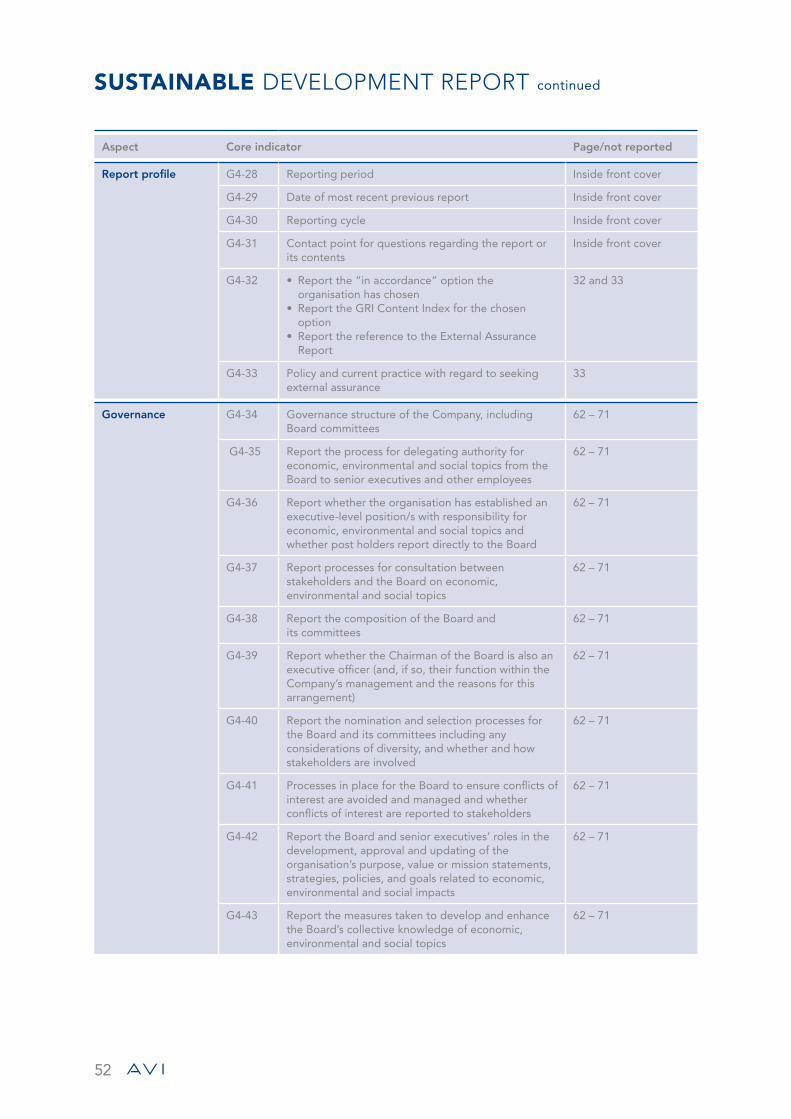
52
SUSTAINABLE DEVELOPMENT REPORT continued
Aspect Core indicator Page/not reported
Report profile G4-28 Reporting period Inside front cover
G4-29 Date of most recent previous report Inside front cover
G4-30 Reporting cycle Inside front cover
G4-31 Contact point for questions regarding the report or its contents
Inside front cover
G4-32 • Report the “in accordance” option the organisation has chosen
• Report the GRI Content Index for the chosen option
• Report the reference to the External Assurance Report
32 and 33
G4-33 Policy and current practice with regard to seeking external assurance
33
Governance G4-34 Governance structure of the Company, including Board committees
62 – 71
G4-35 Report the process for delegating authority for economic, environmental and social topics from the Board to senior executives and other employees
62 – 71
G4-36 Report whether the organisation has established an executive-level position/s with responsibility for economic, environmental and social topics and whether post holders report directly to the Board
62 – 71
G4-37 Report processes for consultation between stakeholders and the Board on economic, environmental and social topics
62 – 71
G4-38 Report the composition of the Board and its committees
62 – 71
G4-39 Report whether the Chairman of the Board is also an executive officer (and, if so, their function within the Company’s management and the reasons for this arrangement)
62 – 71
G4-40 Report the nomination and selection processes for the Board and its committees including any considerations of diversity, and whether and how stakeholders are involved
62 – 71
G4-41 Processes in place for the Board to ensure conflicts of interest are avoided and managed and whether conflicts of interest are reported to stakeholders
62 – 71
G4-42 Report the Board and senior executives’ roles in the development, approval and updating of the organisation’s purpose, value or mission statements, strategies, policies, and goals related to economic, environmental and social impacts
62 – 71
G4-43 Report the measures taken to develop and enhance the Board’s collective knowledge of economic, environmental and social topics
62 – 71
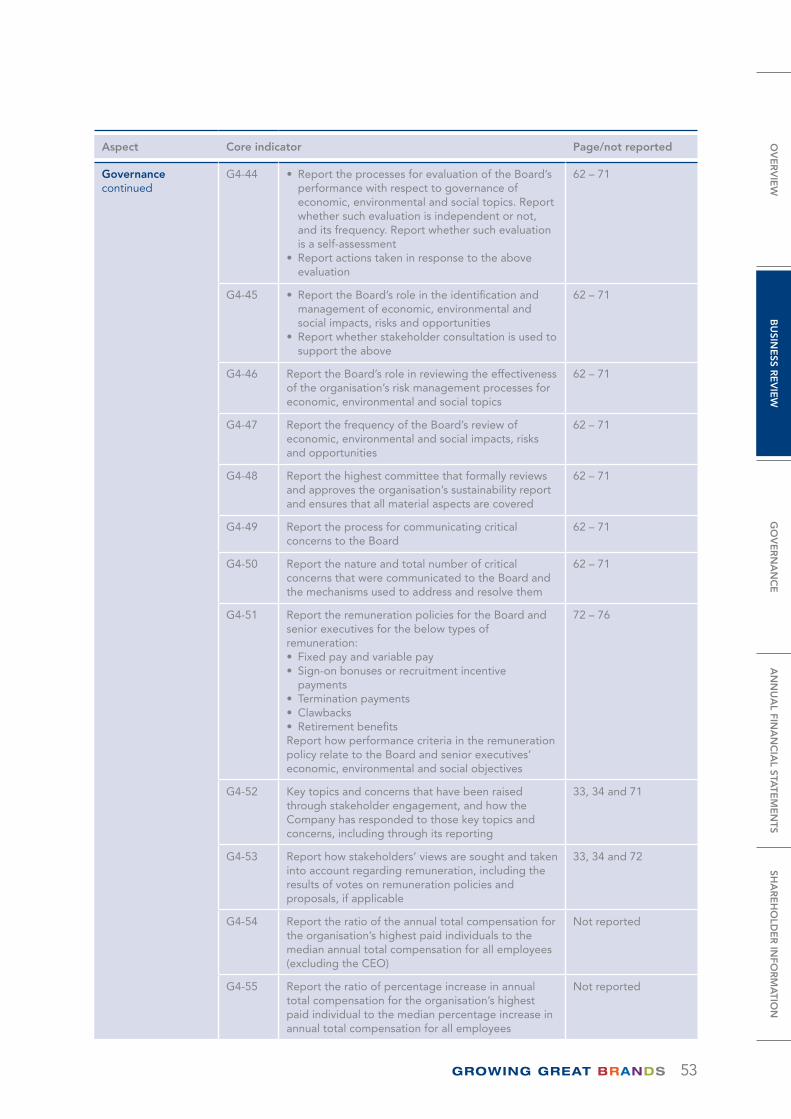
53
Aspect Core indicator Page/not reported
Governance continued
G4-44 • Report the processes for evaluation of the Board’s performance with respect to governance of economic, environmental and social topics. Report whether such evaluation is independent or not, and its frequency. Report whether such evaluation is a self-assessment
• Report actions taken in response to the above evaluation
62 – 71
G4-45 • Report the Board’s role in the identification and management of economic, environmental and social impacts, risks and opportunities
• Report whether stakeholder consultation is used to support the above
62 – 71
G4-46 Report the Board’s role in reviewing the effectiveness of the organisation’s risk management processes for economic, environmental and social topics
62 – 71
G4-47 Report the frequency of the Board’s review of economic, environmental and social impacts, risks and opportunities
62 – 71
G4-48 Report the highest committee that formally reviews and approves the organisation’s sustainability report and ensures that all material aspects are covered
62 – 71
G4-49 Report the process for communicating critical concerns to the Board
62 – 71
G4-50 Report the nature and total number of critical concerns that were communicated to the Board and the mechanisms used to address and resolve them
62 – 71
G4-51 Report the remuneration policies for the Board and senior executives for the below types of remuneration:• Fixed pay and variable pay• Sign-on bonuses or recruitment incentive
payments• Termination payments• Clawbacks• Retirement benefitsReport how performance criteria in the remuneration policy relate to the Board and senior executives’ economic, environmental and social objectives
72 – 76
G4-52 Key topics and concerns that have been raised through stakeholder engagement, and how the Company has responded to those key topics and concerns, including through its reporting
33, 34 and 71
G4-53 Report how stakeholders’ views are sought and taken into account regarding remuneration, including the results of votes on remuneration policies and proposals, if applicable
33, 34 and 72
G4-54 Report the ratio of the annual total compensation for the organisation’s highest paid individuals to the median annual total compensation for all employees (excluding the CEO)
Not reported
G4-55 Report the ratio of percentage increase in annual total compensation for the organisation’s highest paid individual to the median percentage increase in annual total compensation for all employees
Not reported
OV
ER
VIE
WB
USIN
ESS R
EV
IEW
GO
VE
RN
AN
CE
AN
NU
AL FIN
AN
CIA
L STATE
ME
NTS
SHA
RE
HO
LDE
R IN
FOR
MA
TION
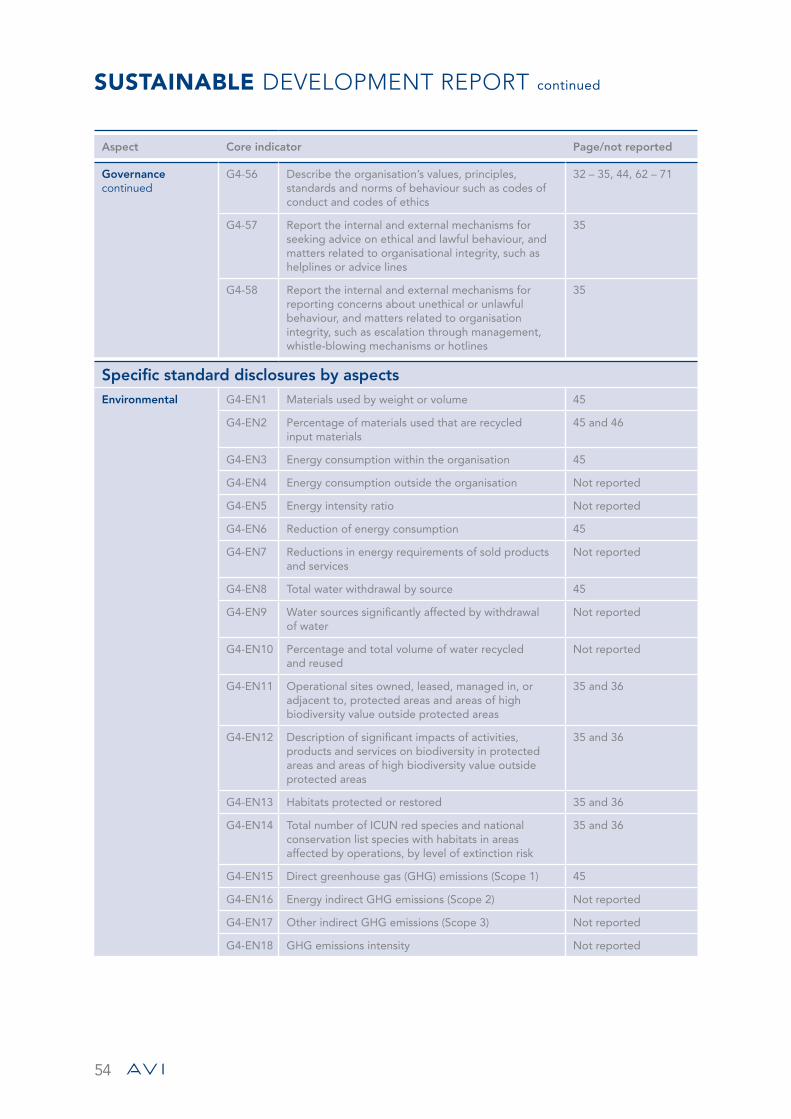
54
SUSTAINABLE DEVELOPMENT REPORT continued
Aspect Core indicator Page/not reported
Governance continued
G4-56 Describe the organisation’s values, principles, standards and norms of behaviour such as codes of conduct and codes of ethics
32 – 35, 44, 62 – 71
G4-57 Report the internal and external mechanisms for seeking advice on ethical and lawful behaviour, and matters related to organisational integrity, such as helplines or advice lines
35
G4-58 Report the internal and external mechanisms for reporting concerns about unethical or unlawful behaviour, and matters related to organisation integrity, such as escalation through management, whistle-blowing mechanisms or hotlines
35
Specific standard disclosures by aspectsEnvironmental G4-EN1 Materials used by weight or volume 45
G4-EN2 Percentage of materials used that are recycled input materials
45 and 46
G4-EN3 Energy consumption within the organisation 45
G4-EN4 Energy consumption outside the organisation Not reported
G4-EN5 Energy intensity ratio Not reported
G4-EN6 Reduction of energy consumption 45
G4-EN7 Reductions in energy requirements of sold products and services
Not reported
G4-EN8 Total water withdrawal by source 45
G4-EN9 Water sources significantly affected by withdrawal of water
Not reported
G4-EN10 Percentage and total volume of water recycled and reused
Not reported
G4-EN11 Operational sites owned, leased, managed in, or adjacent to, protected areas and areas of high biodiversity value outside protected areas
35 and 36
G4-EN12 Description of significant impacts of activities, products and services on biodiversity in protected areas and areas of high biodiversity value outside protected areas
35 and 36
G4-EN13 Habitats protected or restored 35 and 36
G4-EN14 Total number of ICUN red species and national conservation list species with habitats in areas affected by operations, by level of extinction risk
35 and 36
G4-EN15 Direct greenhouse gas (GHG) emissions (Scope 1) 45
G4-EN16 Energy indirect GHG emissions (Scope 2) Not reported
G4-EN17 Other indirect GHG emissions (Scope 3) Not reported
G4-EN18 GHG emissions intensity Not reported
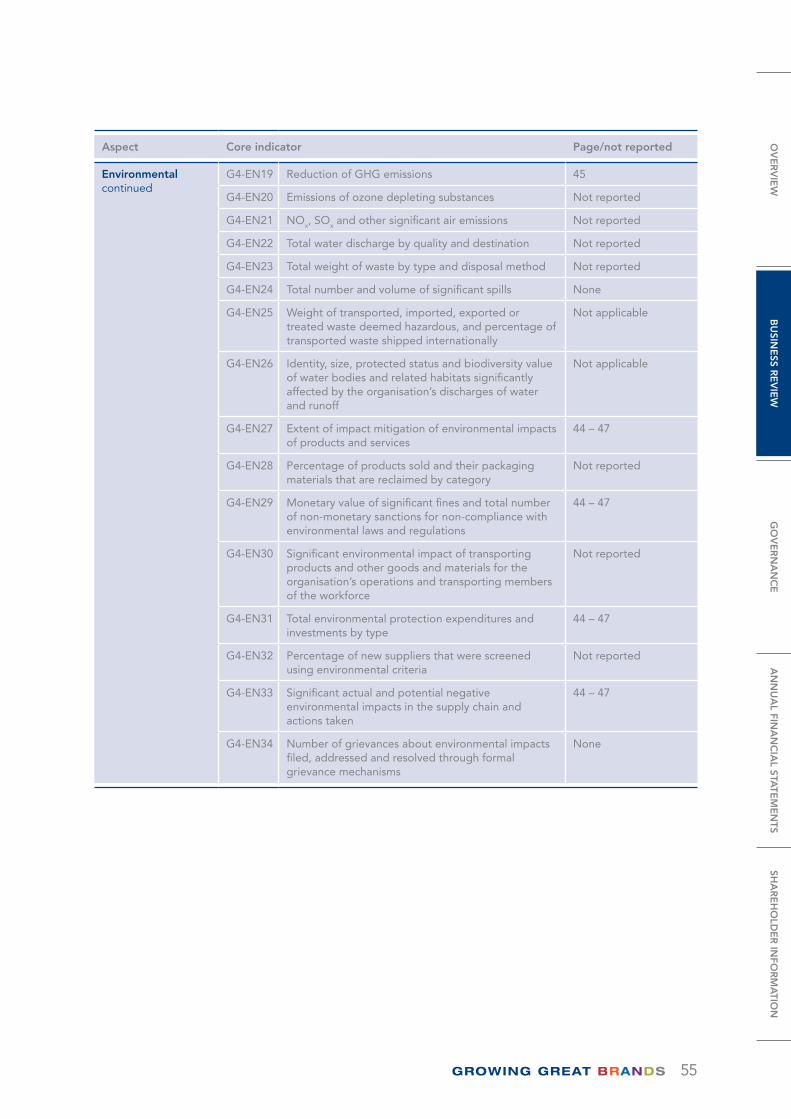
55
Aspect Core indicator Page/not reported
Environmental continued
G4-EN19 Reduction of GHG emissions 45
G4-EN20 Emissions of ozone depleting substances Not reported
G4-EN21 NOx, SOx and other significant air emissions Not reported
G4-EN22 Total water discharge by quality and destination Not reported
G4-EN23 Total weight of waste by type and disposal method Not reported
G4-EN24 Total number and volume of significant spills None
G4-EN25 Weight of transported, imported, exported or treated waste deemed hazardous, and percentage of transported waste shipped internationally
Not applicable
G4-EN26 Identity, size, protected status and biodiversity value of water bodies and related habitats significantly affected by the organisation’s discharges of water and runoff
Not applicable
G4-EN27 Extent of impact mitigation of environmental impacts of products and services
44 – 47
G4-EN28 Percentage of products sold and their packaging materials that are reclaimed by category
Not reported
G4-EN29 Monetary value of significant fines and total number of non-monetary sanctions for non-compliance with environmental laws and regulations
44 – 47
G4-EN30 Significant environmental impact of transporting products and other goods and materials for the organisation’s operations and transporting members of the workforce
Not reported
G4-EN31 Total environmental protection expenditures and investments by type
44 – 47
G4-EN32 Percentage of new suppliers that were screened using environmental criteria
Not reported
G4-EN33 Significant actual and potential negative environmental impacts in the supply chain and actions taken
44 – 47
G4-EN34 Number of grievances about environmental impacts filed, addressed and resolved through formal grievance mechanisms
None
OV
ER
VIE
WB
USIN
ESS R
EV
IEW
GO
VE
RN
AN
CE
AN
NU
AL FIN
AN
CIA
L STATE
ME
NTS
SHA
RE
HO
LDE
R IN
FOR
MA
TION
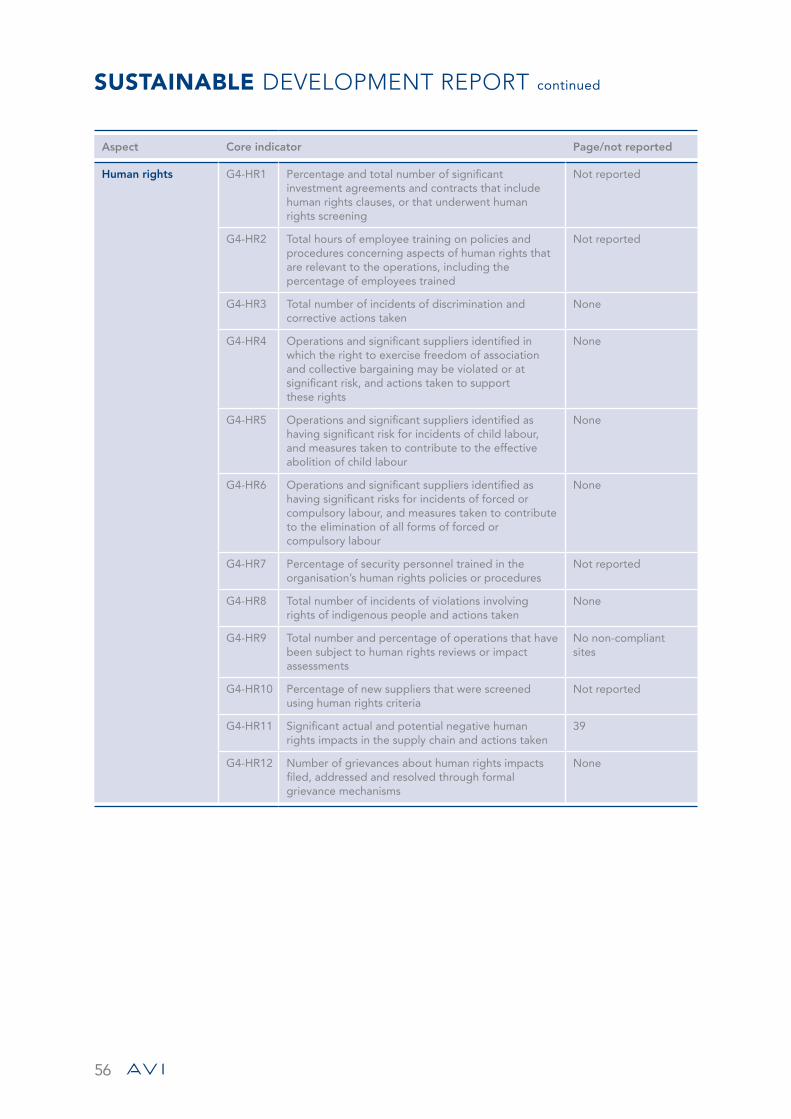
56
SUSTAINABLE DEVELOPMENT REPORT continued
Aspect Core indicator Page/not reported
Human rights G4-HR1 Percentage and total number of significant investment agreements and contracts that include human rights clauses, or that underwent human rights screening
Not reported
G4-HR2 Total hours of employee training on policies and procedures concerning aspects of human rights that are relevant to the operations, including the percentage of employees trained
Not reported
G4-HR3 Total number of incidents of discrimination and corrective actions taken
None
G4-HR4 Operations and significant suppliers identified in which the right to exercise freedom of association and collective bargaining may be violated or at significant risk, and actions taken to support these rights
None
G4-HR5 Operations and significant suppliers identified as having significant risk for incidents of child labour, and measures taken to contribute to the effective abolition of child labour
None
G4-HR6 Operations and significant suppliers identified as having significant risks for incidents of forced or compulsory labour, and measures taken to contribute to the elimination of all forms of forced or compulsory labour
None
G4-HR7 Percentage of security personnel trained in the organisation’s human rights policies or procedures
Not reported
G4-HR8 Total number of incidents of violations involving rights of indigenous people and actions taken
None
G4-HR9 Total number and percentage of operations that have been subject to human rights reviews or impact assessments
No non-compliant sites
G4-HR10 Percentage of new suppliers that were screened using human rights criteria
Not reported
G4-HR11 Significant actual and potential negative human rights impacts in the supply chain and actions taken
39
G4-HR12 Number of grievances about human rights impacts filed, addressed and resolved through formal grievance mechanisms
None

57
Aspect Core indicator Page/not reported
Labour practices and decent work
G4-LA1 Benefits provided to full-time employees that are not provided to temporary or part-time employees
Comply with labour and employment legislation and collective agreements
G4-LA2 Return to work and retention rates after parental leave, by gender
Comply with labour and employment legislation and collective agreements
G4-LA3 Minimum notice periods regarding operational changes, including whether these are specified in collective agreements
Comply with labour and employment legislation and collective agreements
G4-LA4 Percentage of total workforce represented in formal joint management-worker health and safety committees that help monitor and advise on occupational health and safety programmes
Comply with labour and employment legislation and collective agreements
G4-LA5 Type of injury and rates of injury, occupational diseases, lost days, and absenteeism and total number of work-related fatalities
40
G4-LA6 Workers with high incidence or high rates of diseases related to their occupation
Not reported
G4-LA7 Health and safety topics covered in formal agreements with trade unions
Comply with labour and employment legislation and collective agreements
G4-LA8 Average hours of training per year per employee, by gender and by employee category
38 and 39
G4-LA9 Programmes for skills management and life long learning that support the continued employability of employees and assist them in managing career endings
38 and 39
G4-LA10 Percentage of employees receiving regular performance and career development reviews, by gender and by employee category
Not reported
G4-LA11 Composition of governance bodies and breakdown of employees per employee category by gender, age, minority group membership, and other indicators of diversity
39, 62 – 65
G4-LA12 Ratio of basic salary and remuneration of women to men by employee category
Not reported
G4-LA13 Percentage of new suppliers that were screened using labour practices criteria
Not reported
G4-LA14 Significant actual and potential negative impacts for labour practices
Not reported
G4-LA15 Number of grievances about labour practices filed, addressed and resolved through formal grievance mechanisms
Not reported
G4-LA16 Percentage and total number of business units analysed for risks related to corruption
100%
OV
ER
VIE
WB
USIN
ESS R
EV
IEW
GO
VE
RN
AN
CE
AN
NU
AL FIN
AN
CIA
L STATE
ME
NTS
SHA
RE
HO
LDE
R IN
FOR
MA
TION
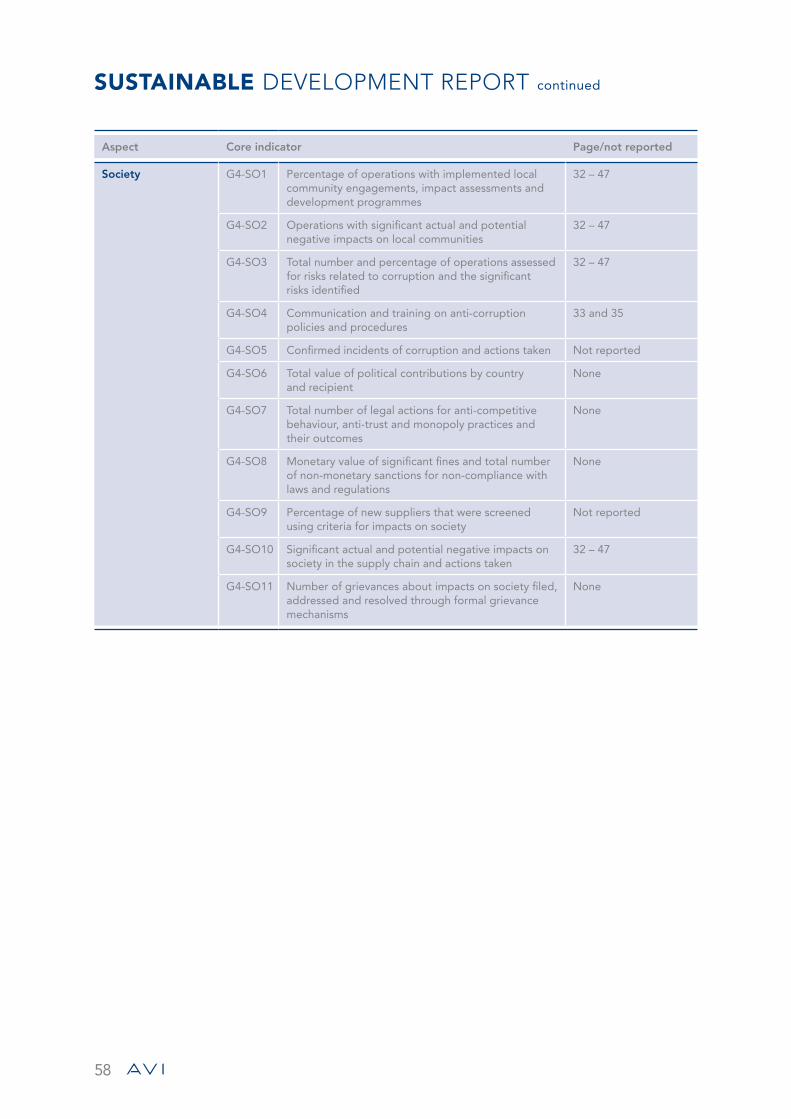
58
SUSTAINABLE DEVELOPMENT REPORT continued
Aspect Core indicator Page/not reported
Society G4-SO1 Percentage of operations with implemented local community engagements, impact assessments and development programmes
32 – 47
G4-SO2 Operations with significant actual and potential negative impacts on local communities
32 – 47
G4-SO3 Total number and percentage of operations assessed for risks related to corruption and the significant risks identified
32 – 47
G4-SO4 Communication and training on anti-corruption policies and procedures
33 and 35
G4-SO5 Confirmed incidents of corruption and actions taken Not reported
G4-SO6 Total value of political contributions by country and recipient
None
G4-SO7 Total number of legal actions for anti-competitive behaviour, anti-trust and monopoly practices and their outcomes
None
G4-SO8 Monetary value of significant fines and total number of non-monetary sanctions for non-compliance with laws and regulations
None
G4-SO9 Percentage of new suppliers that were screened using criteria for impacts on society
Not reported
G4-SO10 Significant actual and potential negative impacts on society in the supply chain and actions taken
32 – 47
G4-SO11 Number of grievances about impacts on society filed, addressed and resolved through formal grievance mechanisms
None
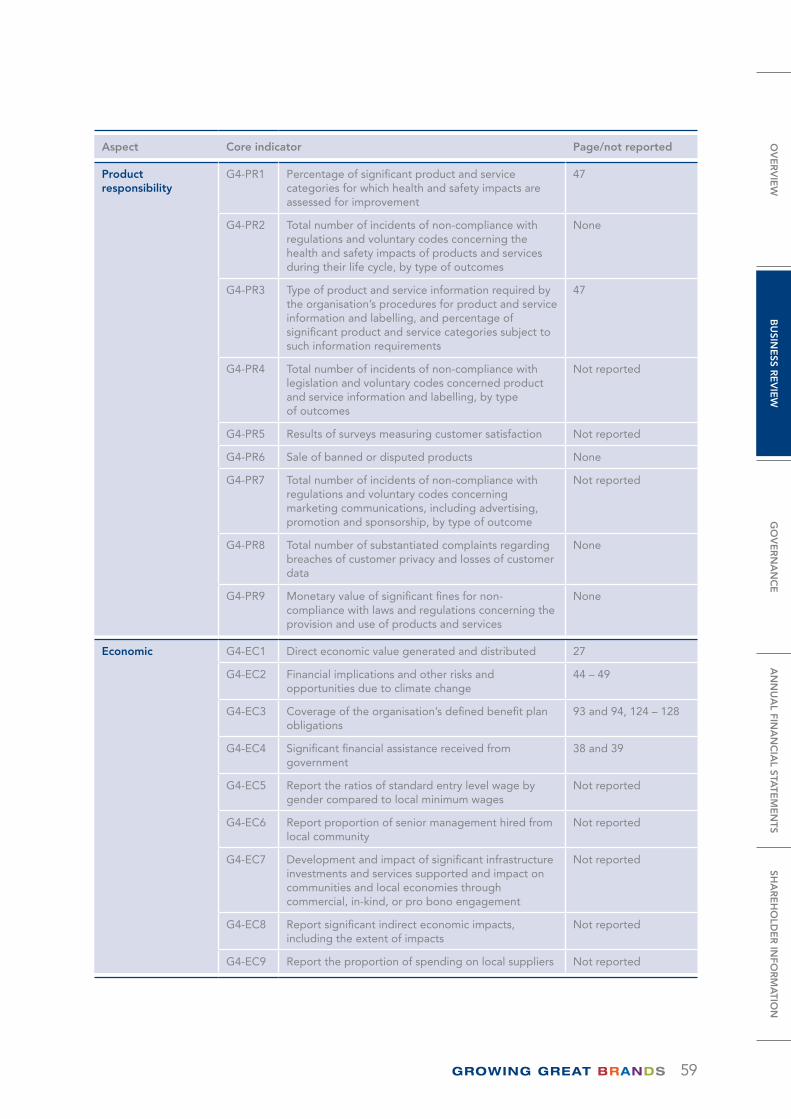
59
Aspect Core indicator Page/not reported
Product responsibility
G4-PR1 Percentage of significant product and service categories for which health and safety impacts are assessed for improvement
47
G4-PR2 Total number of incidents of non-compliance with regulations and voluntary codes concerning the health and safety impacts of products and services during their life cycle, by type of outcomes
None
G4-PR3 Type of product and service information required by the organisation’s procedures for product and service information and labelling, and percentage of significant product and service categories subject to such information requirements
47
G4-PR4 Total number of incidents of non-compliance with legislation and voluntary codes concerned product and service information and labelling, by type of outcomes
Not reported
G4-PR5 Results of surveys measuring customer satisfaction Not reported
G4-PR6 Sale of banned or disputed products None
G4-PR7 Total number of incidents of non-compliance with regulations and voluntary codes concerning marketing communications, including advertising, promotion and sponsorship, by type of outcome
Not reported
G4-PR8 Total number of substantiated complaints regarding breaches of customer privacy and losses of customer data
None
G4-PR9 Monetary value of significant fines for non-compliance with laws and regulations concerning the provision and use of products and services
None
Economic G4-EC1 Direct economic value generated and distributed 27
G4-EC2 Financial implications and other risks and opportunities due to climate change
44 – 49
G4-EC3 Coverage of the organisation’s defined benefit plan obligations
93 and 94, 124 – 128
G4-EC4 Significant financial assistance received from government
38 and 39
G4-EC5 Report the ratios of standard entry level wage by gender compared to local minimum wages
Not reported
G4-EC6 Report proportion of senior management hired from local community
Not reported
G4-EC7 Development and impact of significant infrastructure investments and services supported and impact on communities and local economies through commercial, in-kind, or pro bono engagement
Not reported
G4-EC8 Report significant indirect economic impacts, including the extent of impacts
Not reported
G4-EC9 Report the proportion of spending on local suppliers Not reported
OV
ER
VIE
WB
USIN
ESS R
EV
IEW
GO
VE
RN
AN
CE
AN
NU
AL FIN
AN
CIA
L STATE
ME
NTS
SHA
RE
HO
LDE
R IN
FOR
MA
TION
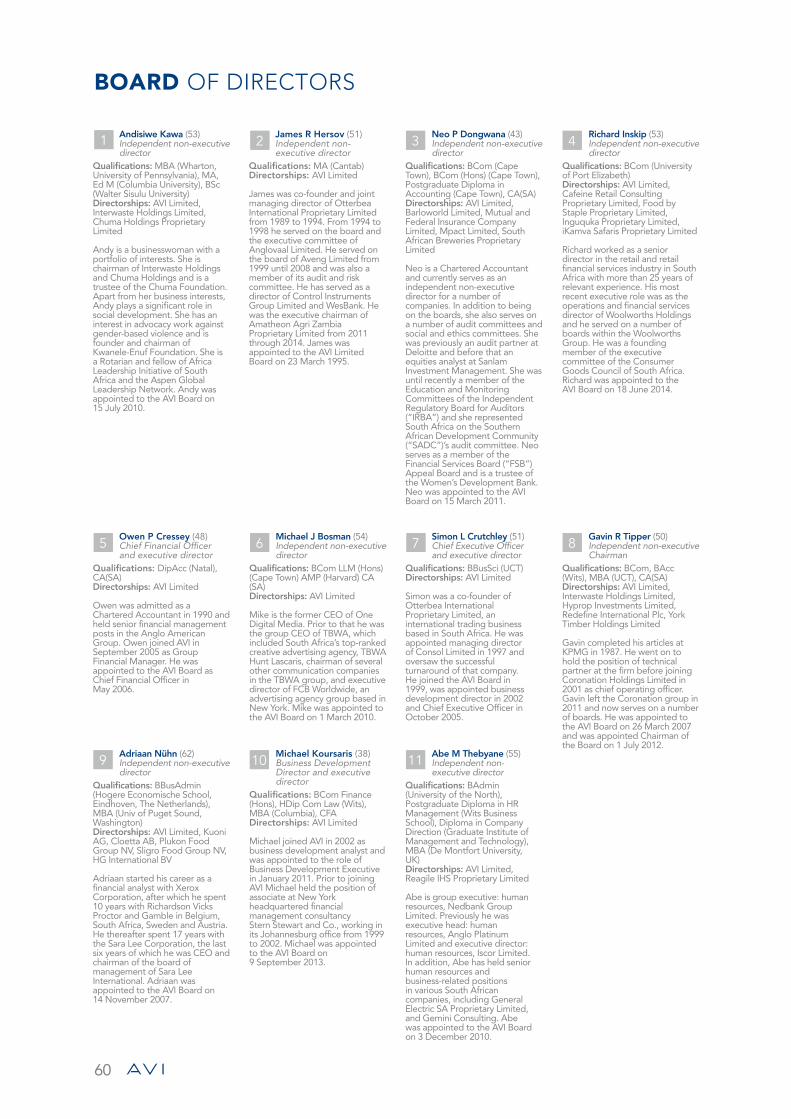
60
BOARD OF DIRECTORS
Andisiwe Kawa (53) Independent non-executive
directorQualifications: MBA (Wharton, University of Pennsylvania), MA, Ed M (Columbia University), BSc (Walter Sisulu University)Directorships: AVI Limited, Interwaste Holdings Limited, Chuma Holdings Proprietary Limited
Andy is a businesswoman with a portfolio of interests. She is chairman of Interwaste Holdings and Chuma Holdings and is a trustee of the Chuma Foundation. Apart from her business interests, Andy plays a significant role in social development. She has an interest in advocacy work against gender-based violence and is founder and chairman of Kwanele-Enuf Foundation. She is a Rotarian and fellow of Africa Leadership Initiative of South Africa and the Aspen Global Leadership Network. Andy was appointed to the AVI Board on 15 July 2010.
1 Richard Inskip (53) Independent non-executive
directorQualifications: BCom (University of Port Elizabeth)Directorships: AVI Limited, Cafeine Retail Consulting Proprietary Limited, Food by Staple Proprietary Limited, Inguquka Proprietary Limited, iKamva Safaris Proprietary Limited
Richard worked as a senior director in the retail and retail financial services industry in South Africa with more than 25 years of relevant experience. His most recent executive role was as the operations and financial services director of Woolworths Holdings and he served on a number of boards within the Woolworths Group. He was a founding member of the executive committee of the Consumer Goods Council of South Africa. Richard was appointed to the AVI Board on 18 June 2014.
4 Neo P Dongwana (43) Independent non-executive
directorQualifications: BCom (Cape Town), BCom (Hons) (Cape Town), Postgraduate Diploma in Accounting (Cape Town), CA(SA)Directorships: AVI Limited, Barloworld Limited, Mutual and Federal Insurance Company Limited, Mpact Limited, South African Breweries Proprietary Limited
Neo is a Chartered Accountant and currently serves as an independent non-executive director for a number of companies. In addition to being on the boards, she also serves on a number of audit committees and social and ethics committees. She was previously an audit partner at Deloitte and before that an equities analyst at Sanlam Investment Management. She was until recently a member of the Education and Monitoring Committees of the Independent Regulatory Board for Auditors (“IRBA”) and she represented South Africa on the Southern African Development Community (“SADC”)’s audit committee. Neo serves as a member of the Financial Services Board (“FSB”) Appeal Board and is a trustee of the Women’s Development Bank. Neo was appointed to the AVI Board on 15 March 2011.
3
Gavin R Tipper (50) Independent non-executive
ChairmanQualifications: BCom, BAcc (Wits), MBA (UCT), CA(SA)Directorships: AVI Limited, Interwaste Holdings Limited, Hyprop Investments Limited, Redefine International Plc, York Timber Holdings Limited
Gavin completed his articles at KPMG in 1987. He went on to hold the position of technical partner at the firm before joining Coronation Holdings Limited in 2001 as chief operating officer. Gavin left the Coronation group in 2011 and now serves on a number of boards. He was appointed to the AVI Board on 26 March 2007 and was appointed Chairman of the Board on 1 July 2012.
8 Michael J Bosman (54) Independent non-executive
directorQualifications: BCom LLM (Hons) (Cape Town) AMP (Harvard) CA (SA)Directorships: AVI Limited
Mike is the former CEO of One Digital Media. Prior to that he was the group CEO of TBWA, which included South Africa’s top-ranked creative advertising agency, TBWA Hunt Lascaris, chairman of several other communication companies in the TBWA group, and executive director of FCB Worldwide, an advertising agency group based in New York. Mike was appointed to the AVI Board on 1 March 2010.
6 Simon L Crutchley (51) Chief Executive Officer
and executive directorQualifications: BBusSci (UCT)Directorships: AVI Limited
Simon was a co-founder of Otterbea International Proprietary Limited, an international trading business based in South Africa. He was appointed managing director of Consol Limited in 1997 and oversaw the successful turnaround of that company. He joined the AVI Board in 1999, was appointed business development director in 2002 and Chief Executive Officer in October 2005.
7 Owen P Cressey (48) Chief Financial Officer
and executive directorQualifications: DipAcc (Natal), CA(SA)Directorships: AVI Limited
Owen was admitted as a Chartered Accountant in 1990 and held senior financial management posts in the Anglo American Group. Owen joined AVI in September 2005 as Group Financial Manager. He was appointed to the AVI Board as Chief Financial Officer in May 2006.
5
Adriaan Nühn (62) Independent non-executive
directorQualifications: BBusAdmin (Hogere Economische School, Eindhoven, The Netherlands), MBA (Univ of Puget Sound, Washington)Directorships: AVI Limited, Kuoni AG, Cloetta AB, Plukon Food Group NV, Sligro Food Group NV, HG International BV
Adriaan started his career as a financial analyst with Xerox Corporation, after which he spent 10 years with Richardson Vicks Proctor and Gamble in Belgium, South Africa, Sweden and Austria. He thereafter spent 17 years with the Sara Lee Corporation, the last six years of which he was CEO and chairman of the board of management of Sara Lee International. Adriaan was appointed to the AVI Board on 14 November 2007.
9 Abe M Thebyane (55) Independent non-
executive directorQualifications: BAdmin (University of the North), Postgraduate Diploma in HR Management (Wits Business School), Diploma in Company Direction (Graduate Institute of Management and Technology), MBA (De Montfort University, UK)Directorships: AVI Limited, Reagile IHS Proprietary Limited
Abe is group executive: human resources, Nedbank Group Limited. Previously he was executive head: human resources, Anglo Platinum Limited and executive director: human resources, Iscor Limited. In addition, Abe has held senior human resources and business-related positions in various South African companies, including General Electric SA Proprietary Limited, and Gemini Consulting. Abe was appointed to the AVI Board on 3 December 2010.
11 Michael Koursaris (38) Business Development
Director and executive director
Qualifications: BCom Finance (Hons), HDip Com Law (Wits), MBA (Columbia), CFADirectorships: AVI Limited
Michael joined AVI in 2002 as business development analyst and was appointed to the role of Business Development Executive in January 2011. Prior to joining AVI Michael held the position of associate at New York headquartered financial management consultancy Stern Stewart and Co., working in its Johannesburg office from 1999 to 2002. Michael was appointed to the AVI Board on 9 September 2013.
10
James R Hersov (51) Independent non-
executive directorQualifications: MA (Cantab)Directorships: AVI Limited
James was co-founder and joint managing director of Otterbea International Proprietary Limited from 1989 to 1994. From 1994 to 1998 he served on the board and the executive committee of Anglovaal Limited. He served on the board of Aveng Limited from 1999 until 2008 and was also a member of its audit and risk committee. He has served as a director of Control Instruments Group Limited and WesBank. He was the executive chairman of Amatheon Agri Zambia Proprietary Limited from 2011 through 2014. James was appointed to the AVI Limited Board on 23 March 1995.
2
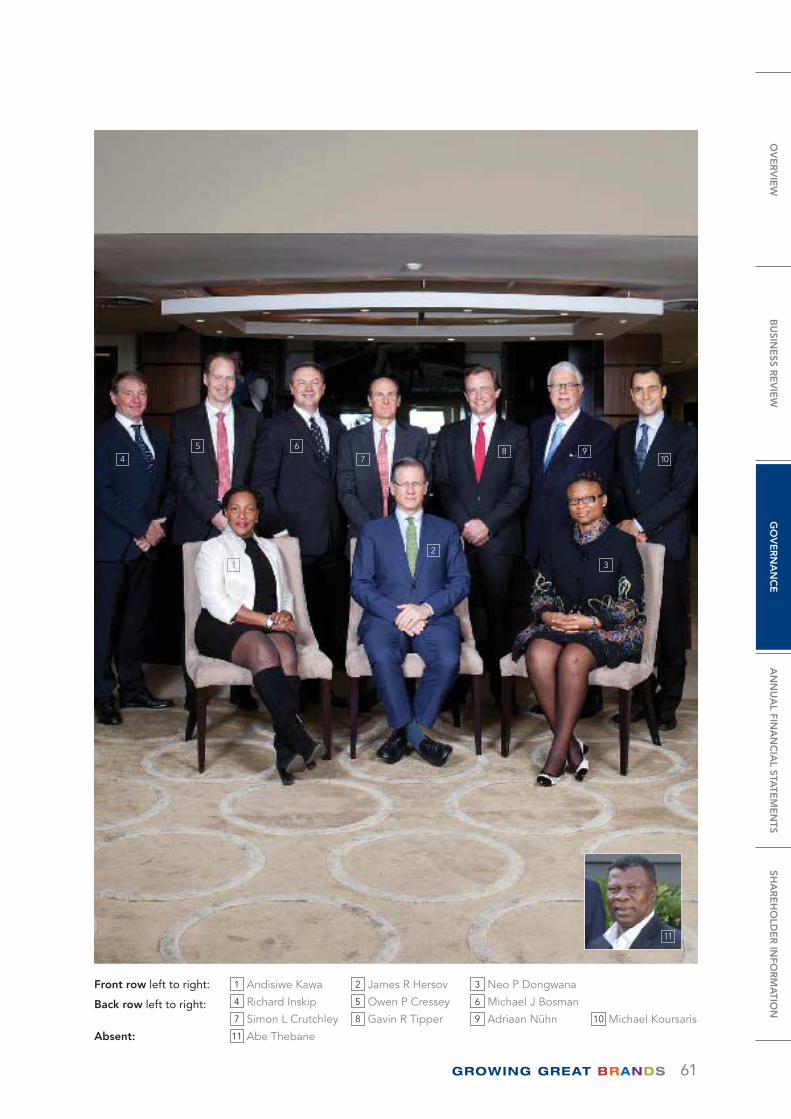
61
Front row left to right: 1 Andisiwe Kawa 2 James R Hersov 3 Neo P Dongwana
Back row left to right: 4 Richard Inskip 5 Owen P Cressey 6 Michael J Bosman
7 Simon L Crutchley 8 Gavin R Tipper 9 Adriaan Nühn 10 Michael Koursaris
Absent: 11 Abe Thebane
OV
ER
VIE
WB
USIN
ESS R
EV
IEW
GO
VE
RN
AN
CE
AN
NU
AL FIN
AN
CIA
L STATE
ME
NTS
SHA
RE
HO
LDE
R IN
FOR
MA
TION
62
FrameworkAVI Limited (“the Company”) is a public company incorporated in South Africa under the provisions of the Companies Act No 71 of 2008, as amended, and the Regulations thereto (“the Companies Act”) and is listed on the JSE Limited (“the JSE”).
The Company’s Board of directors (“the Board”) is committed to ensuring that the Company is governed appropriately. The Board recognises the responsibility of the Company to conduct its affairs with prudence, transparency, accountability, fairness and in a socially and environmentally responsible manner. The Company complies with the provisions of the Companies Act, and the JSE Listings Requirements, and the principles of the Code of Corporate Governance Principles and Practices as recommended in the King Report on Governance for South Africa 2009 (“King IIl”).
Board governance structureThe general powers of the Board and the directors are conferred in the Company’s Memorandum of Incorporation. Terms of reference for the Board are set out in the Company’s Board charter which is reviewed periodically. The charter covers the powers and authority of the Board and provides a clear and concise overview of the responsibilities and accountability of Board members, collectively and individually. It includes the policy and procedures for appointments to the Board as assisted by the Remuneration, Nomination and Appointments Committee. Appointments to the Board are done in a formal and transparent manner and are a matter for the Board as a whole. The Board charter is available on request from the Company Secretary.
To ensure conflicts of interest are avoided the Board members annually provide a general disclosure of their personal financial interests in terms of section 75 of the Companies Act, and are reminded at the commencement of every Board and Board committee meeting that they are required to declare any material personal financial interests that they may have in contracts entered into or authorised by the Company or in any matters to be discussed at the meeting, as well as any changes to their interests as previously declared.
The Board has adopted a unitary structure and no individual member of the Board has unfettered powers of decision making. The responsibility for running the Board and executive responsibility for the conduct of the business are differentiated in the Board charter. Accordingly the roles of the Chairman of the Board and of the Chief Executive Officer are separated, with Gavin Tipper and Simon Crutchley, respectively, holding these positions for the year under review.
DirectorateAs at 30 June 2015 the Board comprised three executive directors and eight non-executive directors. All of the non-executive directors are independent as defined by King lII and have the required knowledge, skills and independence of thought to pass sound judgement on the key issues relevant to the business of the Company, independent of the Company’s management. Consideration is given to gender and racial diversity, as well as diversity in business, geographic and academic backgrounds, when appointing directors. Tailored induction programmes are run to familiarise newly appointed directors with the Group’s operations. The particulars of the directors are set out in the Board of directors’ section of this Integrated Annual Report.
Barry Smith resigned as an independent non-executive director on 30 October 2014.
Richard Inskip was appointed as an independent non-executive director on 18 June 2014 and his appointment was considered by shareholders at the Company’s Annual General Meeting on 30 October 2014.
At least one-third of the Board’s members retire each year at the Annual General Meeting in terms of the Company’s Memorandum of Incorporation. Retiring directors are eligible for re-election.
Board and director assessmentThe Board is required to assess its performance against its charter requirements on an annual basis. The assessment was done and it was found that in all material respects the Board complied with these requirements. The Chairman continued to monitor and manage the participation of the Board’s members, and considered the development requirements, if any, of each director.
In addition, during the year under review, the Board independently considered the performance of the Chairman and Chief Executive Officer. The Chairman and the Chief Executive Officer did not participate in the Board’s discussions regarding their own performance.
CORPORATE GOVERNANCE REPORT
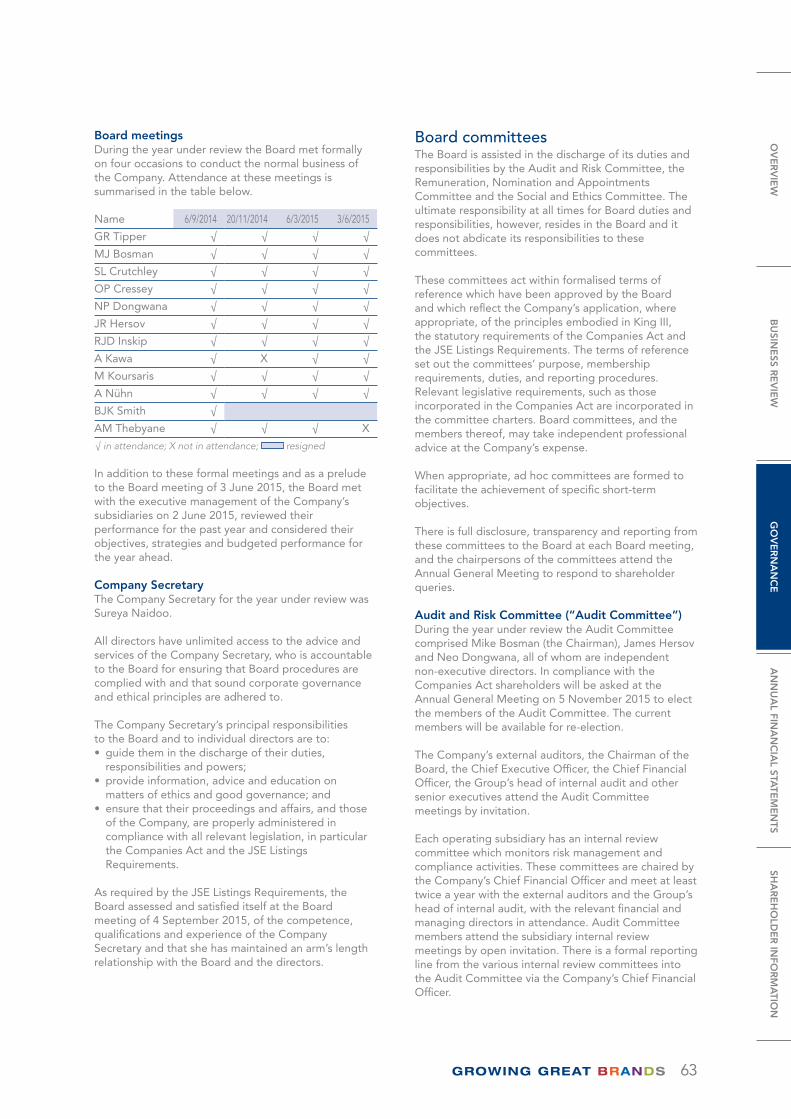
63
Board meetingsDuring the year under review the Board met formally on four occasions to conduct the normal business of the Company. Attendance at these meetings is summarised in the table below.
Name 6/9/2014 20/11/2014 6/3/2015 3/6/2015
GR Tipper √ √ √ √
MJ Bosman √ √ √ √
SL Crutchley √ √ √ √
OP Cressey √ √ √ √
NP Dongwana √ √ √ √
JR Hersov √ √ √ √
RJD Inskip √ √ √ √
A Kawa √ X √ √
M Koursaris √ √ √ √
A Nühn √ √ √ √
BJK Smith √
AM Thebyane √ √ √ X
√ in attendance; X not in attendance; resigned
In addition to these formal meetings and as a prelude to the Board meeting of 3 June 2015, the Board met with the executive management of the Company’s subsidiaries on 2 June 2015, reviewed their performance for the past year and considered their objectives, strategies and budgeted performance for the year ahead.
Company SecretaryThe Company Secretary for the year under review was Sureya Naidoo.
All directors have unlimited access to the advice and services of the Company Secretary, who is accountable to the Board for ensuring that Board procedures are complied with and that sound corporate governance and ethical principles are adhered to.
The Company Secretary’s principal responsibilities to the Board and to individual directors are to:• guide them in the discharge of their duties,
responsibilities and powers;• provide information, advice and education on
matters of ethics and good governance; and• ensure that their proceedings and affairs, and those
of the Company, are properly administered in compliance with all relevant legislation, in particular the Companies Act and the JSE Listings Requirements.
As required by the JSE Listings Requirements, the Board assessed and satisfied itself at the Board meeting of 4 September 2015, of the competence, qualifications and experience of the Company Secretary and that she has maintained an arm’s length relationship with the Board and the directors.
Board committeesThe Board is assisted in the discharge of its duties and responsibilities by the Audit and Risk Committee, the Remuneration, Nomination and Appointments Committee and the Social and Ethics Committee. The ultimate responsibility at all times for Board duties and responsibilities, however, resides in the Board and it does not abdicate its responsibilities to these committees.
These committees act within formalised terms of reference which have been approved by the Board and which reflect the Company’s application, where appropriate, of the principles embodied in King III, the statutory requirements of the Companies Act and the JSE Listings Requirements. The terms of reference set out the committees’ purpose, membership requirements, duties, and reporting procedures. Relevant legislative requirements, such as those incorporated in the Companies Act are incorporated in the committee charters. Board committees, and the members thereof, may take independent professional advice at the Company’s expense.
When appropriate, ad hoc committees are formed to facilitate the achievement of specific short-term objectives.
There is full disclosure, transparency and reporting from these committees to the Board at each Board meeting, and the chairpersons of the committees attend the Annual General Meeting to respond to shareholder queries.
Audit and Risk Committee (“Audit Committee”)During the year under review the Audit Committee comprised Mike Bosman (the Chairman), James Hersov and Neo Dongwana, all of whom are independent non-executive directors. In compliance with the Companies Act shareholders will be asked at the Annual General Meeting on 5 November 2015 to elect the members of the Audit Committee. The current members will be available for re-election.
The Company’s external auditors, the Chairman of the Board, the Chief Executive Officer, the Chief Financial Officer, the Group’s head of internal audit and other senior executives attend the Audit Committee meetings by invitation.
Each operating subsidiary has an internal review committee which monitors risk management and compliance activities. These committees are chaired by the Company’s Chief Financial Officer and meet at least twice a year with the external auditors and the Group’s head of internal audit, with the relevant financial and managing directors in attendance. Audit Committee members attend the subsidiary internal review meetings by open invitation. There is a formal reporting line from the various internal review committees into the Audit Committee via the Company’s Chief Financial Officer.
OV
ER
VIE
WB
USIN
ESS R
EV
IEW
GO
VE
RN
AN
CE
AN
NU
AL FIN
AN
CIA
L STATE
ME
NTS
SHA
RE
HO
LDE
R IN
FOR
MA
TION
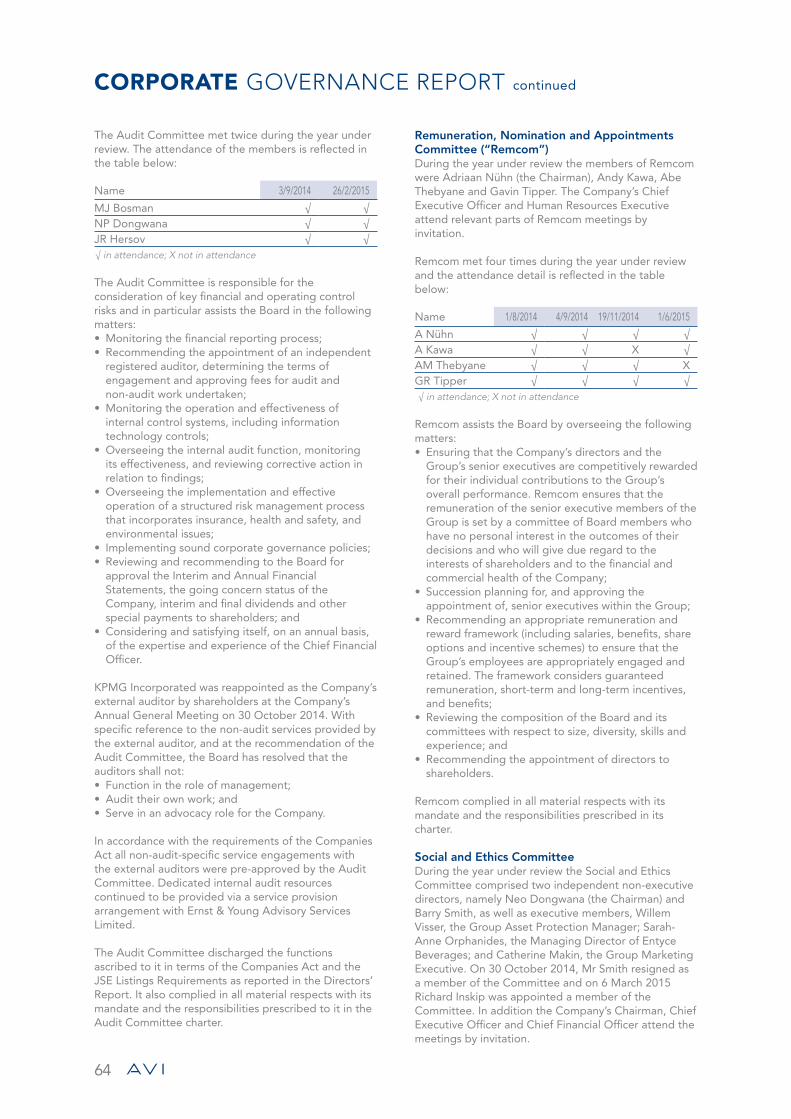
64
CORPORATE GOVERNANCE REPORT continued
The Audit Committee met twice during the year under review. The attendance of the members is reflected in the table below:
Name 3/9/2014 26/2/2015
MJ Bosman √ √NP Dongwana √ √JR Hersov √ √√ in attendance; X not in attendance
The Audit Committee is responsible for the consideration of key financial and operating control risks and in particular assists the Board in the following matters:• Monitoring the financial reporting process;• Recommending the appointment of an independent
registered auditor, determining the terms of engagement and approving fees for audit and non-audit work undertaken;
• Monitoring the operation and effectiveness of internal control systems, including information technology controls;
• Overseeing the internal audit function, monitoring its effectiveness, and reviewing corrective action in relation to findings;
• Overseeing the implementation and effective operation of a structured risk management process that incorporates insurance, health and safety, and environmental issues;
• Implementing sound corporate governance policies;• Reviewing and recommending to the Board for
approval the Interim and Annual Financial Statements, the going concern status of the Company, interim and final dividends and other special payments to shareholders; and
• Considering and satisfying itself, on an annual basis, of the expertise and experience of the Chief Financial Officer.
KPMG Incorporated was reappointed as the Company’s external auditor by shareholders at the Company’s Annual General Meeting on 30 October 2014. With specific reference to the non-audit services provided by the external auditor, and at the recommendation of the Audit Committee, the Board has resolved that the auditors shall not:• Function in the role of management;• Audit their own work; and• Serve in an advocacy role for the Company.
In accordance with the requirements of the Companies Act all non-audit-specific service engagements with the external auditors were pre-approved by the Audit Committee. Dedicated internal audit resources continued to be provided via a service provision arrangement with Ernst & Young Advisory Services Limited.
The Audit Committee discharged the functions ascribed to it in terms of the Companies Act and the JSE Listings Requirements as reported in the Directors’ Report. It also complied in all material respects with its mandate and the responsibilities prescribed to it in the Audit Committee charter.
Remuneration, Nomination and Appointments Committee (“Remcom”)During the year under review the members of Remcom were Adriaan Nühn (the Chairman), Andy Kawa, Abe Thebyane and Gavin Tipper. The Company’s Chief Executive Officer and Human Resources Executive attend relevant parts of Remcom meetings by invitation.
Remcom met four times during the year under review and the attendance detail is reflected in the table below:
Name 1/8/2014 4/9/2014 19/11/2014 1/6/2015
A Nühn √ √ √ √A Kawa √ √ X √AM Thebyane √ √ √ XGR Tipper √ √ √ √ √ in attendance; X not in attendance
Remcom assists the Board by overseeing the following matters:• Ensuring that the Company’s directors and the
Group’s senior executives are competitively rewarded for their individual contributions to the Group’s overall performance. Remcom ensures that the remuneration of the senior executive members of the Group is set by a committee of Board members who have no personal interest in the outcomes of their decisions and who will give due regard to the interests of shareholders and to the financial and commercial health of the Company;
• Succession planning for, and approving the appointment of, senior executives within the Group;
• Recommending an appropriate remuneration and reward framework (including salaries, benefits, share options and incentive schemes) to ensure that the Group’s employees are appropriately engaged and retained. The framework considers guaranteed remuneration, short-term and long-term incentives, and benefits;
• Reviewing the composition of the Board and its committees with respect to size, diversity, skills and experience; and
• Recommending the appointment of directors to shareholders.
Remcom complied in all material respects with its mandate and the responsibilities prescribed in its charter.
Social and Ethics CommitteeDuring the year under review the Social and Ethics Committee comprised two independent non-executive directors, namely Neo Dongwana (the Chairman) and Barry Smith, as well as executive members, Willem Visser, the Group Asset Protection Manager; Sarah-Anne Orphanides, the Managing Director of Entyce Beverages; and Catherine Makin, the Group Marketing Executive. On 30 October 2014, Mr Smith resigned as a member of the Committee and on 6 March 2015 Richard Inskip was appointed a member of the Committee. In addition the Company’s Chairman, Chief Executive Officer and Chief Financial Officer attend the meetings by invitation.
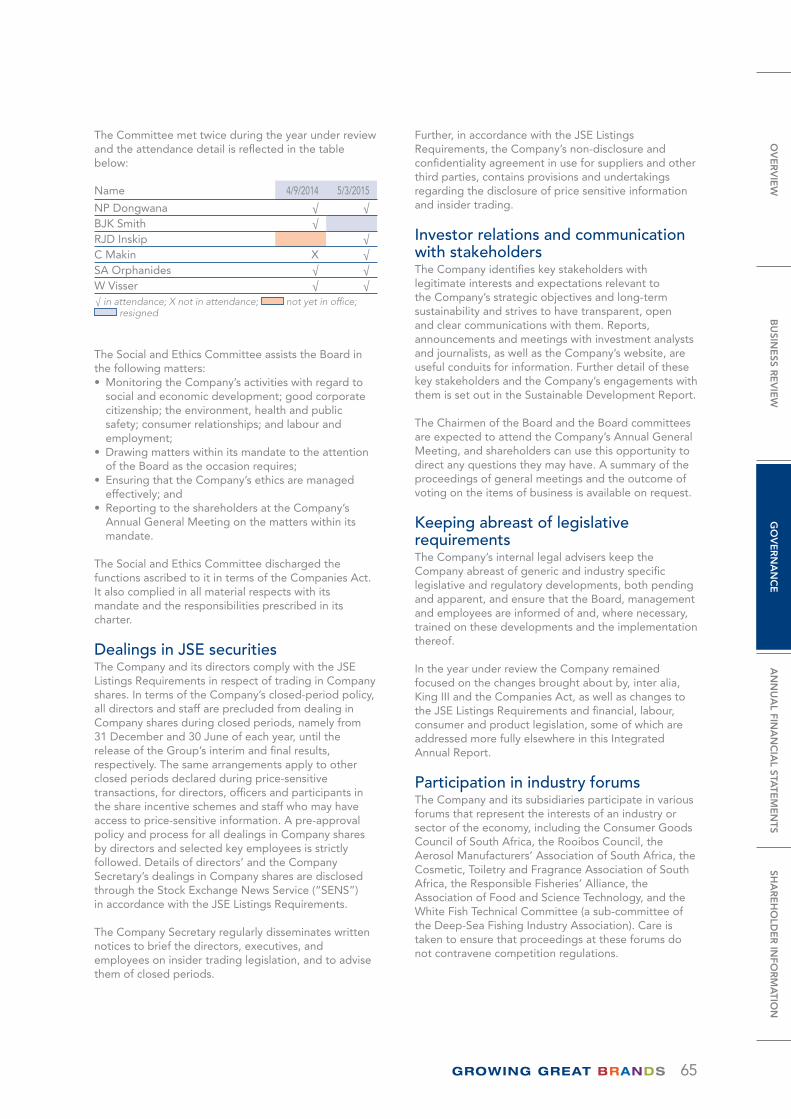
65
The Committee met twice during the year under review and the attendance detail is reflected in the table below:
Name 4/9/2014 5/3/2015
NP Dongwana √ √BJK Smith √RJD Inskip √C Makin X √SA Orphanides √ √W Visser √ √√ in attendance; X not in attendance; not yet in office;
resigned
The Social and Ethics Committee assists the Board in the following matters:• Monitoring the Company’s activities with regard to
social and economic development; good corporate citizenship; the environment, health and public safety; consumer relationships; and labour and employment;
• Drawing matters within its mandate to the attention of the Board as the occasion requires;
• Ensuring that the Company’s ethics are managed effectively; and
• Reporting to the shareholders at the Company’s Annual General Meeting on the matters within its mandate.
The Social and Ethics Committee discharged the functions ascribed to it in terms of the Companies Act. It also complied in all material respects with its mandate and the responsibilities prescribed in its charter.
Dealings in JSE securitiesThe Company and its directors comply with the JSE Listings Requirements in respect of trading in Company shares. In terms of the Company’s closed-period policy, all directors and staff are precluded from dealing in Company shares during closed periods, namely from 31 December and 30 June of each year, until the release of the Group’s interim and final results, respectively. The same arrangements apply to other closed periods declared during price-sensitive transactions, for directors, officers and participants in the share incentive schemes and staff who may have access to price-sensitive information. A pre-approval policy and process for all dealings in Company shares by directors and selected key employees is strictly followed. Details of directors’ and the Company Secretary’s dealings in Company shares are disclosed through the Stock Exchange News Service (“SENS”) in accordance with the JSE Listings Requirements.
The Company Secretary regularly disseminates written notices to brief the directors, executives, and employees on insider trading legislation, and to advise them of closed periods.
Further, in accordance with the JSE Listings Requirements, the Company’s non-disclosure and confidentiality agreement in use for suppliers and other third parties, contains provisions and undertakings regarding the disclosure of price sensitive information and insider trading.
Investor relations and communication with stakeholdersThe Company identifies key stakeholders with legitimate interests and expectations relevant to the Company’s strategic objectives and long-term sustainability and strives to have transparent, open and clear communications with them. Reports, announcements and meetings with investment analysts and journalists, as well as the Company’s website, are useful conduits for information. Further detail of these key stakeholders and the Company’s engagements with them is set out in the Sustainable Development Report.
The Chairmen of the Board and the Board committees are expected to attend the Company’s Annual General Meeting, and shareholders can use this opportunity to direct any questions they may have. A summary of the proceedings of general meetings and the outcome of voting on the items of business is available on request.
Keeping abreast of legislative requirementsThe Company’s internal legal advisers keep the Company abreast of generic and industry specific legislative and regulatory developments, both pending and apparent, and ensure that the Board, management and employees are informed of and, where necessary, trained on these developments and the implementation thereof.
In the year under review the Company remained focused on the changes brought about by, inter alia, King III and the Companies Act, as well as changes to the JSE Listings Requirements and financial, labour, consumer and product legislation, some of which are addressed more fully elsewhere in this Integrated Annual Report.
Participation in industry forumsThe Company and its subsidiaries participate in various forums that represent the interests of an industry or sector of the economy, including the Consumer Goods Council of South Africa, the Rooibos Council, the Aerosol Manufacturers’ Association of South Africa, the Cosmetic, Toiletry and Fragrance Association of South Africa, the Responsible Fisheries’ Alliance, the Association of Food and Science Technology, and the White Fish Technical Committee (a sub-committee of the Deep-Sea Fishing Industry Association). Care is taken to ensure that proceedings at these forums do not contravene competition regulations.
OV
ER
VIE
WB
USIN
ESS R
EV
IEW
GO
VE
RN
AN
CE
AN
NU
AL FIN
AN
CIA
L STATE
ME
NTS
SHA
RE
HO
LDE
R IN
FOR
MA
TION
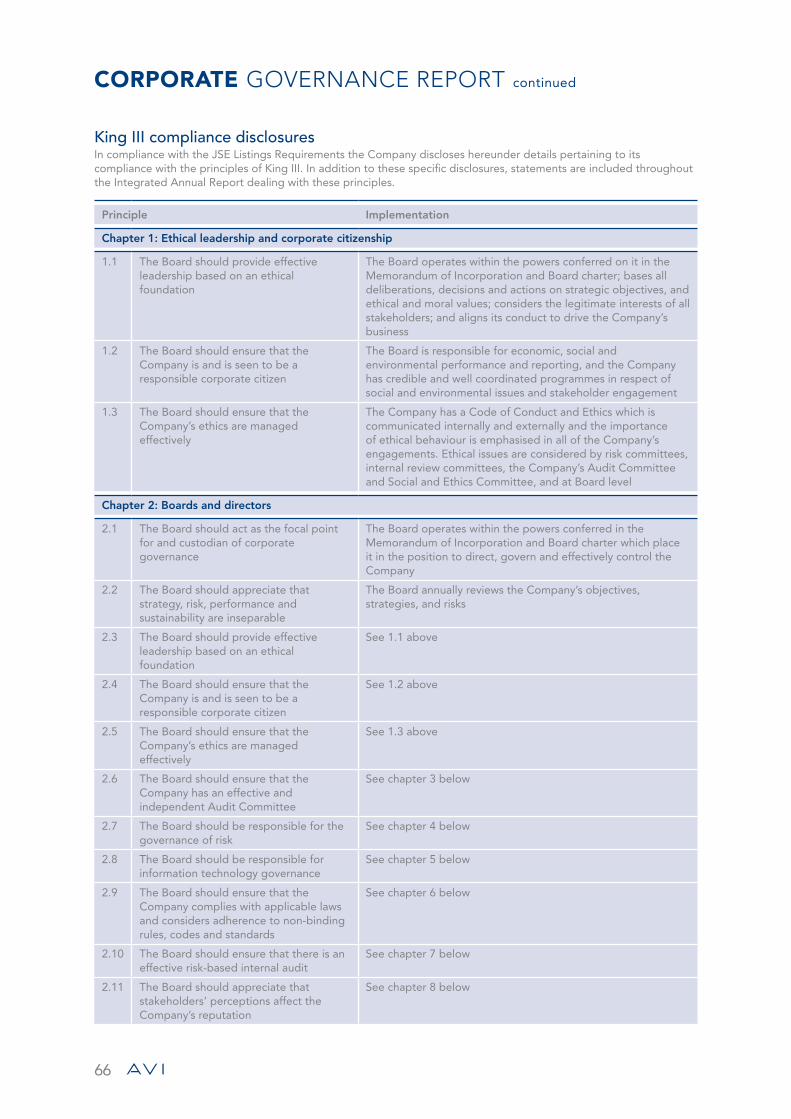
66
CORPORATE GOVERNANCE REPORT continued
King III compliance disclosuresIn compliance with the JSE Listings Requirements the Company discloses hereunder details pertaining to its compliance with the principles of King III. In addition to these specific disclosures, statements are included throughout the Integrated Annual Report dealing with these principles.
Principle Implementation
Chapter 1: Ethical leadership and corporate citizenship
1.1 The Board should provide effective leadership based on an ethical foundation
The Board operates within the powers conferred on it in the Memorandum of Incorporation and Board charter; bases all deliberations, decisions and actions on strategic objectives, and ethical and moral values; considers the legitimate interests of all stakeholders; and aligns its conduct to drive the Company’s business
1.2 The Board should ensure that the Company is and is seen to be a responsible corporate citizen
The Board is responsible for economic, social and environmental performance and reporting, and the Company has credible and well coordinated programmes in respect of social and environmental issues and stakeholder engagement
1.3 The Board should ensure that the Company’s ethics are managed effectively
The Company has a Code of Conduct and Ethics which is communicated internally and externally and the importance of ethical behaviour is emphasised in all of the Company’s engagements. Ethical issues are considered by risk committees, internal review committees, the Company’s Audit Committee and Social and Ethics Committee, and at Board level
Chapter 2: Boards and directors
2.1 The Board should act as the focal point for and custodian of corporate governance
The Board operates within the powers conferred in the Memorandum of Incorporation and Board charter which place it in the position to direct, govern and effectively control the Company
2.2 The Board should appreciate that strategy, risk, performance and sustainability are inseparable
The Board annually reviews the Company’s objectives, strategies, and risks
2.3 The Board should provide effective leadership based on an ethical foundation
See 1.1 above
2.4 The Board should ensure that the Company is and is seen to be a responsible corporate citizen
See 1.2 above
2.5 The Board should ensure that the Company’s ethics are managed effectively
See 1.3 above
2.6 The Board should ensure that the Company has an effective and independent Audit Committee
See chapter 3 below
2.7 The Board should be responsible for the governance of risk
See chapter 4 below
2.8 The Board should be responsible for information technology governance
See chapter 5 below
2.9 The Board should ensure that the Company complies with applicable laws and considers adherence to non-binding rules, codes and standards
See chapter 6 below
2.10 The Board should ensure that there is an effective risk-based internal audit
See chapter 7 below
2.11 The Board should appreciate that stakeholders’ perceptions affect the Company’s reputation
See chapter 8 below
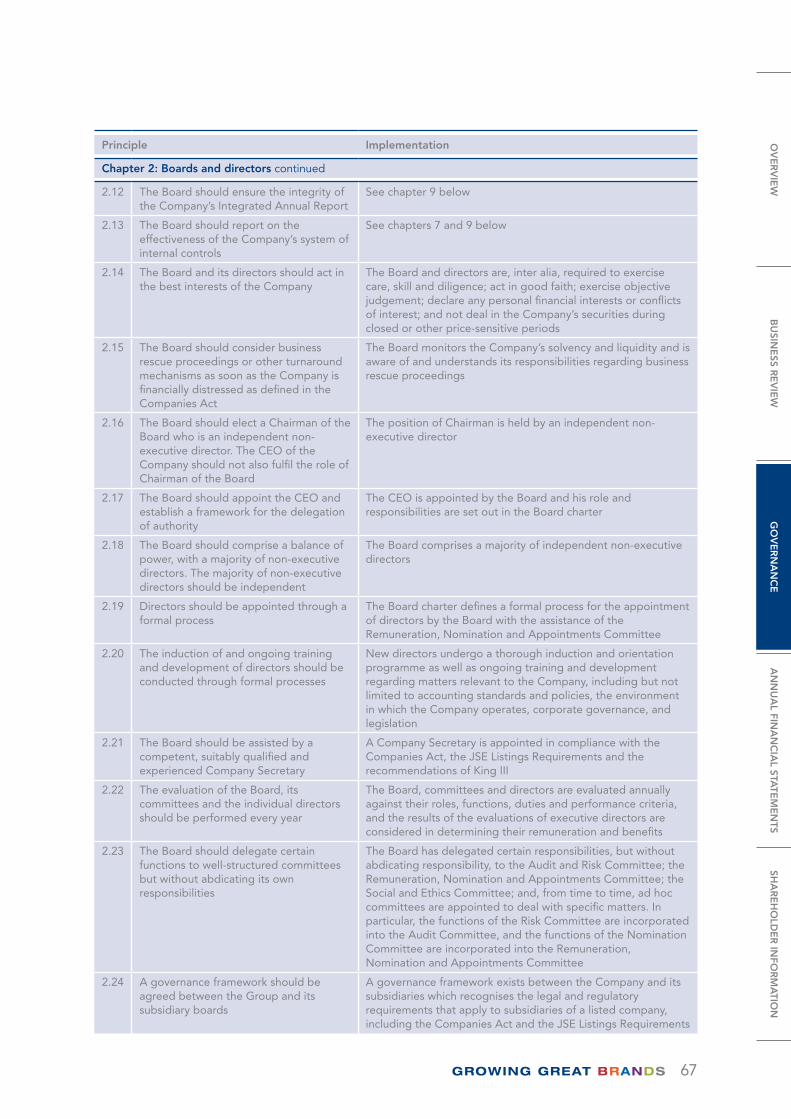
67
Principle Implementation
Chapter 2: Boards and directors continued
2.12 The Board should ensure the integrity of the Company’s Integrated Annual Report
See chapter 9 below
2.13 The Board should report on the effectiveness of the Company’s system of internal controls
See chapters 7 and 9 below
2.14 The Board and its directors should act in the best interests of the Company
The Board and directors are, inter alia, required to exercise care, skill and diligence; act in good faith; exercise objective judgement; declare any personal financial interests or conflicts of interest; and not deal in the Company’s securities during closed or other price-sensitive periods
2.15 The Board should consider business rescue proceedings or other turnaround mechanisms as soon as the Company is financially distressed as defined in the Companies Act
The Board monitors the Company’s solvency and liquidity and is aware of and understands its responsibilities regarding business rescue proceedings
2.16 The Board should elect a Chairman of the Board who is an independent non-executive director. The CEO of the Company should not also fulfil the role of Chairman of the Board
The position of Chairman is held by an independent non-executive director
2.17 The Board should appoint the CEO and establish a framework for the delegation of authority
The CEO is appointed by the Board and his role and responsibilities are set out in the Board charter
2.18 The Board should comprise a balance of power, with a majority of non-executive directors. The majority of non-executive directors should be independent
The Board comprises a majority of independent non-executive directors
2.19 Directors should be appointed through a formal process
The Board charter defines a formal process for the appointment of directors by the Board with the assistance of the Remuneration, Nomination and Appointments Committee
2.20 The induction of and ongoing training and development of directors should be conducted through formal processes
New directors undergo a thorough induction and orientation programme as well as ongoing training and development regarding matters relevant to the Company, including but not limited to accounting standards and policies, the environment in which the Company operates, corporate governance, and legislation
2.21 The Board should be assisted by a competent, suitably qualified and experienced Company Secretary
A Company Secretary is appointed in compliance with the Companies Act, the JSE Listings Requirements and the recommendations of King III
2.22 The evaluation of the Board, its committees and the individual directors should be performed every year
The Board, committees and directors are evaluated annually against their roles, functions, duties and performance criteria, and the results of the evaluations of executive directors are considered in determining their remuneration and benefits
2.23 The Board should delegate certain functions to well-structured committees but without abdicating its own responsibilities
The Board has delegated certain responsibilities, but without abdicating responsibility, to the Audit and Risk Committee; the Remuneration, Nomination and Appointments Committee; the Social and Ethics Committee; and, from time to time, ad hoc committees are appointed to deal with specific matters. In particular, the functions of the Risk Committee are incorporated into the Audit Committee, and the functions of the Nomination Committee are incorporated into the Remuneration, Nomination and Appointments Committee
2.24 A governance framework should be agreed between the Group and its subsidiary boards
A governance framework exists between the Company and its subsidiaries which recognises the legal and regulatory requirements that apply to subsidiaries of a listed company, including the Companies Act and the JSE Listings Requirements
OV
ER
VIE
WB
USIN
ESS R
EV
IEW
GO
VE
RN
AN
CE
AN
NU
AL FIN
AN
CIA
L STATE
ME
NTS
SHA
RE
HO
LDE
R IN
FOR
MA
TION
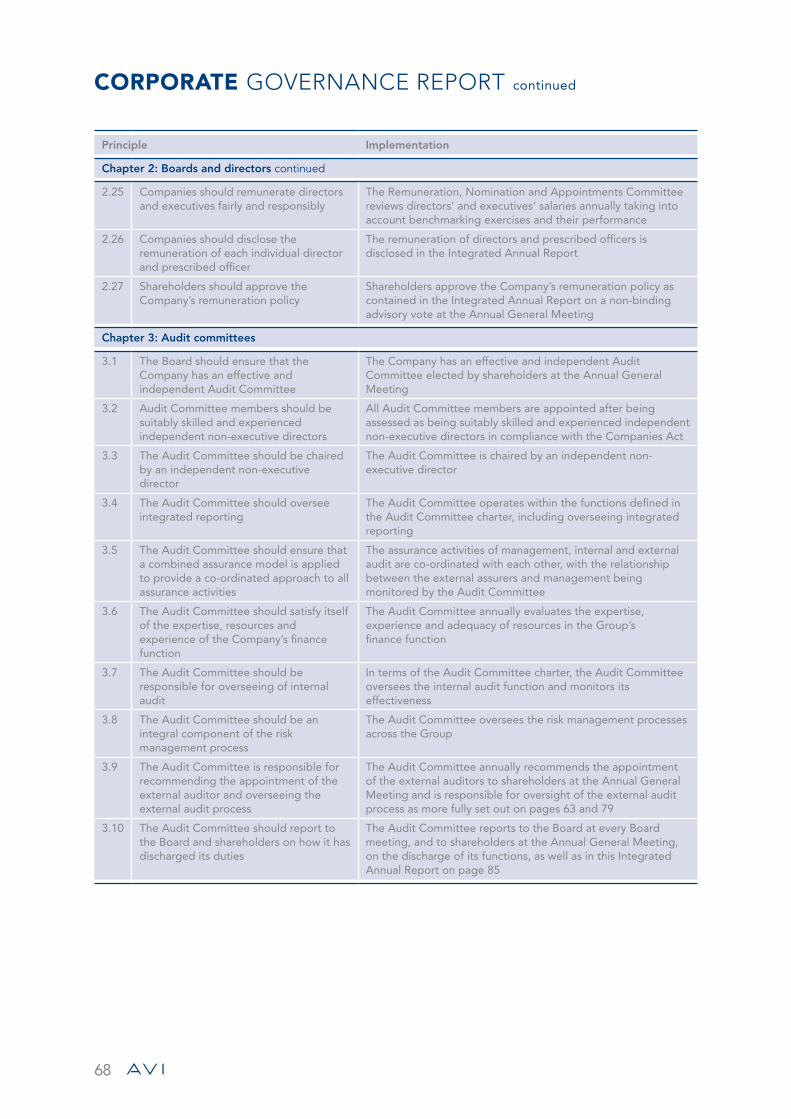
68
CORPORATE GOVERNANCE REPORT continued
Principle Implementation
Chapter 2: Boards and directors continued
2.25 Companies should remunerate directors and executives fairly and responsibly
The Remuneration, Nomination and Appointments Committee reviews directors’ and executives’ salaries annually taking into account benchmarking exercises and their performance
2.26 Companies should disclose the remuneration of each individual director and prescribed officer
The remuneration of directors and prescribed officers is disclosed in the Integrated Annual Report
2.27 Shareholders should approve the Company’s remuneration policy
Shareholders approve the Company’s remuneration policy as contained in the Integrated Annual Report on a non-binding advisory vote at the Annual General Meeting
Chapter 3: Audit committees
3.1 The Board should ensure that the Company has an effective and independent Audit Committee
The Company has an effective and independent Audit Committee elected by shareholders at the Annual General Meeting
3.2 Audit Committee members should be suitably skilled and experienced independent non-executive directors
All Audit Committee members are appointed after being assessed as being suitably skilled and experienced independent non-executive directors in compliance with the Companies Act
3.3 The Audit Committee should be chaired by an independent non-executive director
The Audit Committee is chaired by an independent non-executive director
3.4 The Audit Committee should oversee integrated reporting
The Audit Committee operates within the functions defined in the Audit Committee charter, including overseeing integrated reporting
3.5 The Audit Committee should ensure that a combined assurance model is applied to provide a co-ordinated approach to all assurance activities
The assurance activities of management, internal and external audit are co-ordinated with each other, with the relationship between the external assurers and management being monitored by the Audit Committee
3.6 The Audit Committee should satisfy itself of the expertise, resources and experience of the Company’s finance function
The Audit Committee annually evaluates the expertise, experience and adequacy of resources in the Group’s finance function
3.7 The Audit Committee should be responsible for overseeing of internal audit
In terms of the Audit Committee charter, the Audit Committee oversees the internal audit function and monitors its effectiveness
3.8 The Audit Committee should be an integral component of the risk management process
The Audit Committee oversees the risk management processes across the Group
3.9 The Audit Committee is responsible for recommending the appointment of the external auditor and overseeing the external audit process
The Audit Committee annually recommends the appointment of the external auditors to shareholders at the Annual General Meeting and is responsible for oversight of the external audit process as more fully set out on pages 63 and 79
3.10 The Audit Committee should report to the Board and shareholders on how it has discharged its duties
The Audit Committee reports to the Board at every Board meeting, and to shareholders at the Annual General Meeting, on the discharge of its functions, as well as in this Integrated Annual Report on page 85
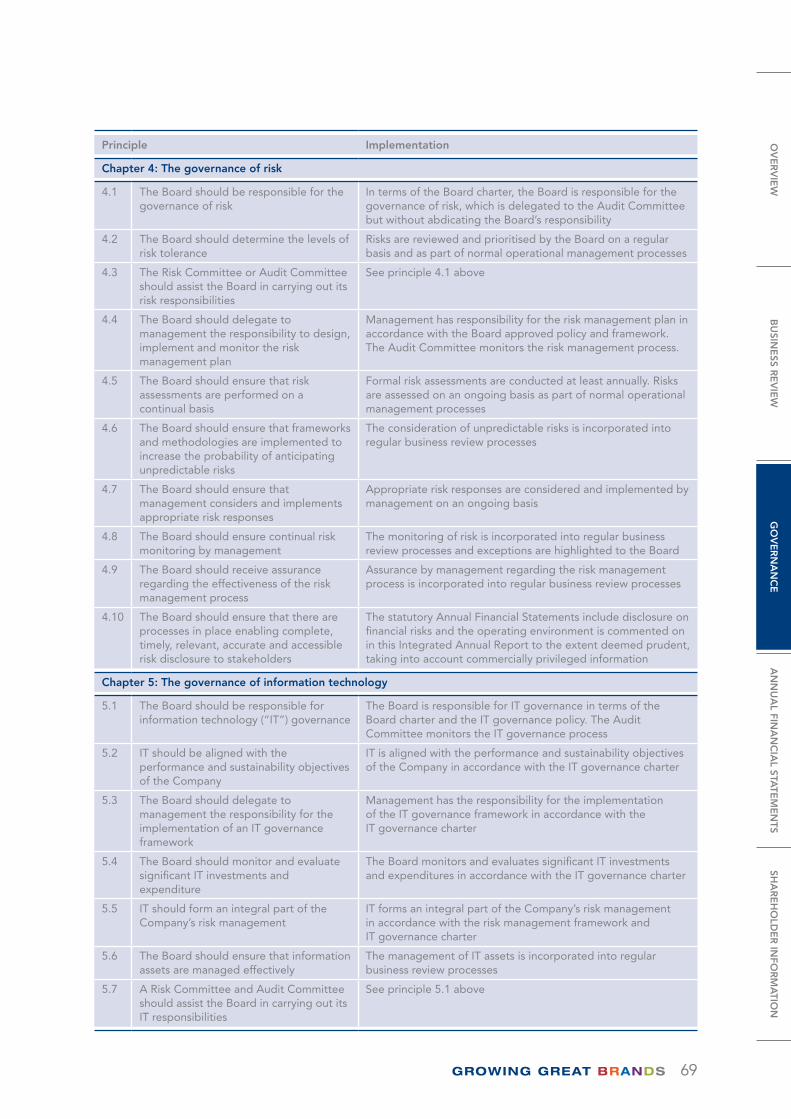
69
Principle Implementation
Chapter 4: The governance of risk
4.1 The Board should be responsible for the governance of risk
In terms of the Board charter, the Board is responsible for the governance of risk, which is delegated to the Audit Committee but without abdicating the Board’s responsibility
4.2 The Board should determine the levels of risk tolerance
Risks are reviewed and prioritised by the Board on a regular basis and as part of normal operational management processes
4.3 The Risk Committee or Audit Committee should assist the Board in carrying out its risk responsibilities
See principle 4.1 above
4.4 The Board should delegate to management the responsibility to design, implement and monitor the risk management plan
Management has responsibility for the risk management plan in accordance with the Board approved policy and framework. The Audit Committee monitors the risk management process.
4.5 The Board should ensure that risk assessments are performed on a continual basis
Formal risk assessments are conducted at least annually. Risks are assessed on an ongoing basis as part of normal operational management processes
4.6 The Board should ensure that frameworks and methodologies are implemented to increase the probability of anticipating unpredictable risks
The consideration of unpredictable risks is incorporated into regular business review processes
4.7 The Board should ensure that management considers and implements appropriate risk responses
Appropriate risk responses are considered and implemented by management on an ongoing basis
4.8 The Board should ensure continual risk monitoring by management
The monitoring of risk is incorporated into regular business review processes and exceptions are highlighted to the Board
4.9 The Board should receive assurance regarding the effectiveness of the risk management process
Assurance by management regarding the risk management process is incorporated into regular business review processes
4.10 The Board should ensure that there are processes in place enabling complete, timely, relevant, accurate and accessible risk disclosure to stakeholders
The statutory Annual Financial Statements include disclosure on financial risks and the operating environment is commented on in this Integrated Annual Report to the extent deemed prudent, taking into account commercially privileged information
Chapter 5: The governance of information technology
5.1 The Board should be responsible for information technology (“IT”) governance
The Board is responsible for IT governance in terms of the Board charter and the IT governance policy. The Audit Committee monitors the IT governance process
5.2 IT should be aligned with the performance and sustainability objectives of the Company
IT is aligned with the performance and sustainability objectives of the Company in accordance with the IT governance charter
5.3 The Board should delegate to management the responsibility for the implementation of an IT governance framework
Management has the responsibility for the implementation of the IT governance framework in accordance with the IT governance charter
5.4 The Board should monitor and evaluate significant IT investments and expenditure
The Board monitors and evaluates significant IT investments and expenditures in accordance with the IT governance charter
5.5 IT should form an integral part of the Company’s risk management
IT forms an integral part of the Company’s risk management in accordance with the risk management framework and IT governance charter
5.6 The Board should ensure that information assets are managed effectively
The management of IT assets is incorporated into regular business review processes
5.7 A Risk Committee and Audit Committee should assist the Board in carrying out its IT responsibilities
See principle 5.1 above
OV
ER
VIE
WB
USIN
ESS R
EV
IEW
GO
VE
RN
AN
CE
AN
NU
AL FIN
AN
CIA
L STATE
ME
NTS
SHA
RE
HO
LDE
R IN
FOR
MA
TION
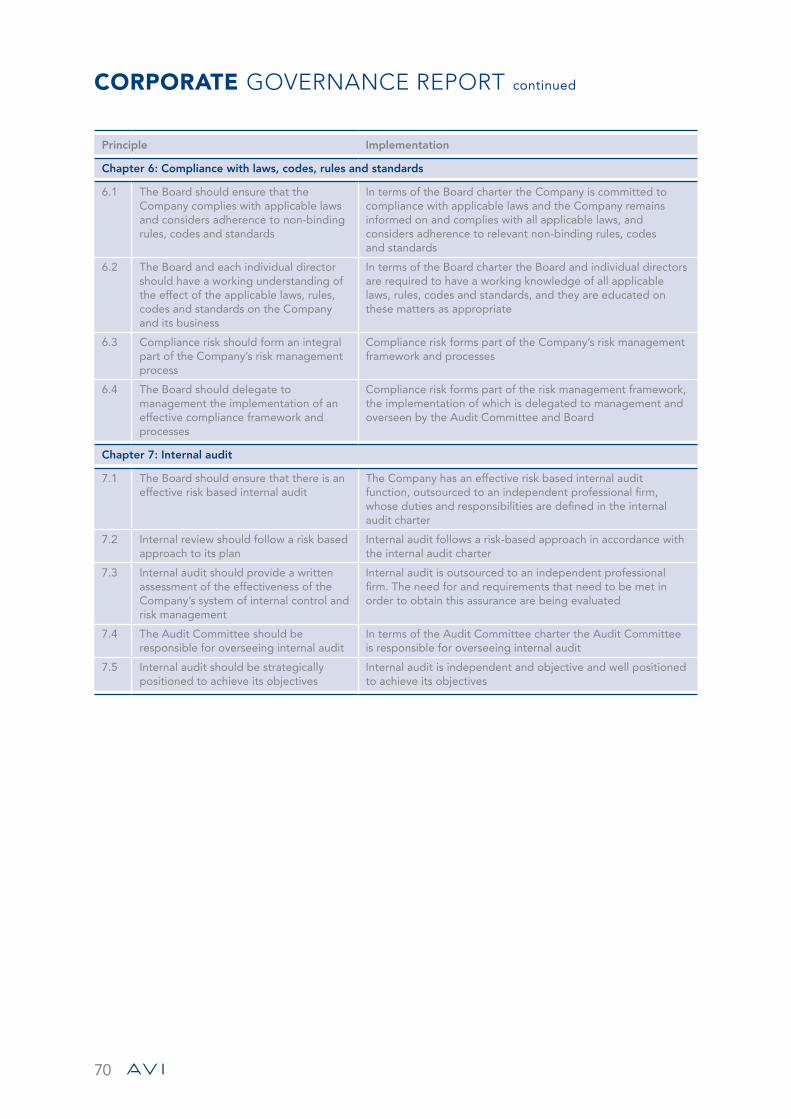
70
CORPORATE GOVERNANCE REPORT continued
Principle Implementation
Chapter 6: Compliance with laws, codes, rules and standards
6.1 The Board should ensure that the Company complies with applicable laws and considers adherence to non-binding rules, codes and standards
In terms of the Board charter the Company is committed to compliance with applicable laws and the Company remains informed on and complies with all applicable laws, and considers adherence to relevant non-binding rules, codes and standards
6.2 The Board and each individual director should have a working understanding of the effect of the applicable laws, rules, codes and standards on the Company and its business
In terms of the Board charter the Board and individual directors are required to have a working knowledge of all applicable laws, rules, codes and standards, and they are educated on these matters as appropriate
6.3 Compliance risk should form an integral part of the Company’s risk management process
Compliance risk forms part of the Company’s risk management framework and processes
6.4 The Board should delegate to management the implementation of an effective compliance framework and processes
Compliance risk forms part of the risk management framework, the implementation of which is delegated to management and overseen by the Audit Committee and Board
Chapter 7: Internal audit
7.1 The Board should ensure that there is an effective risk based internal audit
The Company has an effective risk based internal audit function, outsourced to an independent professional firm, whose duties and responsibilities are defined in the internal audit charter
7.2 Internal review should follow a risk based approach to its plan
Internal audit follows a risk-based approach in accordance with the internal audit charter
7.3 Internal audit should provide a written assessment of the effectiveness of the Company’s system of internal control and risk management
Internal audit is outsourced to an independent professional firm. The need for and requirements that need to be met in order to obtain this assurance are being evaluated
7.4 The Audit Committee should be responsible for overseeing internal audit
In terms of the Audit Committee charter the Audit Committee is responsible for overseeing internal audit
7.5 Internal audit should be strategically positioned to achieve its objectives
Internal audit is independent and objective and well positioned to achieve its objectives
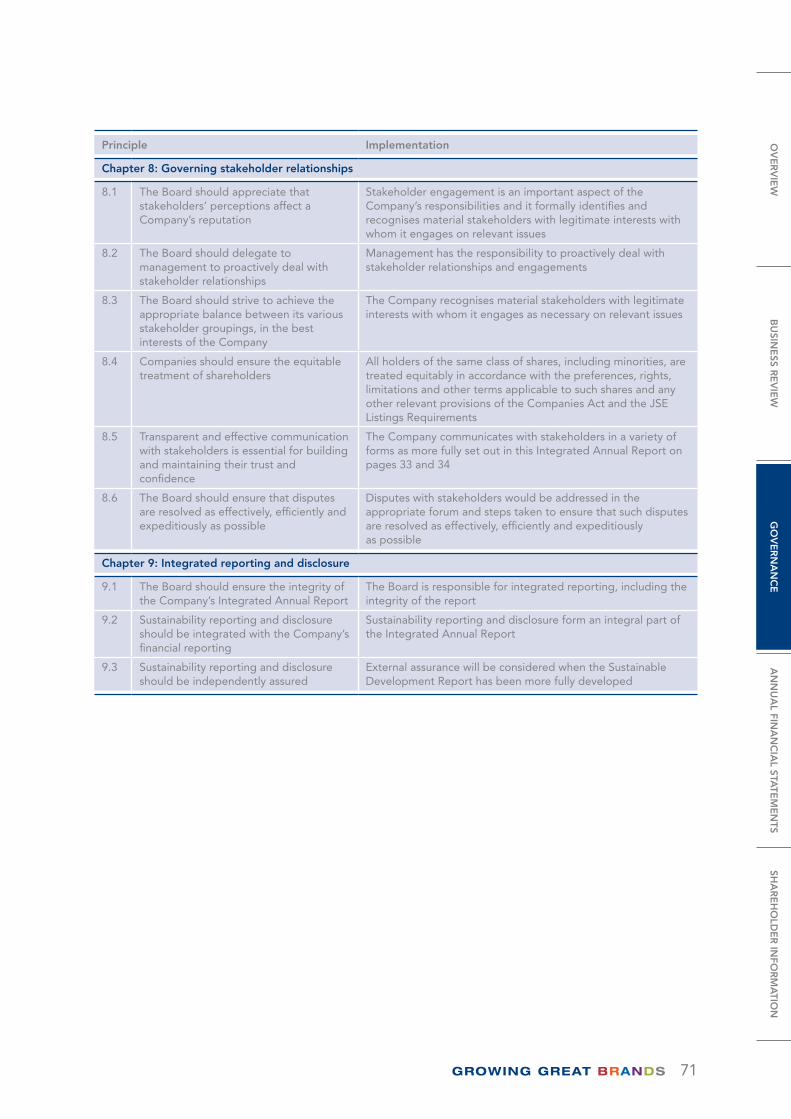
71
Principle Implementation
Chapter 8: Governing stakeholder relationships
8.1 The Board should appreciate that stakeholders’ perceptions affect a Company’s reputation
Stakeholder engagement is an important aspect of the Company’s responsibilities and it formally identifies and recognises material stakeholders with legitimate interests with whom it engages on relevant issues
8.2 The Board should delegate to management to proactively deal with stakeholder relationships
Management has the responsibility to proactively deal with stakeholder relationships and engagements
8.3 The Board should strive to achieve the appropriate balance between its various stakeholder groupings, in the best interests of the Company
The Company recognises material stakeholders with legitimate interests with whom it engages as necessary on relevant issues
8.4 Companies should ensure the equitable treatment of shareholders
All holders of the same class of shares, including minorities, are treated equitably in accordance with the preferences, rights, limitations and other terms applicable to such shares and any other relevant provisions of the Companies Act and the JSE Listings Requirements
8.5 Transparent and effective communication with stakeholders is essential for building and maintaining their trust and confidence
The Company communicates with stakeholders in a variety of forms as more fully set out in this Integrated Annual Report on pages 33 and 34
8.6 The Board should ensure that disputes are resolved as effectively, efficiently and expeditiously as possible
Disputes with stakeholders would be addressed in the appropriate forum and steps taken to ensure that such disputes are resolved as effectively, efficiently and expeditiously as possible
Chapter 9: Integrated reporting and disclosure
9.1 The Board should ensure the integrity of the Company’s Integrated Annual Report
The Board is responsible for integrated reporting, including the integrity of the report
9.2 Sustainability reporting and disclosure should be integrated with the Company’s financial reporting
Sustainability reporting and disclosure form an integral part of the Integrated Annual Report
9.3 Sustainability reporting and disclosure should be independently assured
External assurance will be considered when the Sustainable Development Report has been more fully developed
OV
ER
VIE
WB
USIN
ESS R
EV
IEW
GO
VE
RN
AN
CE
AN
NU
AL FIN
AN
CIA
L STATE
ME
NTS
SHA
RE
HO
LDE
R IN
FOR
MA
TION
72
REMUNERATION REPORT
This report sets out the Company’s remuneration and reward philosophy, policy and practice for non-executive directors, executive directors, executives and senior managers. It also provides details of the remuneration paid to and share options acquired by non-executive directors, executive directors and certain executives during the financial year ended 30 June 2015, and their interests in the Company’s shares as at 30 June 2015.
Remuneration and reward philosophyThe intended consequence of the Company’s remuneration and reward framework is to attract, retain and motivate the most talented people available to the Group to align with its determination to deliver superior returns to shareholders.
The reward framework is designed to:• attract and recruit talented people from a shrinking
pool of talent;• retain competent employees who enhance business
performance;• direct employees’ activities towards business
priorities;• recognise and reward employees for superior
performance;• support a high performance environment;• address diverse employee motivational needs across
differing categories; and• support the Company’s transformation agenda.
During the year under review the Company’s remuneration and reward practices played a material role in retaining key talent and supporting the achievement of the Company’s objectives.
Key developmentsAt the Annual General Meeting held on 30 October 2014 and in accordance with the recommendations of the King Report on Corporate Governance for South Africa, 2009 (“King III”), shareholders endorsed the Company’s remuneration policy as set out in the Remuneration Report contained in the Integrated Annual Report, by way of a non-binding advisory vote. Shareholders will be asked annually to consider the remuneration policy and to pass this vote.
Composition of remuneration and rewardsIn the year under review, the remuneration packages of executive directors and senior management continued to comprise: • a guaranteed remuneration package (structured as
the employee’s total cost to the Company);• an annual bonus based on business and individual
performance;• long-term incentive plans; and • access to retirement fund and medical aid benefits
funded from their guaranteed remuneration package.
Guaranteed remunerationRemcom reviews the salaries of the executive directors and executive management annually benchmarked against the market median of similar sized companies and industry.
Assessments against the market are done in respect of total remuneration as well as the component parts using, inter alia, the Deloitte executive survey and the PricewaterhouseCoopers REM channel benchmarking tool, which, together with an AVI-specific company-sizing methodology, determines a competitive and reasonable market against which to measure AVI executive and senior management remuneration.
The Company remunerates its employees who are regarded as established performers within reasonable proximity to the market median, subject to their experience and individual contribution to the Company. Employees who are clear out-performers may be remunerated from the median to within reasonable proximity of the upper quartile, while employees who are regarded as under-performers are paid below the median and are actively managed. This approach recognises the market forces in play and the heightened requirement to attract and retain talented employees. In recent times the Company has often found that it is necessary to offer to remunerate executives with proven track records at the upper quartile to attract them to the Company.
Short-term incentive schemesAnnual or short-term incentives are based on a combination of performance targets, including operating profit, headline earnings and capital employed and a set of non-financial targets, measured after the finalisation of the audited year-end results. The more an employee is able to influence the financial performance of a subsidiary, due to his/her role and levels of responsibility, the greater his/her annual incentive is aligned with the financial performance of that subsidiary. Executive management recommends annual incentives to Remcom for approval. Remcom retains the absolute discretion to authorise incentives.
The annual incentives payable to executive and other management, for targeted levels of performance, range between 15% and 60% of an employee’s guaranteed remuneration package, depending on roles, responsibilities and individual contributions, determined with reference to market norms and as deemed appropriate by Remcom. The actual incentive payment for the year under review for executive and other management was R103,0 million which was 23% of the total remuneration cost to the Company of this group of employees, excluding the cost of the incentives. The payment for the prior year was R82,8 million or 23% of the total remuneration cost to the Company.
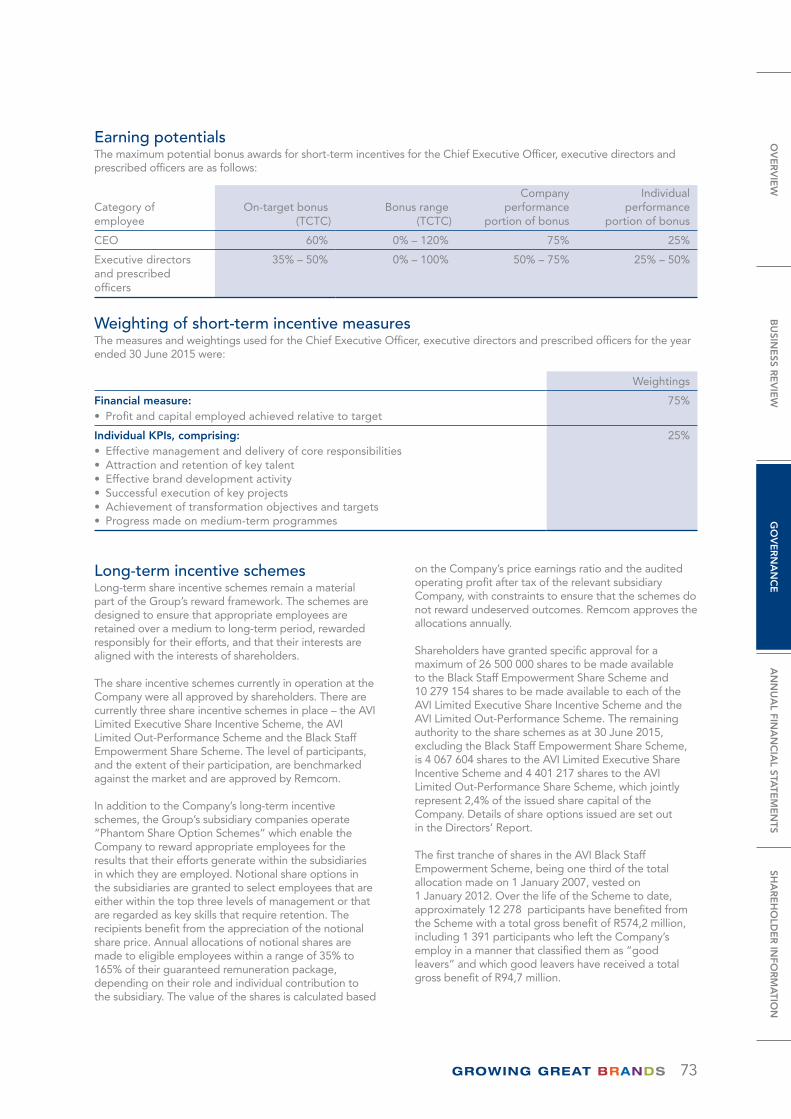
73
Earning potentialsThe maximum potential bonus awards for short-term incentives for the Chief Executive Officer, executive directors and prescribed officers are as follows:
Category of employee
On-target bonus (TCTC)
Bonus range (TCTC)
Company performance
portion of bonus
Individual performance
portion of bonus
CEO 60% 0% – 120% 75% 25%
Executive directors and prescribed officers
35% – 50% 0% – 100% 50% – 75% 25% – 50%
Weighting of short-term incentive measuresThe measures and weightings used for the Chief Executive Officer, executive directors and prescribed officers for the year ended 30 June 2015 were:
Weightings
Financial measure: 75%• Profit and capital employed achieved relative to target
Individual KPIs, comprising: 25%• Effective management and delivery of core responsibilities • Attraction and retention of key talent• Effective brand development activity • Successful execution of key projects• Achievement of transformation objectives and targets• Progress made on medium-term programmes
Long-term incentive schemesLong-term share incentive schemes remain a material part of the Group’s reward framework. The schemes are designed to ensure that appropriate employees are retained over a medium to long-term period, rewarded responsibly for their efforts, and that their interests are aligned with the interests of shareholders.
The share incentive schemes currently in operation at the Company were all approved by shareholders. There are currently three share incentive schemes in place – the AVI Limited Executive Share Incentive Scheme, the AVI Limited Out-Performance Scheme and the Black Staff Empowerment Share Scheme. The level of participants, and the extent of their participation, are benchmarked against the market and are approved by Remcom.
In addition to the Company’s long-term incentive schemes, the Group’s subsidiary companies operate “Phantom Share Option Schemes” which enable the Company to reward appropriate employees for the results that their efforts generate within the subsidiaries in which they are employed. Notional share options in the subsidiaries are granted to select employees that are either within the top three levels of management or that are regarded as key skills that require retention. The recipients benefit from the appreciation of the notional share price. Annual allocations of notional shares are made to eligible employees within a range of 35% to 165% of their guaranteed remuneration package, depending on their role and individual contribution to the subsidiary. The value of the shares is calculated based
on the Company’s price earnings ratio and the audited operating profit after tax of the relevant subsidiary Company, with constraints to ensure that the schemes do not reward undeserved outcomes. Remcom approves the allocations annually.
Shareholders have granted specific approval for a maximum of 26 500 000 shares to be made available to the Black Staff Empowerment Share Scheme and 10 279 154 shares to be made available to each of the AVI Limited Executive Share Incentive Scheme and the AVI Limited Out-Performance Scheme. The remaining authority to the share schemes as at 30 June 2015, excluding the Black Staff Empowerment Share Scheme, is 4 067 604 shares to the AVI Limited Executive Share Incentive Scheme and 4 401 217 shares to the AVI Limited Out-Performance Share Scheme, which jointly represent 2,4% of the issued share capital of the Company. Details of share options issued are set out in the Directors’ Report.
The first tranche of shares in the AVI Black Staff Empowerment Scheme, being one third of the total allocation made on 1 January 2007, vested on 1 January 2012. Over the life of the Scheme to date, approximately 12 278 participants have benefited from the Scheme with a total gross benefit of R574,2 million, including 1 391 participants who left the Company’s employ in a manner that classified them as “good leavers” and which good leavers have received a total gross benefit of R94,7 million.
OV
ER
VIE
WB
USIN
ESS R
EV
IEW
GO
VE
RN
AN
CE
AN
NU
AL FIN
AN
CIA
L STATE
ME
NTS
SHA
RE
HO
LDE
R IN
FOR
MA
TION
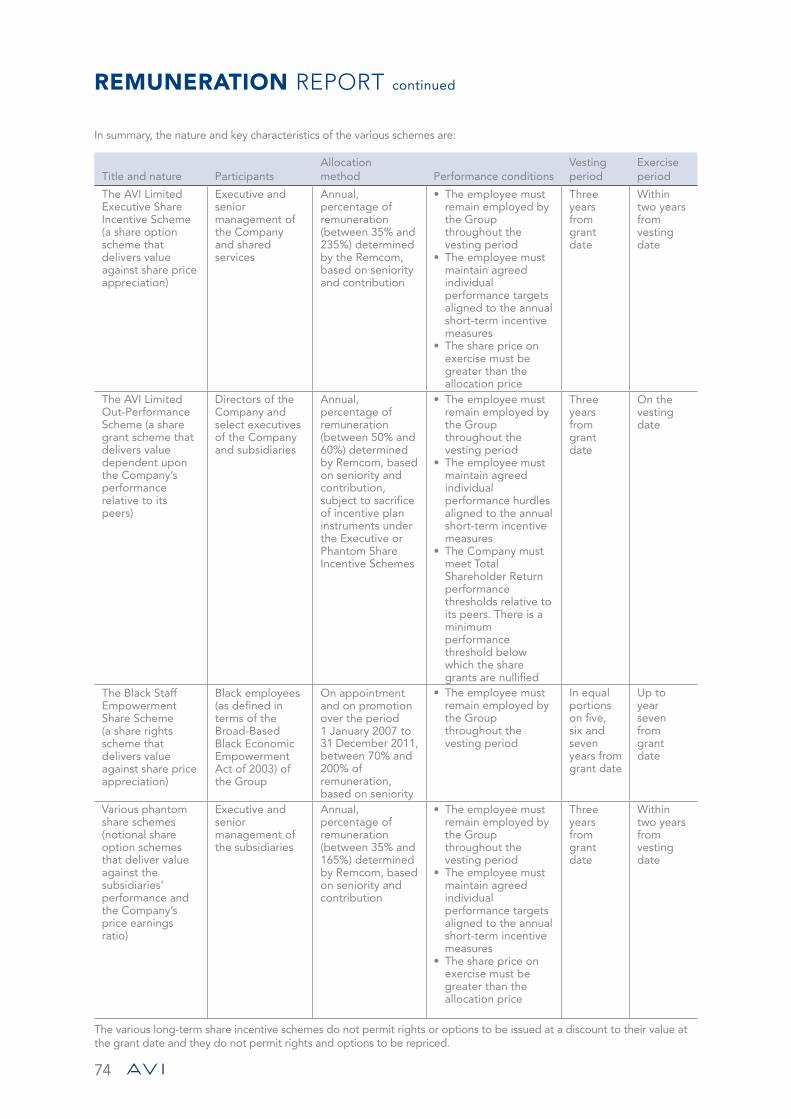
74
REMUNERATION REPORT continued
In summary, the nature and key characteristics of the various schemes are:
Title and nature ParticipantsAllocation method Performance conditions
Vesting period
Exercise period
The AVI Limited Executive Share Incentive Scheme (a share option scheme that delivers value against share price appreciation)
Executive and senior management of the Company and shared services
Annual, percentage of remuneration (between 35% and 235%) determined by the Remcom, based on seniority and contribution
• The employee must remain employed by the Group throughout the vesting period
• The employee must maintain agreed individual performance targets aligned to the annual short-term incentive measures
• The share price on exercise must be greater than the allocation price
Three years from grant date
Within two years from vesting date
The AVI Limited Out-Performance Scheme (a share grant scheme that delivers value dependent upon the Company’s performance relative to its peers)
Directors of the Company and select executives of the Company and subsidiaries
Annual, percentage of remuneration (between 50% and 60%) determined by Remcom, based on seniority and contribution, subject to sacrifice of incentive plan instruments under the Executive or Phantom Share Incentive Schemes
• The employee must remain employed by the Group throughout the vesting period
• The employee must maintain agreed individual performance hurdles aligned to the annual short-term incentive measures
• The Company must meet Total Shareholder Return performance thresholds relative to its peers. There is a minimum performance threshold below which the share grants are nullified
Three years from grant date
On the vesting date
The Black Staff Empowerment Share Scheme(a share rights scheme that delivers value against share price appreciation)
Black employees (as defined in terms of the Broad-Based Black Economic Empowerment Act of 2003) of the Group
On appointment and on promotion over the period 1 January 2007 to 31 December 2011, between 70% and 200% of remuneration, based on seniority
• The employee must remain employed by the Group throughout the vesting period
In equal portions on five, six and seven years from grant date
Up to year seven from grant date
Various phantom share schemes(notional share option schemes that deliver value against the subsidiaries’ performance and the Company’s price earnings ratio)
Executive and senior management of the subsidiaries
Annual, percentage of remuneration (between 35% and 165%) determined by Remcom, based on seniority and contribution
• The employee must remain employed by the Group throughout the vesting period
• The employee must maintain agreed individual performance targets aligned to the annual short-term incentive measures
• The share price on exercise must be greater than the allocation price
Three years from grant date
Within two years from vesting date
The various long-term share incentive schemes do not permit rights or options to be issued at a discount to their value at the grant date and they do not permit rights and options to be repriced.
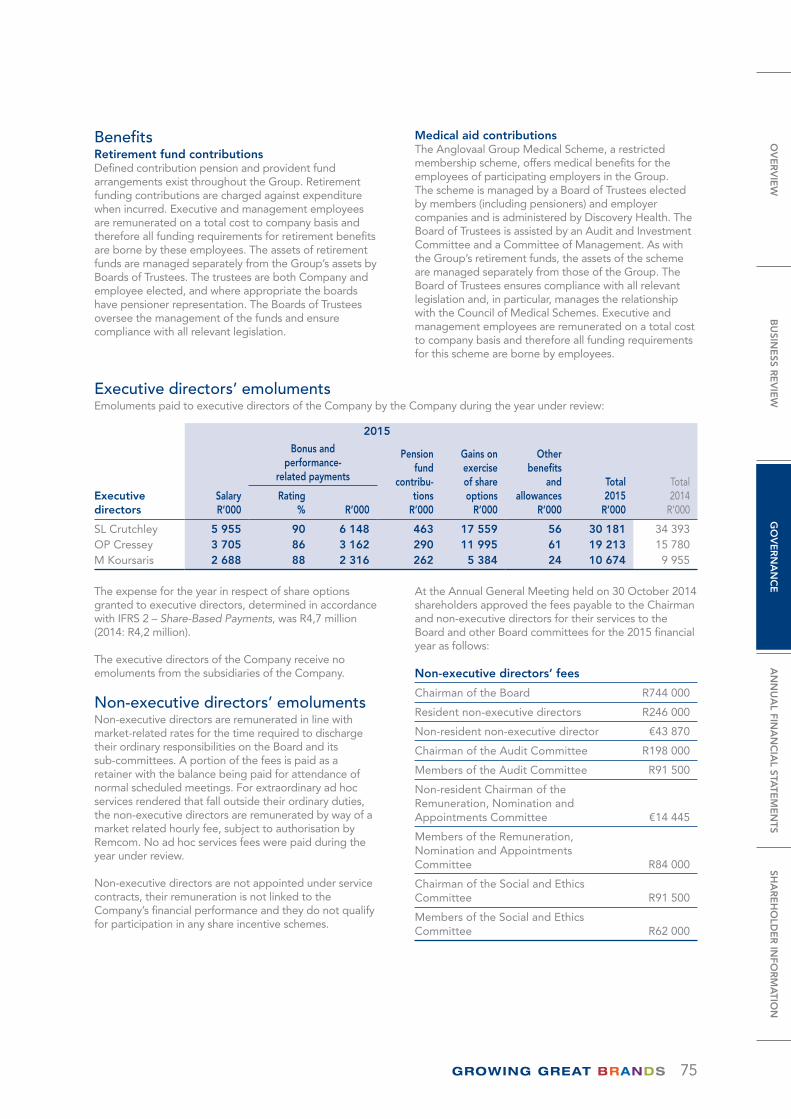
75
BenefitsRetirement fund contributionsDefined contribution pension and provident fund arrangements exist throughout the Group. Retirement funding contributions are charged against expenditure when incurred. Executive and management employees are remunerated on a total cost to company basis and therefore all funding requirements for retirement benefits are borne by these employees. The assets of retirement funds are managed separately from the Group’s assets by Boards of Trustees. The trustees are both Company and employee elected, and where appropriate the boards have pensioner representation. The Boards of Trustees oversee the management of the funds and ensure compliance with all relevant legislation.
Medical aid contributionsThe Anglovaal Group Medical Scheme, a restricted membership scheme, offers medical benefits for the employees of participating employers in the Group. The scheme is managed by a Board of Trustees elected by members (including pensioners) and employer companies and is administered by Discovery Health. The Board of Trustees is assisted by an Audit and Investment Committee and a Committee of Management. As with the Group’s retirement funds, the assets of the scheme are managed separately from those of the Group. The Board of Trustees ensures compliance with all relevant legislation and, in particular, manages the relationship with the Council of Medical Schemes. Executive and management employees are remunerated on a total cost to company basis and therefore all funding requirements for this scheme are borne by employees.
Executive directors’ emolumentsEmoluments paid to executive directors of the Company by the Company during the year under review:
2015
Executive directors
SalaryR’000
Bonus and performance-
related payments
Pension fund
contribu-tions
R’000
Gains on exercise of share options
R’000
Other benefits
and allowances
R’000
Total 2015
R’000
Total 2014
R’000Rating
% R’000
SL Crutchley 5 955 90 6 148 463 17 559 56 30 181 34 393OP Cressey 3 705 86 3 162 290 11 995 61 19 213 15 780M Koursaris 2 688 88 2 316 262 5 384 24 10 674 9 955
The expense for the year in respect of share options granted to executive directors, determined in accordance with IFRS 2 – Share-Based Payments, was R4,7 million (2014: R4,2 million).
The executive directors of the Company receive no emoluments from the subsidiaries of the Company.
Non-executive directors’ emolumentsNon-executive directors are remunerated in line with market-related rates for the time required to discharge their ordinary responsibilities on the Board and its sub-committees. A portion of the fees is paid as a retainer with the balance being paid for attendance of normal scheduled meetings. For extraordinary ad hoc services rendered that fall outside their ordinary duties, the non-executive directors are remunerated by way of a market related hourly fee, subject to authorisation by Remcom. No ad hoc services fees were paid during the year under review.
Non-executive directors are not appointed under service contracts, their remuneration is not linked to the Company’s financial performance and they do not qualify for participation in any share incentive schemes.
At the Annual General Meeting held on 30 October 2014 shareholders approved the fees payable to the Chairman and non-executive directors for their services to the Board and other Board committees for the 2015 financial year as follows:
Non-executive directors’ fees
Chairman of the Board R744 000
Resident non-executive directors R246 000
Non-resident non-executive director €43 870
Chairman of the Audit Committee R198 000
Members of the Audit Committee R91 500
Non-resident Chairman of the Remuneration, Nomination and Appointments Committee €14 445
Members of the Remuneration, Nomination and Appointments Committee R84 000
Chairman of the Social and Ethics Committee R91 500
Members of the Social and Ethics Committee R62 000
OV
ER
VIE
WB
USIN
ESS R
EV
IEW
GO
VE
RN
AN
CE
AN
NU
AL FIN
AN
CIA
L STATE
ME
NTS
SHA
RE
HO
LDE
R IN
FOR
MA
TION
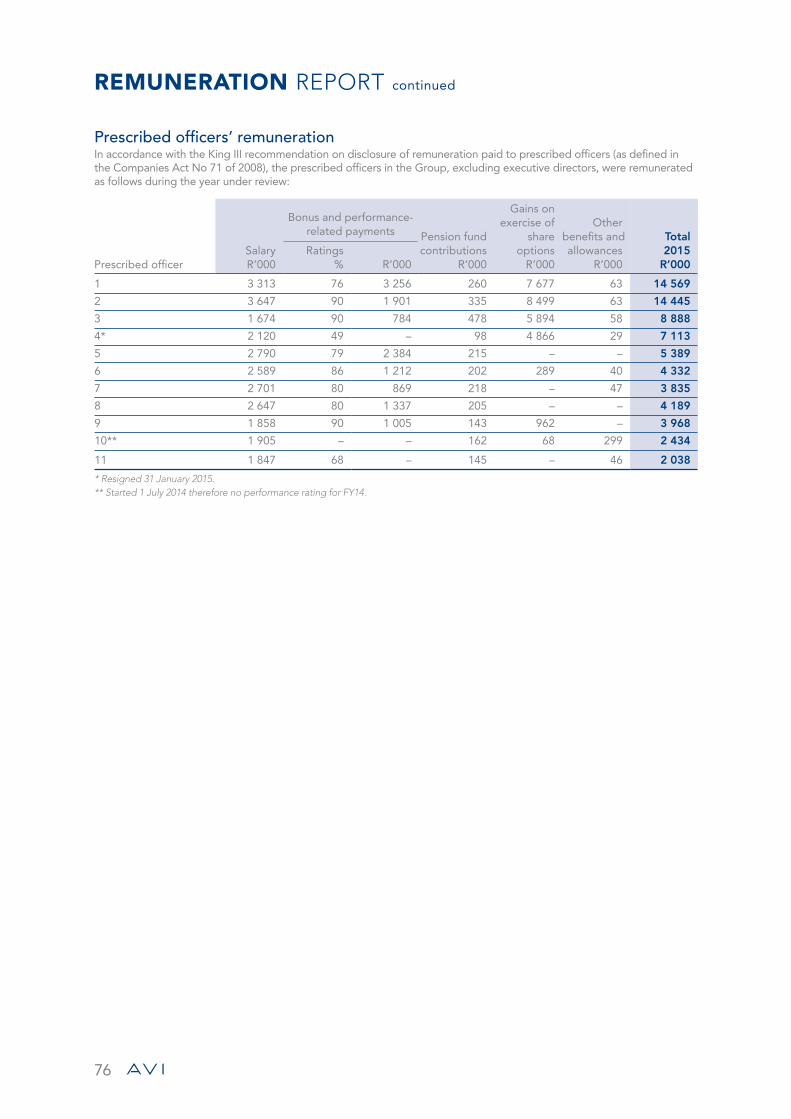
76
REMUNERATION REPORT continued
Prescribed officers’ remunerationIn accordance with the King III recommendation on disclosure of remuneration paid to prescribed officers (as defined in the Companies Act No 71 of 2008), the prescribed officers in the Group, excluding executive directors, were remunerated as follows during the year under review:
Prescribed officerSalaryR’000
Ratings% R’000
Pension fund contributions
R’000
Gains on exercise of
share options
R’000
Other benefits and allowances
R’000
Total 2015
R’000
1 3 313 76 3 256 260 7 677 63 14 569
2 3 647 90 1 901 335 8 499 63 14 445
3 1 674 90 784 478 5 894 58 8 888
4* 2 120 49 – 98 4 866 29 7 113
5 2 790 79 2 384 215 – – 5 389
6 2 589 86 1 212 202 289 40 4 332
7 2 701 80 869 218 – 47 3 835
8 2 647 80 1 337 205 – – 4 189
9 1 858 90 1 005 143 962 – 3 968
10** 1 905 – – 162 68 299 2 434
11 1 847 68 – 145 – 46 2 038
* Resigned 31 January 2015.** Started 1 July 2014 therefore no performance rating for FY14.
Bonus and performance- related payments
77
ANNUAL FINANCIAL STATEMENTS
78 Approval of Annual Financial Statements
78 Certificate of the Company Secretary
79 Independent Auditors’ Report
80 Directors’ Report
83 Directors’ Remuneration Report
85 Audit Committee Report
86 Segment reporting
90 Accounting policies
102 Balance sheets
103 Statements of comprehensive income
104 Statements of cash flows
105 Statements of changes in equity
107 Notes to the Financial Statements
148 Analysis of ordinary shareholders
SHAREHOLDER INFORMATION
149 Shareholders’ diary
150 Notice of Annual General Meeting
155 Form of proxy
CONTENTS
The Financial Statements of AVI Limited have been audited in compliance with section 30 of the Companies Act No 71 of 2008, as amended, and have been prepared under the supervision of Owen Cressey, CA(SA), the AVI Group Chief Financial Officer.
These financial statements were published on Monday, 7 September 2015.
OV
ER
VIE
WB
USIN
ESS R
EV
IEW
GO
VE
RN
AN
CE
AN
NU
AL FIN
AN
CIA
L STATE
ME
NTS
SHA
RE
HO
LDE
R IN
FOR
MA
TION
78
In terms of section 88(2)(e) of the Companies Act No 71 of 2008, as amended, I certify that, to the best of my knowledge and belief, the Company has lodged with the Companies and Intellectual Property Commission for the financial year ended 30 June 2015, all such returns required of a public company in terms of the Companies Act No 71 of 2008, as amended, and that all such returns are true, correct and up to date.
S Naidoo Company SecretaryIllovo, Johannesburg 4 September 2015
The Group Annual Financial Statements and Annual Financial Statements of AVI Limited, which appear on pages 80 to 148, were authorised for issue by the Board of directors on 4 September 2015 and are signed on their behalf.
GR Tipper SL CrutchleyNon-executive Chairman Chief Executive Officer
APPROVAL OF ANNUAL FINANCIAL STATEMENTS
CERTIFICATE OF THE COMPANY SECRETARY
79
INDEPENDENT AUDITORS’ REPORT
To the shareholders of AVI Limited We have audited the Group Financial Statements and the Financial Statements of AVI Limited, which comprise the balance sheets as at 30 June 2015, and the statements of comprehensive income, changes in equity and cash flows for the year then ended, and the notes to the Financial Statements, which include a summary of significant accounting policies and other explanatory notes as set out on pages 83 and 84 and pages 86 to 147.
Directors’ responsibility for the financial statements The Company’s directors are responsible for the preparation and fair presentation of these Financial Statements in accordance with International Financial Reporting Standards and the requirements of the Companies Act of South Africa, and for such internal control as the directors determine is necessary to enable the preparation of Financial Statements that are free from material misstatement, whether due to fraud or error.
Auditors’ responsibility Our responsibility is to express an opinion on these Financial Statements based on our audit. We conducted our audit in accordance with International Standards on Auditing. Those standards require that we comply with ethical requirements and plan and perform the audit to obtain reasonable assurance about whether the Financial Statements are free from material misstatement. An audit involves performing procedures to obtain audit evidence about the amounts and disclosures in the Financial Statements. The procedures selected depend on the auditor’s judgement, including the assessment of the risks of material misstatement of the Financial Statements, whether due to fraud or error. In making those risk assessments, the auditor considers internal control relevant to the entity’s preparation and fair presentation of the Financial Statements in order to design audit procedures that are appropriate in the circumstances, but not for the purpose of expressing an opinion on the effectiveness of the entity’s internal control. An audit also includes evaluating the appropriateness of accounting policies used and the reasonableness of accounting estimates made by management, as well as evaluating the overall presentation of the Financial Statements. We believe that the audit evidence we have obtained is sufficient and appropriate to provide a basis for our audit opinion.
Opinion In our opinion, these Financial Statements present fairly, in all material respects, the consolidated and separate financial position of AVI Limited at 30 June 2015, and its consolidated and separate financial performance and consolidated and separate cash flows for the year then ended in accordance with International Financial Reporting Standards, and the requirements of the Companies Act of South Africa.
Other reports required by the Companies Act As part of our audit of the Financial Statements for the year ended 30 June 2015, we have read the Directors’ Report, the Audit Committee’s Report and the Company Secretary’s Certificate for the purpose of identifying whether there are material inconsistencies between these reports and the audited Financial Statements. These reports are the responsibility of the respective preparers. Based on reading these reports we have not identified material inconsistencies between these reports and the audited Financial Statements. However, we have not audited these reports and accordingly do not express an opinion on these reports. KPMG Inc. Registered Auditor
Per G StanierChartered Accountant (SA) KPMG CrescentRegistered Auditor 85 Empire RoadDirector Parktown4 September 2015 Johannesburg
OV
ER
VIE
WB
USIN
ESS R
EV
IEW
GO
VE
RN
AN
CE
AN
NU
AL FIN
AN
CIA
L STATE
ME
NTS
SHA
RE
HO
LDE
R IN
FOR
MA
TION
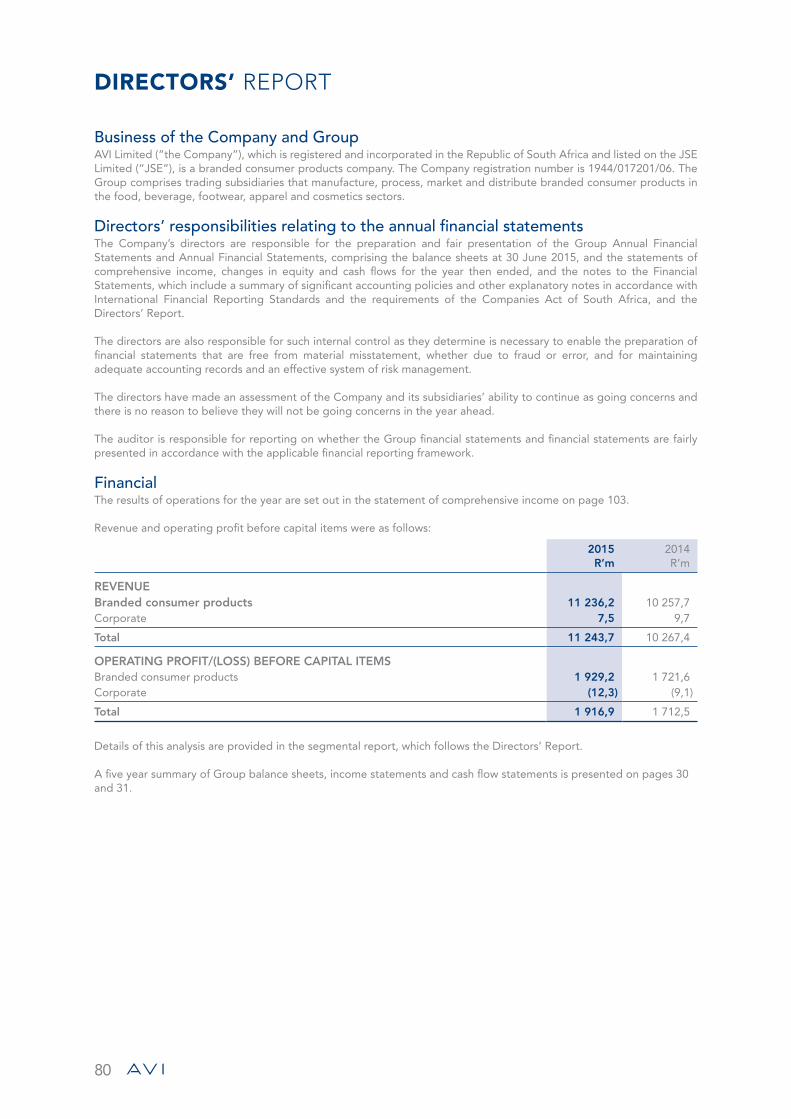
80
DIRECTORS’ REPORT
Business of the Company and GroupAVI Limited (“the Company”), which is registered and incorporated in the Republic of South Africa and listed on the JSE Limited (“JSE”), is a branded consumer products company. The Company registration number is 1944/017201/06. The Group comprises trading subsidiaries that manufacture, process, market and distribute branded consumer products in the food, beverage, footwear, apparel and cosmetics sectors.
Directors’ responsibilities relating to the annual financial statementsThe Company’s directors are responsible for the preparation and fair presentation of the Group Annual Financial Statements and Annual Financial Statements, comprising the balance sheets at 30 June 2015, and the statements of comprehensive income, changes in equity and cash flows for the year then ended, and the notes to the Financial Statements, which include a summary of significant accounting policies and other explanatory notes in accordance with International Financial Reporting Standards and the requirements of the Companies Act of South Africa, and the Directors’ Report.
The directors are also responsible for such internal control as they determine is necessary to enable the preparation of financial statements that are free from material misstatement, whether due to fraud or error, and for maintaining adequate accounting records and an effective system of risk management.
The directors have made an assessment of the Company and its subsidiaries’ ability to continue as going concerns and there is no reason to believe they will not be going concerns in the year ahead.
The auditor is responsible for reporting on whether the Group financial statements and financial statements are fairly presented in accordance with the applicable financial reporting framework.
FinancialThe results of operations for the year are set out in the statement of comprehensive income on page 103.
Revenue and operating profit before capital items were as follows:
2015R’m
2014R’m
REVENUEBranded consumer products 11 236,2 10 257,7 Corporate 7,5 9,7
Total 11 243,7 10 267,4
OPERATING PROFIT/(LOSS) BEFORE CAPITAL ITEMSBranded consumer products 1 929,2 1 721,6 Corporate (12,3) (9,1)
Total 1 916,9 1 712,5
Details of this analysis are provided in the segmental report, which follows the Directors’ Report.
A five year summary of Group balance sheets, income statements and cash flow statements is presented on pages 30 and 31.
81
Corporate activityThere have been no significant changes to investments during the year.
Share capitalDetails of the Company’s authorised and issued share capital are given in Note 7 to the financial statements, on pages 113 and 114.
Issues and redemptions during the yearA summary of the movement in the number of ordinary shares in issue during the year is given in Note 7 to the financial statements, on pages 113 and 114.
General authority for the Company to acquire its own sharesThe directors consider that it will be advantageous for the Company to have a general authority to acquire its own shares. Such authority will be utilised if the directors consider that it is in the best interests of the Company and shareholders to effect any such acquisitions having regard to prevailing circumstances and the cash resources of the Company at the appropriate time. Accordingly, shareholders will be asked to approve such general authority at the Annual General Meeting on 5 November 2015.
General authority for the Company to provide direct or indirect financial assistance to present or future subsidiariesThe directors consider that a general authority should be put in place to provide direct or indirect financial assistance to present or future subsidiaries and/or any other company or entity that is or becomes related or inter-related to the Company. Such authority assists the Company, inter alia, in making inter-company loans to subsidiaries as well as granting letters of support and guarantees in appropriate circumstances. The existence of a general authority avoids the need to refer each instance to shareholders for approval. This general authority was granted by shareholders at the 2014 Annual General Meeting of the Company and is valid up to and including the 2016 Annual General Meeting of the Company.
DividendsDividends, paid and proposed, are disclosed in Note 30 to the financial statements on page 122.
DirectorateMr BJK Smith resigned from the Board on 30 October 2014. There were no other changes to the Board during the year under review.
In terms of the Company’s Memorandum of Incorporation, Messrs MJ Bosman, A Nühn, AM Thebyane and Ms A Kawa retire at the forthcoming Annual General Meeting. All the retiring directors, being eligible, offer themselves for re-election.
In terms of the Companies Act the appointments of Messrs MJ Bosman (Chairman), JR Hersov and Mrs NP Dongwana to the Audit and Risk Committee need to be approved at the forthcoming Annual General Meeting.
Directors’ services contractsStandard terms and conditions of employment apply to executive directors, which, inter alia, provide for notice of termination of three months. Non-executive directors conclude service contracts with the Company on appointment. Their term of office is governed by the Memorandum of Incorporation which provides that one-third of the aggregate number of directors will retire by rotation at each Annual General Meeting, but may, if eligible, offer themselves for re-election.
Share schemesParticulars of the Group’s various share incentive schemes are set out in Note 32, on pages 124 to 128 of the financial statements.
OV
ER
VIE
WB
USIN
ESS R
EV
IEW
GO
VE
RN
AN
CE
AN
NU
AL FIN
AN
CIA
L STATE
ME
NTS
SHA
RE
HO
LDE
R IN
FOR
MA
TION
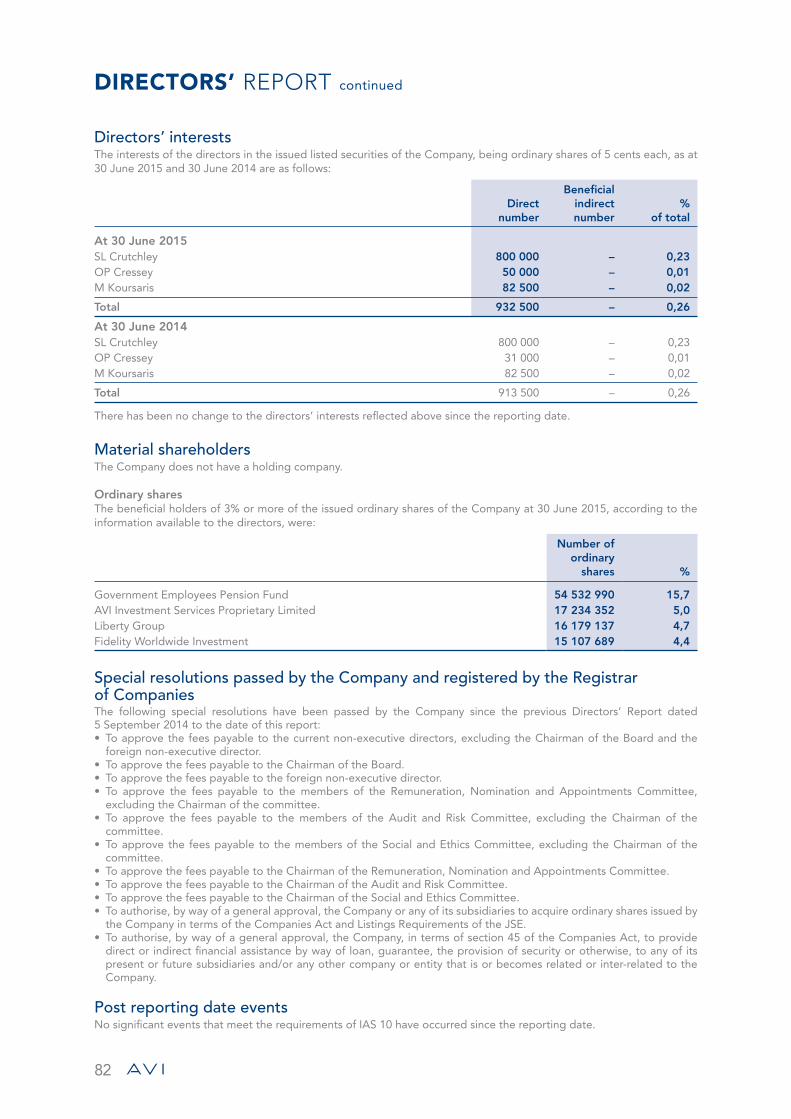
82
DIRECTORS’ REPORT continued
Directors’ interestsThe interests of the directors in the issued listed securities of the Company, being ordinary shares of 5 cents each, as at 30 June 2015 and 30 June 2014 are as follows:
Direct number
Beneficial indirect number
% of total
At 30 June 2015SL Crutchley 800 000 – 0,23 OP Cressey 50 000 – 0,01 M Koursaris 82 500 – 0,02
Total 932 500 – 0,26
At 30 June 2014SL Crutchley 800 000 – 0,23 OP Cressey 31 000 – 0,01 M Koursaris 82 500 – 0,02
Total 913 500 – 0,26
There has been no change to the directors’ interests reflected above since the reporting date.
Material shareholdersThe Company does not have a holding company.
Ordinary sharesThe beneficial holders of 3% or more of the issued ordinary shares of the Company at 30 June 2015, according to the information available to the directors, were:
Number of ordinary
shares %
Government Employees Pension Fund 54 532 990 15,7AVI Investment Services Proprietary Limited 17 234 352 5,0Liberty Group 16 179 137 4,7Fidelity Worldwide Investment 15 107 689 4,4
Special resolutions passed by the Company and registered by the Registrar of CompaniesThe following special resolutions have been passed by the Company since the previous Directors’ Report dated 5 September 2014 to the date of this report:• To approve the fees payable to the current non-executive directors, excluding the Chairman of the Board and the
foreign non-executive director.• To approve the fees payable to the Chairman of the Board.• To approve the fees payable to the foreign non-executive director.• To approve the fees payable to the members of the Remuneration, Nomination and Appointments Committee,
excluding the Chairman of the committee.• To approve the fees payable to the members of the Audit and Risk Committee, excluding the Chairman of the
committee.• To approve the fees payable to the members of the Social and Ethics Committee, excluding the Chairman of the
committee.• To approve the fees payable to the Chairman of the Remuneration, Nomination and Appointments Committee.• To approve the fees payable to the Chairman of the Audit and Risk Committee.• To approve the fees payable to the Chairman of the Social and Ethics Committee.• To authorise, by way of a general approval, the Company or any of its subsidiaries to acquire ordinary shares issued by
the Company in terms of the Companies Act and Listings Requirements of the JSE.• To authorise, by way of a general approval, the Company, in terms of section 45 of the Companies Act, to provide
direct or indirect financial assistance by way of loan, guarantee, the provision of security or otherwise, to any of its present or future subsidiaries and/or any other company or entity that is or becomes related or inter-related to the Company.
Post reporting date eventsNo significant events that meet the requirements of IAS 10 have occurred since the reporting date.
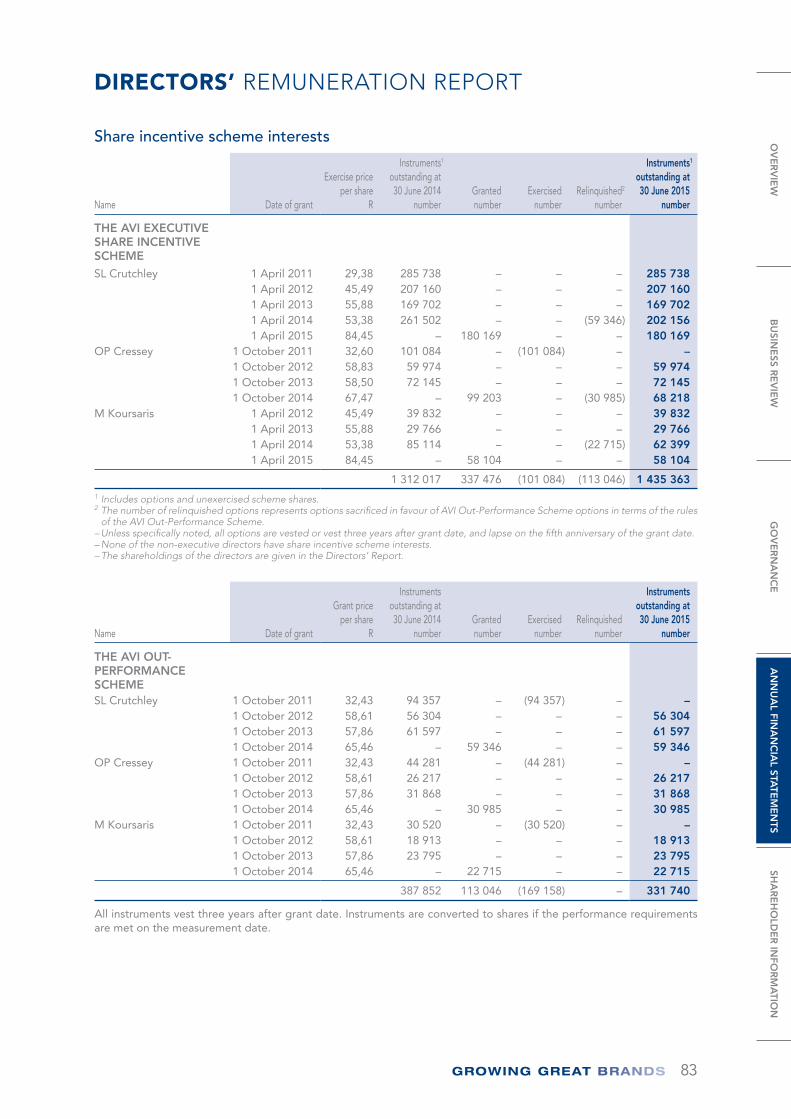
83
DIRECTORS’ REMUNERATION REPORT
Share incentive scheme interests
Name Date of grant
Exercise price per share
R
Instruments1 outstanding at30 June 2014
numberGranted number
Exercised number
Relinquished2
number
Instruments1 outstanding at30 June 2015
number
THE AVI EXECUTIVE SHARE INCENTIVE SCHEMESL Crutchley 1 April 2011 29,38 285 738 – – – 285 738
1 April 2012 45,49 207 160 – – – 207 160 1 April 2013 55,88 169 702 – – – 169 702 1 April 2014 53,38 261 502 – – (59 346) 202 156 1 April 2015 84,45 – 180 169 – – 180 169
OP Cressey 1 October 2011 32,60 101 084 – (101 084) – –1 October 2012 58,83 59 974 – – – 59 974 1 October 2013 58,50 72 145 – – – 72 145 1 October 2014 67,47 – 99 203 – (30 985) 68 218
M Koursaris 1 April 2012 45,49 39 832 – – – 39 832 1 April 2013 55,88 29 766 – – – 29 766 1 April 2014 53,38 85 114 – – (22 715) 62 399 1 April 2015 84,45 – 58 104 – – 58 104
1 312 017 337 476 (101 084) (113 046) 1 435 363 1 Includes options and unexercised scheme shares.2 The number of relinquished options represents options sacrificed in favour of AVI Out-Performance Scheme options in terms of the rules
of the AVI Out-Performance Scheme.– Unless specifically noted, all options are vested or vest three years after grant date, and lapse on the fifth anniversary of the grant date. – None of the non-executive directors have share incentive scheme interests.– The shareholdings of the directors are given in the Directors’ Report.
Name Date of grant
Grant price per share
R
Instruments outstanding at 30 June 2014
numberGranted number
Exercised number
Relinquishednumber
Instruments outstanding at30 June 2015
number
THE AVI OUT-PERFORMANCE SCHEMESL Crutchley 1 October 2011 32,43 94 357 – (94 357) – –
1 October 2012 58,61 56 304 – – – 56 304 1 October 2013 57,86 61 597 – – – 61 597 1 October 2014 65,46 – 59 346 – – 59 346
OP Cressey 1 October 2011 32,43 44 281 – (44 281) – –1 October 2012 58,61 26 217 – – – 26 217 1 October 2013 57,86 31 868 – – – 31 868 1 October 2014 65,46 – 30 985 – – 30 985
M Koursaris 1 October 2011 32,43 30 520 – (30 520) – –1 October 2012 58,61 18 913 – – – 18 913 1 October 2013 57,86 23 795 – – – 23 795 1 October 2014 65,46 – 22 715 – – 22 715
387 852 113 046 (169 158) – 331 740
All instruments vest three years after grant date. Instruments are converted to shares if the performance requirements are met on the measurement date.
OV
ER
VIE
WB
USIN
ESS R
EV
IEW
GO
VE
RN
AN
CE
AN
NU
AL FIN
AN
CIA
L STATE
ME
NTS
SHA
RE
HO
LDE
R IN
FOR
MA
TION
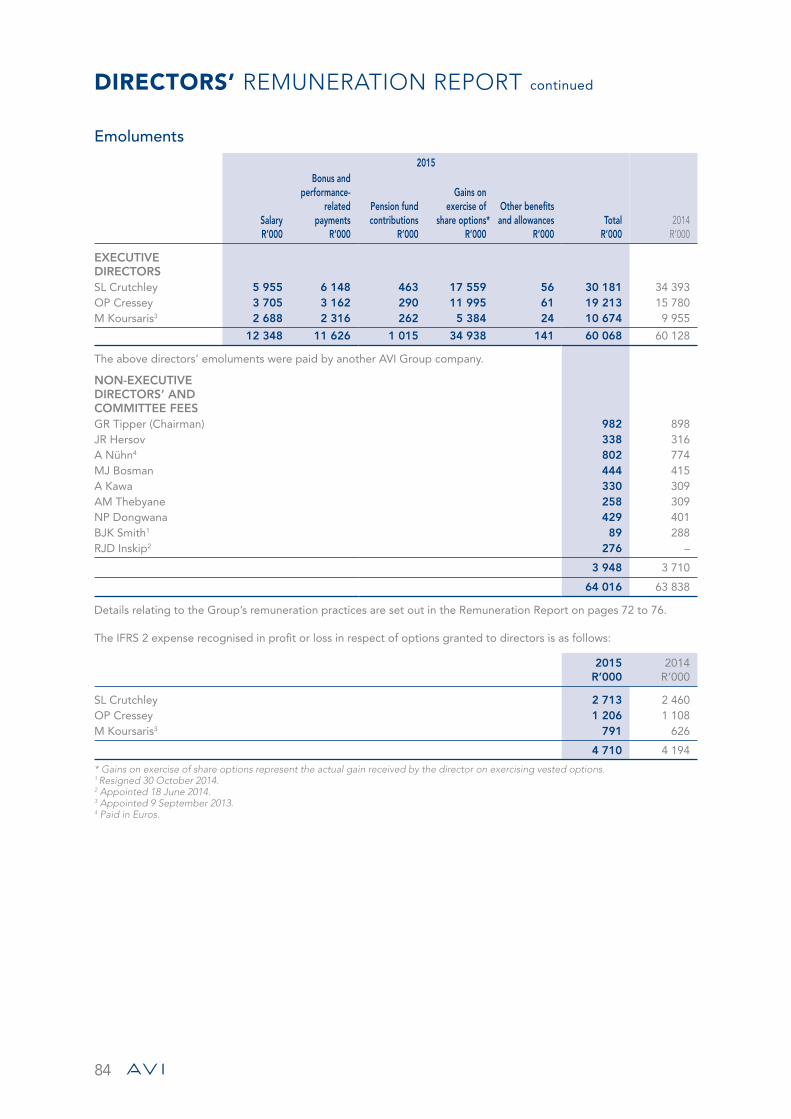
84
DIRECTORS’ REMUNERATION REPORT continued
Emoluments
2015
SalaryR’000
Bonus and performance-
related payments
R’000
Pension fund contributions
R’000
Gains on exercise of
share options*R’000
Other benefits and allowances
R’000Total
R’0002014
R’000
EXECUTIVE DIRECTORSSL Crutchley 5 955 6 148 463 17 559 56 30 181 34 393 OP Cressey 3 705 3 162 290 11 995 61 19 213 15 780 M Koursaris3 2 688 2 316 262 5 384 24 10 674 9 955
12 348 11 626 1 015 34 938 141 60 068 60 128
The above directors’ emoluments were paid by another AVI Group company.
NON-EXECUTIVE DIRECTORS’ AND COMMITTEE FEESGR Tipper (Chairman) 982 898 JR Hersov 338 316 A Nühn4 802 774 MJ Bosman 444 415 A Kawa 330 309 AM Thebyane 258 309 NP Dongwana 429 401 BJK Smith1 89 288 RJD Inskip2 276 –
3 948 3 710
64 016 63 838
Details relating to the Group’s remuneration practices are set out in the Remuneration Report on pages 72 to 76.
The IFRS 2 expense recognised in profit or loss in respect of options granted to directors is as follows:
2015R’000
2014R’000
SL Crutchley 2 713 2 460 OP Cressey 1 206 1 108 M Koursaris3 791 626
4 710 4 194
* Gains on exercise of share options represent the actual gain received by the director on exercising vested options.1 Resigned 30 October 2014.2 Appointed 18 June 2014.3 Appointed 9 September 2013. 4 Paid in Euros.

85
AUDIT COMMITTEE REPORT
The Audit Committee is pleased to present its report for the financial year ended 30 June 2015 in terms of section 94(7)(f) of the Companies Act No 71 of 2008, as amended (“the Companies Act”).
The Audit Committee has adopted formal terms of reference, delegated to it by the Board of directors, as its charter. The charter is in line with the Companies Act, the King Code and Report on Corporate Governance for South Africa (“King lll”) and the JSE Listings Requirements. The Committee has discharged the functions delegated to it in terms of its charter. The Audit Committee’s process is supported by the operating subsidiary companies which have internal review committees that monitor risk management and compliance activities. There is a formal reporting line from the various internal review committees into the Audit Committee via the Company’s Chief Financial Officer.
During the year under review the Committee performed the following statutory duties:
1. Reviewed and recommended for adoption by the Board such financial information as is publicly disclosed which for the year included:
• The interim results for the six months ended 31 December 2014; and • The Annual Financial Statements for the year ended 30 June 2015.2. Considered and satisfied itself that the external auditors KPMG Inc. are independent.3. Approved the external auditors’ budgeted fees and terms of engagement for the 2015 financial year.4. Determined the non-audit related services which the external auditors were permitted to provide to AVI and reviewed
the policy for the use of the external auditors for non-audit related services. All non-audit related service agreements between the AVI Group and the external auditors were pre-approved.
5. Resolved to continue to co-source the internal audit function from Ernst & Young during the financial year.6. Reviewed the Audit Committee charter in line with King lll recommendations.7. Reviewed the internal audit charter in line with King lll recommendations.8. Confirmed the internal audit plan for the 2015 financial year.9. Reviewed the IT governance structure for the AVI Group.10. Confirmed that adequate whistle-blowing facilities were in place throughout the AVI Group and reviewed and
considered actions taken with regard to incident reports.11. Held separate meetings with management, the external and internal auditors to discuss any problems and reservations
arising from the year end audit and other matters that they wished to discuss.12. Noted that it had not received any complaints, either from within or outside the Company, relating either to the
accounting practices, the internal audits, the content or auditing of the financial statements, the internal financial controls or any other related matter.
13. Conducted a self-evaluation exercised into its effectiveness.14. Recommended to the Board the reappointment of KPMG Inc. as the Group auditors for the year ending 30 June 2016
and that Mr N Southon replace Mr G Stanier as the registered auditor responsible for the audit in compliance with the auditor rotation requirements imposed by the Companies Act. This will be considered at the forthcoming Annual General Meeting.
15. Evaluated and satisfied itself as to the appropriateness of the expertise and experience of the Company’s financial director.
16. Satisfied itself as to the expertise, resources and experience of the Company’s finance function.
For further details regarding the Audit Committee, shareholders are referred to the Corporate Governance Report on page 63.
On behalf of the Audit Committee
MJ BosmanAudit Committee Chairman4 September 2015
OV
ER
VIE
WB
USIN
ESS R
EV
IEW
GO
VE
RN
AN
CE
AN
NU
AL FIN
AN
CIA
L STATE
ME
NTS
SHA
RE
HO
LDE
R IN
FOR
MA
TION
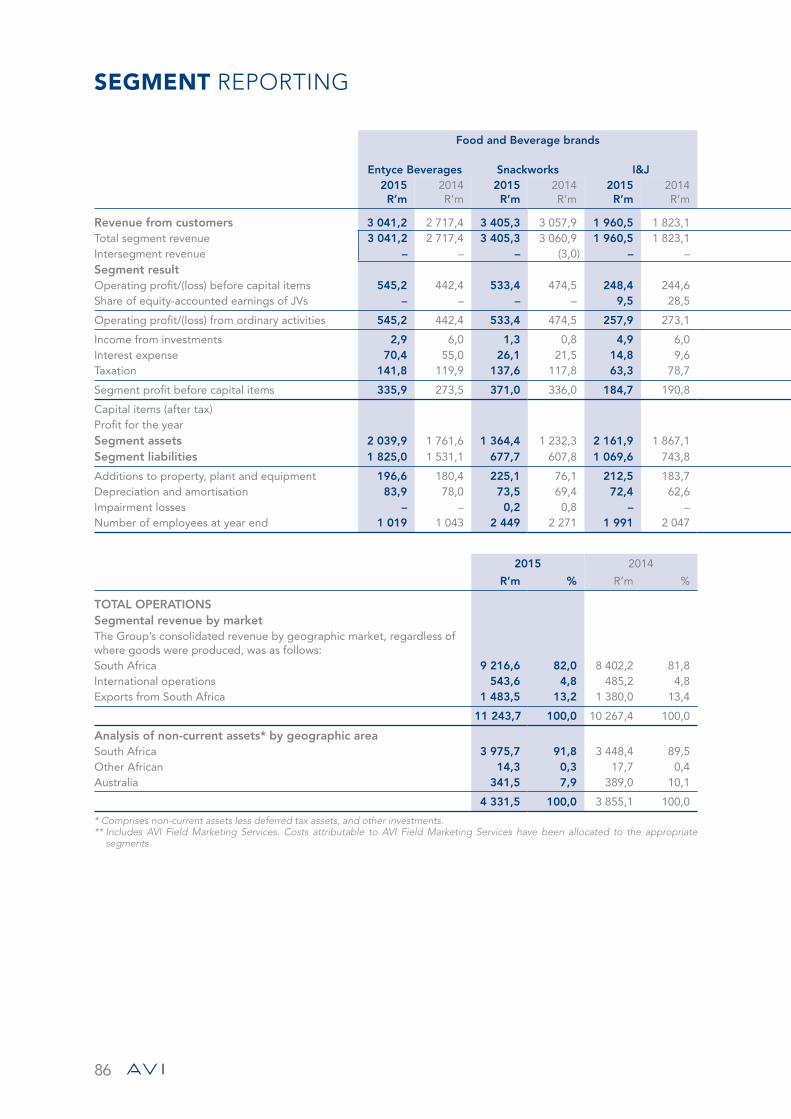
86
SEGMENT REPORTING
Food and Beverage brands
Entyce Beverages Snackworks I&J2015R’m
2014R’m
2015R’m
2014R’m
2015R’m
2014R’m
Revenue from customers 3 041,2 2 717,4 3 405,3 3 057,9 1 960,5 1 823,1 Total segment revenue 3 041,2 2 717,4 3 405,3 3 060,9 1 960,5 1 823,1 Intersegment revenue – – – (3,0) – –Segment resultOperating profit/(loss) before capital items 545,2 442,4 533,4 474,5 248,4 244,6 Share of equity-accounted earnings of JVs – – – – 9,5 28,5
Operating profit/(loss) from ordinary activities 545,2 442,4 533,4 474,5 257,9 273,1
Income from investments 2,9 6,0 1,3 0,8 4,9 6,0 Interest expense 70,4 55,0 26,1 21,5 14,8 9,6 Taxation 141,8 119,9 137,6 117,8 63,3 78,7
Segment profit before capital items 335,9 273,5 371,0 336,0 184,7 190,8
Capital items (after tax)Profit for the yearSegment assets 2 039,9 1 761,6 1 364,4 1 232,3 2 161,9 1 867,1 Segment liabilities 1 825,0 1 531,1 677,7 607,8 1 069,6 743,8
Additions to property, plant and equipment 196,6 180,4 225,1 76,1 212,5 183,7 Depreciation and amortisation 83,9 78,0 73,5 69,4 72,4 62,6 Impairment losses – – 0,2 0,8 – –Number of employees at year end 1 019 1 043 2 449 2 271 1 991 2 047
2015 2014
R’m % R’m %
TOTAL OPERATIONSSegmental revenue by marketThe Group’s consolidated revenue by geographic market, regardless of where goods were produced, was as follows:South Africa 9 216,6 82,0 8 402,2 81,8International operations 543,6 4,8 485,2 4,8Exports from South Africa 1 483,5 13,2 1 380,0 13,4
11 243,7 100,0 10 267,4 100,0
Analysis of non-current assets* by geographic areaSouth Africa 3 975,7 91,8 3 448,4 89,5Other African 14,3 0,3 17,7 0,4Australia 341,5 7,9 389,0 10,1
4 331,5 100,0 3 855,1 100,0
* Comprises non-current assets less deferred tax assets, and other investments.** Includes AVI Field Marketing Services. Costs attributable to AVI Field Marketing Services have been allocated to the appropriate
segments.
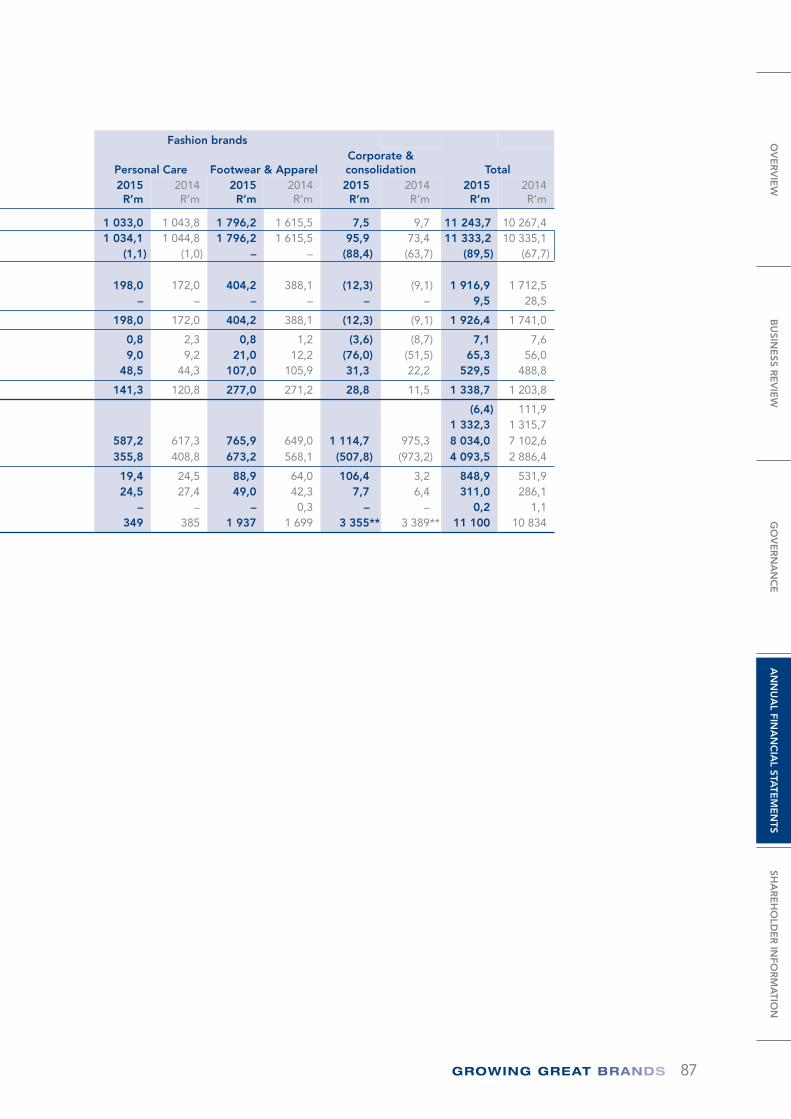
87
Fashion brands
Personal Care Footwear & ApparelCorporate & consolidation Total
2015R’m
2014R’m
2015R’m
2014R’m
2015R’m
2014R’m
2015R’m
2014R’m
1 033,0 1 043,8 1 796,2 1 615,5 7,5 9,7 11 243,7 10 267,4 1 034,1 1 044,8 1 796,2 1 615,5 95,9 73,4 11 333,2 10 335,1
(1,1) (1,0) – – (88,4) (63,7) (89,5) (67,7)
198,0 172,0 404,2 388,1 (12,3) (9,1) 1 916,9 1 712,5 – – – – – – 9,5 28,5
198,0 172,0 404,2 388,1 (12,3) (9,1) 1 926,4 1 741,0
0,8 2,3 0,8 1,2 (3,6) (8,7) 7,1 7,6 9,0 9,2 21,0 12,2 (76,0) (51,5) 65,3 56,0
48,5 44,3 107,0 105,9 31,3 22,2 529,5 488,8
141,3 120,8 277,0 271,2 28,8 11,5 1 338,7 1 203,8
(6,4) 111,9 1 332,3 1 315,7
587,2 617,3 765,9 649,0 1 114,7 975,3 8 034,0 7 102,6 355,8 408,8 673,2 568,1 (507,8) (973,2) 4 093,5 2 886,4
19,4 24,5 88,9 64,0 106,4 3,2 848,9 531,9 24,5 27,4 49,0 42,3 7,7 6,4 311,0 286,1
– – – 0,3 – – 0,2 1,1 349 385 1 937 1 699 3 355** 3 389** 11 100 10 834
OV
ER
VIE
WB
USIN
ESS R
EV
IEW
GO
VE
RN
AN
CE
AN
NU
AL FIN
AN
CIA
L STATE
ME
NTS
SHA
RE
HO
LDE
R IN
FOR
MA
TION
88
SEGMENT REPORTING continued
Basis of segment presentationThe segment information has been prepared in accordance with IFRS 8 – Operating Segments (“IFRS 8”) which defines requirements for the disclosure of financial information of an entity’s operating segments. The standard requires segmentation based on the Group’s internal organisation and internal accounting presentation of revenue and operating income.
Identification of reportable segmentsThe Group discloses its reportable segments according to the entity components that management monitors regularly in making decisions about operating matters. The reportable segments comprise various operating segments primarily located in South Africa.
The revenue and operating assets are further disclosed within the geographical areas in which the Group operates. Segment information is prepared in conformity with the basis that is reported to the CEO, who is the chief operating decision maker, in assessing segment performance and allocating resources to segments. These values have been reconciled to the consolidated financial statements. The basis reported by the Group is in accordance with the accounting policies adopted for preparing and presenting the consolidated financial statements.
Segment revenue excludes Value Added Taxation and includes intersegment revenue. Revenue from customers represents segment revenue from which intersegment revenue has been eliminated. Sales between segments are made on a commercial basis.
Segment operating profit before capital items represents segment revenue less segment operating expenses, excluding capital items included in Note 19.
Segment expenses include direct and allocated expenses. Depreciation and amortisation have been allocated to the segments to which they relate.
The segment assets comprise all assets that are employed by the segment and that either are directly attributable to the segment, or can be allocated to the segment on a reasonable basis.
The number of employees per segment represents the total number of permanent and temporary employees at year end.
Reportable segmentsEntyce BeveragesRevenue in this segment is derived from the sale of tea, coffee and creamer, primarily in South Africa and neighbouring countries.
The Coffee category includes the supply of premium ground coffee and beverage service solutions to the out-of-home consumption market including airports, hotels, caterers, restaurants and corporates.
SnackworksThe principal activity within this segment is the sale of a full range of sweet and savoury biscuits and baked and fried potato and maize snacks, primarily in South Africa and neighbouring countries.
89
I&JI&J catches fish in South African waters, and processes, markets and distributes premium quality value-added seafood in local and international markets (mainly Europe and Australia).
Fashion brandsFashion brands provides personal care and footwear and apparel offerings.
Personal CareIndigo Brands, which forms the base for the Personal Care segment, creates, manufactures and distributes leading cosmetic and toiletry products that range from mass market to bridge fragrances. These products are sold primarily in South Africa and neighbouring countries.
Footwear and ApparelSpitz, Green Cross and Gant make up the Footwear and Apparel segment and retail a portfolio of owned and licensed footwear and apparel brands in South Africa.
CorporateThe corporate office provides strategic direction, as well as financial, treasury, legal and information technology services to the largely autonomous subsidiaries. Other entities in this segment comprise the various staff scheme share trusts.
Geographical informationThe Group’s operations are principally located in South Africa. The Australian asset comprises I&J’s interest in an Australian fish processing joint venture with Simplot (Australia) Proprietary Limited.
Major customersThe Group’s most significant customers, being two South African retailers, individually contribute to more than 10% of the Group’s revenue (R2 650,6 million in the current year and R2 433,0 million in the previous year) in the Entyce, Snackworks and I&J segments.
OV
ER
VIE
WB
USIN
ESS R
EV
IEW
GO
VE
RN
AN
CE
AN
NU
AL FIN
AN
CIA
L STATE
ME
NTS
SHA
RE
HO
LDE
R IN
FOR
MA
TION
90
ACCOUNTING POLICIES
AVI Limited (the “Company”) is a South African registered company. The consolidated Financial Statements of the Company for the year ended 30 June 2015 comprise the Company and its subsidiaries (together referred to as the “Group”) and the Group’s interest in joint ventures. Where reference is made to the Group in the accounting policies, it should be interpreted as also referring to the Company where the context requires, unless otherwise noted.
Statement of complianceThe Group Financial Statements and Financial Statements have been prepared in accordance with International Financial Reporting Standards (“IFRS”), in compliance with JSE Listings Requirements, the interpretations adopted by the International Accounting Standards Board (“IASB”), the SAICA Financial Reporting Guides as issued by the Accounting Practices Committee and Financial Reporting Pronouncements as issued by the Financial Reporting Standards Council, and the requirements of the Companies Act of South Africa.
Basis of preparationThese financial statements are prepared in millions of South African Rand (“R’m”), which is the Company’s functional currency, on a historical cost basis, except for the following assets and liabilities which are stated at their fair value: • derivative financial instruments and biological assets;• liabilities for cash-settled share-based payment arrangements; and • non-current assets and disposal groups held-for-sale are stated at the lower of carrying amount and fair value less
costs to sell.
The preparation of financial statements in conformity with IFRS requires management to make judgements, estimates and assumptions that may affect the application of accounting policies and reported amounts of assets, liabilities, income and expenses. The estimates and associated assumptions are based on historical experience and various other factors that are believed to be reasonable under the circumstances, the results of which form the basis of making the judgements about carrying values of assets and liabilities that are not readily apparent from other sources. Actual results may differ from these estimates.
The estimates and underlying assumptions are reviewed on an ongoing basis. Revisions to accounting estimates are recognised in the period in which the estimate is revised if the revision only affects that period, or in the period of the revision and future periods if the revision affects both current and future periods.
In particular, information about areas of estimation and critical judgements in applying accounting policies that have the most significant effect on the amounts recognised in the financial statements are described in the following notes: Note 1 – useful lives and residual values of property, plant and equipmentNote 2 – useful lives and impairment tests on intangible assetsNote 3 – utilisation of tax lossesNote 9 – measurement of defined benefit obligations.
The accounting policies set out below have been applied consistently to the periods presented in these financial statements, except for the adoption of the new and revised accounting standards as detailed below.
Adoption of new and revised accounting standardsThe Group has adopted the following new and revised accounting standards, including any consequential amendments to other standards, with a date of initial application of 1 July 2014:• Amendments to IAS 32 – Financial Instruments: Presentation – Offsetting Financial Assets and Financial Liabilities• Annual improvements to IFRSs: 2010 – 2012 and 2011 – 2013 (various standards).
The new and revised standards described below have been adopted in accordance with IAS 8 – Accounting Policies, Changes in Accounting Estimates and Errors as well as the specific requirements of each individual standard.
Amendments to IAS 32 – Financial Instruments: Presentation – Offsetting Financial Assets and Financial LiabilitiesThe amendment provides clarity regarding situations resulting in legally enforceable rights to offset financial assets and financial liabilities.
The application of the guidance provided by the amendments to IAS 32 has not significantly changed the Group’s approach regarding the offsetting of financial assets and liabilities.
91
Annual improvements to IFRSs: 2010 – 2012 and 2011 – 2013 (various standards)The new cycles of improvements form part of the IASB’s annual improvements process to make non-urgent but necessary amendments to IFRS. Amendments have been made to a total of nine standards.
The implementation of the improvements has not had a significant impact on the Group’s results.
Basis of consolidationSubsidiariesThe consolidated Financial Statements include the financial statements of the Company and its subsidiaries. Where an investment in a subsidiary is acquired or disposed of during the financial year its results are included from, or to, the date control commences or ceases. Any surplus or deficit arising on the loss of control is recognised in profit or loss.
Subsidiaries are those entities controlled by the Group. An investor controls an investee when it is exposed, or has rights, to variable returns from its involvement with the investee and has the ability to affect those returns through its power over the investee.
Losses applicable to non-controlling interests in a subsidiary are allocated to the non-controlling interest even if doing so causes the non-controlling interest to have a deficit balance.
Transaction costs that the Group incurs in connection with a business combination are expensed as incurred.
Joint arrangementsJoint arrangements are those entities in respect of which there is a contractual agreement whereby the Group and one or more other parties undertake an economic activity, which is subject to joint control.
A joint venture is an arrangement in which the Group has joint control, whereby the Group has rights to the net assets of the arrangement, rather than rights to its assets and obligations for its liabilities.
The Group’s participation in joint ventures is accounted for using the equity method. They are recognised initially at cost, which includes transaction costs. Subsequent to initial recognition, the consolidated financial statements include the Group’s share of profit or loss and other comprehensive income of the equity-accounted investees, until the date on which joint control ceases.
Eliminations on consolidationIntra-group balances and transactions, and any unrealised gains or losses arising from intra-group transactions, are eliminated in preparing the consolidated financial statements. Unrealised gains arising from transactions with joint ventures are eliminated to the extent of the Group’s interest in these enterprises. Unrealised losses on transactions with joint ventures are eliminated in the same way as unrealised gains except that they are only eliminated to the extent that there is no evidence of impairment.
GoodwillAll business combinations are accounted for by applying the “acquisition method”, as at acquisition date, which is the date on which control is transferred to the Group. For acquisitions taking place on or after 1 July 2009, the Group measures goodwill as the fair value of the consideration transferred including the recognised amount of any non-controlling interest in the acquiree, less the net recognised amount (generally fair value) of the identifiable assets acquired and liabilities assumed, all measured as at the acquisition date.
Consideration transferred includes the fair values of the assets transferred, liabilities incurred by the Group to the previous owners of the acquiree, and equity interests issued by the Group. Consideration transferred also includes the fair value of any contingent consideration and share-based payment awards of the acquiree that are replaced mandatorily in the business combination. If a business combination results in the termination of pre-existing relationships between the Group and the acquiree, then the lower of the termination amount, as contained in the agreement, and the value of the off-market element is deducted from the consideration transferred and recognised in expenses.
The Group measures any non-controlling interest at either fair value or at the non-controlling interest’s proportionate share of the acquiree’s identifiable assets. This election is made on a transaction-by-transaction basis.
OV
ER
VIE
WB
USIN
ESS R
EV
IEW
GO
VE
RN
AN
CE
AN
NU
AL FIN
AN
CIA
L STATE
ME
NTS
SHA
RE
HO
LDE
R IN
FOR
MA
TION
92
ACCOUNTING POLICIES continued
Goodwill is stated at cost less accumulated impairment losses. Goodwill is allocated to cash-generating units and is tested annually for impairment. In respect of equity-accounted investees, the carrying amount of goodwill is included in the carrying amount of the investment, and an impairment loss on such an investment is not allocated to any asset, including goodwill, that forms part of the carrying amount of the equity-accounted investee.
A bargain purchase gain arising on an acquisition is recognised directly in profit or loss as a capital item.
Premiums and discounts arising on subsequent purchases from, or sales to, non-controlling interests in subsidiariesFollowing the presentation of non-controlling interests in equity, any increases and decreases in ownership interests in subsidiaries without a change in control are recognised as equity transactions in the consolidated financial statements. Accordingly, any premiums or discounts on subsequent purchases of equity instruments from, or sales of equity instruments to, non-controlling interests are recognised directly in the equity of the parent shareholder.
Business combinations involving entities under common controlBusiness combinations involving entities or businesses under common control comprise business combinations where both entities remain under the ultimate control of the Group before and after the combination, and that control is not transitory. The assets and liabilities in common control transactions within the Group are transferred at existing carrying value.
Black economic empowerment (“BEE”) transactionsBEE transactions involving the disposal or issue of equity interests in subsidiaries are only recognised when the accounting recognition criteria have been met.
Although economic and legal ownership of such instruments may have transferred to the BEE partner, the derecognition of such equity interests sold or recognition of equity instruments issued in the underlying subsidiary by the parent shareholder is postponed until the accounting recognition or derecognition criteria have been satisfied.
A dilution in the earnings attributable to the parent shareholders (in the interim period until accounting recognition criteria have been met) is adjusted for in the diluted earnings per share calculation by an appropriate adjustment to the earnings used in such calculation.
Borrowing costsBorrowing costs that are directly attributable to the acquisition or construction of an asset, that requires a substantial period of time to prepare for its intended use, are capitalised. Interest is capitalised over the period during which the qualifying asset is being acquired or constructed and where borrowings have been incurred. Capitalisation ceases when the construction is interrupted for an extended period or when the qualifying asset is substantially complete. All other borrowing costs are recognised in profit or loss using the effective interest method.
Cash and cash equivalentsFor the purposes of the cash flow statement, cash and cash equivalents comprise cash balances on hand, deposits held on call with banks, net of overdrafts forming part of the Group’s cash management, all of which are available for use by the Group unless otherwise stated. Cash and cash equivalents are measured at amortised cost.
Capital itemsCapital items are items of income and expense relating to the acquisition, disposal or impairment of investments, businesses, property, plant and equipment and intangible assets.
Capital items relate to separately identifiable remeasurements (not adjusted for related taxation and related non-controlling interests) other than included remeasurements specifically included in headline earnings as defined in Circular 2/2013 – Headline earnings.
Discontinued operations A discontinued operation is a clearly distinguishable component of the Group’s business that is abandoned or disposed of pursuant to a single plan and which represents a separate major line of business or geographical area of operation that can be distinguished physically, operationally and for financial reporting purposes.
Classification as a discontinued operation occurs upon disposal or when the operation meets the criteria to be classified as held-for-sale, if earlier. When an operation is classified as a discontinued operation the comparative profit or loss is restated as if the operation had been discontinued from the start of the previous period.
93
Dividends payableDividends payable are recognised in the period in which such dividends are declared.
Employee benefitsShort-term employee benefitsThe cost of all short-term employee benefits is recognised during the period in which the employee renders the related service.
The accruals for employee entitlements to salaries, performance bonuses and annual leave represent the amounts which the Group has a present obligation to pay as a result of employees’ services provided to the reporting date. The accruals have been calculated at undiscounted amounts based on current salary levels at the reporting date.
Defined contribution plansThe Group provides defined contribution plans for the benefit of employees, the assets of which are held in separate funds. These funds are funded by payments from employees and the Group. The Group’s contributions to defined contribution plans are charged to profit or loss in the year to which they relate.
Defined benefit obligationsThe Group’s obligation to provide post-retirement medical aid benefits are defined benefit obligations. The projected unit credit method is used to determine the present value of the defined benefit obligations, the related current service cost and, where applicable, the past service cost.
When the benefits of a plan are changed, or when a plan is curtailed, the resulting change in benefit that relates to past service or the gain or loss on curtailment is recognised immediately in profit or loss.
The Group recognises all actuarial gains and losses in respect of defined benefit obligations directly in other comprehensive income immediately.
Other long-term employee benefitsThe Group’s net obligation in respect of long-term employee benefits other than post-retirement and pension plans is the amount of future benefit that employees have earned in return for their services in the current and prior periods.
That benefit is discounted to determine its present value and the fair value of any related assets is deducted. The calculation of benefits is performed using the projected unit credit method. Any actuarial gains or losses are recognised in profit or loss in the period in which they arise.
Termination benefitsTermination benefits are expensed at the earlier of when the Group can no longer withdraw from the offer of those benefits and when the Group recognises costs for a restructuring. If the benefits are payable more than 12 months after the reporting date, they are discounted to their present value.
Share-based payment transactionsGroup share-based payment transactionsTransactions in which a parent grants rights to its own equity instruments directly to the employees of its subsidiaries are classified as equity-settled in the financial statements of the parent. The subsidiary classifies these transactions as equity-settled in its financial statements where it has no obligation to settle the share-based payment transaction.
The subsidiary recognises the services acquired with the share-based payment as an expense and recognises a corresponding increase in equity as a capital contribution from the parent for those services acquired. The parent recognises in equity the equity-settled share-based payment and recognises a corresponding increase in the investment in subsidiary.
Equity-settledThe fair value of share options granted to Group employees is recognised as an employee expense with a corresponding increase in equity. The fair value is measured at grant date and expensed over the period during which the employee becomes unconditionally entitled to the equity instruments. The fair value of the instruments granted is measured using generally accepted valuation techniques, taking into account the terms and conditions upon which the instruments are granted. The amount recognised as an expense is adjusted to reflect the actual number of share options that vest except where forfeiture is only due to market conditions not being met.
OV
ER
VIE
WB
USIN
ESS R
EV
IEW
GO
VE
RN
AN
CE
AN
NU
AL FIN
AN
CIA
L STATE
ME
NTS
SHA
RE
HO
LDE
R IN
FOR
MA
TION
94
ACCOUNTING POLICIES continued
Cash-settledThe fair value of the amount payable to employees in respect of share appreciation rights, which are settled in cash, is recognised as an expense, with a corresponding increase in liabilities, over the period in which the employee becomes unconditionally entitled to payment. The liability is remeasured at each reporting date and at settlement date. Any changes in the fair value of the liability are recognised in profit or loss.
Black economic empowerment transactionsWhere goods or services are considered to have been received from black economic empowerment partners as consideration for equity instruments of the Group, these transactions are accounted for as share-based payment transactions, even when the entity cannot specifically identify the goods or services received.
Group share scheme recharge arrangementsA recharge arrangement exists whereby the cost to the scheme of acquiring shares issued in accordance with certain share schemes granted by the holding company shall be funded by way of contributions from employer companies in respect of participants who are their employees. The recharge arrangement is accounted for separately from the underlying equity-settled share-based payment upon initial recognition, as follows: • The subsidiary recognises a recharge liability at fair value, determined using generally accepted valuation techniques,
and a corresponding adjustment against equity for the capital contribution recognised in respect of the share-based payment.
• The parent recognises a corresponding recharge asset at fair value and a corresponding adjustment to the carrying amount of the investment in the subsidiary.
Subsequent to initial recognition the recharge arrangement is remeasured at fair value (as an adjustment to the net capital contribution) at each subsequent reporting date until settlement date to the extent vested. Where the recharge amount recognised is greater than the initial capital contribution recognised by the subsidiary in respect of the share-based payment, the excess is recognised as a net capital distribution to the parent in equity. The amount of the recharge in excess of the capital contribution, recognised by the parent as an increase in the investment in subsidiary, is recognised as an adjustment to the net capital contribution through a reduction in the net investment in the subsidiary.
Financial instrumentsMeasurementFinancial instruments are recognised initially at fair value plus, for instruments not at fair value through profit or loss, any directly attributable transaction costs when the Group becomes a party to the contractual arrangements. Subsequent to initial recognition these instruments are measured as detailed below:
Financial assetsFinancial assets are recognised when the Group has rights to cash or another financial asset. Such assets consist of cash and cash equivalents, a contractual right to receive cash or another financial asset or a contractual right to exchange financial instruments with another entity on potentially favourable terms.
InvestmentsInvestments held for trading are classified as current assets and are stated at fair value, with any resultant gain or loss recognised in profit or loss.
Other investments held by the Group are classified as being available-for-sale and are stated at fair value, with any resultant gain or loss being recognised directly in other comprehensive income, except for impairment losses and foreign exchange gains or losses on debt instruments, which are recognised in profit or loss. When these investments are disposed of, the cumulative gain or loss previously recognised directly in other comprehensive income is recognised in profit or loss as a capital item. Where these investments are interest-bearing, interest calculated using the effective interest method is recognised in profit or loss.
Trade and other receivablesTrade and other receivables are stated at amortised cost, using the effective interest method, less impairment losses.
Cash and cash equivalentsCash and cash equivalents initially are measured at fair value. Due to their short-term nature, the amortised cost approximates fair value.

95
Financial liabilitiesFinancial liabilities are recognised when there is a contractual obligation to deliver cash or another financial asset or to exchange financial instruments with another entity on potentially unfavourable terms. Financial liabilities other than derivative instruments are measured at amortised cost using the effective interest method.
Interest-bearing borrowingsSubsequent to initial recognition, interest-bearing borrowings are stated at amortised cost with any difference between cost and redemption value being recognised in profit or loss over the period of the borrowings using the effective interest method.
Trade and other payablesTrade and other payables are stated at amortised cost using the effective interest method.
OffsetFinancial assets and financial liabilities are offset and the net amount reported in the balance sheet when the Group has a legally enforceable right to set off the recognised amounts, and intends either to settle on a net basis, or to realise the asset and settle the liability simultaneously.
Derivative instrumentsThe Group uses derivative financial instruments to manage its exposure to risks arising from operational, financing and investment activities. The Group does not hold or issue derivative financial instruments for trading purposes.
Subsequent to initial recognition, derivative instruments are measured at fair value through profit or loss. Fair value is determined by comparing the contracted rate to the current rate of an equivalent instrument with the same maturity date. However, where derivatives qualify for hedge accounting, recognition of any resultant gain or loss depends on the nature of the item being hedged.
Gains and losses on subsequent measurementGains and losses arising from a change in the fair value of derivative financial instruments that are not part of a hedging relationship are recognised in profit or loss in the year in which the change occurs.
HedgingWhere a derivative financial instrument is designated as a hedge of the variability in cash flows of a recognised asset or liability, or a highly probable forecast transaction, the effective part of any gain or loss on the derivative financial instrument is recognised directly in other comprehensive income and presented in the cash flow hedging reserve in equity. Any ineffective portion of changes in the fair value of the derivative is recognised immediately in profit or loss.
When the hedged firm commitment or forecast transaction results in the recognition of a non-financial asset or a non-financial liability, the cumulative amount recognised in equity up to the transaction date is adjusted against the initial measurement of the asset or liability. For other cash flow hedges, the cumulative amount is recognised in profit or loss in the period when the commitment or forecast transaction affects profit or loss.
Where the hedging instrument or hedge relationship is terminated or no longer meets the criteria for hedge accounting but the hedged transaction is still expected to occur, the cumulative unrealised gain or loss at that point remains in equity and is recognised in profit or loss when the underlying transaction occurs. If the hedged transaction is no longer expected to occur, the cumulative unrealised gain or loss is recognised in profit or loss immediately.
Where a derivative financial instrument is used to hedge economically the foreign exchange exposure of a recognised monetary asset or liability, no hedge accounting is applied and any gain or loss on the hedging instrument is recognised in profit or loss.
DerecognitionThe Group derecognises a financial asset when the contractual rights to the cash flows from the financial asset expire, or when it transfers the rights to receive the contractual cash flows on the financial asset in a transaction in which substantially all the risks and rewards of ownership of the financial asset are transferred.
The Group derecognises a financial liability when its contractual obligations are discharged or cancelled or expire.
OV
ER
VIE
WB
USIN
ESS R
EV
IEW
GO
VE
RN
AN
CE
AN
NU
AL FIN
AN
CIA
L STATE
ME
NTS
SHA
RE
HO
LDE
R IN
FOR
MA
TION
96
Foreign currenciesForeign currency transactionsTransactions in foreign currencies are translated to South African Rand, being the functional currency of the Company, at the rates of exchange ruling at the dates of the transactions. Monetary assets and liabilities denominated in foreign currencies at the reporting date are translated to South African Rand at the exchange rates ruling at that date. Gains or losses on translation are recognised in profit or loss.
Non-monetary assets and liabilities that are measured in terms of historical cost in foreign currency are translated using the exchange rate at the date of the transaction.
Foreign operationsThe assets and liabilities of all foreign operations, including goodwill and fair value adjustments arising on consolidation, are translated to South African Rand at foreign exchange rates ruling at the reporting date. The revenues and expenses of foreign operations are translated to Rand at approximate foreign exchange rates ruling at the date of the transactions. Foreign exchange differences arising on translation are recognised in other comprehensive income and presented in the foreign currency translation reserve in equity. The foreign currency translation reserve applicable to a foreign operation is released to profit or loss upon disposal of that foreign operation.
Impairment of non-financial assetsThe carrying amounts of the Group’s assets other than deferred tax assets, biological assets, inventories and financial assets which are separately assessed and provided against where necessary, are reviewed at each reporting date to determine whether there is any indication of impairment. If there is any indication that an asset may be impaired, its recoverable amount is estimated.
For goodwill and intangible assets that have an indefinite useful life the recoverable amount is estimated at least annually.
The recoverable amount of assets is the greater of their fair value less costs of disposal and value in use. In assessing value in use, the estimated future cash flows are discounted to their present value using a pre-tax discount rate that reflects current market assessments of the time value of money and the risks specific to the asset. For an asset that does not generate largely independent cash inflows, the recoverable amount is determined for the cash-generating unit to which the asset belongs. Impairment losses are recognised in profit or loss as a capital item, when the carrying amount exceeds the recoverable amount.
Impairment losses recognised in respect of cash-generating units are allocated first to reduce the carrying amount of any goodwill allocated to cash-generating units and then to reduce the carrying amount of the other assets in the unit on a pro rata basis.
An impairment loss in respect of goodwill is not reversed. In respect of other assets, an impairment loss is reversed if there has been a change in the estimates used to determine the recoverable amount.
An impairment loss is reversed only to the extent that the asset’s carrying amount does not exceed the carrying amount that would have been determined, net of depreciation or amortisation, if no impairment loss had been recognised, and when the indication of impairment no longer exists.
Impairment of financial assetsA financial asset is assessed at each reporting date to determine whether there is any objective evidence that it is impaired. A financial asset is considered to be impaired if objective evidence indicates that one or more events have had a negative effect on the estimated future cash flows of that asset.
Individually significant financial assets are tested for impairment on an individual basis. The remaining financial assets are assessed collectively in groups that share similar credit risk characteristics.
An impairment loss in respect of a financial asset measured at amortised cost is calculated as the difference between its carrying amount, and the present value of the estimated future cash flows discounted at the original effective interest rate. An impairment loss in respect of an available-for-sale financial asset is calculated by reference to its fair value.
All impairment losses are recognised in profit or loss. Any cumulative loss in respect of an impaired available-for-sale financial asset accumulated in equity is transferred to profit or loss.
ACCOUNTING POLICIES continued
97
An impairment loss is reversed if the reversal can be related objectively to an event occurring after the impairment loss was recognised. For financial assets measured at amortised cost and available-for-sale financial assets that are debt securities, the reversal is recognised in profit or loss. For available-for-sale financial assets that are equity securities, the reversal is recognised directly in other comprehensive income.
Intangible assetsIntangible assets, excluding goodwill, acquired by the Group are stated at cost less accumulated amortisation and impairment losses. Amortisation is charged to profit or loss on a straight-line basis over the estimated useful lives of intangible assets unless such lives are indefinite. Where the useful life of an intangible asset is assessed as indefinite, the intangible asset is not amortised, but is tested annually for impairment.
Subsequent expenditure on acquired intangible assets is capitalised only when it increases the future economic benefits embodied in the specific asset to which it relates.
Expenditure on research activities, undertaken with the prospect of gaining new scientific or technical knowledge and understanding, and expenditure on internally generated goodwill and brands, is recognised in profit or loss as an expense when incurred.
InventoriesInventories are stated at the lower of cost and net realisable value.
The cost of inventories is based on the first-in-first-out method or a weighted average cost basis whichever is applicable, and includes expenditure incurred in acquiring the inventories and bringing them to their existing location and condition. In the case of manufactured inventories and work in progress, cost includes an appropriate share of overheads based on normal operating capacity. The cost of items transferred from biological assets is their fair value less costs to sell at the date of transfer.
Net realisable value is the estimated selling price in the ordinary course of business, less the estimated costs of completion and selling expenses.
Biological assetsBiological assets are stated at fair value less estimated costs to sell, with any resultant gain or loss recognised in profit or loss. Costs to sell include all costs that would be necessary to sell the assets, excluding costs necessary to get the assets to market.
Investments in subsidiary companiesInvestments in subsidiary companies are stated at cost, less impairment losses.
Lease paymentsOperating lease paymentsLeases where the lessor retains the risks and rewards of ownership of the underlying asset are classified as operating leases. Payments made under operating leases with fixed escalation clauses are recognised in profit or loss on a straight-line basis over the term of the lease. Contingent rentals are expensed when incurred.
Income from operating lease arrangements is recognised in profit or loss on a straight-line basis over the term of the lease.
Finance lease paymentsLeases that transfer substantially all of the risks and rewards of ownership of the underlying asset to the Group are classified as finance leases. Assets acquired in terms of finance leases are capitalised at the lower of fair value and the present value of the minimum lease payments at inception of the lease, and depreciated over the shorter of the estimated useful life of the asset or the lease term if there is no reasonable certainty that the Group will obtain ownership at the end of the lease term.
The capital element of future obligations under the leases is included as a liability in the balance sheet. Lease payments are allocated using the effective interest method to determine the lease finance cost, which is recognised in the profit or loss over the lease period, and the capital repayment, which reduces the liability to the lessor.
OV
ER
VIE
WB
USIN
ESS R
EV
IEW
GO
VE
RN
AN
CE
AN
NU
AL FIN
AN
CIA
L STATE
ME
NTS
SHA
RE
HO
LDE
R IN
FOR
MA
TION
98
Assets held-for-saleAssets (or disposal groups comprising assets and liabilities) that are expected to be recovered primarily through sale rather than through continuing use are classified as held-for-sale. Immediately before classification as held-for-sale, the assets (or components of a disposal group) are remeasured in accordance with the Group’s accounting policies. Thereafter the assets (or disposal group) are measured at the lower of their carrying amount and fair value less cost to sell. Any impairment loss on a disposal group is first allocated to goodwill, and then to remaining assets and liabilities on a pro rata basis, except that no loss is allocated to inventories, financial assets, deferred tax assets and biological assets, which continue to be measured in accordance with the Group’s accounting policies. Impairment losses on initial classification as held-for-sale and subsequent gains or losses on remeasurement are recognised in profit or loss as capital items. Gains are not recognised in excess of any cumulative impairment loss.
Property, plant and equipmentOwned assetsItems of property, plant and equipment are stated at cost, less accumulated depreciation and impairment losses. The cost of self-constructed assets includes the cost of materials, direct labour and an appropriate proportion of production overheads.
Subsequent costsThe Group recognises in the carrying amount of an item of property, plant and equipment the cost of replacing part of such an item when the cost is incurred if it is probable that future economic benefits embodied within the item will flow to the Group and the cost of such item can be measured reliably. All other costs are recognised in profit or loss as an expense when incurred.
VesselsMajor vessel reconstructions are capitalised where such reconstruction extends the useful life of a vessel. The reconstruction is written off over the remaining expected useful life of the vessel.
DepreciationLand is not depreciated. Freehold buildings, plant and equipment are depreciated on a straight-line basis over their expected useful lives to an estimated residual value. The current estimated useful lives are as follows: • Buildings 40 – 50 years• Plant and machinery 3 – 20 years• Motor vehicles – trucks 3 – 8 years – other 3 – 5 years• Furniture and equipment 3 – 10 years• Vessels – hull 35 – 45 years – other components 5 – 10 years
Where parts of an item of property, plant and equipment have different useful lives, they are accounted for as separate items of property, plant and equipment. Residual values, depreciation methods and useful lives of all assets are reassessed annually. In addition, depreciation of an item of property, plant and equipment begins when it is available for use and ceases at the earlier of the date it is classified as held-for-sale or the date that it is derecognised upon disposal.
ProvisionsA provision is recognised in the balance sheet when the Group has a present legal or constructive obligation as a result of a past event and it is probable that an outflow of economic benefits will be required to settle the obligation, and where a reliable estimate can be made of the amount of the obligation. Provisions are determined by discounting the expected future cash flows at a pre-tax rate that reflects current market assessments of the time value of money and, where appropriate, the risks specific to the liability.
Onerous contractsA provision for onerous contracts is recognised when the expected benefits to be derived by the Group from a contract are lower than the unavoidable cost of meeting the obligations under the contract.
RestructuringA provision for restructuring is recognised when the Group has approved a detailed and formal restructuring plan and has either started to implement the plan or announced its main features to those affected by it. Future operating costs are not provided for.
ACCOUNTING POLICIES continued
99
Revenue recognitionRevenue is recognised only when it is probable that the economic benefits associated with a transaction will flow to the Group and the amount of revenue can be measured reliably.
Goods and servicesRevenue from the sale of goods is measured at the fair value of the consideration received or receivable, net of returns, allowances, trade discounts and Value Added Tax. Revenue arising from the sale of goods is recognised when the significant risks and rewards of ownership of the goods have passed to the buyer.
Revenue from services, including the distribution of third party products, is recognised over the period that the services are rendered.
Recognition of income from investmentsDividendsDividends are recognised when the right to receive payment is established, with the exception of dividends on cumulative preference share investments, which are recognised on a time proportion basis in the period to which they relate.
InterestInterest is recognised on a time proportion basis that takes account of the effective yield on the asset.
Share capitalOrdinary shares Ordinary shares are classified as equity. Incremental costs directly attributable to the issue of ordinary shares are recognised as a deduction from equity, net of any tax effects.
Preference share capitalPreference share capital is classified as equity if it is non-redeemable and any dividends are discretionary, or is redeemable but only at the Company’s option. Dividends on preference share capital classified as equity are recognised as distributions within equity.
Preference share capital is classified as a liability if it is redeemable on a specific date or at the option of the shareholders and if dividend payments are not discretionary. Dividends thereon are recognised in profit or loss as interest expense.
Repurchase of share capitalWhen share capital recognised as equity is repurchased, the amount of the consideration paid, including directly attributable costs, net of any tax effects, is recognised as a change in equity. Repurchased shares held by subsidiaries are classified as treasury shares and presented as a deduction from total equity. The consideration received when own shares held by the Group are reissued is presented as a change in equity and no profit or loss is recorded.
Where loans advanced by the holding company to a subsidiary to acquire treasury shares are to be repaid principally by the buy back of such shares, the loan is classified as an equity instrument by the holding company.
TaxationTaxation on the profit or loss for the year comprises current and deferred taxation. Taxation is recognised in profit or loss except to the extent that it relates to a business combination or items recognised directly in other comprehensive income or equity.
Current taxationCurrent taxation comprises tax payable calculated on the basis of the estimated taxable income for the year, using the tax rates enacted or substantively enacted at the reporting date, and any adjustment to tax payable for previous years.
Deferred taxationDeferred taxation is provided using the balance sheet method based on temporary differences. Temporary differences are differences between the carrying amounts of assets and liabilities for financial reporting purposes and their tax base. The amount of deferred taxation provided is based on the expected manner of realisation or settlement of the carrying amount of assets and liabilities using tax rates enacted or substantively enacted at the reporting date.
OV
ER
VIE
WB
USIN
ESS R
EV
IEW
GO
VE
RN
AN
CE
AN
NU
AL FIN
AN
CIA
L STATE
ME
NTS
SHA
RE
HO
LDE
R IN
FOR
MA
TION
100
Deferred taxation is charged to profit or loss except to the extent that it relates to a transaction that is recognised directly in other comprehensive income or equity, in which case it is recognised in other comprehensive income or equity, or a business combination that is an acquisition, in which case it is recognised as an adjustment to goodwill. The effect on deferred taxation of any changes in tax rates is recognised in profit or loss, except to the extent that it relates to items previously charged or credited directly to other comprehensive income or equity.
A deferred taxation asset is recognised to the extent that it is probable that future taxable profits will be available against which the associated unused tax losses and deductible temporary differences can be utilised. Deferred taxation assets are reduced to the extent that it is no longer probable that the related tax benefit will be realised.
Dividend Withholding TaxDividend Withholding Tax is a tax on shareholders receiving dividends and is applicable to all dividends declared on or after 1 April 2012. The Group withholds dividend tax on behalf of its shareholders at a rate of 15% on dividends declared. Amounts withheld are not recognised as part of the Group’s tax charge but rather as part of the dividend paid recognised directly in equity.
Where withholding tax is withheld on dividends received, the dividend is recognised at the gross amount with the related withholding tax recognised as part of the tax expense unless it is otherwise reimbursable in which case it is recognised as an asset.
Earnings per shareThe Group presents basic and diluted earnings per share (“EPS”) data for its ordinary shares. Basic EPS is calculated by dividing the profit or loss attributable to ordinary shareholders of the Company by the weighted average number of ordinary shares outstanding (adjusted for own shares held) during the period. Diluted EPS is determined by adjusting the profit or loss attributable to ordinary shareholders and the weighted average number of ordinary shares outstanding for the effects of all dilutive potential ordinary shares, which comprise convertible redeemable preference shares, share options and equivalent equity instruments granted to employees, and BEE transactions that have not yet met the accounting recognition criteria.
New standards and interpretations in issue not yet effectiveA number of new standards, amendments to standards and interpretations are not yet effective for the year ended 30 June 2015. These include the following standards and interpretations and amendments to standards that are applicable to the business of the Group, and have not been applied in preparing these financial statements:
• Amendments to IFRS 11 – Accounting for Acquisitions of Interests in Joint OperationsUnder the amendment to IFRS 11 business combination accounting is required to be applied to acquisitions of interests in a joint operation that constitutes a business. Business combination accounting also applies to the acquisition of additional interests in joint operations while the joint operator retains joint control. The additional interest acquired is measured at fair value while previously held interests in joint operations are not remeasured. The amendment places focus on the definition of a business as the key determinant as to whether the acquisition should be accounted for a business combination or as the acquisition of a collection of assets.
The amendments will apply to the year ending 30 June 2017 on a prospective basis. The amendment is not expected to impact the Group’s results.
• Annual improvements to IFRSs: 2012 – 2014 (various standards)The new cycles of improvements form part of the IASB’s annual improvements process to make non-urgent but necessary amendments to IFRS. Amendments have been made to a total of four standards.
The amendments are effective for the year ending 30 June 2017. Management has not assessed the impact of the improvements in detail but does not expect a significant impact on the Group’s results following the implementation of the applicable improvements.
ACCOUNTING POLICIES continued
101
• IFRS 15 – Revenue from Contracts with CustomersThe new revenue standard introduces a new revenue recognition model for contracts with customers. The standard contains a single model that applies to contracts with customers and two approaches to recognising revenue, at a point in time or over time. The model features a contract-based five-step analysis of transactions to determine whether, how much and when revenue is recognised.
The standard is effective for the year ending 30 June 2019. Management has not yet assessed the impact of this standard but does not expect a significant impact on the Group’s results following its implementation.
• IFRS 9 – Financial InstrumentsThe IASB has issued the final IFRS 9 – Financial Instruments, which replaces earlier versions of IFRS 9 and completes the IASB’s project to replace IAS 39 – Financial Instruments: Recognition and Measurement.
This standard provides updated guidance on the classification and measurement of financial assets, revising the measurement categories of financial assets to amortised cost, fair value through other comprehensive income or fair value through profit or loss. Even though these measurement categories are similar to IAS 39, the criteria for classification into these categories are significantly different. In addition, the IFRS 9 impairment model has been changed from an “incurred loss” model per IAS 39 to an “expected credit loss” model, which is expected to impact the calculation of the credit risk impairment provision. The new standard also seeks to align hedge accounting more closely with risk management.
The standard is effective for the year ending 30 June 2019 with retrospective application. Management has not yet assessed the impact of this standard.
Non-applicable standards, amendments and interpretationsThe other remaining standards, amendments and interpretations issued but not yet effective have been assessed for applicability to the Group and management has concluded that they are not applicable to the business of the Group and will therefore have no impact on future financial statements.
OV
ER
VIE
WB
USIN
ESS R
EV
IEW
GO
VE
RN
AN
CE
AN
NU
AL FIN
AN
CIA
L STATE
ME
NTS
SHA
RE
HO
LDE
R IN
FOR
MA
TION
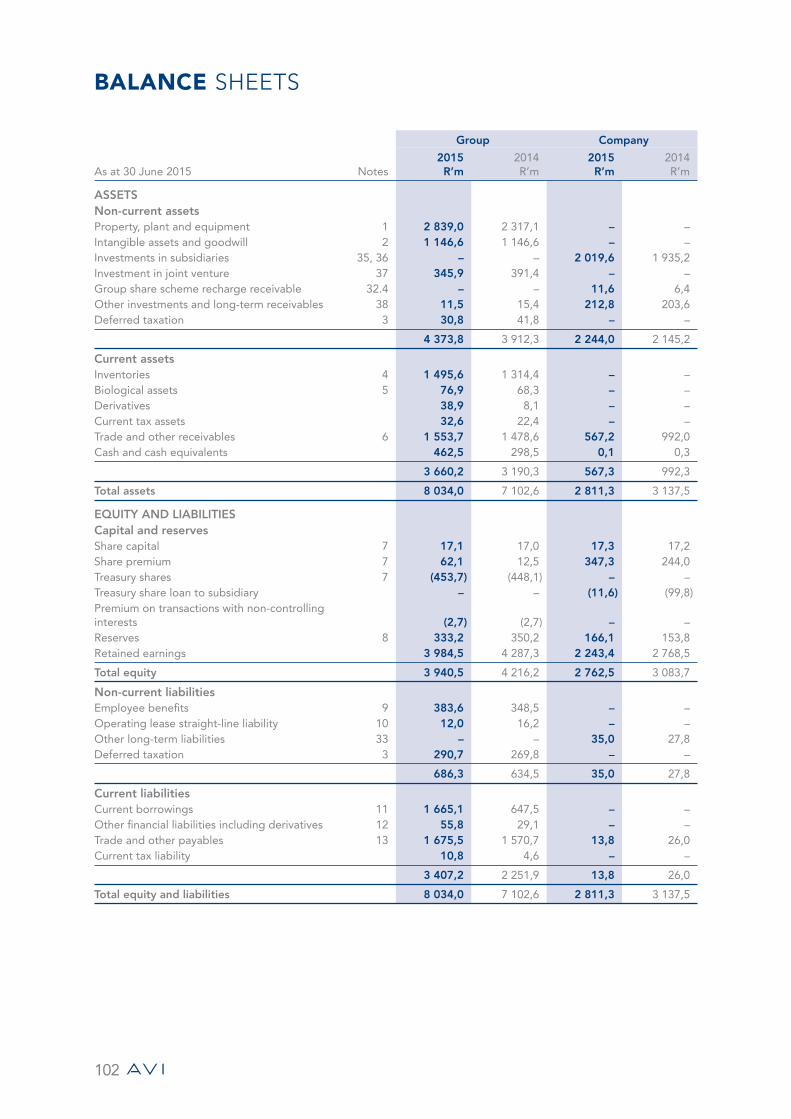
102
BALANCE SHEETS
Group Company
As at 30 June 2015 Notes2015R’m
2014R’m
2015R’m
2014R’m
ASSETS Non-current assets Property, plant and equipment 1 2 839,0 2 317,1 – – Intangible assets and goodwill 2 1 146,6 1 146,6 – – Investments in subsidiaries 35, 36 – – 2 019,6 1 935,2 Investment in joint venture 37 345,9 391,4 – – Group share scheme recharge receivable 32.4 – – 11,6 6,4 Other investments and long-term receivables 38 11,5 15,4 212,8 203,6 Deferred taxation 3 30,8 41,8 – –
4 373,8 3 912,3 2 244,0 2 145,2
Current assets Inventories 4 1 495,6 1 314,4 – – Biological assets 5 76,9 68,3 – – Derivatives 38,9 8,1 – – Current tax assets 32,6 22,4 – – Trade and other receivables 6 1 553,7 1 478,6 567,2 992,0 Cash and cash equivalents 462,5 298,5 0,1 0,3
3 660,2 3 190,3 567,3 992,3
Total assets 8 034,0 7 102,6 2 811,3 3 137,5
EQUITY AND LIABILITIES Capital and reserves Share capital 7 17,1 17,0 17,3 17,2 Share premium 7 62,1 12,5 347,3 244,0 Treasury shares 7 (453,7) (448,1) – – Treasury share loan to subsidiary – – (11,6) (99,8)Premium on transactions with non-controlling interests (2,7) (2,7) – – Reserves 8 333,2 350,2 166,1 153,8 Retained earnings 3 984,5 4 287,3 2 243,4 2 768,5
Total equity 3 940,5 4 216,2 2 762,5 3 083,7
Non-current liabilities Employee benefits 9 383,6 348,5 – – Operating lease straight-line liability 10 12,0 16,2 – – Other long-term liabilities 33 – – 35,0 27,8 Deferred taxation 3 290,7 269,8 – –
686,3 634,5 35,0 27,8
Current liabilities Current borrowings 11 1 665,1 647,5 – – Other financial liabilities including derivatives 12 55,8 29,1 – – Trade and other payables 13 1 675,5 1 570,7 13,8 26,0 Current tax liability 10,8 4,6 – –
3 407,2 2 251,9 13,8 26,0
Total equity and liabilities 8 034,0 7 102,6 2 811,3 3 137,5
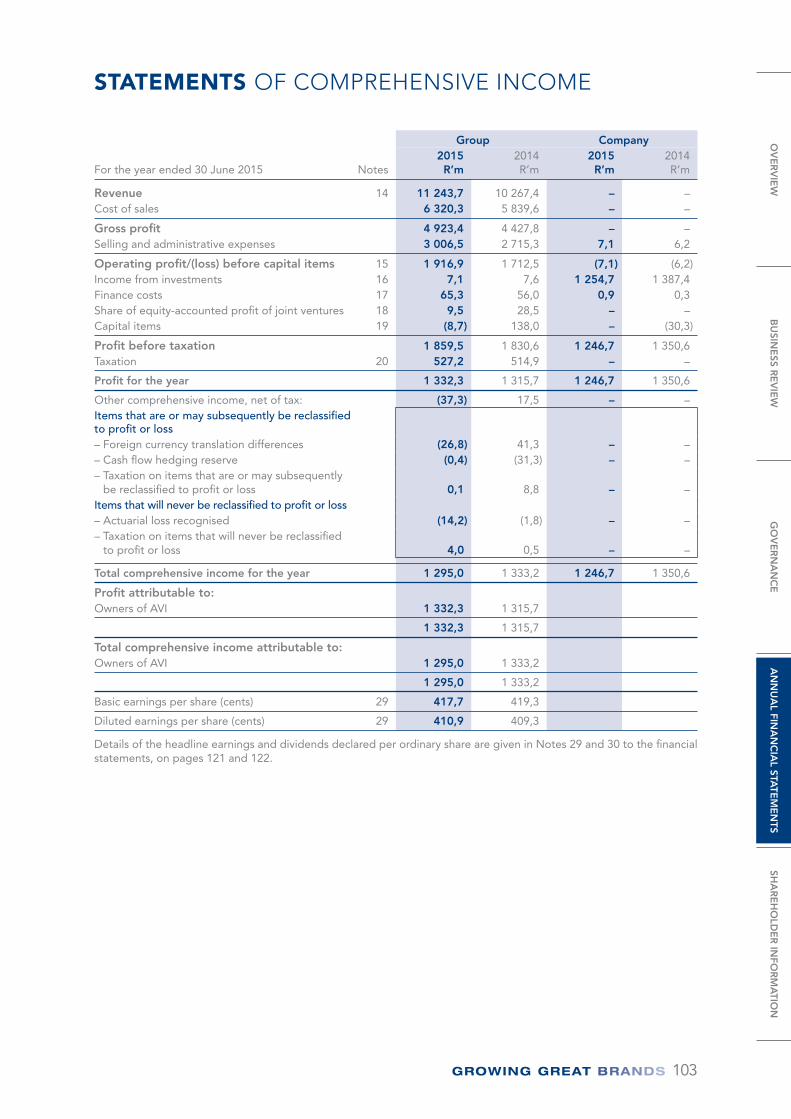
103
STATEMENTS OF COMPREHENSIVE INCOME
Group Company
For the year ended 30 June 2015 Notes2015R’m
2014R’m
2015R’m
2014R’m
Revenue 14 11 243,7 10 267,4 – – Cost of sales 6 320,3 5 839,6 – –
Gross profit 4 923,4 4 427,8 – – Selling and administrative expenses 3 006,5 2 715,3 7,1 6,2
Operating profit/(loss) before capital items 15 1 916,9 1 712,5 (7,1) (6,2)Income from investments 16 7,1 7,6 1 254,7 1 387,4 Finance costs 17 65,3 56,0 0,9 0,3 Share of equity-accounted profit of joint ventures 18 9,5 28,5 – – Capital items 19 (8,7) 138,0 – (30,3)
Profit before taxation 1 859,5 1 830,6 1 246,7 1 350,6 Taxation 20 527,2 514,9 – –
Profit for the year 1 332,3 1 315,7 1 246,7 1 350,6
Other comprehensive income, net of tax: (37,3) 17,5 – – Items that are or may subsequently be reclassified to profit or loss – Foreign currency translation differences (26,8) 41,3 – – – Cash flow hedging reserve (0,4) (31,3) – – – Taxation on items that are or may subsequently
be reclassified to profit or loss 0,1 8,8 – – Items that will never be reclassified to profit or loss – Actuarial loss recognised (14,2) (1,8) – – – Taxation on items that will never be reclassified
to profit or loss 4,0 0,5 – –
Total comprehensive income for the year 1 295,0 1 333,2 1 246,7 1 350,6
Profit attributable to: Owners of AVI 1 332,3 1 315,7
1 332,3 1 315,7
Total comprehensive income attributable to: Owners of AVI 1 295,0 1 333,2
1 295,0 1 333,2
Basic earnings per share (cents) 29 417,7 419,3
Diluted earnings per share (cents) 29 410,9 409,3
Details of the headline earnings and dividends declared per ordinary share are given in Notes 29 and 30 to the financial statements, on pages 121 and 122.
OV
ER
VIE
WB
USIN
ESS R
EV
IEW
GO
VE
RN
AN
CE
AN
NU
AL FIN
AN
CIA
L STATE
ME
NTS
SHA
RE
HO
LDE
R IN
FOR
MA
TION
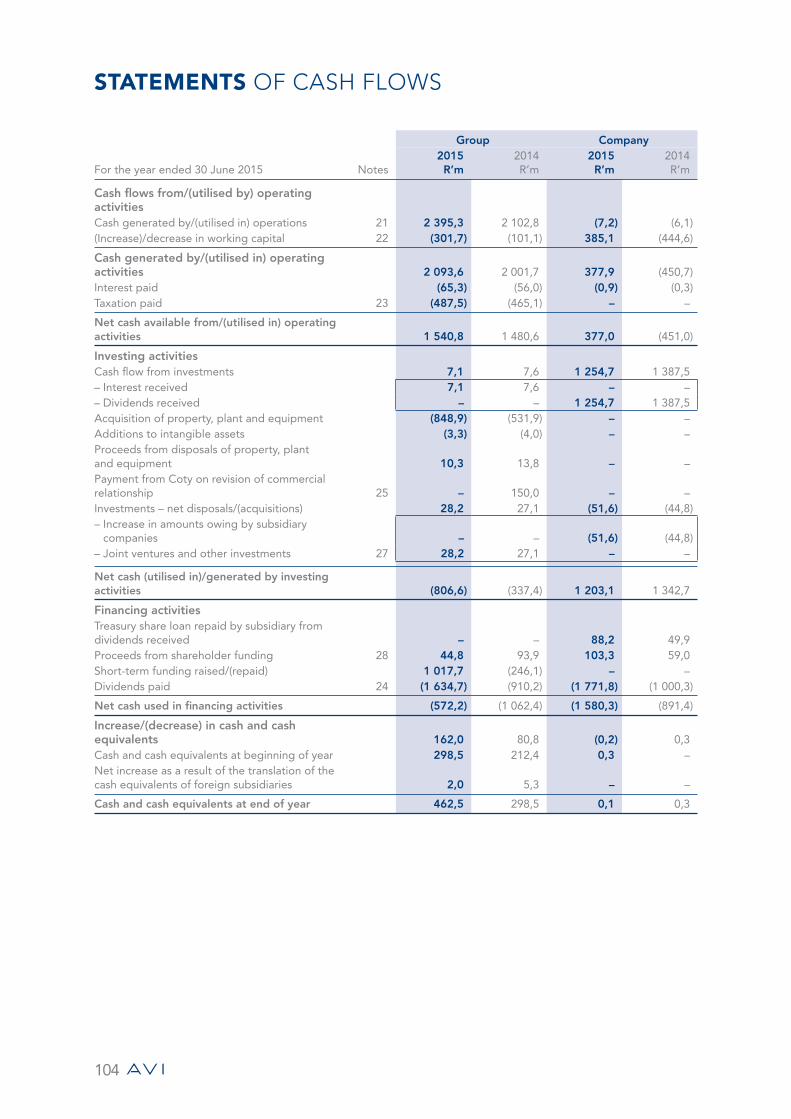
104
STATEMENTS OF CASH FLOWS
Group Company
For the year ended 30 June 2015 Notes2015R’m
2014R’m
2015R’m
2014R’m
Cash flows from/(utilised by) operating activities Cash generated by/(utilised in) operations 21 2 395,3 2 102,8 (7,2) (6,1)(Increase)/decrease in working capital 22 (301,7) (101,1) 385,1 (444,6)
Cash generated by/(utilised in) operating activities 2 093,6 2 001,7 377,9 (450,7)Interest paid (65,3) (56,0) (0,9) (0,3)Taxation paid 23 (487,5) (465,1) – –
Net cash available from/(utilised in) operating activities 1 540,8 1 480,6 377,0 (451,0)
Investing activities Cash flow from investments 7,1 7,6 1 254,7 1 387,5 – Interest received 7,1 7,6 – – – Dividends received – – 1 254,7 1 387,5 Acquisition of property, plant and equipment (848,9) (531,9) – – Additions to intangible assets (3,3) (4,0) – – Proceeds from disposals of property, plant and equipment 10,3 13,8 – – Payment from Coty on revision of commercial relationship 25 – 150,0 – – Investments – net disposals/(acquisitions) 28,2 27,1 (51,6) (44,8)– Increase in amounts owing by subsidiary
companies – – (51,6) (44,8)– Joint ventures and other investments 27 28,2 27,1 – –
Net cash (utilised in)/generated by investing activities (806,6) (337,4) 1 203,1 1 342,7
Financing activities Treasury share loan repaid by subsidiary from dividends received – – 88,2 49,9 Proceeds from shareholder funding 28 44,8 93,9 103,3 59,0 Short-term funding raised/(repaid) 1 017,7 (246,1) – – Dividends paid 24 (1 634,7) (910,2) (1 771,8) (1 000,3)
Net cash used in financing activities (572,2) (1 062,4) (1 580,3) (891,4)
Increase/(decrease) in cash and cash equivalents 162,0 80,8 (0,2) 0,3 Cash and cash equivalents at beginning of year 298,5 212,4 0,3 –Net increase as a result of the translation of the cash equivalents of foreign subsidiaries 2,0 5,3 – –
Cash and cash equivalents at end of year 462,5 298,5 0,1 0,3
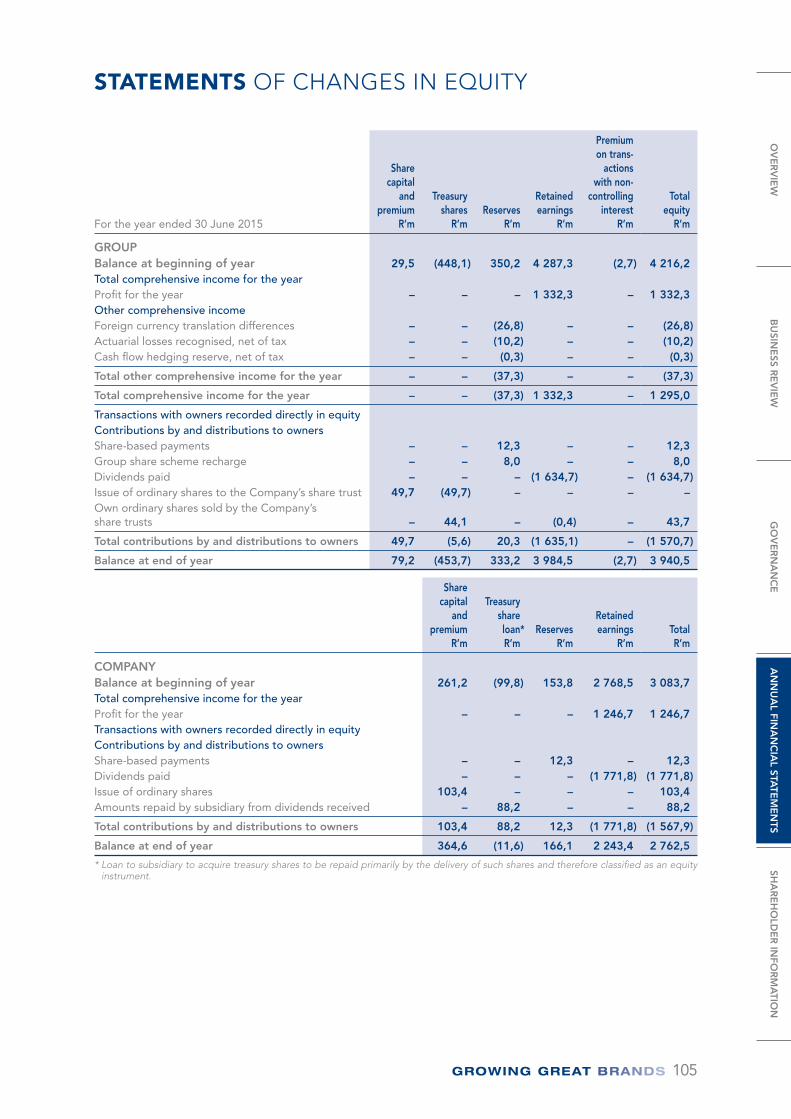
105
STATEMENTS OF CHANGES IN EQUITY
For the year ended 30 June 2015
Share capital
and premium
R’m
Treasury shares
R’mReserves
R’m
Retained earnings
R’m
Premium on trans-
actions with non-
controlling interest
R’m
Total equity
R’m
GROUP Balance at beginning of year 29,5 (448,1) 350,2 4 287,3 (2,7) 4 216,2 Total comprehensive income for the year Profit for the year – – – 1 332,3 – 1 332,3 Other comprehensive income Foreign currency translation differences – – (26,8) – – (26,8)Actuarial losses recognised, net of tax – – (10,2) – – (10,2)Cash flow hedging reserve, net of tax – – (0,3) – – (0,3)
Total other comprehensive income for the year – – (37,3) – – (37,3)
Total comprehensive income for the year – – (37,3) 1 332,3 – 1 295,0
Transactions with owners recorded directly in equity Contributions by and distributions to owners Share-based payments – – 12,3 – – 12,3 Group share scheme recharge – – 8,0 – – 8,0 Dividends paid – – – (1 634,7) – (1 634,7)Issue of ordinary shares to the Company’s share trust 49,7 (49,7) – – – – Own ordinary shares sold by the Company’s share trusts – 44,1 – (0,4) – 43,7
Total contributions by and distributions to owners 49,7 (5,6) 20,3 (1 635,1) – (1 570,7)
Balance at end of year 79,2 (453,7) 333,2 3 984,5 (2,7) 3 940,5
Share capital
and premium
R’m
Treasury share loan*R’m
ReservesR’m
Retained earnings
R’mTotalR’m
COMPANY Balance at beginning of year 261,2 (99,8) 153,8 2 768,5 3 083,7 Total comprehensive income for the year Profit for the year – – – 1 246,7 1 246,7 Transactions with owners recorded directly in equity Contributions by and distributions to owners Share-based payments – – 12,3 – 12,3 Dividends paid – – – (1 771,8) (1 771,8)Issue of ordinary shares 103,4 – – – 103,4 Amounts repaid by subsidiary from dividends received – 88,2 – – 88,2
Total contributions by and distributions to owners 103,4 88,2 12,3 (1 771,8) (1 567,9)
Balance at end of year 364,6 (11,6) 166,1 2 243,4 2 762,5
* Loan to subsidiary to acquire treasury shares to be repaid primarily by the delivery of such shares and therefore classified as an equity instrument.
OV
ER
VIE
WB
USIN
ESS R
EV
IEW
GO
VE
RN
AN
CE
AN
NU
AL FIN
AN
CIA
L STATE
ME
NTS
SHA
RE
HO
LDE
R IN
FOR
MA
TION
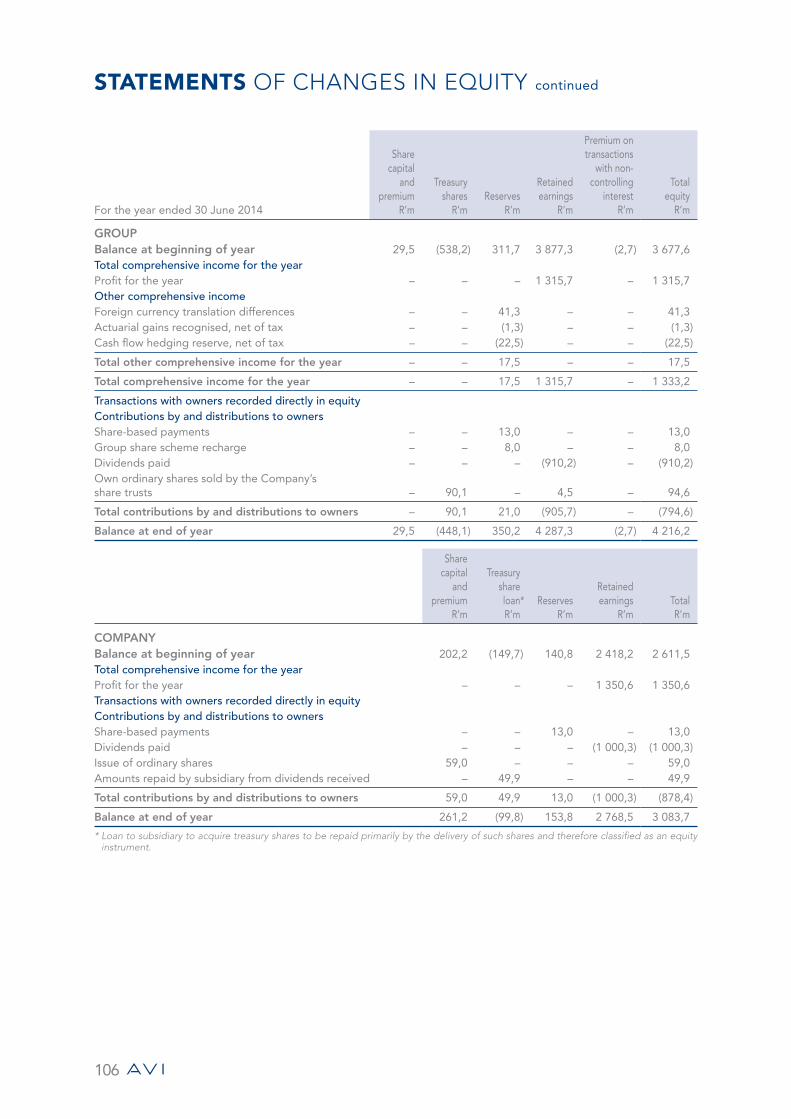
106
STATEMENTS OF CHANGES IN EQUITY continued
For the year ended 30 June 2014
Share capital
and premium
R’m
Treasury shares
R’m Reserves
R’m
Retained earnings
R’m
Premium on transactions
with non-controlling
interest R’m
Total equity
R’m
GROUP Balance at beginning of year 29,5 (538,2) 311,7 3 877,3 (2,7) 3 677,6 Total comprehensive income for the year Profit for the year – – – 1 315,7 – 1 315,7 Other comprehensive income Foreign currency translation differences – – 41,3 – – 41,3 Actuarial gains recognised, net of tax – – (1,3) – – (1,3)Cash flow hedging reserve, net of tax – – (22,5) – – (22,5)
Total other comprehensive income for the year – – 17,5 – – 17,5
Total comprehensive income for the year – – 17,5 1 315,7 – 1 333,2
Transactions with owners recorded directly in equity Contributions by and distributions to owners Share-based payments – – 13,0 – – 13,0 Group share scheme recharge – – 8,0 – – 8,0 Dividends paid – – – (910,2) – (910,2)Own ordinary shares sold by the Company’s share trusts – 90,1 – 4,5 – 94,6
Total contributions by and distributions to owners – 90,1 21,0 (905,7) – (794,6)
Balance at end of year 29,5 (448,1) 350,2 4 287,3 (2,7) 4 216,2
Share capital
and premium
R’m
Treasury share loan* R’m
Reserves R’m
Retained earnings
R’m Total R’m
COMPANY Balance at beginning of year 202,2 (149,7) 140,8 2 418,2 2 611,5 Total comprehensive income for the year Profit for the year – – – 1 350,6 1 350,6 Transactions with owners recorded directly in equity Contributions by and distributions to owners Share-based payments – – 13,0 – 13,0 Dividends paid – – – (1 000,3) (1 000,3)Issue of ordinary shares 59,0 – – – 59,0 Amounts repaid by subsidiary from dividends received – 49,9 – – 49,9
Total contributions by and distributions to owners 59,0 49,9 13,0 (1 000,3) (878,4)
Balance at end of year 261,2 (99,8) 153,8 2 768,5 3 083,7
* Loan to subsidiary to acquire treasury shares to be repaid primarily by the delivery of such shares and therefore classified as an equity instrument.
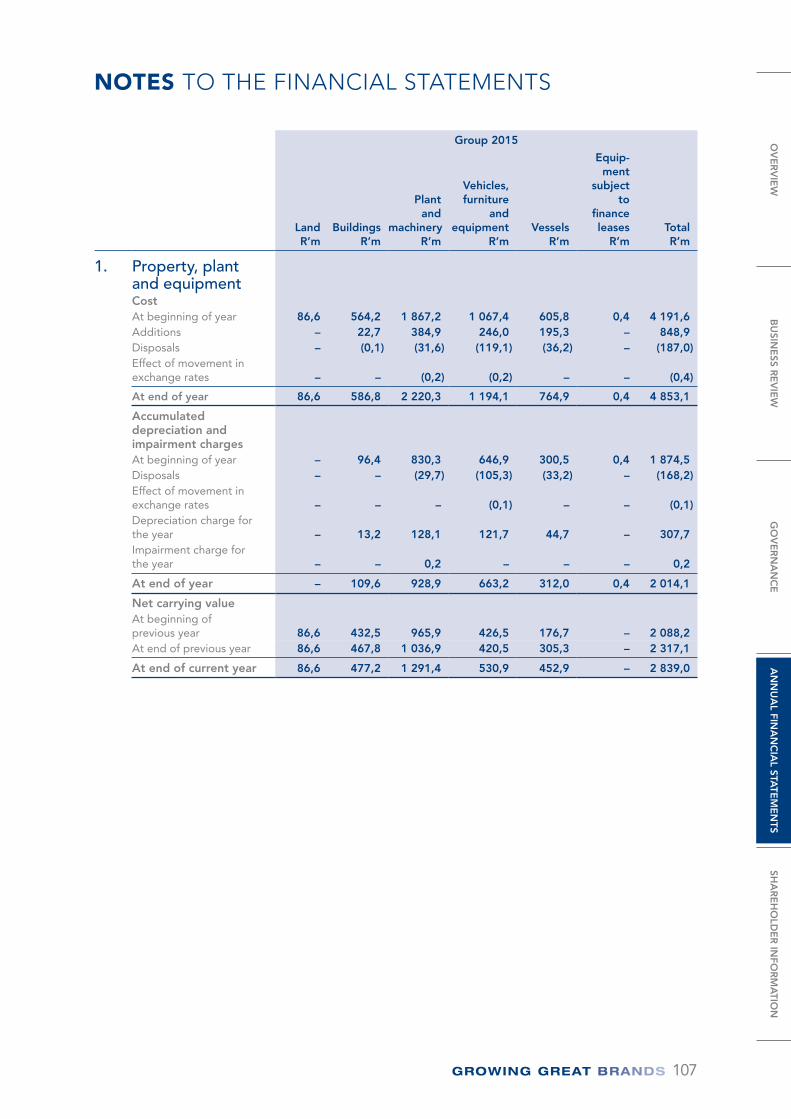
107
NOTES TO THE FINANCIAL STATEMENTS
Group 2015
LandR’m
BuildingsR’m
Plant and
machineryR’m
Vehicles, furniture
and equipment
R’mVessels
R’m
Equip-ment
subject to
finance leases
R’mTotalR’m
1. Property, plant and equipmentCost At beginning of year 86,6 564,2 1 867,2 1 067,4 605,8 0,4 4 191,6 Additions – 22,7 384,9 246,0 195,3 – 848,9 Disposals – (0,1) (31,6) (119,1) (36,2) – (187,0)Effect of movement in exchange rates – – (0,2) (0,2) – – (0,4)
At end of year 86,6 586,8 2 220,3 1 194,1 764,9 0,4 4 853,1
Accumulated depreciation and impairment chargesAt beginning of year – 96,4 830,3 646,9 300,5 0,4 1 874,5 Disposals – – (29,7) (105,3) (33,2) – (168,2)Effect of movement in exchange rates – – – (0,1) – – (0,1)Depreciation charge for the year – 13,2 128,1 121,7 44,7 – 307,7 Impairment charge for the year – – 0,2 – – – 0,2
At end of year – 109,6 928,9 663,2 312,0 0,4 2 014,1
Net carrying value At beginning of previous year 86,6 432,5 965,9 426,5 176,7 – 2 088,2 At end of previous year 86,6 467,8 1 036,9 420,5 305,3 – 2 317,1
At end of current year 86,6 477,2 1 291,4 530,9 452,9 – 2 839,0
OV
ER
VIE
WB
USIN
ESS R
EV
IEW
GO
VE
RN
AN
CE
AN
NU
AL FIN
AN
CIA
L STATE
ME
NTS
SHA
RE
HO
LDE
R IN
FOR
MA
TION
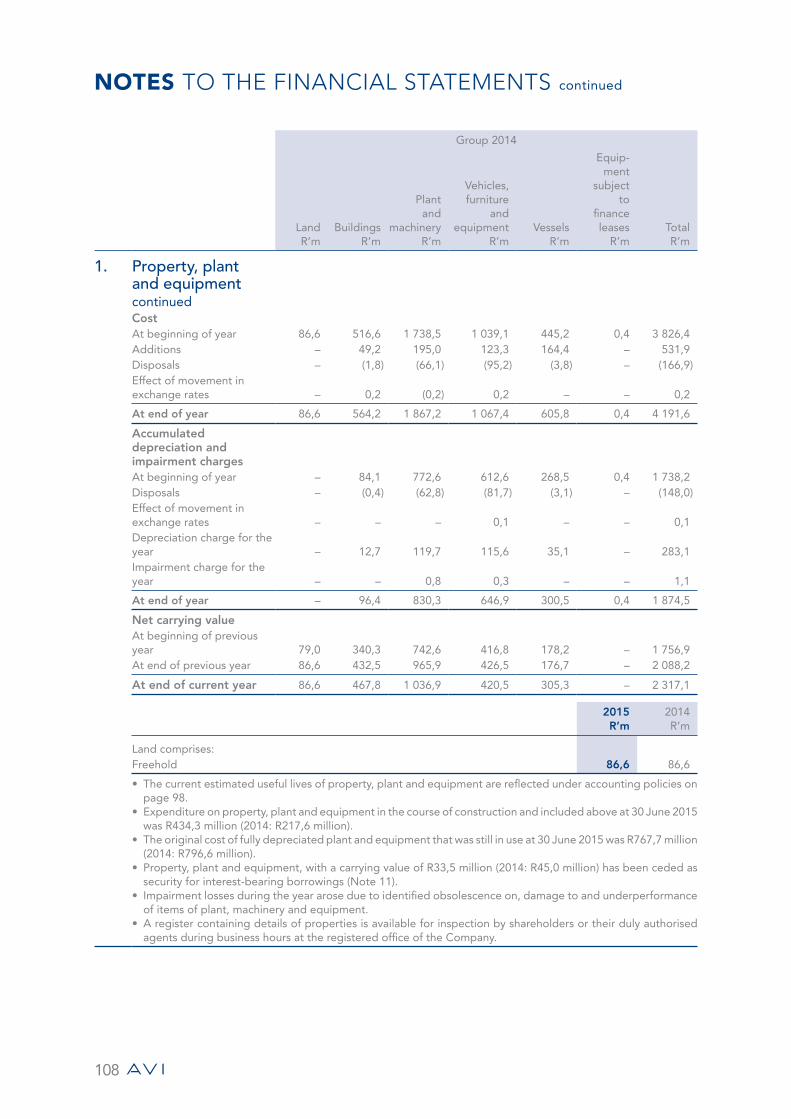
NOTES TO THE FINANCIAL STATEMENTS continued
108
Group 2014
LandR’m
BuildingsR’m
Plant and
machineryR’m
Vehicles, furniture
and equipment
R’mVessels
R’m
Equip-ment
subject to
finance leases
R’mTotalR’m
1. Property, plant and equipment continuedCost At beginning of year 86,6 516,6 1 738,5 1 039,1 445,2 0,4 3 826,4 Additions – 49,2 195,0 123,3 164,4 – 531,9 Disposals – (1,8) (66,1) (95,2) (3,8) – (166,9)Effect of movement in exchange rates – 0,2 (0,2) 0,2 – – 0,2
At end of year 86,6 564,2 1 867,2 1 067,4 605,8 0,4 4 191,6
Accumulated depreciation and impairment chargesAt beginning of year – 84,1 772,6 612,6 268,5 0,4 1 738,2 Disposals – (0,4) (62,8) (81,7) (3,1) – (148,0)Effect of movement in exchange rates – – – 0,1 – – 0,1 Depreciation charge for the year – 12,7 119,7 115,6 35,1 – 283,1 Impairment charge for the year – – 0,8 0,3 – – 1,1
At end of year – 96,4 830,3 646,9 300,5 0,4 1 874,5
Net carrying value At beginning of previous year 79,0 340,3 742,6 416,8 178,2 – 1 756,9 At end of previous year 86,6 432,5 965,9 426,5 176,7 – 2 088,2
At end of current year 86,6 467,8 1 036,9 420,5 305,3 – 2 317,1
2015 R’m
2014 R’m
Land comprises:Freehold 86,6 86,6
• The current estimated useful lives of property, plant and equipment are reflected under accounting policies on page 98.
• Expenditure on property, plant and equipment in the course of construction and included above at 30 June 2015 was R434,3 million (2014: R217,6 million).
• The original cost of fully depreciated plant and equipment that was still in use at 30 June 2015 was R767,7 million (2014: R796,6 million).
• Property, plant and equipment, with a carrying value of R33,5 million (2014: R45,0 million) has been ceded as security for interest-bearing borrowings (Note 11).
• Impairment losses during the year arose due to identified obsolescence on, damage to and underperformance of items of plant, machinery and equipment.
• A register containing details of properties is available for inspection by shareholders or their duly authorised agents during business hours at the registered office of the Company.
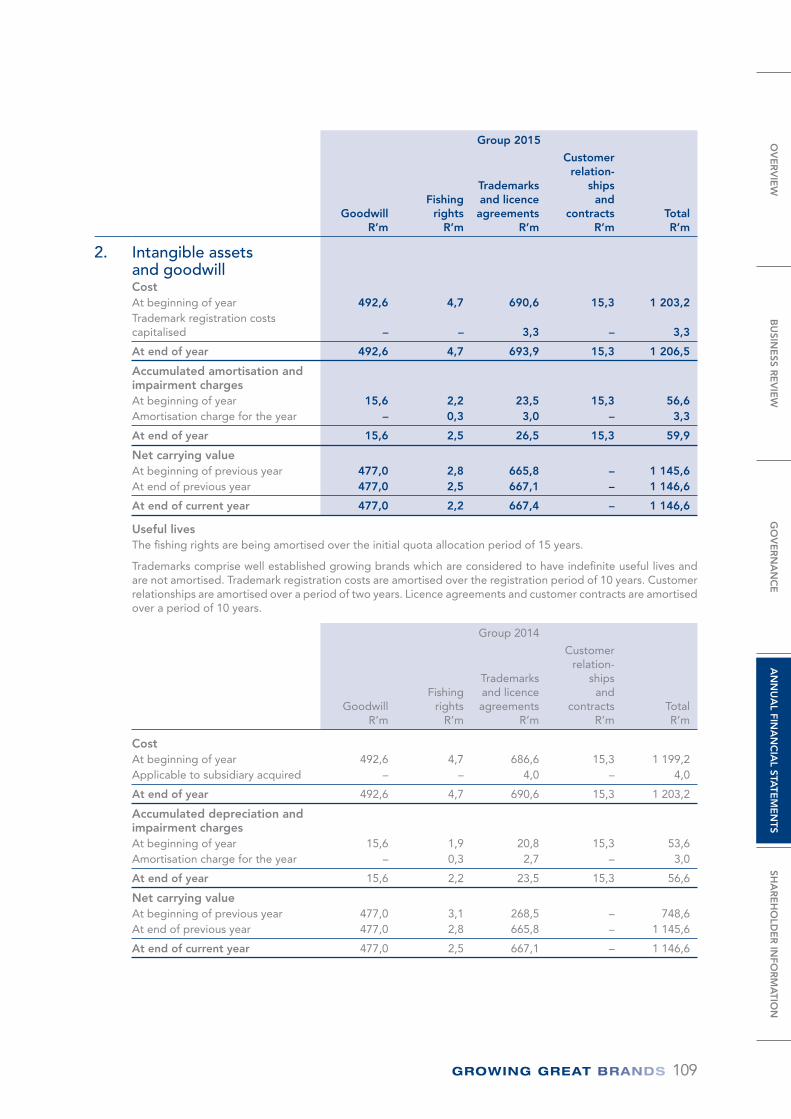
109
Group 2015
GoodwillR’m
Fishing rights
R’m
Trademarks and licence agreements
R’m
Customer relation-
ships and
contractsR’m
TotalR’m
2. Intangible assets and goodwillCostAt beginning of year 492,6 4,7 690,6 15,3 1 203,2 Trademark registration costs capitalised – – 3,3 – 3,3
At end of year 492,6 4,7 693,9 15,3 1 206,5
Accumulated amortisation and impairment chargesAt beginning of year 15,6 2,2 23,5 15,3 56,6 Amortisation charge for the year – 0,3 3,0 – 3,3
At end of year 15,6 2,5 26,5 15,3 59,9
Net carrying value At beginning of previous year 477,0 2,8 665,8 – 1 145,6 At end of previous year 477,0 2,5 667,1 – 1 146,6
At end of current year 477,0 2,2 667,4 – 1 146,6
Useful livesThe fishing rights are being amortised over the initial quota allocation period of 15 years.
Trademarks comprise well established growing brands which are considered to have indefinite useful lives and are not amortised. Trademark registration costs are amortised over the registration period of 10 years. Customer relationships are amortised over a period of two years. Licence agreements and customer contracts are amortised over a period of 10 years.
Group 2014
GoodwillR’m
Fishing rights
R’m
Trademarks and licence agreements
R’m
Customer relation-
ships and
contractsR’m
TotalR’m
CostAt beginning of year 492,6 4,7 686,6 15,3 1 199,2 Applicable to subsidiary acquired – – 4,0 – 4,0
At end of year 492,6 4,7 690,6 15,3 1 203,2
Accumulated depreciation and impairment chargesAt beginning of year 15,6 1,9 20,8 15,3 53,6 Amortisation charge for the year – 0,3 2,7 – 3,0
At end of year 15,6 2,2 23,5 15,3 56,6
Net carrying value At beginning of previous year 477,0 3,1 268,5 – 748,6 At end of previous year 477,0 2,8 665,8 – 1 145,6
At end of current year 477,0 2,5 667,1 – 1 146,6
OV
ER
VIE
WB
USIN
ESS R
EV
IEW
GO
VE
RN
AN
CE
AN
NU
AL FIN
AN
CIA
L STATE
ME
NTS
SHA
RE
HO
LDE
R IN
FOR
MA
TION
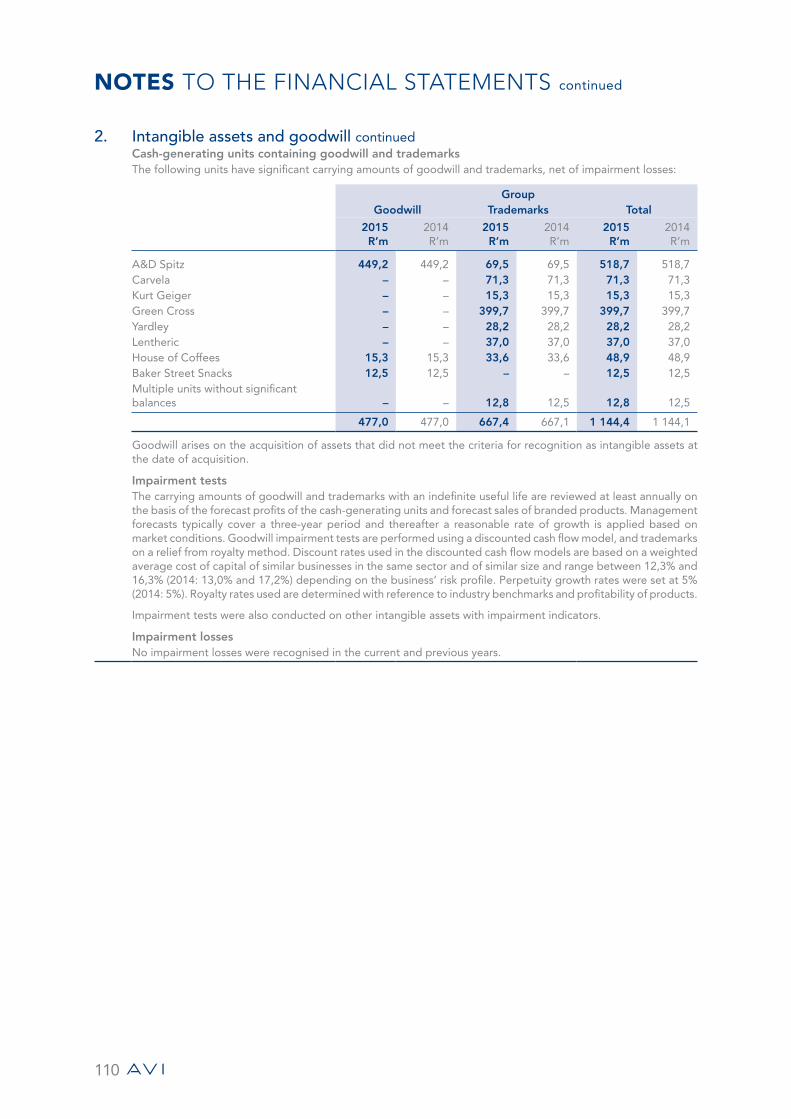
NOTES TO THE FINANCIAL STATEMENTS continued
110
2. Intangible assets and goodwill continuedCash-generating units containing goodwill and trademarksThe following units have significant carrying amounts of goodwill and trademarks, net of impairment losses:
Group Goodwill Trademarks Total
2015R’m
2014R’m
2015R’m
2014R’m
2015R’m
2014R’m
A&D Spitz 449,2 449,2 69,5 69,5 518,7 518,7 Carvela – – 71,3 71,3 71,3 71,3 Kurt Geiger – – 15,3 15,3 15,3 15,3 Green Cross – – 399,7 399,7 399,7 399,7 Yardley – – 28,2 28,2 28,2 28,2 Lentheric – – 37,0 37,0 37,0 37,0 House of Coffees 15,3 15,3 33,6 33,6 48,9 48,9 Baker Street Snacks 12,5 12,5 – – 12,5 12,5 Multiple units without significant balances – – 12,8 12,5 12,8 12,5
477,0 477,0 667,4 667,1 1 144,4 1 144,1
Goodwill arises on the acquisition of assets that did not meet the criteria for recognition as intangible assets at the date of acquisition.
Impairment testsThe carrying amounts of goodwill and trademarks with an indefinite useful life are reviewed at least annually on the basis of the forecast profits of the cash-generating units and forecast sales of branded products. Management forecasts typically cover a three-year period and thereafter a reasonable rate of growth is applied based on market conditions. Goodwill impairment tests are performed using a discounted cash flow model, and trademarks on a relief from royalty method. Discount rates used in the discounted cash flow models are based on a weighted average cost of capital of similar businesses in the same sector and of similar size and range between 12,3% and 16,3% (2014: 13,0% and 17,2%) depending on the business’ risk profile. Perpetuity growth rates were set at 5% (2014: 5%). Royalty rates used are determined with reference to industry benchmarks and profitability of products.
Impairment tests were also conducted on other intangible assets with impairment indicators.
Impairment lossesNo impairment losses were recognised in the current and previous years.
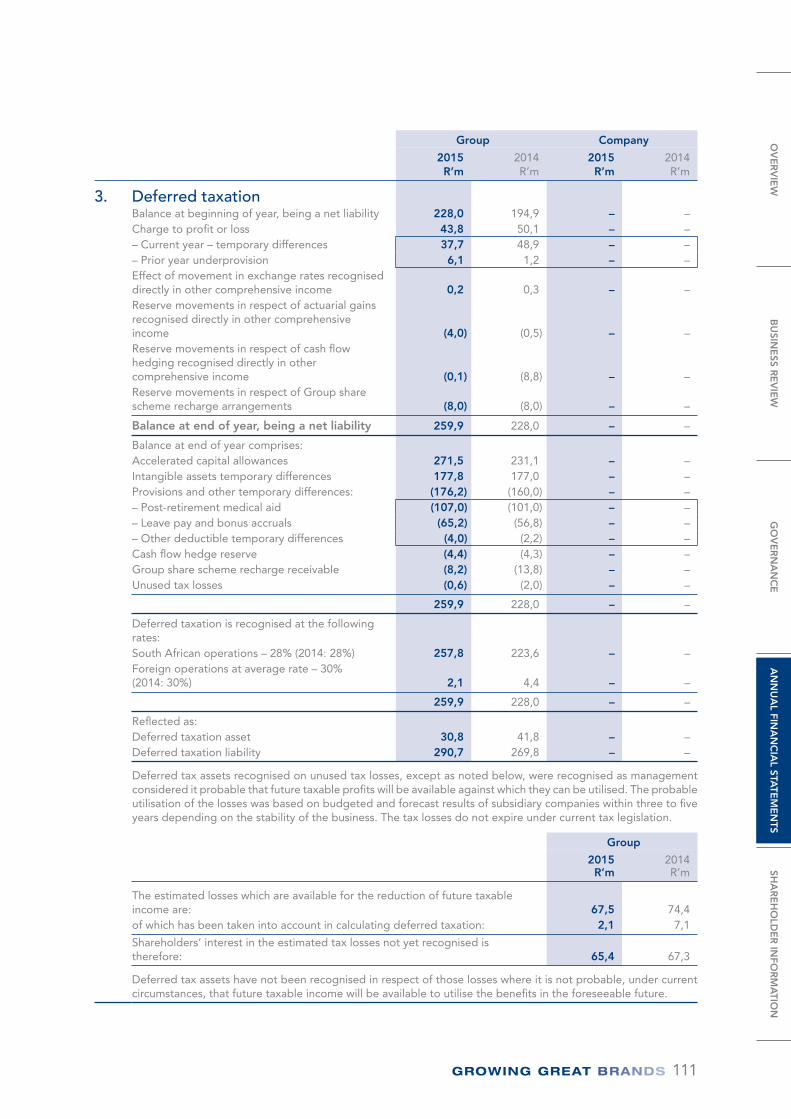
111
Group Company
2015R’m
2014R’m
2015R’m
2014R’m
3. Deferred taxationBalance at beginning of year, being a net liability 228,0 194,9 – – Charge to profit or loss 43,8 50,1 – – – Current year – temporary differences 37,7 48,9 – – – Prior year underprovision 6,1 1,2 – – Effect of movement in exchange rates recognised directly in other comprehensive income 0,2 0,3 – – Reserve movements in respect of actuarial gains recognised directly in other comprehensive income (4,0) (0,5) – – Reserve movements in respect of cash flow hedging recognised directly in other comprehensive income (0,1) (8,8) – – Reserve movements in respect of Group share scheme recharge arrangements (8,0) (8,0) – –
Balance at end of year, being a net liability 259,9 228,0 – –
Balance at end of year comprises: Accelerated capital allowances 271,5 231,1 – – Intangible assets temporary differences 177,8 177,0 – – Provisions and other temporary differences: (176,2) (160,0) – – – Post-retirement medical aid (107,0) (101,0) – – – Leave pay and bonus accruals (65,2) (56,8) – – – Other deductible temporary differences (4,0) (2,2) – – Cash flow hedge reserve (4,4) (4,3) – – Group share scheme recharge receivable (8,2) (13,8) – – Unused tax losses (0,6) (2,0) – –
259,9 228,0 – –
Deferred taxation is recognised at the following rates: South African operations – 28% (2014: 28%) 257,8 223,6 – – Foreign operations at average rate – 30% (2014: 30%) 2,1 4,4 – –
259,9 228,0 – –
Reflected as: Deferred taxation asset 30,8 41,8 – – Deferred taxation liability 290,7 269,8 – –
Deferred tax assets recognised on unused tax losses, except as noted below, were recognised as management considered it probable that future taxable profits will be available against which they can be utilised. The probable utilisation of the losses was based on budgeted and forecast results of subsidiary companies within three to five years depending on the stability of the business. The tax losses do not expire under current tax legislation.
Group
2015R’m
2014R’m
The estimated losses which are available for the reduction of future taxable income are: 67,5 74,4 of which has been taken into account in calculating deferred taxation: 2,1 7,1
Shareholders’ interest in the estimated tax losses not yet recognised is therefore: 65,4 67,3
Deferred tax assets have not been recognised in respect of those losses where it is not probable, under current circumstances, that future taxable income will be available to utilise the benefits in the foreseeable future.
OV
ER
VIE
WB
USIN
ESS R
EV
IEW
GO
VE
RN
AN
CE
AN
NU
AL FIN
AN
CIA
L STATE
ME
NTS
SHA
RE
HO
LDE
R IN
FOR
MA
TION
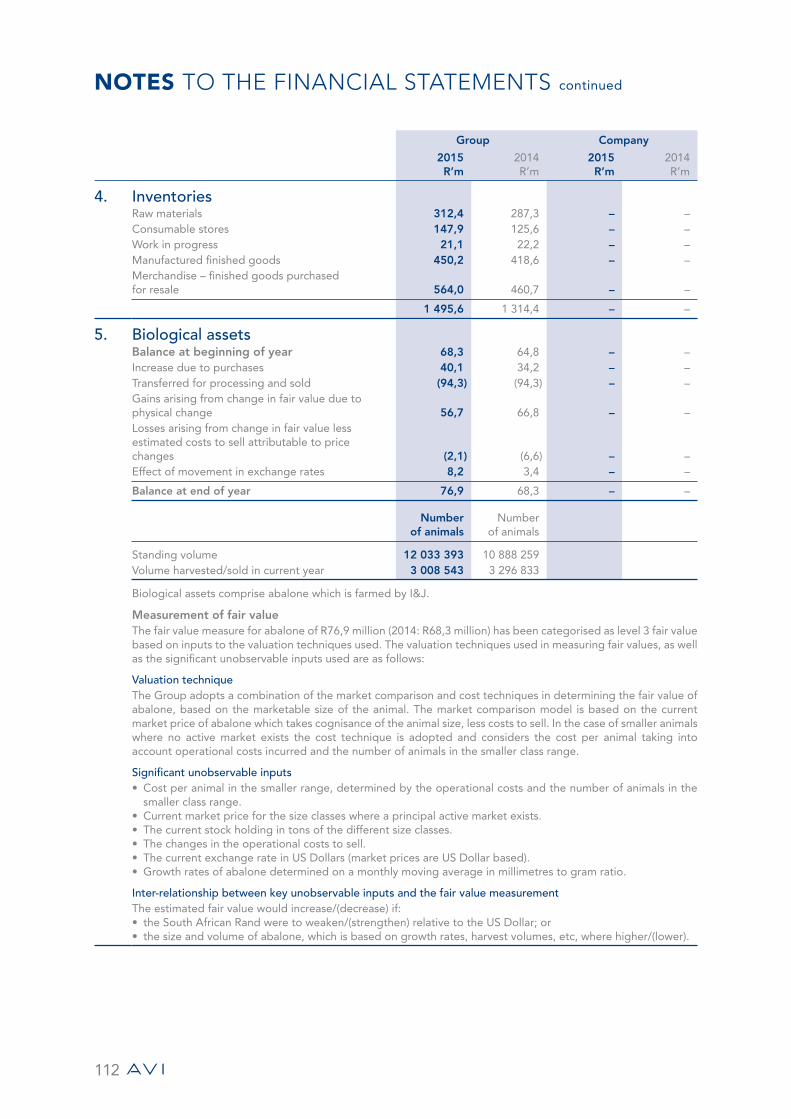
NOTES TO THE FINANCIAL STATEMENTS continued
112
Group Company
2015R’m
2014R’m
2015R’m
2014R’m
4. InventoriesRaw materials 312,4 287,3 – – Consumable stores 147,9 125,6 – – Work in progress 21,1 22,2 – – Manufactured finished goods 450,2 418,6 – – Merchandise – finished goods purchased for resale 564,0 460,7 – –
1 495,6 1 314,4 – –
5. Biological assets Balance at beginning of year 68,3 64,8 – – Increase due to purchases 40,1 34,2 – – Transferred for processing and sold (94,3) (94,3) – – Gains arising from change in fair value due to physical change 56,7 66,8 – – Losses arising from change in fair value less estimated costs to sell attributable to price changes (2,1) (6,6) – – Effect of movement in exchange rates 8,2 3,4 – –
Balance at end of year 76,9 68,3 – –
Number of animals
Number of animals
Standing volume 12 033 393 10 888 259 Volume harvested/sold in current year 3 008 543 3 296 833
Biological assets comprise abalone which is farmed by I&J.
Measurement of fair value The fair value measure for abalone of R76,9 million (2014: R68,3 million) has been categorised as level 3 fair value based on inputs to the valuation techniques used. The valuation techniques used in measuring fair values, as well as the significant unobservable inputs used are as follows:
Valuation technique The Group adopts a combination of the market comparison and cost techniques in determining the fair value of abalone, based on the marketable size of the animal. The market comparison model is based on the current market price of abalone which takes cognisance of the animal size, less costs to sell. In the case of smaller animals where no active market exists the cost technique is adopted and considers the cost per animal taking into account operational costs incurred and the number of animals in the smaller class range.
Significant unobservable inputs • Cost per animal in the smaller range, determined by the operational costs and the number of animals in the
smaller class range.• Current market price for the size classes where a principal active market exists.• The current stock holding in tons of the different size classes.• The changes in the operational costs to sell.• The current exchange rate in US Dollars (market prices are US Dollar based).• Growth rates of abalone determined on a monthly moving average in millimetres to gram ratio.
Inter-relationship between key unobservable inputs and the fair value measurement The estimated fair value would increase/(decrease) if: • the South African Rand were to weaken/(strengthen) relative to the US Dollar; or• the size and volume of abalone, which is based on growth rates, harvest volumes, etc, where higher/(lower).
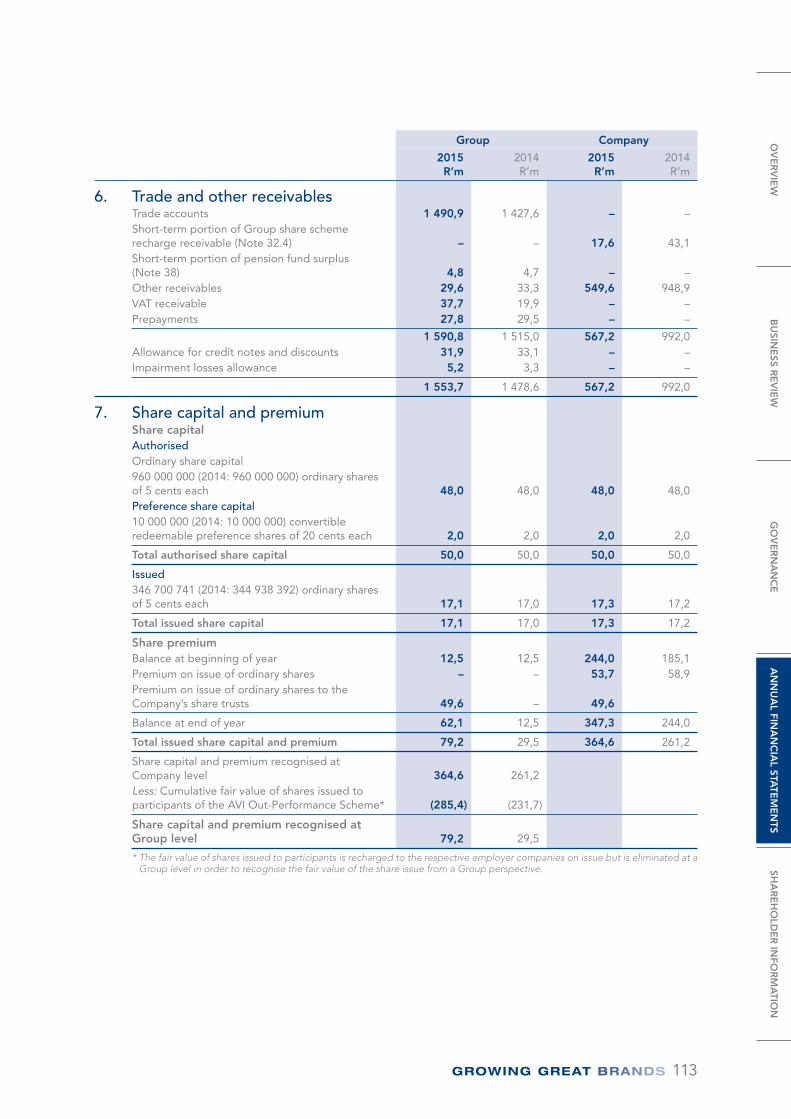
113
Group Company
2015R’m
2014R’m
2015R’m
2014R’m
6. Trade and other receivables Trade accounts 1 490,9 1 427,6 – – Short-term portion of Group share scheme recharge receivable (Note 32.4) – – 17,6 43,1 Short-term portion of pension fund surplus (Note 38) 4,8 4,7 – – Other receivables 29,6 33,3 549,6 948,9 VAT receivable 37,7 19,9 – – Prepayments 27,8 29,5 – –
1 590,8 1 515,0 567,2 992,0 Allowance for credit notes and discounts 31,9 33,1 – – Impairment losses allowance 5,2 3,3 – –
1 553,7 1 478,6 567,2 992,0
7. Share capital and premiumShare capital Authorised Ordinary share capital 960 000 000 (2014: 960 000 000) ordinary shares of 5 cents each 48,0 48,0 48,0 48,0 Preference share capital 10 000 000 (2014: 10 000 000) convertible redeemable preference shares of 20 cents each 2,0 2,0 2,0 2,0
Total authorised share capital 50,0 50,0 50,0 50,0
Issued 346 700 741 (2014: 344 938 392) ordinary shares of 5 cents each 17,1 17,0 17,3 17,2
Total issued share capital 17,1 17,0 17,3 17,2
Share premium Balance at beginning of year 12,5 12,5 244,0 185,1 Premium on issue of ordinary shares – – 53,7 58,9 Premium on issue of ordinary shares to the Company’s share trusts 49,6 – 49,6
Balance at end of year 62,1 12,5 347,3 244,0
Total issued share capital and premium 79,2 29,5 364,6 261,2
Share capital and premium recognised at Company level 364,6 261,2 Less: Cumulative fair value of shares issued to participants of the AVI Out-Performance Scheme* (285,4) (231,7)
Share capital and premium recognised at Group level 79,2 29,5
* The fair value of shares issued to participants is recharged to the respective employer companies on issue but is eliminated at a Group level in order to recognise the fair value of the share issue from a Group perspective.
OV
ER
VIE
WB
USIN
ESS R
EV
IEW
GO
VE
RN
AN
CE
AN
NU
AL FIN
AN
CIA
L STATE
ME
NTS
SHA
RE
HO
LDE
R IN
FOR
MA
TION
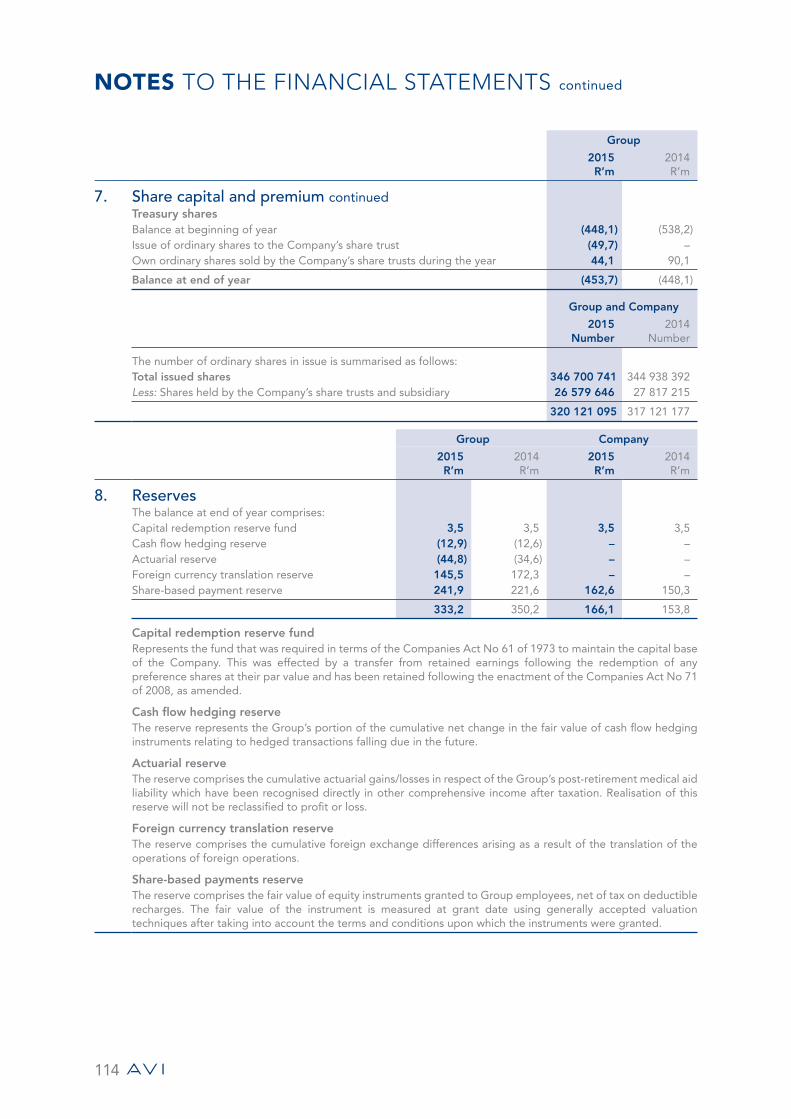
NOTES TO THE FINANCIAL STATEMENTS continued
114
Group
2015R’m
2014R’m
7. Share capital and premium continuedTreasury shares Balance at beginning of year (448,1) (538,2)Issue of ordinary shares to the Company’s share trust (49,7) –Own ordinary shares sold by the Company’s share trusts during the year 44,1 90,1
Balance at end of year (453,7) (448,1)
Group and Company
2015Number
2014Number
The number of ordinary shares in issue is summarised as follows: Total issued shares 346 700 741 344 938 392 Less: Shares held by the Company’s share trusts and subsidiary 26 579 646 27 817 215
320 121 095 317 121 177
Group Company
2015R’m
2014R’m
2015R’m
2014R’m
8. Reserves The balance at end of year comprises: Capital redemption reserve fund 3,5 3,5 3,5 3,5 Cash flow hedging reserve (12,9) (12,6) – – Actuarial reserve (44,8) (34,6) – – Foreign currency translation reserve 145,5 172,3 – – Share-based payment reserve 241,9 221,6 162,6 150,3
333,2 350,2 166,1 153,8
Capital redemption reserve fundRepresents the fund that was required in terms of the Companies Act No 61 of 1973 to maintain the capital base of the Company. This was effected by a transfer from retained earnings following the redemption of any preference shares at their par value and has been retained following the enactment of the Companies Act No 71 of 2008, as amended.
Cash flow hedging reserveThe reserve represents the Group’s portion of the cumulative net change in the fair value of cash flow hedging instruments relating to hedged transactions falling due in the future.
Actuarial reserveThe reserve comprises the cumulative actuarial gains/losses in respect of the Group’s post-retirement medical aid liability which have been recognised directly in other comprehensive income after taxation. Realisation of this reserve will not be reclassified to profit or loss.
Foreign currency translation reserveThe reserve comprises the cumulative foreign exchange differences arising as a result of the translation of the operations of foreign operations.
Share-based payments reserveThe reserve comprises the fair value of equity instruments granted to Group employees, net of tax on deductible recharges. The fair value of the instrument is measured at grant date using generally accepted valuation techniques after taking into account the terms and conditions upon which the instruments were granted.
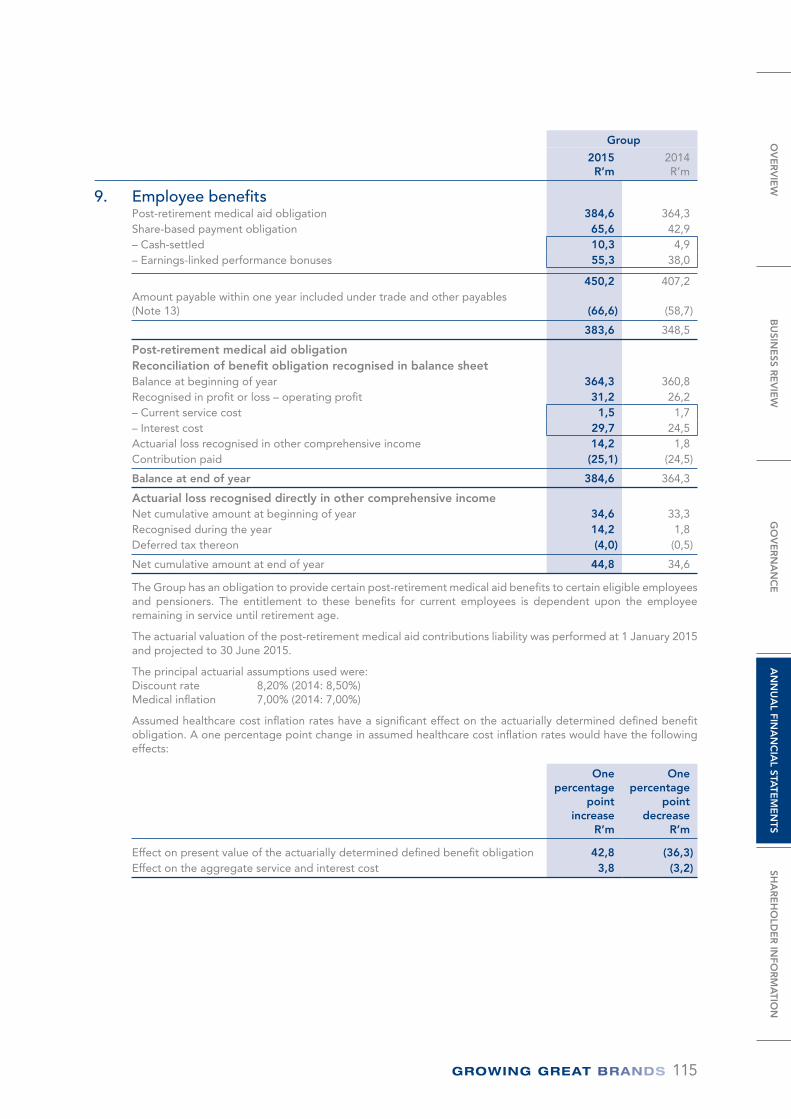
115
Group
2015R’m
2014R’m
9. Employee benefits Post-retirement medical aid obligation 384,6 364,3 Share-based payment obligation 65,6 42,9 – Cash-settled 10,3 4,9 – Earnings-linked performance bonuses 55,3 38,0
450,2 407,2 Amount payable within one year included under trade and other payables (Note 13) (66,6) (58,7)
383,6 348,5
Post-retirement medical aid obligation Reconciliation of benefit obligation recognised in balance sheet Balance at beginning of year 364,3 360,8 Recognised in profit or loss – operating profit 31,2 26,2 – Current service cost 1,5 1,7 – Interest cost 29,7 24,5 Actuarial loss recognised in other comprehensive income 14,2 1,8 Contribution paid (25,1) (24,5)
Balance at end of year 384,6 364,3
Actuarial loss recognised directly in other comprehensive income Net cumulative amount at beginning of year 34,6 33,3 Recognised during the year 14,2 1,8 Deferred tax thereon (4,0) (0,5)
Net cumulative amount at end of year 44,8 34,6
The Group has an obligation to provide certain post-retirement medical aid benefits to certain eligible employees and pensioners. The entitlement to these benefits for current employees is dependent upon the employee remaining in service until retirement age.
The actuarial valuation of the post-retirement medical aid contributions liability was performed at 1 January 2015 and projected to 30 June 2015.
The principal actuarial assumptions used were: Discount rate 8,20% (2014: 8,50%) Medical inflation 7,00% (2014: 7,00%)
Assumed healthcare cost inflation rates have a significant effect on the actuarially determined defined benefit obligation. A one percentage point change in assumed healthcare cost inflation rates would have the following effects:
One percentage
point increase
R’m
One percentage
point decrease
R’m
Effect on present value of the actuarially determined defined benefit obligation 42,8 (36,3)Effect on the aggregate service and interest cost 3,8 (3,2)
OV
ER
VIE
WB
USIN
ESS R
EV
IEW
GO
VE
RN
AN
CE
AN
NU
AL FIN
AN
CIA
L STATE
ME
NTS
SHA
RE
HO
LDE
R IN
FOR
MA
TION
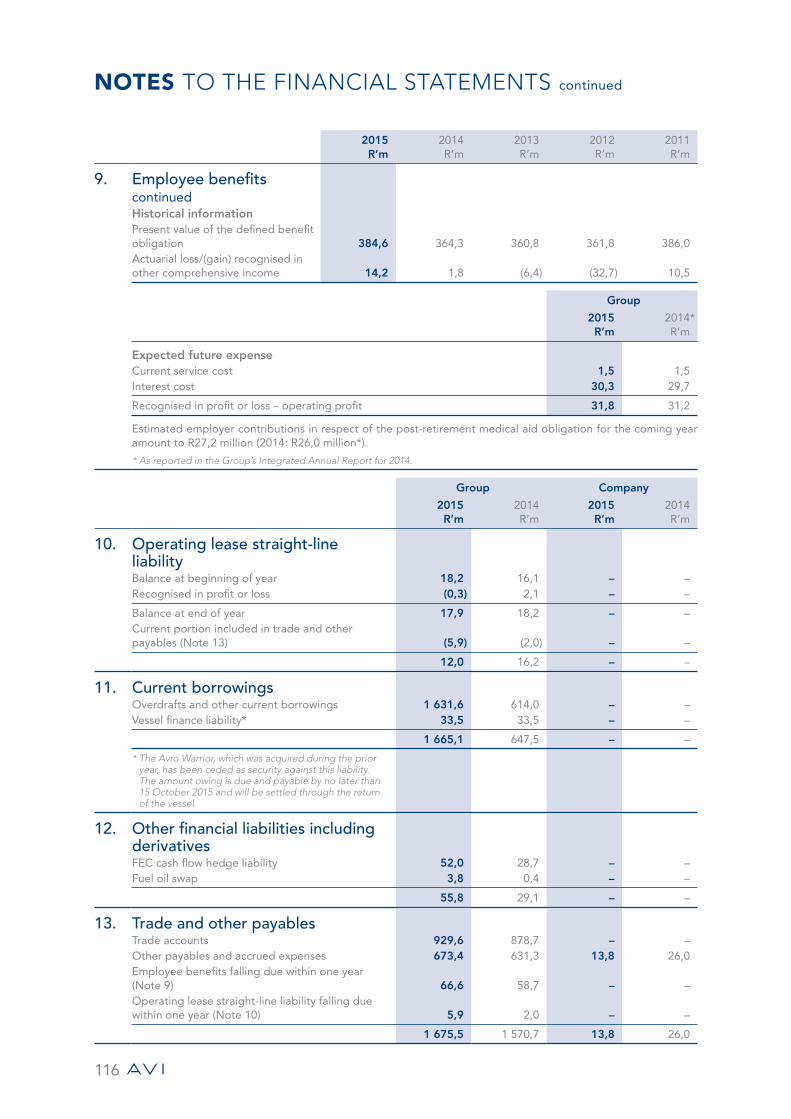
NOTES TO THE FINANCIAL STATEMENTS continued
116
2015 R’m
2014 R’m
2013 R’m
2012 R’m
2011 R’m
9. Employee benefits continuedHistorical information Present value of the defined benefit obligation 384,6 364,3 360,8 361,8 386,0 Actuarial loss/(gain) recognised in other comprehensive income 14,2 1,8 (6,4) (32,7) 10,5
Group
2015R’m
2014*R’m
Expected future expense Current service cost 1,5 1,5 Interest cost 30,3 29,7
Recognised in profit or loss – operating profit 31,8 31,2
Estimated employer contributions in respect of the post-retirement medical aid obligation for the coming year amount to R27,2 million (2014: R26,0 million*).
* As reported in the Group’s Integrated Annual Report for 2014.
Group Company
2015R’m
2014R’m
2015R’m
2014R’m
10. Operating lease straight-line liability Balance at beginning of year 18,2 16,1 – – Recognised in profit or loss (0,3) 2,1 – –
Balance at end of year 17,9 18,2 – – Current portion included in trade and other payables (Note 13) (5,9) (2,0) – –
12,0 16,2 – –
11. Current borrowings Overdrafts and other current borrowings 1 631,6 614,0 – – Vessel finance liability* 33,5 33,5 – –
1 665,1 647,5 – –
* The Avro Warrior, which was acquired during the prior year, has been ceded as security against this liability. The amount owing is due and payable by no later than 15 October 2015 and will be settled through the return of the vessel.
12. Other financial liabilities including derivatives FEC cash flow hedge liability 52,0 28,7 – – Fuel oil swap 3,8 0,4 – –
55,8 29,1 – –
13. Trade and other payables Trade accounts 929,6 878,7 – – Other payables and accrued expenses 673,4 631,3 13,8 26,0 Employee benefits falling due within one year (Note 9) 66,6 58,7 – – Operating lease straight-line liability falling due within one year (Note 10) 5,9 2,0 – –
1 675,5 1 570,7 13,8 26,0
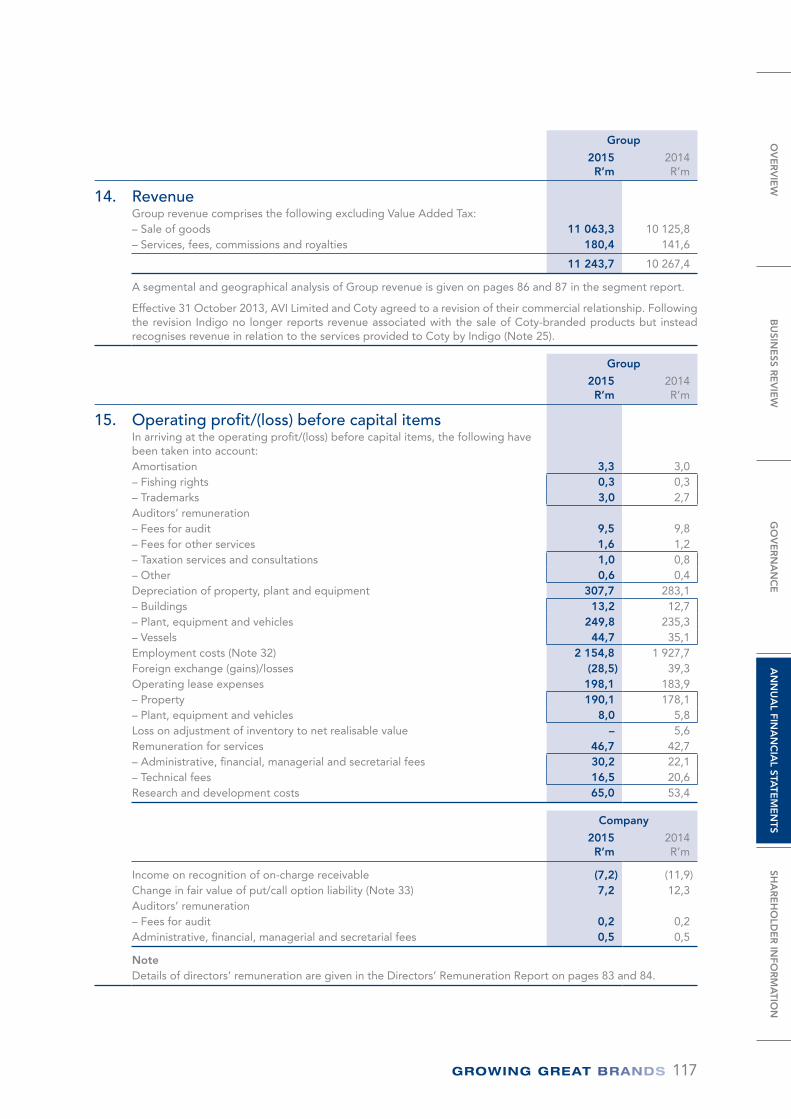
117
Group
2015R’m
2014R’m
14. Revenue Group revenue comprises the following excluding Value Added Tax: – Sale of goods 11 063,3 10 125,8 – Services, fees, commissions and royalties 180,4 141,6
11 243,7 10 267,4
A segmental and geographical analysis of Group revenue is given on pages 86 and 87 in the segment report.
Effective 31 October 2013, AVI Limited and Coty agreed to a revision of their commercial relationship. Following the revision Indigo no longer reports revenue associated with the sale of Coty-branded products but instead recognises revenue in relation to the services provided to Coty by Indigo (Note 25).
Group
2015R’m
2014R’m
15. Operating profit/(loss) before capital items In arriving at the operating profit/(loss) before capital items, the following have been taken into account: Amortisation 3,3 3,0 – Fishing rights 0,3 0,3 – Trademarks 3,0 2,7 Auditors’ remuneration – Fees for audit 9,5 9,8 – Fees for other services 1,6 1,2 – Taxation services and consultations 1,0 0,8 – Other 0,6 0,4 Depreciation of property, plant and equipment 307,7 283,1 – Buildings 13,2 12,7 – Plant, equipment and vehicles 249,8 235,3 – Vessels 44,7 35,1 Employment costs (Note 32) 2 154,8 1 927,7 Foreign exchange (gains)/losses (28,5) 39,3 Operating lease expenses 198,1 183,9 – Property 190,1 178,1 – Plant, equipment and vehicles 8,0 5,8 Loss on adjustment of inventory to net realisable value – 5,6 Remuneration for services 46,7 42,7 – Administrative, financial, managerial and secretarial fees 30,2 22,1 – Technical fees 16,5 20,6 Research and development costs 65,0 53,4
Company
2015R’m
2014R’m
Income on recognition of on-charge receivable (7,2) (11,9)Change in fair value of put/call option liability (Note 33) 7,2 12,3 Auditors’ remuneration – Fees for audit 0,2 0,2 Administrative, financial, managerial and secretarial fees 0,5 0,5
Note Details of directors’ remuneration are given in the Directors’ Remuneration Report on pages 83 and 84.
OV
ER
VIE
WB
USIN
ESS R
EV
IEW
GO
VE
RN
AN
CE
AN
NU
AL FIN
AN
CIA
L STATE
ME
NTS
SHA
RE
HO
LDE
R IN
FOR
MA
TION
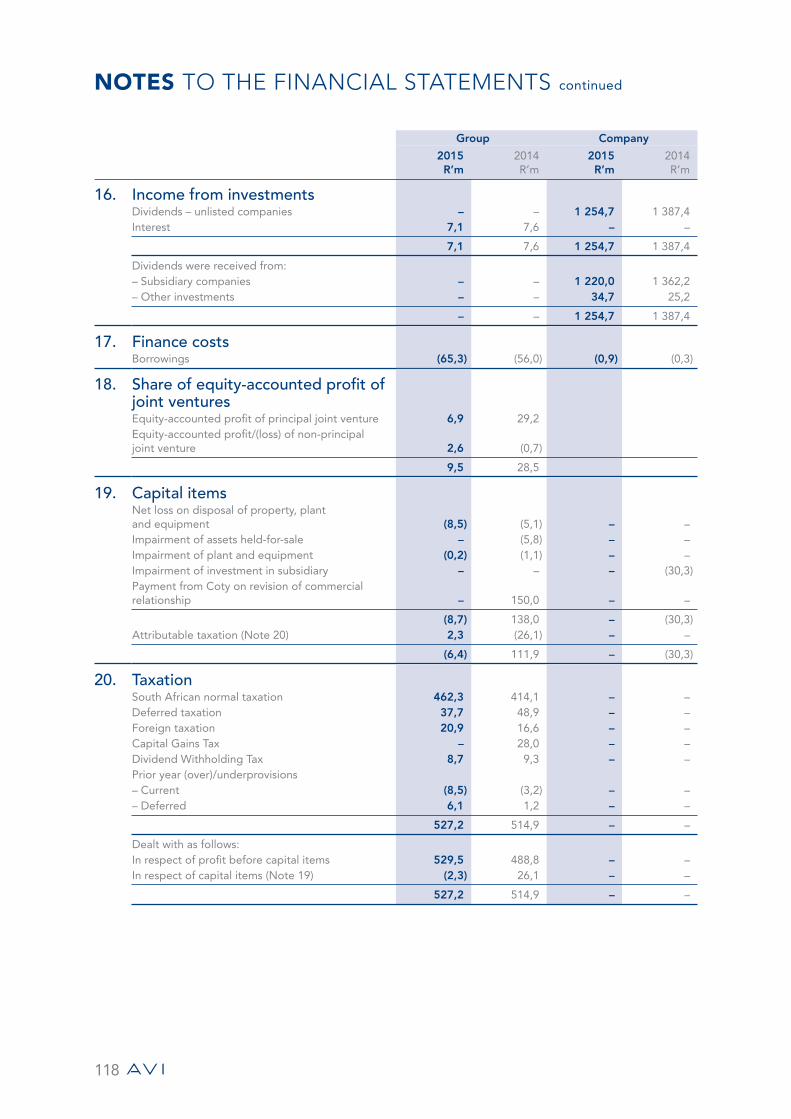
NOTES TO THE FINANCIAL STATEMENTS continued
118
Group Company
2015R’m
2014R’m
2015R’m
2014R’m
16. Income from investments Dividends – unlisted companies – – 1 254,7 1 387,4 Interest 7,1 7,6 – –
7,1 7,6 1 254,7 1 387,4
Dividends were received from: – Subsidiary companies – – 1 220,0 1 362,2 – Other investments – – 34,7 25,2
– – 1 254,7 1 387,4
17. Finance costs Borrowings (65,3) (56,0) (0,9) (0,3)
18. Share of equity-accounted profit of joint ventures Equity-accounted profit of principal joint venture 6,9 29,2 Equity-accounted profit/(loss) of non-principal joint venture 2,6 (0,7)
9,5 28,5
19. Capital items Net loss on disposal of property, plant and equipment (8,5) (5,1) – – Impairment of assets held-for-sale – (5,8) – – Impairment of plant and equipment (0,2) (1,1) – – Impairment of investment in subsidiary – – – (30,3)Payment from Coty on revision of commercial relationship – 150,0 – –
(8,7) 138,0 – (30,3)Attributable taxation (Note 20) 2,3 (26,1) – –
(6,4) 111,9 – (30,3)
20. Taxation South African normal taxation 462,3 414,1 – – Deferred taxation 37,7 48,9 – – Foreign taxation 20,9 16,6 – – Capital Gains Tax – 28,0 – – Dividend Withholding Tax 8,7 9,3 – – Prior year (over)/underprovisions – Current (8,5) (3,2) – – – Deferred 6,1 1,2 – –
527,2 514,9 – –
Dealt with as follows: In respect of profit before capital items 529,5 488,8 – – In respect of capital items (Note 19) (2,3) 26,1 – –
527,2 514,9 – –
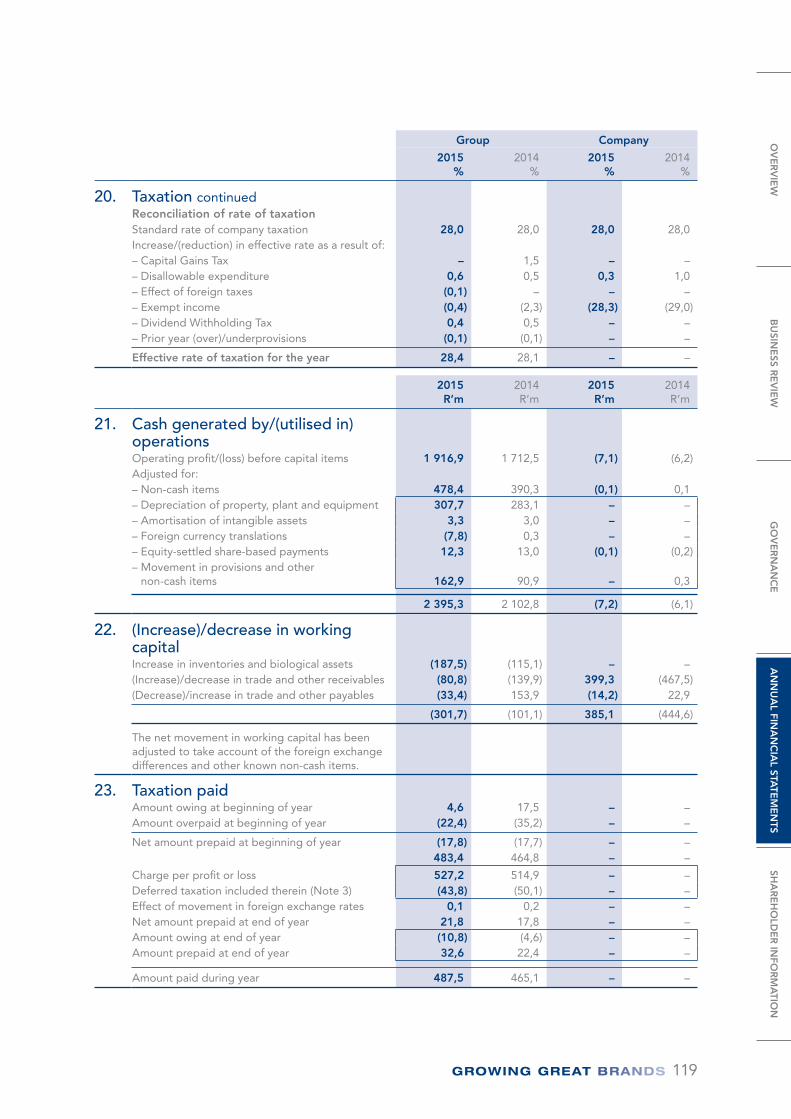
119
Group Company
2015%
2014%
2015%
2014%
20. Taxation continuedReconciliation of rate of taxation Standard rate of company taxation 28,0 28,0 28,0 28,0 Increase/(reduction) in effective rate as a result of: – Capital Gains Tax – 1,5 – – – Disallowable expenditure 0,6 0,5 0,3 1,0 – Effect of foreign taxes (0,1) – – – – Exempt income (0,4) (2,3) (28,3) (29,0)– Dividend Withholding Tax 0,4 0,5 – – – Prior year (over)/underprovisions (0,1) (0,1) – –
Effective rate of taxation for the year 28,4 28,1 – –
2015R’m
2014R’m
2015R’m
2014R’m
21. Cash generated by/(utilised in) operations Operating profit/(loss) before capital items 1 916,9 1 712,5 (7,1) (6,2)Adjusted for: – Non-cash items 478,4 390,3 (0,1) 0,1 – Depreciation of property, plant and equipment 307,7 283,1 – – – Amortisation of intangible assets 3,3 3,0 – – – Foreign currency translations (7,8) 0,3 – – – Equity-settled share-based payments 12,3 13,0 (0,1) (0,2)– Movement in provisions and other
non-cash items 162,9 90,9 – 0,3
2 395,3 2 102,8 (7,2) (6,1)
22. (Increase)/decrease in working capital Increase in inventories and biological assets (187,5) (115,1) – – (Increase)/decrease in trade and other receivables (80,8) (139,9) 399,3 (467,5)(Decrease)/increase in trade and other payables (33,4) 153,9 (14,2) 22,9
(301,7) (101,1) 385,1 (444,6)
The net movement in working capital has been adjusted to take account of the foreign exchange differences and other known non-cash items.
23. Taxation paid Amount owing at beginning of year 4,6 17,5 – – Amount overpaid at beginning of year (22,4) (35,2) – –
Net amount prepaid at beginning of year (17,8) (17,7) – – 483,4 464,8 – –
Charge per profit or loss 527,2 514,9 – – Deferred taxation included therein (Note 3) (43,8) (50,1) – – Effect of movement in foreign exchange rates 0,1 0,2 – – Net amount prepaid at end of year 21,8 17,8 – – Amount owing at end of year (10,8) (4,6) – – Amount prepaid at end of year 32,6 22,4 – –
Amount paid during year 487,5 465,1 – –
OV
ER
VIE
WB
USIN
ESS R
EV
IEW
GO
VE
RN
AN
CE
AN
NU
AL FIN
AN
CIA
L STATE
ME
NTS
SHA
RE
HO
LDE
R IN
FOR
MA
TION
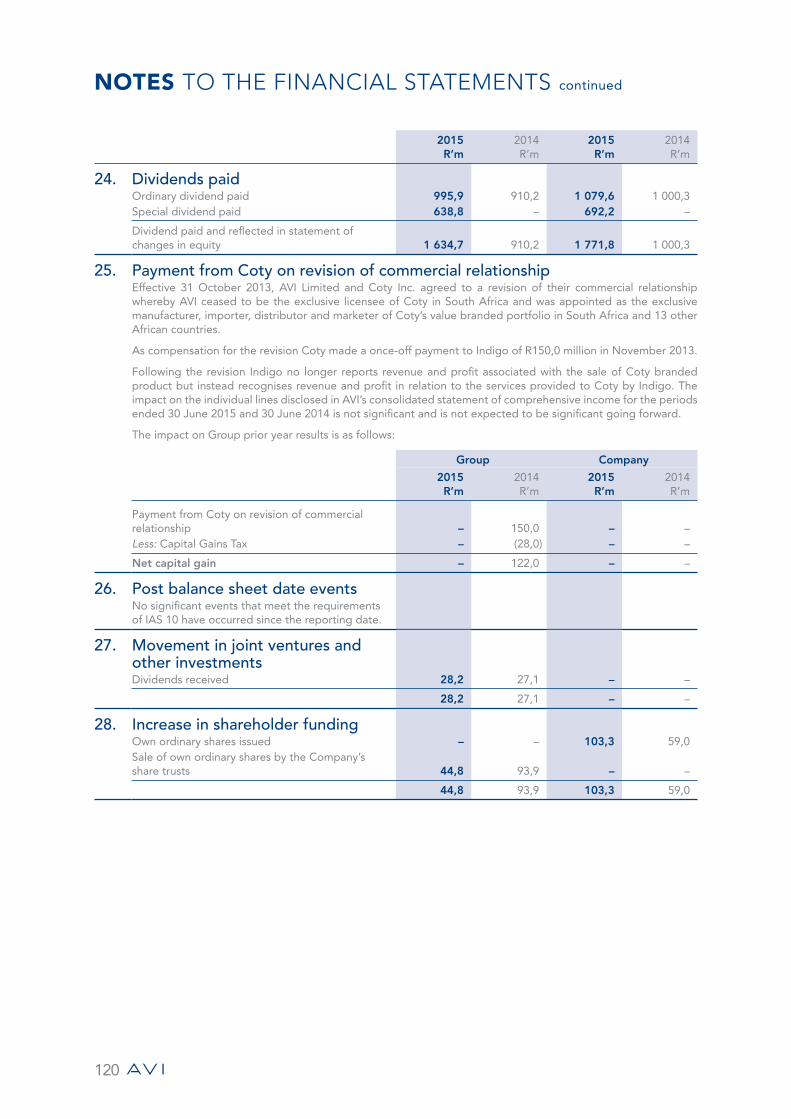
NOTES TO THE FINANCIAL STATEMENTS continued
120
2015R’m
2014R’m
2015R’m
2014R’m
24. Dividends paid Ordinary dividend paid 995,9 910,2 1 079,6 1 000,3 Special dividend paid 638,8 – 692,2 –
Dividend paid and reflected in statement of changes in equity 1 634,7 910,2 1 771,8 1 000,3
25. Payment from Coty on revision of commercial relationship Effective 31 October 2013, AVI Limited and Coty Inc. agreed to a revision of their commercial relationship whereby AVI ceased to be the exclusive licensee of Coty in South Africa and was appointed as the exclusive manufacturer, importer, distributor and marketer of Coty’s value branded portfolio in South Africa and 13 other African countries.
As compensation for the revision Coty made a once-off payment to Indigo of R150,0 million in November 2013.
Following the revision Indigo no longer reports revenue and profit associated with the sale of Coty branded product but instead recognises revenue and profit in relation to the services provided to Coty by Indigo. The impact on the individual lines disclosed in AVI’s consolidated statement of comprehensive income for the periods ended 30 June 2015 and 30 June 2014 is not significant and is not expected to be significant going forward.
The impact on Group prior year results is as follows:
Group Company
2015R’m
2014R’m
2015R’m
2014R’m
Payment from Coty on revision of commercial relationship – 150,0 – – Less: Capital Gains Tax – (28,0) – –
Net capital gain – 122,0 – –
26. Post balance sheet date events No significant events that meet the requirements of IAS 10 have occurred since the reporting date.
27. Movement in joint ventures and other investments Dividends received 28,2 27,1 – –
28,2 27,1 – –
28. Increase in shareholder funding Own ordinary shares issued – – 103,3 59,0 Sale of own ordinary shares by the Company’s share trusts 44,8 93,9 – –
44,8 93,9 103,3 59,0
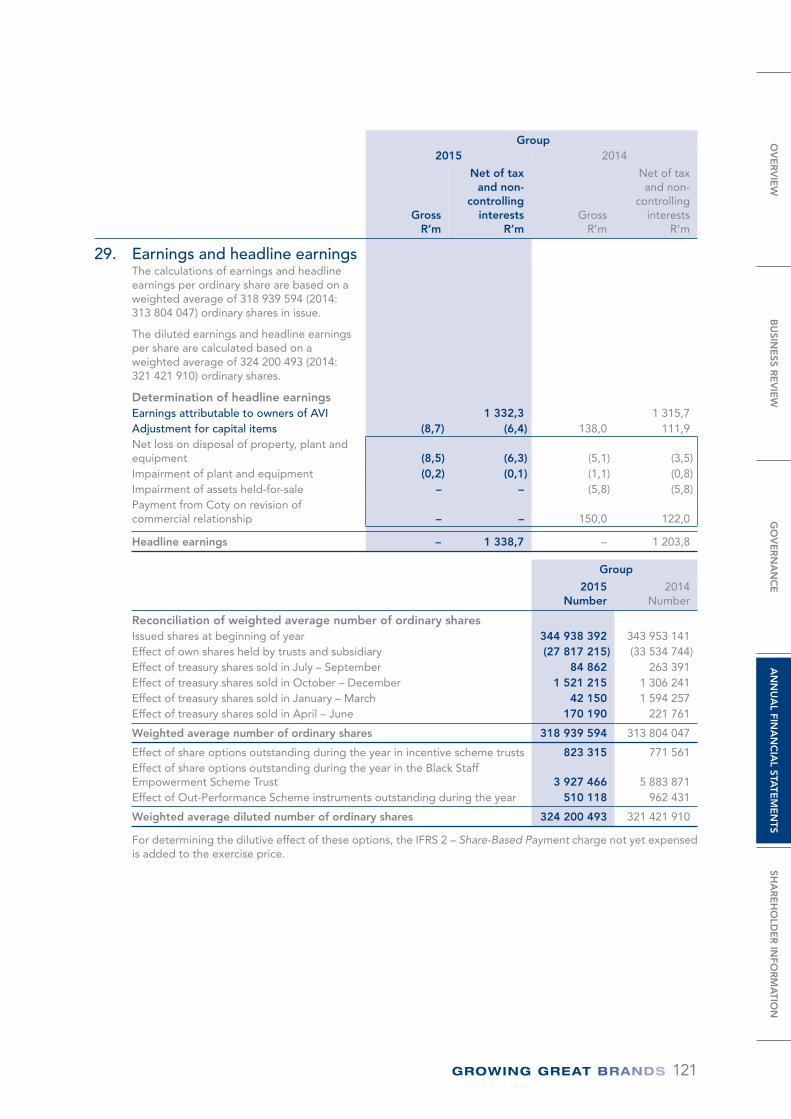
121
Group 2015 2014
Gross R’m
Net of tax and non-
controlling interests
R’m Gross
R’m
Net of tax and non-
controlling interests
R’m
29. Earnings and headline earnings The calculations of earnings and headline earnings per ordinary share are based on a weighted average of 318 939 594 (2014: 313 804 047) ordinary shares in issue.
The diluted earnings and headline earnings per share are calculated based on a weighted average of 324 200 493 (2014: 321 421 910) ordinary shares.
Determination of headline earnings Earnings attributable to owners of AVI 1 332,3 1 315,7 Adjustment for capital items (8,7) (6,4) 138,0 111,9 Net loss on disposal of property, plant and equipment (8,5) (6,3) (5,1) (3,5)Impairment of plant and equipment (0,2) (0,1) (1,1) (0,8)Impairment of assets held-for-sale – – (5,8) (5,8)Payment from Coty on revision of commercial relationship – – 150,0 122,0
Headline earnings – 1 338,7 – 1 203,8
Group
2015Number
2014Number
Reconciliation of weighted average number of ordinary shares Issued shares at beginning of year 344 938 392 343 953 141 Effect of own shares held by trusts and subsidiary (27 817 215) (33 534 744)Effect of treasury shares sold in July – September 84 862 263 391 Effect of treasury shares sold in October – December 1 521 215 1 306 241 Effect of treasury shares sold in January – March 42 150 1 594 257 Effect of treasury shares sold in April – June 170 190 221 761
Weighted average number of ordinary shares 318 939 594 313 804 047
Effect of share options outstanding during the year in incentive scheme trusts 823 315 771 561 Effect of share options outstanding during the year in the Black Staff Empowerment Scheme Trust 3 927 466 5 883 871 Effect of Out-Performance Scheme instruments outstanding during the year 510 118 962 431
Weighted average diluted number of ordinary shares 324 200 493 321 421 910
For determining the dilutive effect of these options, the IFRS 2 – Share-Based Payment charge not yet expensed is added to the exercise price.
OV
ER
VIE
WB
USIN
ESS R
EV
IEW
GO
VE
RN
AN
CE
AN
NU
AL FIN
AN
CIA
L STATE
ME
NTS
SHA
RE
HO
LDE
R IN
FOR
MA
TION
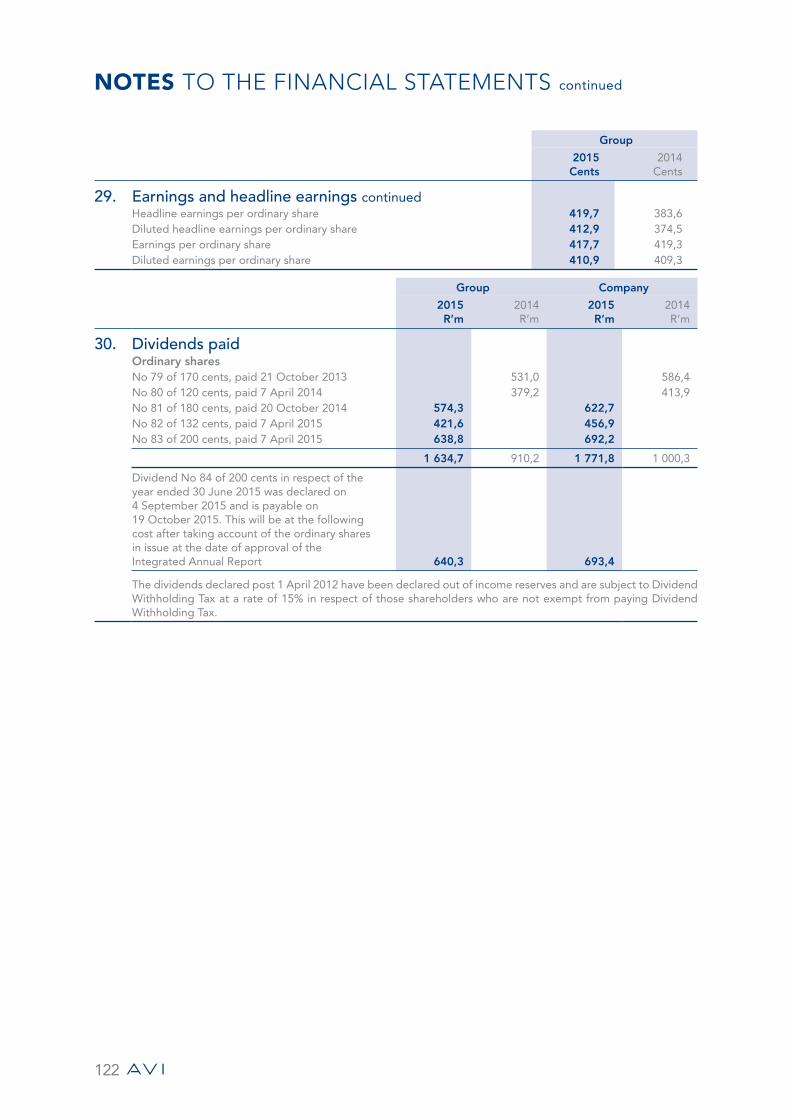
NOTES TO THE FINANCIAL STATEMENTS continued
122
Group
2015Cents
2014Cents
29. Earnings and headline earnings continued Headline earnings per ordinary share 419,7 383,6 Diluted headline earnings per ordinary share 412,9 374,5 Earnings per ordinary share 417,7 419,3 Diluted earnings per ordinary share 410,9 409,3
Group Company
2015R’m
2014R’m
2015R’m
2014R’m
30. Dividends paid Ordinary shares No 79 of 170 cents, paid 21 October 2013 531,0 586,4 No 80 of 120 cents, paid 7 April 2014 379,2 413,9 No 81 of 180 cents, paid 20 October 2014 574,3 622,7 No 82 of 132 cents, paid 7 April 2015 421,6 456,9 No 83 of 200 cents, paid 7 April 2015 638,8 692,2
1 634,7 910,2 1 771,8 1 000,3
Dividend No 84 of 200 cents in respect of the year ended 30 June 2015 was declared on 4 September 2015 and is payable on 19 October 2015. This will be at the following cost after taking account of the ordinary shares in issue at the date of approval of the Integrated Annual Report 640,3 693,4
The dividends declared post 1 April 2012 have been declared out of income reserves and are subject to Dividend Withholding Tax at a rate of 15% in respect of those shareholders who are not exempt from paying Dividend Withholding Tax.
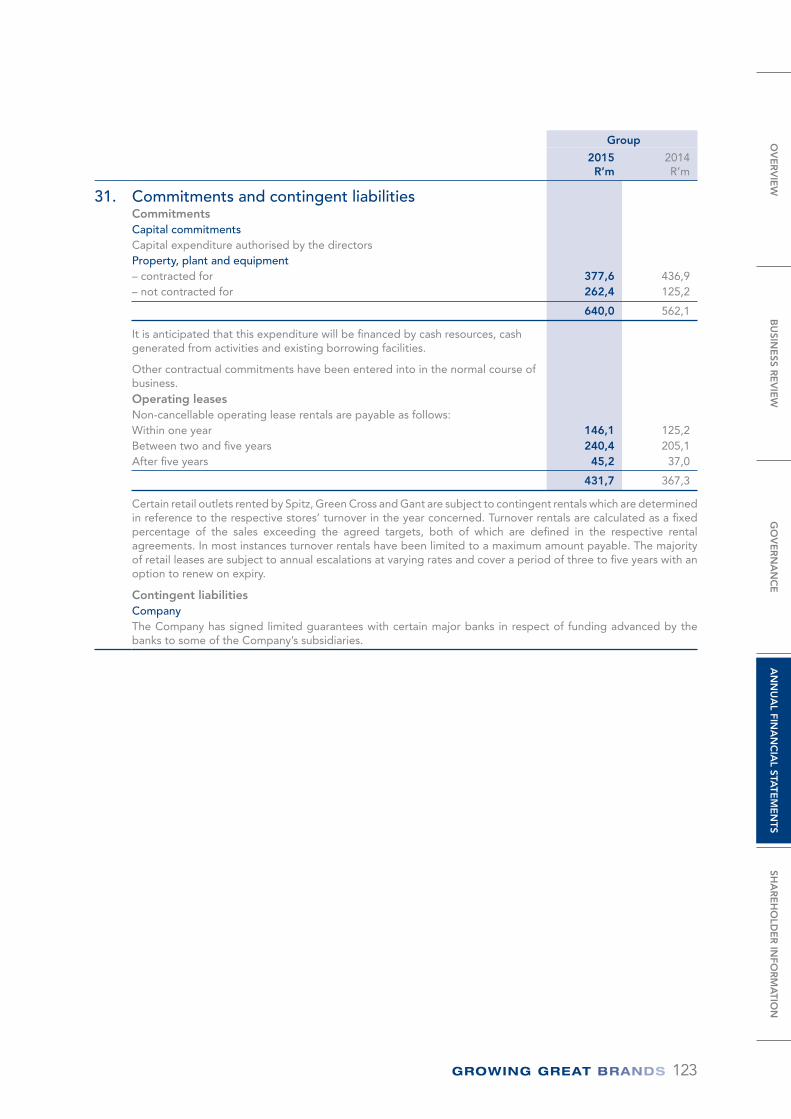
123
Group
2015R’m
2014R’m
31. Commitments and contingent liabilities Commitments Capital commitments Capital expenditure authorised by the directors Property, plant and equipment – contracted for 377,6 436,9 – not contracted for 262,4 125,2
640,0 562,1
It is anticipated that this expenditure will be financed by cash resources, cash generated from activities and existing borrowing facilities.
Other contractual commitments have been entered into in the normal course of business.Operating leases Non-cancellable operating lease rentals are payable as follows:Within one year 146,1 125,2 Between two and five years 240,4 205,1 After five years 45,2 37,0
431,7 367,3
Certain retail outlets rented by Spitz, Green Cross and Gant are subject to contingent rentals which are determined in reference to the respective stores’ turnover in the year concerned. Turnover rentals are calculated as a fixed percentage of the sales exceeding the agreed targets, both of which are defined in the respective rental agreements. In most instances turnover rentals have been limited to a maximum amount payable. The majority of retail leases are subject to annual escalations at varying rates and cover a period of three to five years with an option to renew on expiry.
Contingent liabilities Company The Company has signed limited guarantees with certain major banks in respect of funding advanced by the banks to some of the Company’s subsidiaries.
OV
ER
VIE
WB
USIN
ESS R
EV
IEW
GO
VE
RN
AN
CE
AN
NU
AL FIN
AN
CIA
L STATE
ME
NTS
SHA
RE
HO
LDE
R IN
FOR
MA
TION
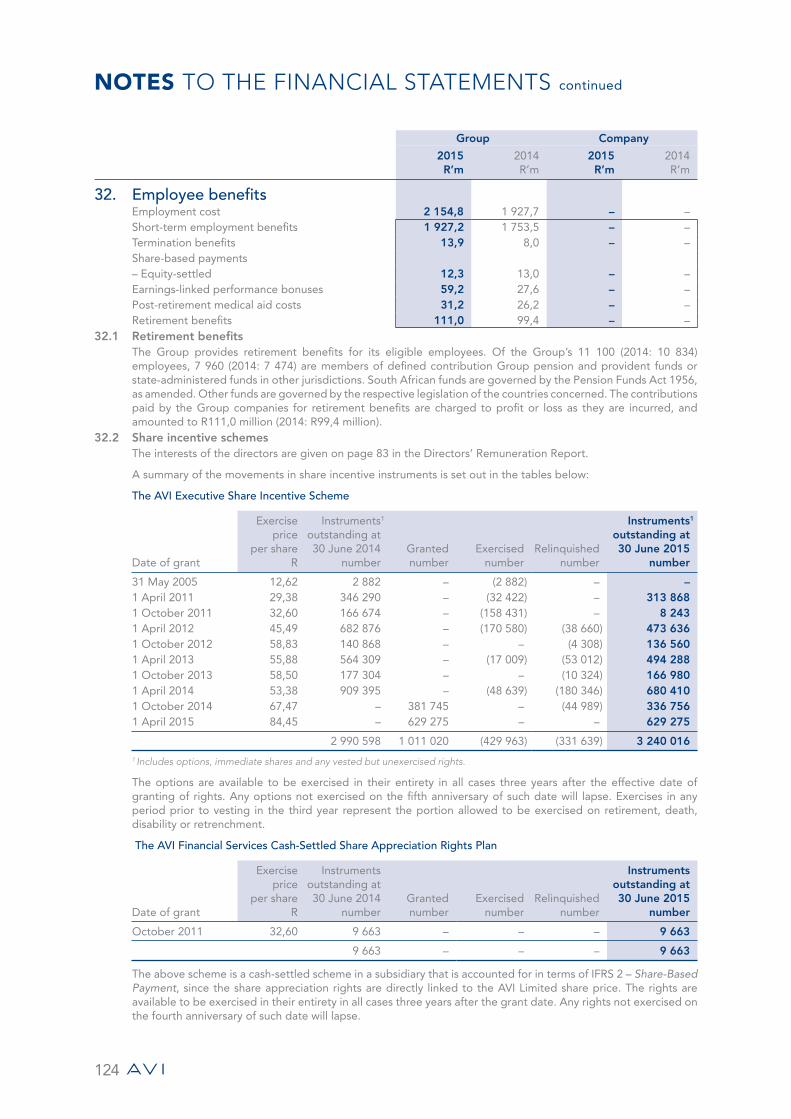
NOTES TO THE FINANCIAL STATEMENTS continued
124
Group Company
2015R’m
2014R’m
2015R’m
2014R’m
32. Employee benefits Employment cost 2 154,8 1 927,7 – – Short-term employment benefits 1 927,2 1 753,5 – – Termination benefits 13,9 8,0 – – Share-based payments– Equity-settled 12,3 13,0 – – Earnings-linked performance bonuses 59,2 27,6 – – Post-retirement medical aid costs 31,2 26,2 – – Retirement benefits 111,0 99,4 – –
32.1 Retirement benefits The Group provides retirement benefits for its eligible employees. Of the Group’s 11 100 (2014: 10 834) employees, 7 960 (2014: 7 474) are members of defined contribution Group pension and provident funds or state-administered funds in other jurisdictions. South African funds are governed by the Pension Funds Act 1956, as amended. Other funds are governed by the respective legislation of the countries concerned. The contributions paid by the Group companies for retirement benefits are charged to profit or loss as they are incurred, and amounted to R111,0 million (2014: R99,4 million).
32.2 Share incentive schemes The interests of the directors are given on page 83 in the Directors’ Remuneration Report.
A summary of the movements in share incentive instruments is set out in the tables below:
The AVI Executive Share Incentive Scheme
Date of grant
Exercise price
per shareR
Instruments1 outstanding at 30 June 2014
numberGranted number
Exercised number
Relinquishednumber
Instruments1 outstanding at 30 June 2015
number
31 May 2005 12,62 2 882 – (2 882) – – 1 April 2011 29,38 346 290 – (32 422) – 313 868 1 October 2011 32,60 166 674 – (158 431) – 8 243 1 April 2012 45,49 682 876 – (170 580) (38 660) 473 636 1 October 2012 58,83 140 868 – – (4 308) 136 560 1 April 2013 55,88 564 309 – (17 009) (53 012) 494 288 1 October 2013 58,50 177 304 – – (10 324) 166 980 1 April 2014 53,38 909 395 – (48 639) (180 346) 680 410 1 October 2014 67,47 – 381 745 – (44 989) 336 756 1 April 2015 84,45 – 629 275 – – 629 275
2 990 598 1 011 020 (429 963) (331 639) 3 240 016 1 Includes options, immediate shares and any vested but unexercised rights.
The options are available to be exercised in their entirety in all cases three years after the effective date of granting of rights. Any options not exercised on the fifth anniversary of such date will lapse. Exercises in any period prior to vesting in the third year represent the portion allowed to be exercised on retirement, death, disability or retrenchment.
The AVI Financial Services Cash-Settled Share Appreciation Rights Plan
Date of grant
Exercise price
per shareR
Instruments outstanding at 30 June 2014
numberGranted number
Exercised number
Relinquishednumber
Instruments outstanding at 30 June 2015
number
October 2011 32,60 9 663 – – – 9 663
9 663 – – – 9 663
The above scheme is a cash-settled scheme in a subsidiary that is accounted for in terms of IFRS 2 – Share-Based Payment, since the share appreciation rights are directly linked to the AVI Limited share price. The rights are available to be exercised in their entirety in all cases three years after the grant date. Any rights not exercised on the fourth anniversary of such date will lapse.
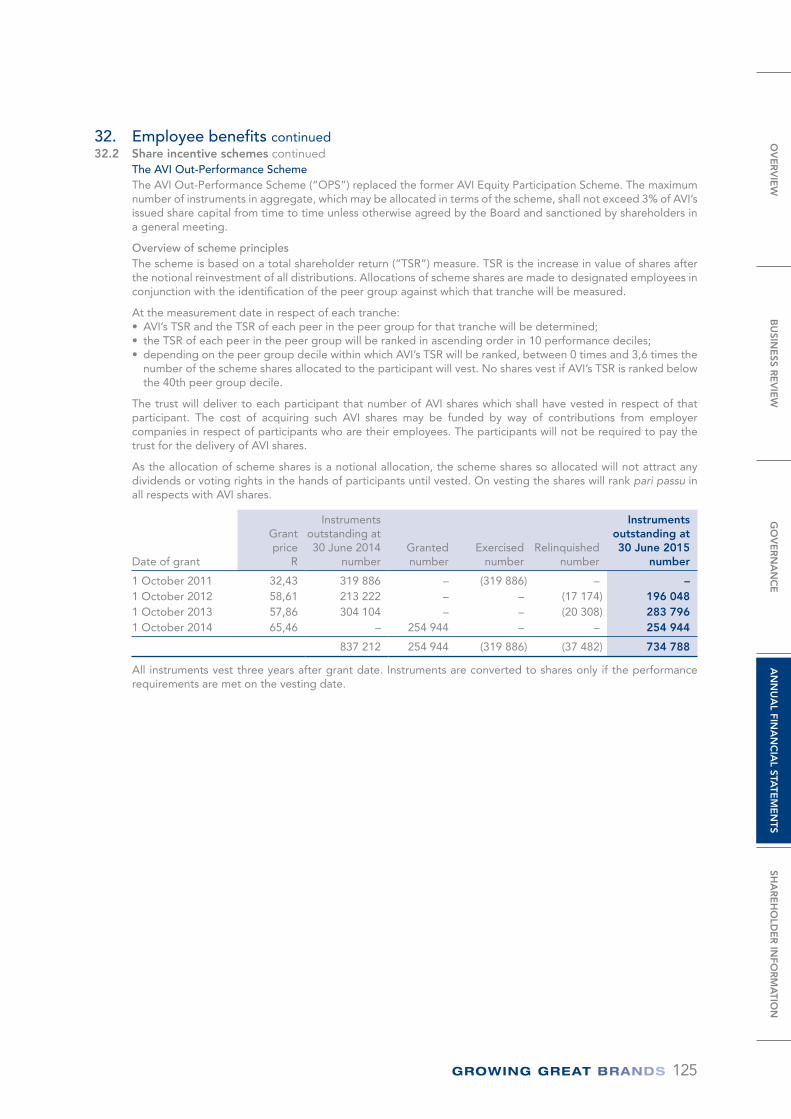
125
32. Employee benefits continued32.2 Share incentive schemes continued
The AVI Out-Performance Scheme The AVI Out-Performance Scheme (“OPS”) replaced the former AVI Equity Participation Scheme. The maximum number of instruments in aggregate, which may be allocated in terms of the scheme, shall not exceed 3% of AVI’s issued share capital from time to time unless otherwise agreed by the Board and sanctioned by shareholders in a general meeting.
Overview of scheme principles The scheme is based on a total shareholder return (“TSR”) measure. TSR is the increase in value of shares after the notional reinvestment of all distributions. Allocations of scheme shares are made to designated employees in conjunction with the identification of the peer group against which that tranche will be measured.
At the measurement date in respect of each tranche: • AVI’s TSR and the TSR of each peer in the peer group for that tranche will be determined;• the TSR of each peer in the peer group will be ranked in ascending order in 10 performance deciles; • depending on the peer group decile within which AVI’s TSR will be ranked, between 0 times and 3,6 times the
number of the scheme shares allocated to the participant will vest. No shares vest if AVI’s TSR is ranked below the 40th peer group decile.
The trust will deliver to each participant that number of AVI shares which shall have vested in respect of that participant. The cost of acquiring such AVI shares may be funded by way of contributions from employer companies in respect of participants who are their employees. The participants will not be required to pay the trust for the delivery of AVI shares.
As the allocation of scheme shares is a notional allocation, the scheme shares so allocated will not attract any dividends or voting rights in the hands of participants until vested. On vesting the shares will rank pari passu in all respects with AVI shares.
Date of grant
Grant price
R
Instruments outstanding at 30 June 2014
numberGranted number
Exercised number
Relinquishednumber
Instruments outstanding at 30 June 2015
number
1 October 2011 32,43 319 886 – (319 886) – – 1 October 2012 58,61 213 222 – – (17 174) 196 048 1 October 2013 57,86 304 104 – – (20 308) 283 796 1 October 2014 65,46 – 254 944 – – 254 944
837 212 254 944 (319 886) (37 482) 734 788
All instruments vest three years after grant date. Instruments are converted to shares only if the performance requirements are met on the vesting date.
OV
ER
VIE
WB
USIN
ESS R
EV
IEW
GO
VE
RN
AN
CE
AN
NU
AL FIN
AN
CIA
L STATE
ME
NTS
SHA
RE
HO
LDE
R IN
FOR
MA
TION
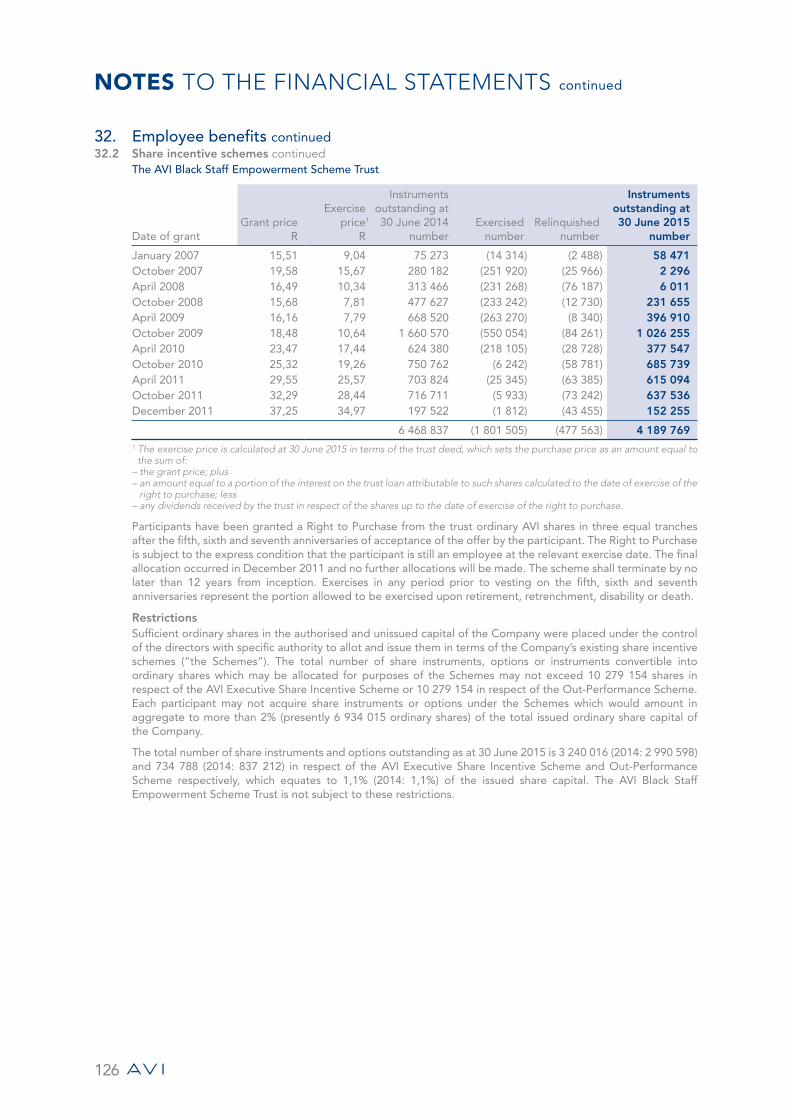
NOTES TO THE FINANCIAL STATEMENTS continued
126
32. Employee benefits continued 32.2 Share incentive schemes continued
The AVI Black Staff Empowerment Scheme Trust
Date of grantGrant price
R
Exercise price1
R
Instruments outstanding at 30 June 2014
numberExercised
numberRelinquished
number
Instruments outstanding at 30 June 2015
number
January 2007 15,51 9,04 75 273 (14 314) (2 488) 58 471 October 2007 19,58 15,67 280 182 (251 920) (25 966) 2 296 April 2008 16,49 10,34 313 466 (231 268) (76 187) 6 011 October 2008 15,68 7,81 477 627 (233 242) (12 730) 231 655 April 2009 16,16 7,79 668 520 (263 270) (8 340) 396 910 October 2009 18,48 10,64 1 660 570 (550 054) (84 261) 1 026 255 April 2010 23,47 17,44 624 380 (218 105) (28 728) 377 547 October 2010 25,32 19,26 750 762 (6 242) (58 781) 685 739 April 2011 29,55 25,57 703 824 (25 345) (63 385) 615 094 October 2011 32,29 28,44 716 711 (5 933) (73 242) 637 536 December 2011 37,25 34,97 197 522 (1 812) (43 455) 152 255
6 468 837 (1 801 505) (477 563) 4 189 769 1 The exercise price is calculated at 30 June 2015 in terms of the trust deed, which sets the purchase price as an amount equal to
the sum of:– the grant price; plus– an amount equal to a portion of the interest on the trust loan attributable to such shares calculated to the date of exercise of the
right to purchase; less– any dividends received by the trust in respect of the shares up to the date of exercise of the right to purchase.
Participants have been granted a Right to Purchase from the trust ordinary AVI shares in three equal tranches after the fifth, sixth and seventh anniversaries of acceptance of the offer by the participant. The Right to Purchase is subject to the express condition that the participant is still an employee at the relevant exercise date. The final allocation occurred in December 2011 and no further allocations will be made. The scheme shall terminate by no later than 12 years from inception. Exercises in any period prior to vesting on the fifth, sixth and seventh anniversaries represent the portion allowed to be exercised upon retirement, retrenchment, disability or death.
Restrictions Sufficient ordinary shares in the authorised and unissued capital of the Company were placed under the control of the directors with specific authority to allot and issue them in terms of the Company’s existing share incentive schemes (“the Schemes”). The total number of share instruments, options or instruments convertible into ordinary shares which may be allocated for purposes of the Schemes may not exceed 10 279 154 shares in respect of the AVI Executive Share Incentive Scheme or 10 279 154 in respect of the Out-Performance Scheme. Each participant may not acquire share instruments or options under the Schemes which would amount in aggregate to more than 2% (presently 6 934 015 ordinary shares) of the total issued ordinary share capital of the Company.
The total number of share instruments and options outstanding as at 30 June 2015 is 3 240 016 (2014: 2 990 598) and 734 788 (2014: 837 212) in respect of the AVI Executive Share Incentive Scheme and Out-Performance Scheme respectively, which equates to 1,1% (2014: 1,1%) of the issued share capital. The AVI Black Staff Empowerment Scheme Trust is not subject to these restrictions.
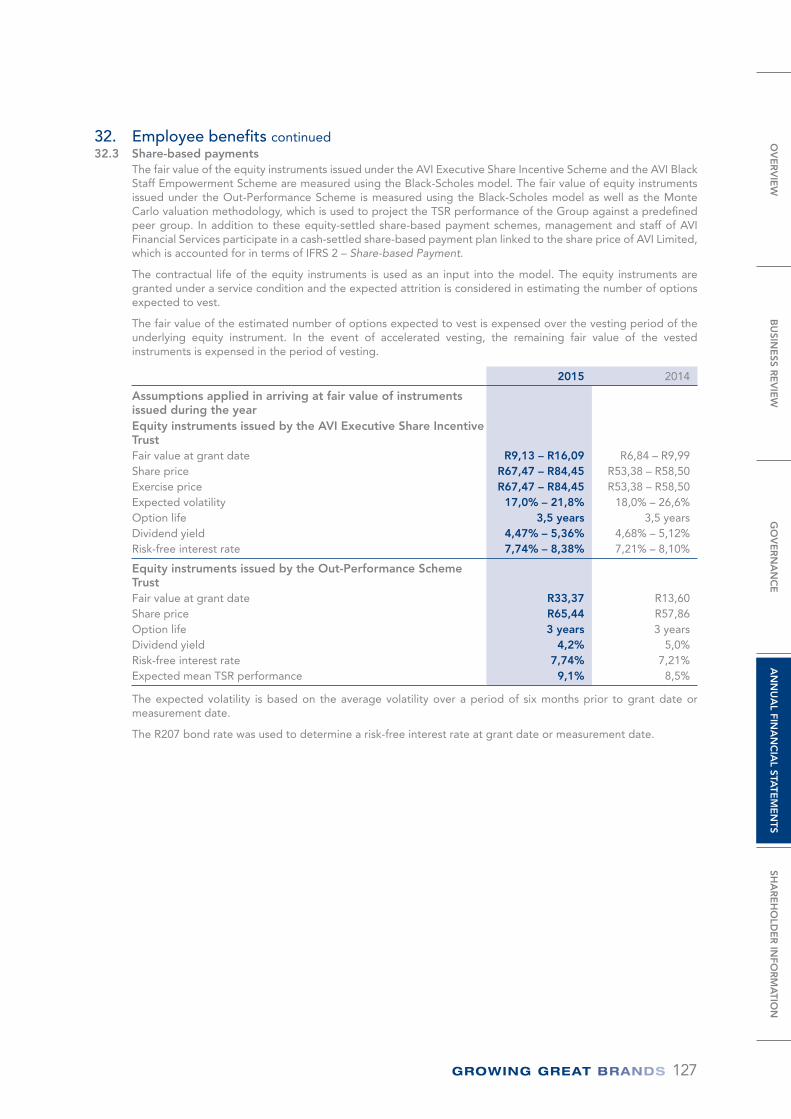
127
32. Employee benefits continued32.3 Share-based payments
The fair value of the equity instruments issued under the AVI Executive Share Incentive Scheme and the AVI Black Staff Empowerment Scheme are measured using the Black-Scholes model. The fair value of equity instruments issued under the Out-Performance Scheme is measured using the Black-Scholes model as well as the Monte Carlo valuation methodology, which is used to project the TSR performance of the Group against a predefined peer group. In addition to these equity-settled share-based payment schemes, management and staff of AVI Financial Services participate in a cash-settled share-based payment plan linked to the share price of AVI Limited, which is accounted for in terms of IFRS 2 – Share-based Payment.
The contractual life of the equity instruments is used as an input into the model. The equity instruments are granted under a service condition and the expected attrition is considered in estimating the number of options expected to vest.
The fair value of the estimated number of options expected to vest is expensed over the vesting period of the underlying equity instrument. In the event of accelerated vesting, the remaining fair value of the vested instruments is expensed in the period of vesting.
2015 2014
Assumptions applied in arriving at fair value of instruments issued during the year Equity instruments issued by the AVI Executive Share Incentive Trust Fair value at grant date R9,13 – R16,09 R6,84 – R9,99 Share price R67,47 – R84,45 R53,38 – R58,50 Exercise price R67,47 – R84,45 R53,38 – R58,50 Expected volatility 17,0% – 21,8% 18,0% – 26,6% Option life 3,5 years 3,5 years Dividend yield 4,47% – 5,36% 4,68% – 5,12% Risk-free interest rate 7,74% – 8,38% 7,21% – 8,10%
Equity instruments issued by the Out-Performance Scheme Trust Fair value at grant date R33,37 R13,60 Share price R65,44 R57,86 Option life 3 years 3 years Dividend yield 4,2% 5,0% Risk-free interest rate 7,74% 7,21% Expected mean TSR performance 9,1% 8,5%
The expected volatility is based on the average volatility over a period of six months prior to grant date or measurement date.
The R207 bond rate was used to determine a risk-free interest rate at grant date or measurement date.
OV
ER
VIE
WB
USIN
ESS R
EV
IEW
GO
VE
RN
AN
CE
AN
NU
AL FIN
AN
CIA
L STATE
ME
NTS
SHA
RE
HO
LDE
R IN
FOR
MA
TION
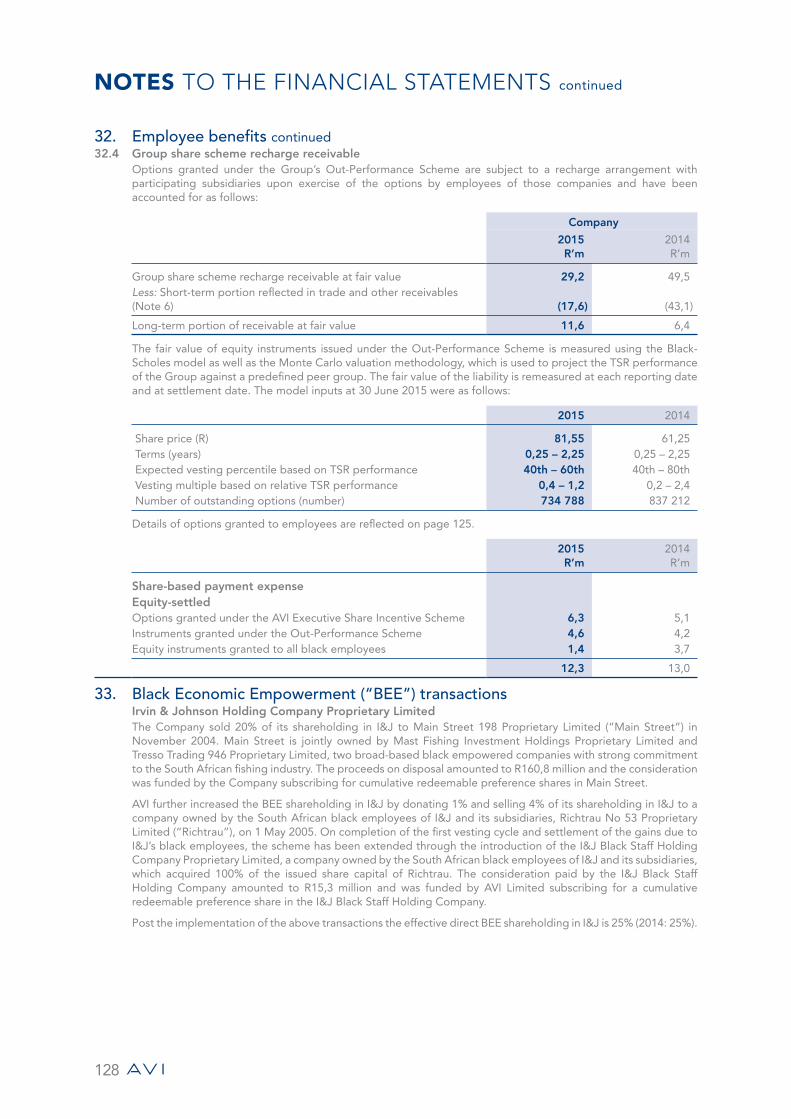
NOTES TO THE FINANCIAL STATEMENTS continued
128
32. Employee benefits continued32.4 Group share scheme recharge receivable
Options granted under the Group’s Out-Performance Scheme are subject to a recharge arrangement with participating subsidiaries upon exercise of the options by employees of those companies and have been accounted for as follows:
Company
2015R’m
2014R’m
Group share scheme recharge receivable at fair value 29,2 49,5 Less: Short-term portion reflected in trade and other receivables (Note 6) (17,6) (43,1)
Long-term portion of receivable at fair value 11,6 6,4
The fair value of equity instruments issued under the Out-Performance Scheme is measured using the Black-Scholes model as well as the Monte Carlo valuation methodology, which is used to project the TSR performance of the Group against a predefined peer group. The fair value of the liability is remeasured at each reporting date and at settlement date. The model inputs at 30 June 2015 were as follows:
2015 2014
Share price (R) 81,55 61,25 Terms (years) 0,25 – 2,25 0,25 – 2,25 Expected vesting percentile based on TSR performance 40th – 60th 40th – 80th Vesting multiple based on relative TSR performance 0,4 – 1,2 0,2 – 2,4 Number of outstanding options (number) 734 788 837 212
Details of options granted to employees are reflected on page 125.
2015R’m
2014R’m
Share-based payment expense Equity-settled Options granted under the AVI Executive Share Incentive Scheme 6,3 5,1 Instruments granted under the Out-Performance Scheme 4,6 4,2 Equity instruments granted to all black employees 1,4 3,7
12,3 13,0
33. Black Economic Empowerment (“BEE”) transactions Irvin & Johnson Holding Company Proprietary Limited The Company sold 20% of its shareholding in I&J to Main Street 198 Proprietary Limited (“Main Street”) in November 2004. Main Street is jointly owned by Mast Fishing Investment Holdings Proprietary Limited and Tresso Trading 946 Proprietary Limited, two broad-based black empowered companies with strong commitment to the South African fishing industry. The proceeds on disposal amounted to R160,8 million and the consideration was funded by the Company subscribing for cumulative redeemable preference shares in Main Street.
AVI further increased the BEE shareholding in I&J by donating 1% and selling 4% of its shareholding in I&J to a company owned by the South African black employees of I&J and its subsidiaries, Richtrau No 53 Proprietary Limited (“Richtrau”), on 1 May 2005. On completion of the first vesting cycle and settlement of the gains due to I&J’s black employees, the scheme has been extended through the introduction of the I&J Black Staff Holding Company Proprietary Limited, a company owned by the South African black employees of I&J and its subsidiaries, which acquired 100% of the issued share capital of Richtrau. The consideration paid by the I&J Black Staff Holding Company amounted to R15,3 million and was funded by AVI Limited subscribing for a cumulative redeemable preference share in the I&J Black Staff Holding Company.
Post the implementation of the above transactions the effective direct BEE shareholding in I&J is 25% (2014: 25%).
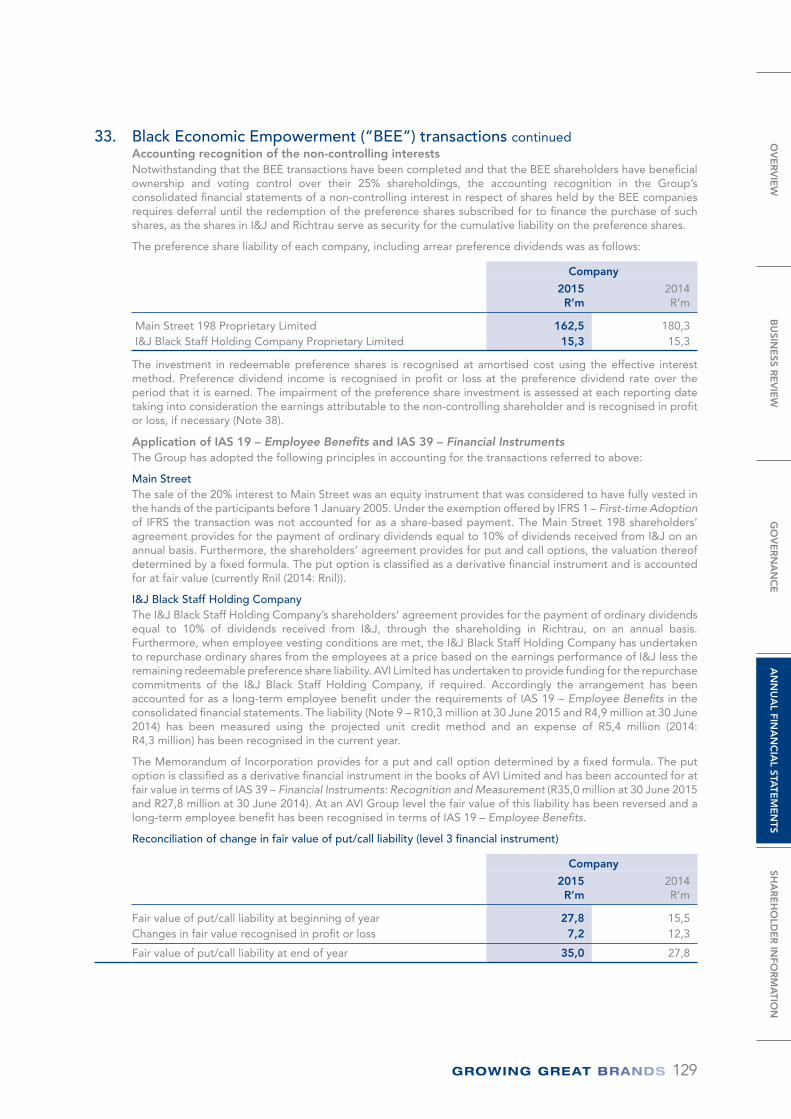
129
33. Black Economic Empowerment (“BEE”) transactions continuedAccounting recognition of the non-controlling interests Notwithstanding that the BEE transactions have been completed and that the BEE shareholders have beneficial ownership and voting control over their 25% shareholdings, the accounting recognition in the Group’s consolidated financial statements of a non-controlling interest in respect of shares held by the BEE companies requires deferral until the redemption of the preference shares subscribed for to finance the purchase of such shares, as the shares in I&J and Richtrau serve as security for the cumulative liability on the preference shares.
The preference share liability of each company, including arrear preference dividends was as follows:
Company
2015R’m
2014R’m
Main Street 198 Proprietary Limited 162,5 180,3 I&J Black Staff Holding Company Proprietary Limited 15,3 15,3
The investment in redeemable preference shares is recognised at amortised cost using the effective interest method. Preference dividend income is recognised in profit or loss at the preference dividend rate over the period that it is earned. The impairment of the preference share investment is assessed at each reporting date taking into consideration the earnings attributable to the non-controlling shareholder and is recognised in profit or loss, if necessary (Note 38).
Application of IAS 19 – Employee Benefits and IAS 39 – Financial Instruments The Group has adopted the following principles in accounting for the transactions referred to above:
Main StreetThe sale of the 20% interest to Main Street was an equity instrument that was considered to have fully vested in the hands of the participants before 1 January 2005. Under the exemption offered by IFRS 1 – First-time Adoption of IFRS the transaction was not accounted for as a share-based payment. The Main Street 198 shareholders’ agreement provides for the payment of ordinary dividends equal to 10% of dividends received from I&J on an annual basis. Furthermore, the shareholders’ agreement provides for put and call options, the valuation thereof determined by a fixed formula. The put option is classified as a derivative financial instrument and is accounted for at fair value (currently Rnil (2014: Rnil)).
I&J Black Staff Holding CompanyThe I&J Black Staff Holding Company’s shareholders’ agreement provides for the payment of ordinary dividends equal to 10% of dividends received from I&J, through the shareholding in Richtrau, on an annual basis. Furthermore, when employee vesting conditions are met, the I&J Black Staff Holding Company has undertaken to repurchase ordinary shares from the employees at a price based on the earnings performance of I&J less the remaining redeemable preference share liability. AVI Limited has undertaken to provide funding for the repurchase commitments of the I&J Black Staff Holding Company, if required. Accordingly the arrangement has been accounted for as a long-term employee benefit under the requirements of IAS 19 – Employee Benefits in the consolidated financial statements. The liability (Note 9 – R10,3 million at 30 June 2015 and R4,9 million at 30 June 2014) has been measured using the projected unit credit method and an expense of R5,4 million (2014: R4,3 million) has been recognised in the current year.
The Memorandum of Incorporation provides for a put and call option determined by a fixed formula. The put option is classified as a derivative financial instrument in the books of AVI Limited and has been accounted for at fair value in terms of IAS 39 – Financial Instruments: Recognition and Measurement (R35,0 million at 30 June 2015 and R27,8 million at 30 June 2014). At an AVI Group level the fair value of this liability has been reversed and a long-term employee benefit has been recognised in terms of IAS 19 – Employee Benefits.
Reconciliation of change in fair value of put/call liability (level 3 financial instrument)
Company
2015R’m
2014R’m
Fair value of put/call liability at beginning of year 27,8 15,5 Changes in fair value recognised in profit or loss 7,2 12,3
Fair value of put/call liability at end of year 35,0 27,8
OV
ER
VIE
WB
USIN
ESS R
EV
IEW
GO
VE
RN
AN
CE
AN
NU
AL FIN
AN
CIA
L STATE
ME
NTS
SHA
RE
HO
LDE
R IN
FOR
MA
TION
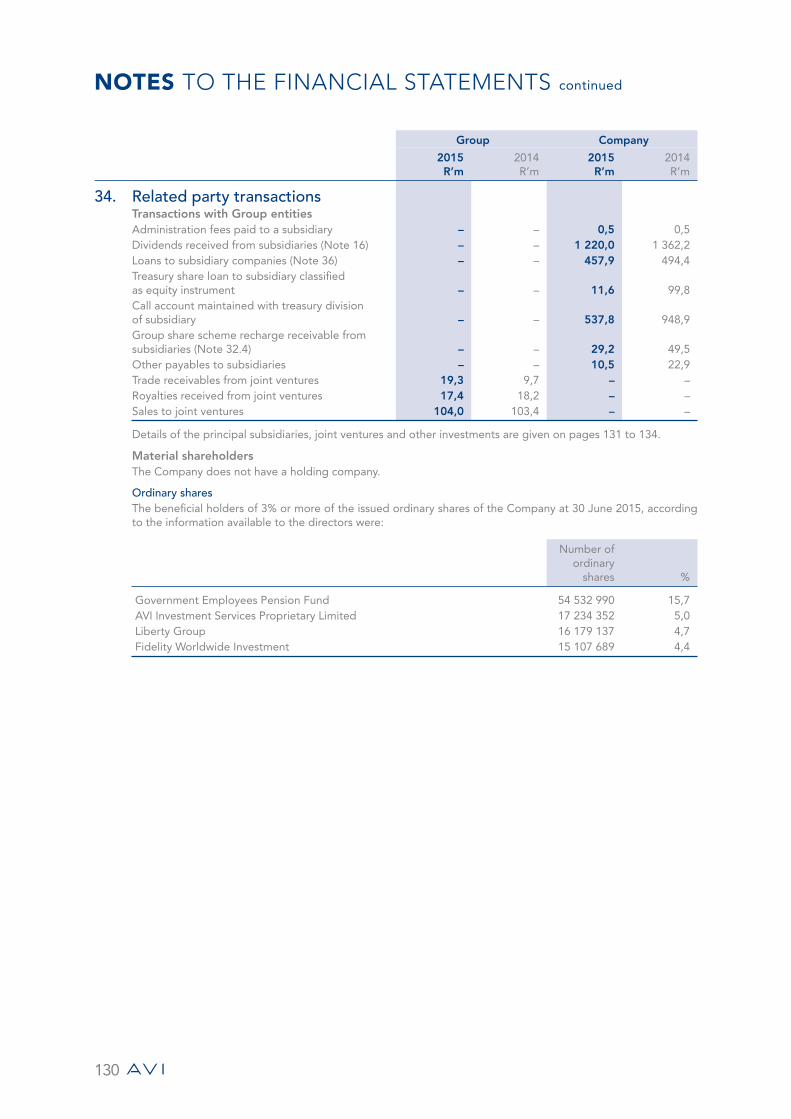
NOTES TO THE FINANCIAL STATEMENTS continued
130
Group Company
2015R’m
2014R’m
2015R’m
2014R’m
34. Related party transactions Transactions with Group entities Administration fees paid to a subsidiary – – 0,5 0,5 Dividends received from subsidiaries (Note 16) – – 1 220,0 1 362,2 Loans to subsidiary companies (Note 36) – – 457,9 494,4 Treasury share loan to subsidiary classified as equity instrument – – 11,6 99,8 Call account maintained with treasury division of subsidiary – – 537,8 948,9 Group share scheme recharge receivable from subsidiaries (Note 32.4) – – 29,2 49,5 Other payables to subsidiaries – – 10,5 22,9 Trade receivables from joint ventures 19,3 9,7 – – Royalties received from joint ventures 17,4 18,2 – – Sales to joint ventures 104,0 103,4 – –
Details of the principal subsidiaries, joint ventures and other investments are given on pages 131 to 134.
Material shareholdersThe Company does not have a holding company.
Ordinary sharesThe beneficial holders of 3% or more of the issued ordinary shares of the Company at 30 June 2015, according to the information available to the directors were:
Number of ordinary
shares %
Government Employees Pension Fund 54 532 990 15,7 AVI Investment Services Proprietary Limited 17 234 352 5,0 Liberty Group 16 179 137 4,7 Fidelity Worldwide Investment 15 107 689 4,4
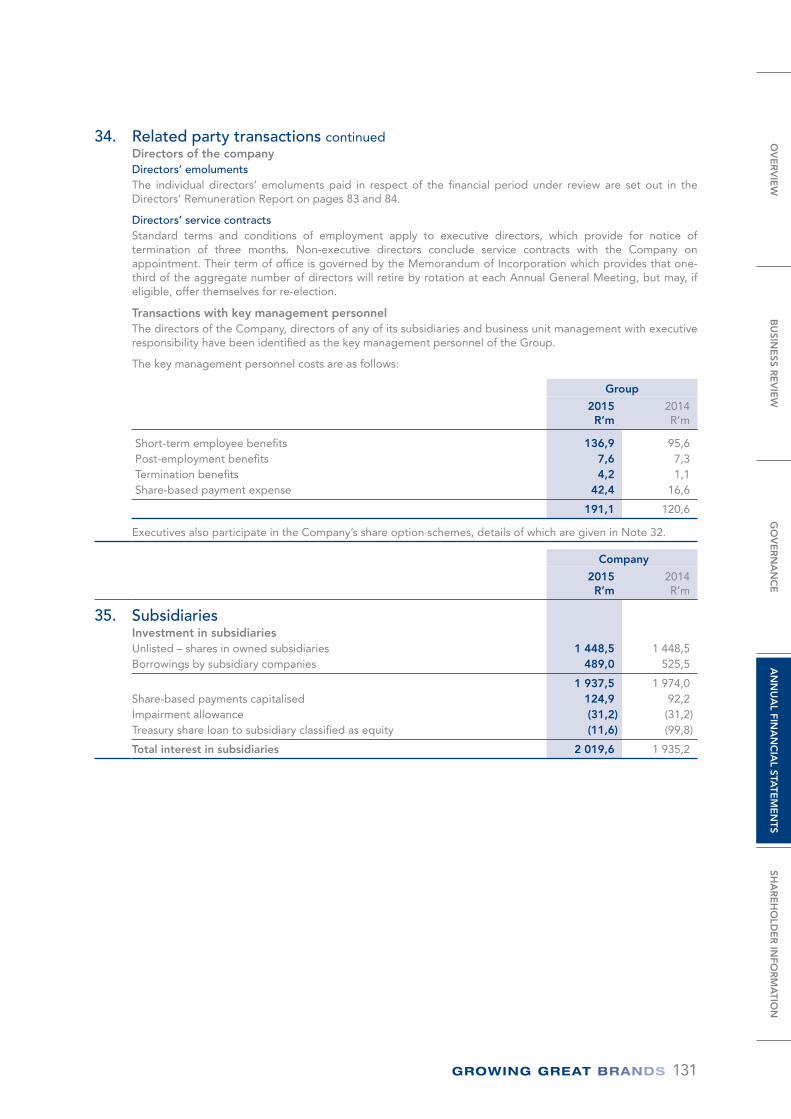
131
34. Related party transactions continuedDirectors of the companyDirectors’ emolumentsThe individual directors’ emoluments paid in respect of the financial period under review are set out in the Directors’ Remuneration Report on pages 83 and 84.
Directors’ service contractsStandard terms and conditions of employment apply to executive directors, which provide for notice of termination of three months. Non-executive directors conclude service contracts with the Company on appointment. Their term of office is governed by the Memorandum of Incorporation which provides that one-third of the aggregate number of directors will retire by rotation at each Annual General Meeting, but may, if eligible, offer themselves for re-election.
Transactions with key management personnelThe directors of the Company, directors of any of its subsidiaries and business unit management with executive responsibility have been identified as the key management personnel of the Group.
The key management personnel costs are as follows:
Group
2015R’m
2014R’m
Short-term employee benefits 136,9 95,6 Post-employment benefits 7,6 7,3 Termination benefits 4,2 1,1 Share-based payment expense 42,4 16,6
191,1 120,6
Executives also participate in the Company’s share option schemes, details of which are given in Note 32.
Company
2015R’m
2014R’m
35. Subsidiaries Investment in subsidiaries Unlisted – shares in owned subsidiaries 1 448,5 1 448,5 Borrowings by subsidiary companies 489,0 525,5
1 937,5 1 974,0 Share-based payments capitalised 124,9 92,2 Impairment allowance (31,2) (31,2)Treasury share loan to subsidiary classified as equity (11,6) (99,8)
Total interest in subsidiaries 2 019,6 1 935,2
OV
ER
VIE
WB
USIN
ESS R
EV
IEW
GO
VE
RN
AN
CE
AN
NU
AL FIN
AN
CIA
L STATE
ME
NTS
SHA
RE
HO
LDE
R IN
FOR
MA
TION
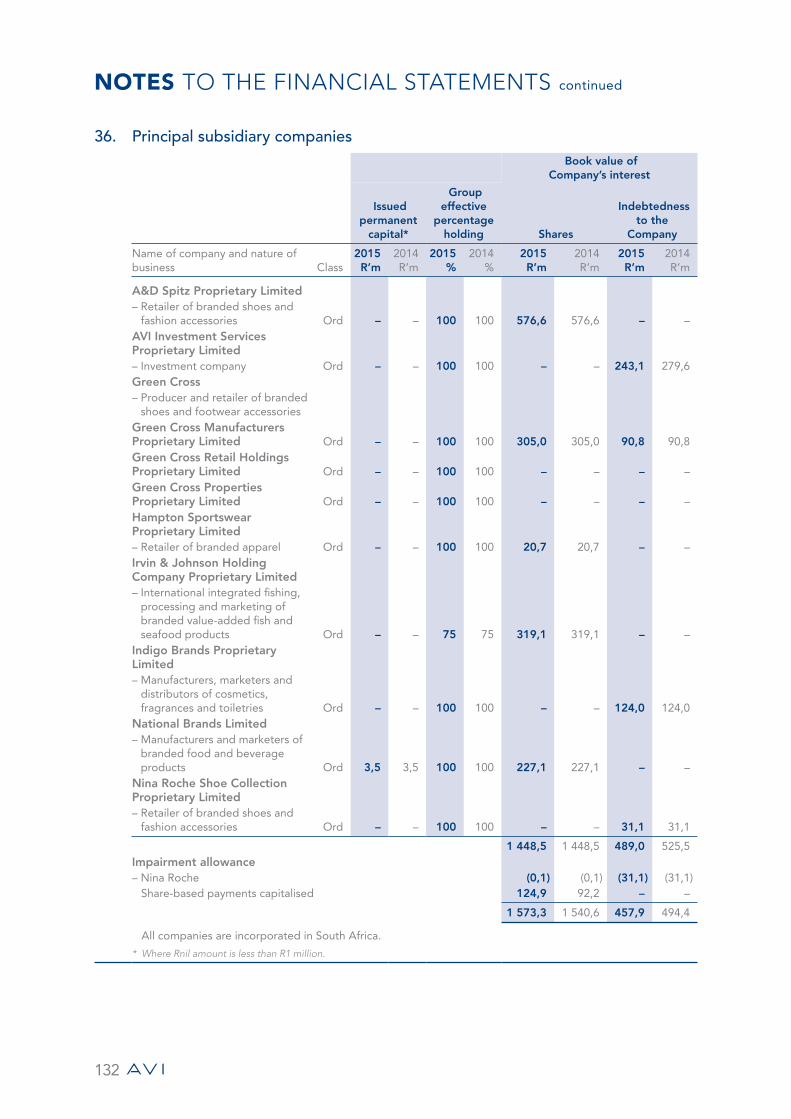
NOTES TO THE FINANCIAL STATEMENTS continued
132
36. Principal subsidiary companies Book value of
Company’s interest
Issued permanent
capital*
Group effective
percentage holding Shares
Indebtedness to the
Company
Name of company and nature of business Class
2015R’m
2014R’m
2015%
2014%
2015R’m
2014R’m
2015R’m
2014R’m
A&D Spitz Proprietary Limited – Retailer of branded shoes and
fashion accessories Ord – – 100 100 576,6 576,6 – – AVI Investment Services Proprietary Limited – Investment company Ord – – 100 100 – – 243,1 279,6 Green Cross – Producer and retailer of branded
shoes and footwear accessories Green Cross Manufacturers Proprietary Limited Ord – – 100 100 305,0 305,0 90,8 90,8 Green Cross Retail Holdings Proprietary Limited Ord – – 100 100 – – – – Green Cross Properties Proprietary Limited Ord – – 100 100 – – – – Hampton Sportswear Proprietary Limited – R etailer of branded apparel Ord – – 100 100 20,7 20,7 – – Irvin & Johnson Holding Company Proprietary Limited – International integrated fishing,
processing and marketing of branded value-added fish and seafood products Ord – – 75 75 319,1 319,1 – –
Indigo Brands Proprietary Limited – Manufacturers, marketers and
distributors of cosmetics, fragrances and toiletries Ord – – 100 100 – – 124,0 124,0
National Brands Limited – Manufacturers and marketers of
branded food and beverage products Ord 3,5 3,5 100 100 227,1 227,1 – –
Nina Roche Shoe Collection Proprietary Limited – Retailer of branded shoes and
fashion accessories Ord – – 100 100 – – 31,1 31,1
1 448,5 1 448,5 489,0 525,5 Impairment allowance – Nina Roche (0,1) (0,1) (31,1) (31,1)
Share-based payments capitalised 124,9 92,2 – –
1 573,3 1 540,6 457,9 494,4
All companies are incorporated in South Africa.
* Where Rnil amount is less than R1 million.
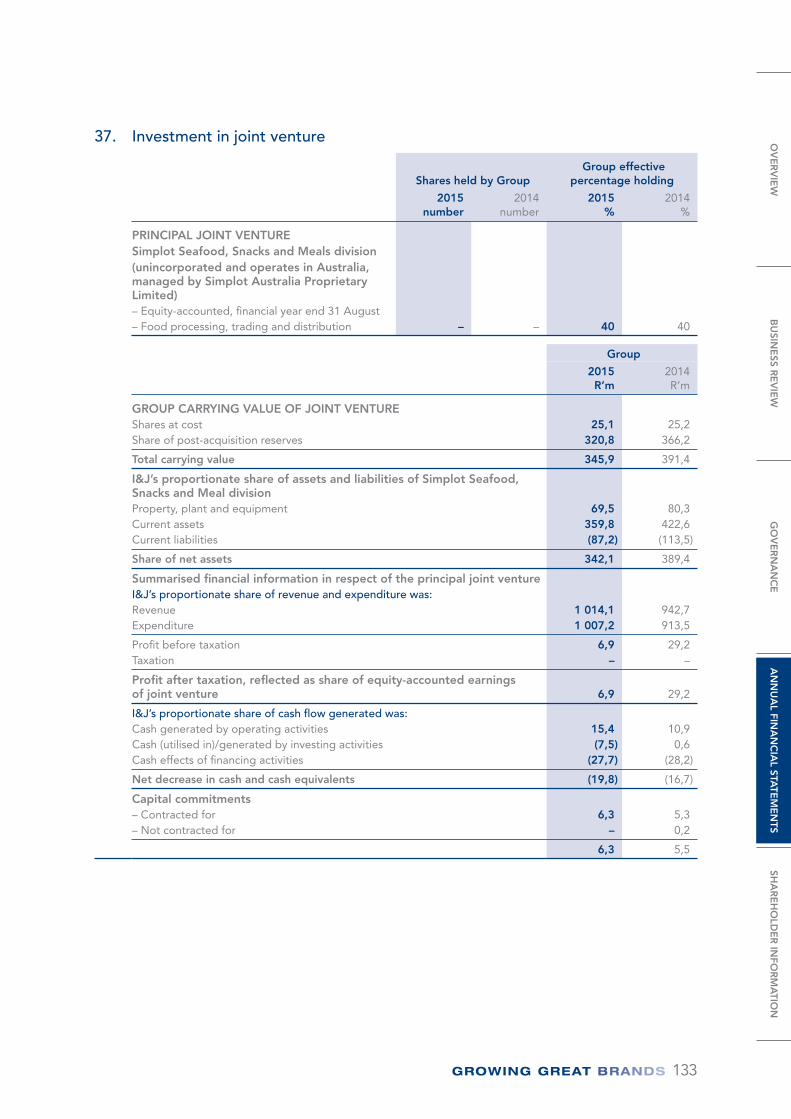
133
37. Investment in joint venture
Shares held by Group Group effective
percentage holding
2015number
2014number
2015%
2014%
PRINCIPAL JOINT VENTURE Simplot Seafood, Snacks and Meals division (unincorporated and operates in Australia, managed by Simplot Australia Proprietary Limited) – Equity-accounted, financial year end 31 August – Food processing, trading and distribution – – 40 40
Group
2015R’m
2014R’m
GROUP CARRYING VALUE OF JOINT VENTURE Shares at cost 25,1 25,2 Share of post-acquisition reserves 320,8 366,2
Total carrying value 345,9 391,4
I&J’s proportionate share of assets and liabilities of Simplot Seafood, Snacks and Meal division Property, plant and equipment 69,5 80,3 Current assets 359,8 422,6 Current liabilities (87,2) (113,5)
Share of net assets 342,1 389,4
Summarised financial information in respect of the principal joint venture I&J’s proportionate share of revenue and expenditure was: Revenue 1 014,1 942,7 Expenditure 1 007,2 913,5
Profit before taxation 6,9 29,2 Taxation – –
Profit after taxation, reflected as share of equity-accounted earnings of joint venture 6,9 29,2
I&J’s proportionate share of cash flow generated was: Cash generated by operating activities 15,4 10,9 Cash (utilised in)/generated by investing activities (7,5) 0,6 Cash effects of financing activities (27,7) (28,2)
Net decrease in cash and cash equivalents (19,8) (16,7)
Capital commitments – Contracted for 6,3 5,3 – Not contracted for – 0,2
6,3 5,5
OV
ER
VIE
WB
USIN
ESS R
EV
IEW
GO
VE
RN
AN
CE
AN
NU
AL FIN
AN
CIA
L STATE
ME
NTS
SHA
RE
HO
LDE
R IN
FOR
MA
TION
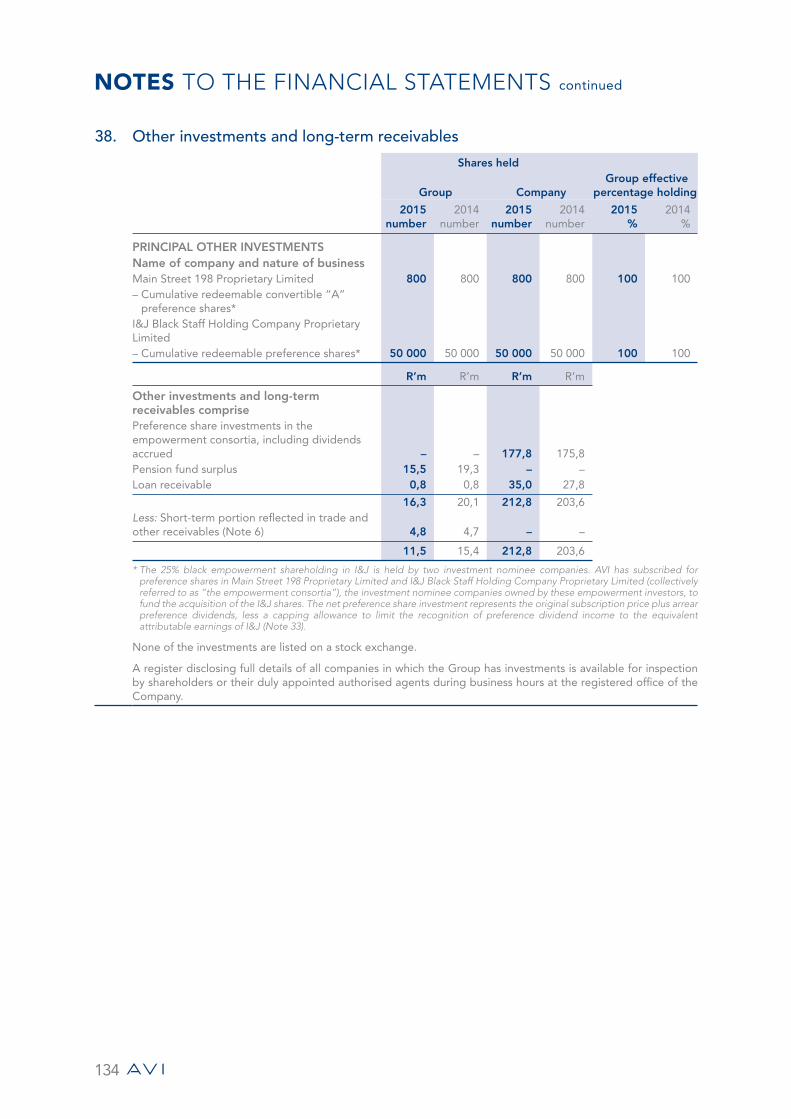
NOTES TO THE FINANCIAL STATEMENTS continued
134
38. Other investments and long-term receivables
Shares held
Group Company Group effective
percentage holding
2015number
2014number
2015number
2014number
2015%
2014%
PRINCIPAL OTHER INVESTMENTS Name of company and nature of business Main Street 198 Proprietary Limited 800 800 800 800 100 100 – Cumulative redeemable convertible “A”
preference shares* I&J Black Staff Holding Company Proprietary Limited – Cumulative redeemable preference shares* 50 000 50 000 50 000 50 000 100 100
R’m R’m R’m R’m
Other investments and long-term receivables comprise Preference share investments in the empowerment consortia, including dividends accrued – – 177,8 175,8 Pension fund surplus 15,5 19,3 – – Loan receivable 0,8 0,8 35,0 27,8
16,3 20,1 212,8 203,6 Less: Short-term portion reflected in trade and other receivables (Note 6) 4,8 4,7 – –
11,5 15,4 212,8 203,6
* The 25% black empowerment shareholding in I&J is held by two investment nominee companies. AVI has subscribed for preference shares in Main Street 198 Proprietary Limited and I&J Black Staff Holding Company Proprietary Limited (collectively referred to as “the empowerment consortia”), the investment nominee companies owned by these empowerment investors, to fund the acquisition of the I&J shares. The net preference share investment represents the original subscription price plus arrear preference dividends, less a capping allowance to limit the recognition of preference dividend income to the equivalent attributable earnings of I&J (Note 33).
None of the investments are listed on a stock exchange.
A register disclosing full details of all companies in which the Group has investments is available for inspection by shareholders or their duly appointed authorised agents during business hours at the registered office of the Company.

135
39. Financial risk management 39.1 Overview
The Group has exposure to the following risks from its use of financial instruments:• Credit risk • Liquidity risk• Market risk
This note presents information about the Group’s exposure to each of the above risks, the Group’s objectives, policies and processes for measuring and managing financial risk, and the Group’s management of capital. Further quantitative disclosures are included throughout these financial statements.
The Board of directors has overall responsibility for the establishment and oversight of the Group’s financial risk management framework. The AVI Group Treasury, together with the relevant business unit executives, is responsible for developing the relevant financial risk management policies and for monitoring risk.
The Group’s financial risk management policies are established to identify and analyse the risks faced by the Group, to set appropriate risk limits and controls, and to monitor risks and adherence to limits. Risk management policies and systems are reviewed regularly to reflect changes in market conditions and the Group’s activities. The Group aims to maintain a disciplined and constructive control environment in which all employees understand their roles and obligations.
The Group Audit Committee oversees management’s monitoring of compliance with the Group’s risk management policies and procedures and reviews the adequacy of the risk management framework in relation to the financial risks faced by the Group. The Group Audit Committee is assisted in its oversight role by internal audit. Internal audit undertakes both regular and ad hoc reviews of risk management controls and procedures, the results of which are reported to the Group Audit Committee.
39.2 Capital managementThe Board’s policy is to maintain a strong capital base so as to maintain investor, creditor and market confidence and to sustain future development of the business. The Board of directors monitors the return on average capital employed, which the Group defines as operating profit before capital items from continuing operations, after taxation, divided by average total shareholders’ equity plus net debt.
The Board seeks to maintain a balance between the higher returns that might be possible with higher levels of borrowings and the advantages and security afforded by a sound capital position. The Group’s target, which is determined by the AVI Board, is to achieve a return on average capital employed at 120% of the weighted average cost of capital, which was estimated at 10,8% (2014: 11,7%). In 2015 the return was 28,3% (2014: 27,6%). In comparison, the weighted average interest expense on interest-bearing borrowings (excluding liabilities with imputed interest) was 7,50% (2014: 6,99%).
From time to time the Group purchases its own shares in the market under general authority granted by shareholders; the timing of these purchases depends on market prices. Primarily the shares are part of a programme to return capital to shareholders, but some may be used for issuing shares under the Group’s share option programmes. Buying decisions are made under specific mandates from the executive directors.
There were no changes in the Group’s approach to capital management during the year.
The AVI Group is subject to and complies with the following capital reporting covenants required by some of the Group’s bankers: • Consolidated net debt to EBITDA less than 3,0• Consolidated EBITDA to net finance costs greater than 2,5.
Internal debt limits used by executive management on a day-to-day basis are more conservative than the above.
OV
ER
VIE
WB
USIN
ESS R
EV
IEW
GO
VE
RN
AN
CE
AN
NU
AL FIN
AN
CIA
L STATE
ME
NTS
SHA
RE
HO
LDE
R IN
FOR
MA
TION
NOTES TO THE FINANCIAL STATEMENTS continued
136
39. Financial risk management continued39.3 Credit risk
Credit risk is the risk of financial loss to the Group if a customer or counterparty to a financial instrument fails to meet its contractual obligations, and arises principally from the Group’s receivables from customers, cash and cash equivalents and loan receivables and other investments.
Trade and other receivablesThe Group’s exposure to credit risk is influenced mainly by the individual characteristics of each customer. Geographically there is concentration of credit risk in the South African market.
The Group has established a credit policy under which each new customer is analysed individually for creditworthiness before payment and delivery terms and conditions are offered. The Group’s review includes external ratings, when available, and in some cases bank references. Purchase limits are established for each customer, which represent the maximum open amount; these limits are reviewed annually or when conditions arise that warrant a review. Customers that fail to meet the Group’s benchmark creditworthiness may transact with the Group only on a prepayment basis.
Most of the Group’s customers have been transacting with the Group for over three years, and losses have occurred infrequently. In monitoring customer credit risk, customers are grouped according to their credit characteristics, including whether they are an individual or legal entity, whether they are a wholesale, retail or end-user customer, geographic location, industry, ageing profile, maturity and existence of previous financial difficulties. Trade and other receivables relate mainly to the Group’s retail and wholesale customers. Customers that are graded as “high risk” are placed on a restricted customer list, and future sales are made on a prepayment basis. Overdue accounts are put on hold until payments are received to return them to within limits.
Most goods sold are subject to retention of title clauses, so that in the event of non-payment the Group may have a secured claim. The Group does not require collateral in respect of trade and other receivables.
The Group establishes an allowance for impairment that represents its estimate of incurred losses in respect of trade and other receivables. The main components of this allowance are a specific loss component that relates to individually significant exposures, and a collective loss component established for groups of similar assets in respect of losses that have been incurred but not yet identified. The collective loss allowance is determined based on historical data of payment statistics for similar financial assets.
Cash and cash equivalents, loan receivables and other investmentsThe majority of the Group’s investments are in liquid securities with counterparties that have sound credit ratings. Where considered necessary, security is sought. Management does not expect any counterparty to fail to meet its obligations.
GuaranteesThe Company’s policy is to provide limited financial guarantees in respect of banking facilities for wholly owned subsidiaries. At 30 June 2015 guarantees were in place for AVI Financial Services Proprietary Limited, National Brands Limited, A&D Spitz Proprietary Limited and Green Cross Manufacturers Proprietary Limited. (2014: AVI Financial Services Proprietary Limited, National Brands Limited, A&D Spitz Proprietary Limited, Green Cross Manufacturers Proprietary Limited and Green Cross Retail Holdings Proprietary Limited.)
In addition, the Group provides limited sureties for outstanding debt under the cash management agreement for Group subsidiary companies that participate in the Group’s cash management agreement.
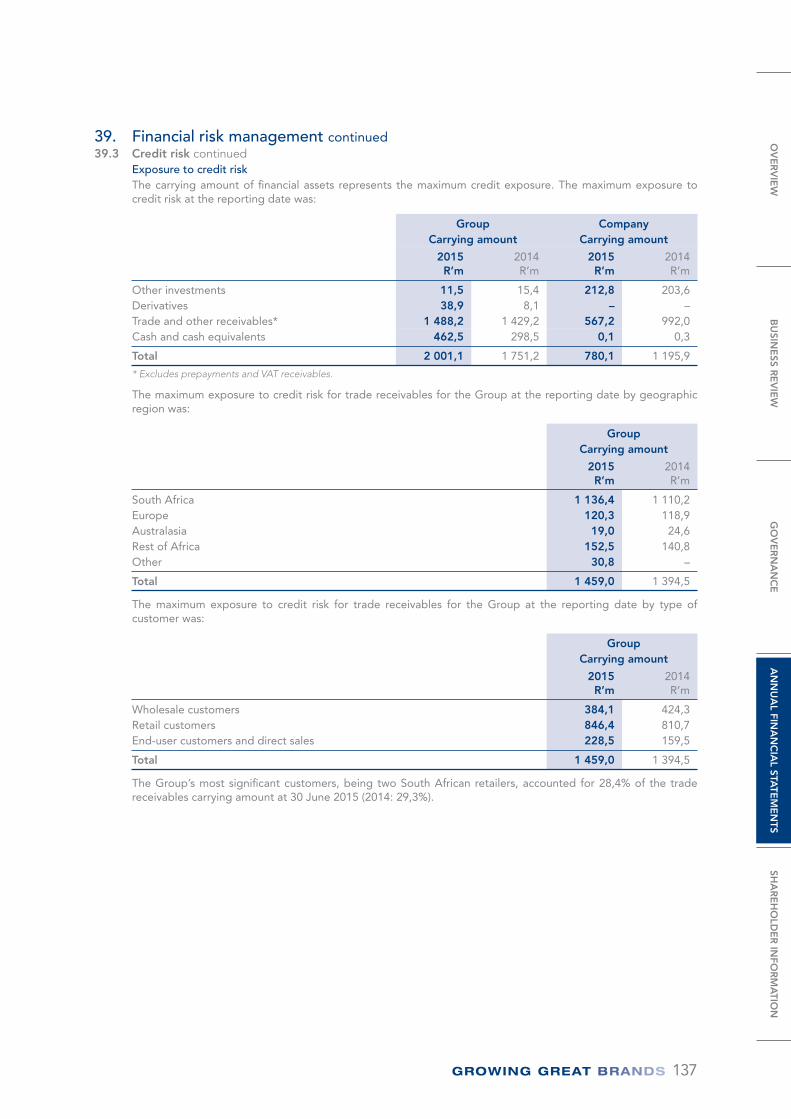
137
39. Financial risk management continued39.3 Credit risk continued
Exposure to credit riskThe carrying amount of financial assets represents the maximum credit exposure. The maximum exposure to credit risk at the reporting date was:
Group Company Carrying amount Carrying amount
2015R’m
2014R’m
2015R’m
2014R’m
Other investments 11,5 15,4 212,8 203,6 Derivatives 38,9 8,1 – – Trade and other receivables* 1 488,2 1 429,2 567,2 992,0 Cash and cash equivalents 462,5 298,5 0,1 0,3
Total 2 001,1 1 751,2 780,1 1 195,9
* Excludes prepayments and VAT receivables.
The maximum exposure to credit risk for trade receivables for the Group at the reporting date by geographic region was:
Group Carrying amount
2015R’m
2014R’m
South Africa 1 136,4 1 110,2 Europe 120,3 118,9 Australasia 19,0 24,6 Rest of Africa 152,5 140,8 Other 30,8 –
Total 1 459,0 1 394,5
The maximum exposure to credit risk for trade receivables for the Group at the reporting date by type of customer was:
Group Carrying amount
2015R’m
2014R’m
Wholesale customers 384,1 424,3 Retail customers 846,4 810,7 End-user customers and direct sales 228,5 159,5
Total 1 459,0 1 394,5
The Group’s most significant customers, being two South African retailers, accounted for 28,4% of the trade receivables carrying amount at 30 June 2015 (2014: 29,3%).
OV
ER
VIE
WB
USIN
ESS R
EV
IEW
GO
VE
RN
AN
CE
AN
NU
AL FIN
AN
CIA
L STATE
ME
NTS
SHA
RE
HO
LDE
R IN
FOR
MA
TION
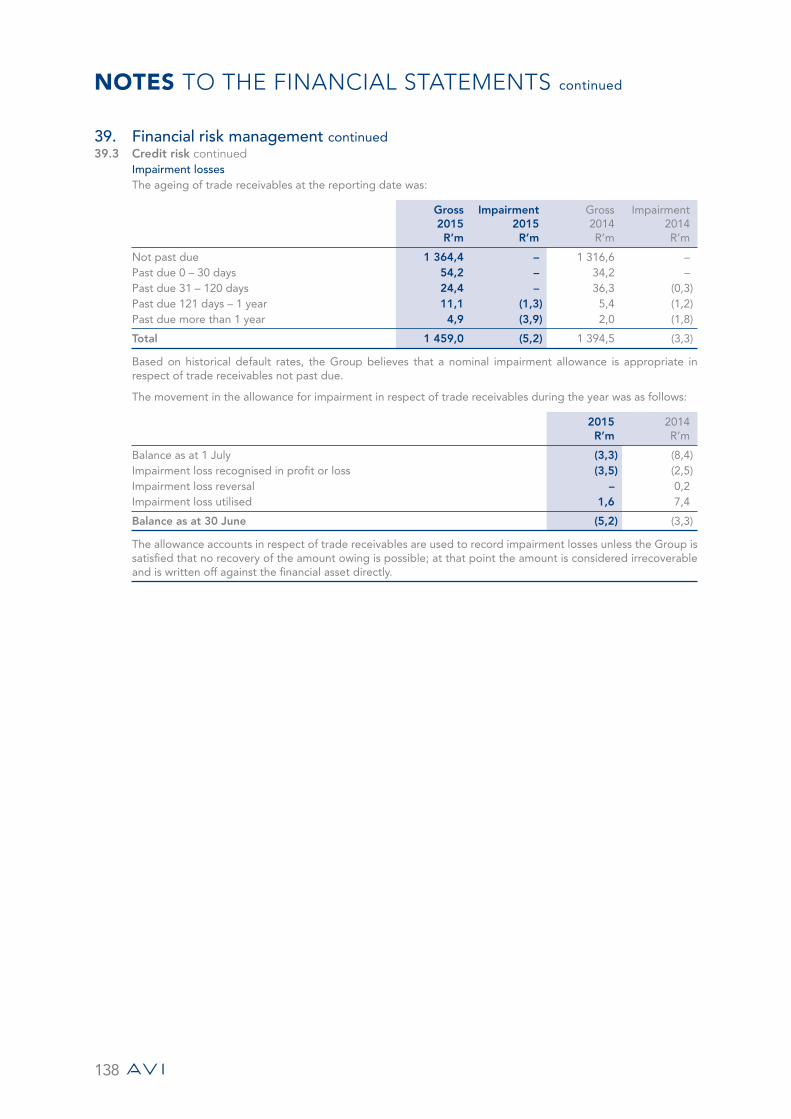
NOTES TO THE FINANCIAL STATEMENTS continued
138
39. Financial risk management continued39.3 Credit risk continued
Impairment lossesThe ageing of trade receivables at the reporting date was:
Gross 2015R’m
Impairment 2015R’m
Gross 2014R’m
Impairment 2014R’m
Not past due 1 364,4 – 1 316,6 – Past due 0 – 30 days 54,2 – 34,2 – Past due 31 – 120 days 24,4 – 36,3 (0,3)Past due 121 days – 1 year 11,1 (1,3) 5,4 (1,2)Past due more than 1 year 4,9 (3,9) 2,0 (1,8)
Total 1 459,0 (5,2) 1 394,5 (3,3)
Based on historical default rates, the Group believes that a nominal impairment allowance is appropriate in respect of trade receivables not past due.
The movement in the allowance for impairment in respect of trade receivables during the year was as follows:
2015R’m
2014R’m
Balance as at 1 July (3,3) (8,4)Impairment loss recognised in profit or loss (3,5) (2,5)Impairment loss reversal – 0,2 Impairment loss utilised 1,6 7,4
Balance as at 30 June (5,2) (3,3)
The allowance accounts in respect of trade receivables are used to record impairment losses unless the Group is satisfied that no recovery of the amount owing is possible; at that point the amount is considered irrecoverable and is written off against the financial asset directly.
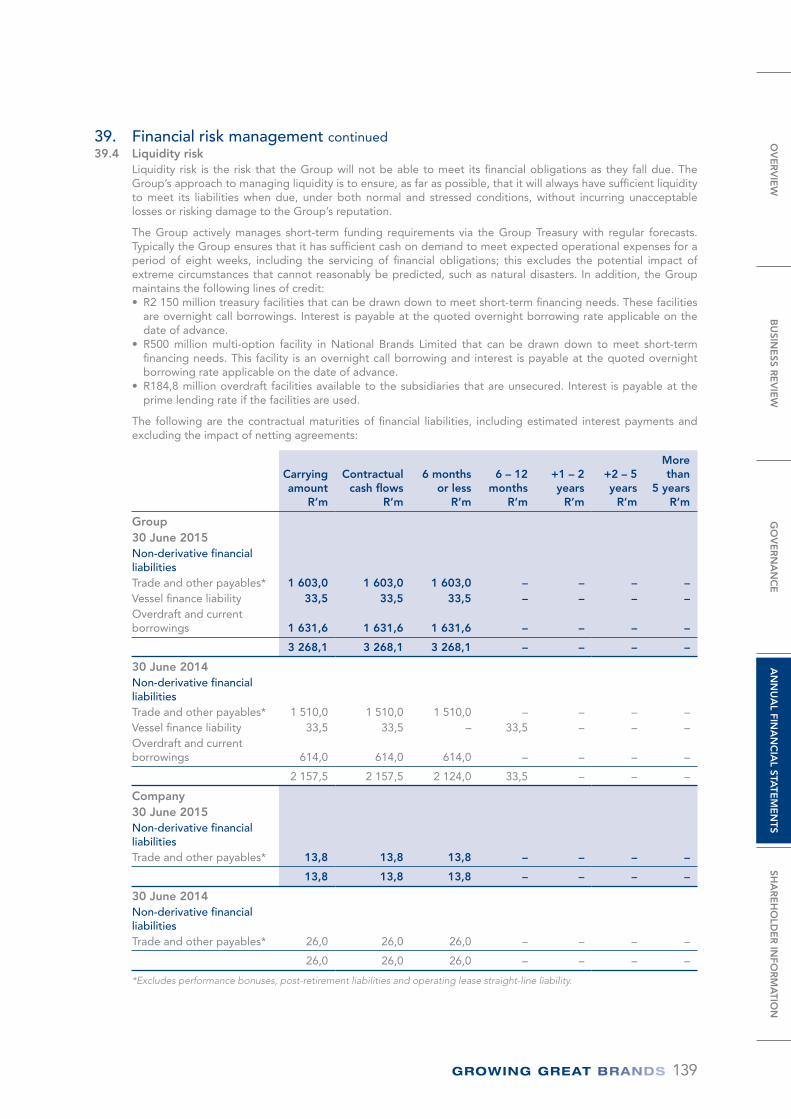
139
39. Financial risk management continued39.4 Liquidity risk
Liquidity risk is the risk that the Group will not be able to meet its financial obligations as they fall due. The Group’s approach to managing liquidity is to ensure, as far as possible, that it will always have sufficient liquidity to meet its liabilities when due, under both normal and stressed conditions, without incurring unacceptable losses or risking damage to the Group’s reputation.
The Group actively manages short-term funding requirements via the Group Treasury with regular forecasts. Typically the Group ensures that it has sufficient cash on demand to meet expected operational expenses for a period of eight weeks, including the servicing of financial obligations; this excludes the potential impact of extreme circumstances that cannot reasonably be predicted, such as natural disasters. In addition, the Group maintains the following lines of credit: • R2 150 million treasury facilities that can be drawn down to meet short-term financing needs. These facilities
are overnight call borrowings. Interest is payable at the quoted overnight borrowing rate applicable on the date of advance.
• R500 million multi-option facility in National Brands Limited that can be drawn down to meet short-term financing needs. This facility is an overnight call borrowing and interest is payable at the quoted overnight borrowing rate applicable on the date of advance.
• R184,8 million overdraft facilities available to the subsidiaries that are unsecured. Interest is payable at the prime lending rate if the facilities are used.
The following are the contractual maturities of financial liabilities, including estimated interest payments and excluding the impact of netting agreements:
Carrying amount
R’m
Contractual cash flows
R’m
6 months or less
R’m
6 – 12 months
R’m
+1 – 2 years
R’m
+2 – 5 years
R’m
More than
5 yearsR’m
Group30 June 2015Non-derivative financial liabilitiesTrade and other payables* 1 603,0 1 603,0 1 603,0 – – – – Vessel finance liability 33,5 33,5 33,5 – – – – Overdraft and current borrowings 1 631,6 1 631,6 1 631,6 – – – –
3 268,1 3 268,1 3 268,1 – – – –
30 June 2014Non-derivative financial liabilitiesTrade and other payables* 1 510,0 1 510,0 1 510,0 – – – – Vessel finance liability 33,5 33,5 – 33,5 – – – Overdraft and current borrowings 614,0 614,0 614,0 – – – –
2 157,5 2 157,5 2 124,0 33,5 – – –
Company30 June 2015Non-derivative financial liabilitiesTrade and other payables* 13,8 13,8 13,8 – – – –
13,8 13,8 13,8 – – – –
30 June 2014Non-derivative financial liabilitiesTrade and other payables* 26,0 26,0 26,0 – – – –
26,0 26,0 26,0 – – – –
*Excludes performance bonuses, post-retirement liabilities and operating lease straight-line liability.
OV
ER
VIE
WB
USIN
ESS R
EV
IEW
GO
VE
RN
AN
CE
AN
NU
AL FIN
AN
CIA
L STATE
ME
NTS
SHA
RE
HO
LDE
R IN
FOR
MA
TION
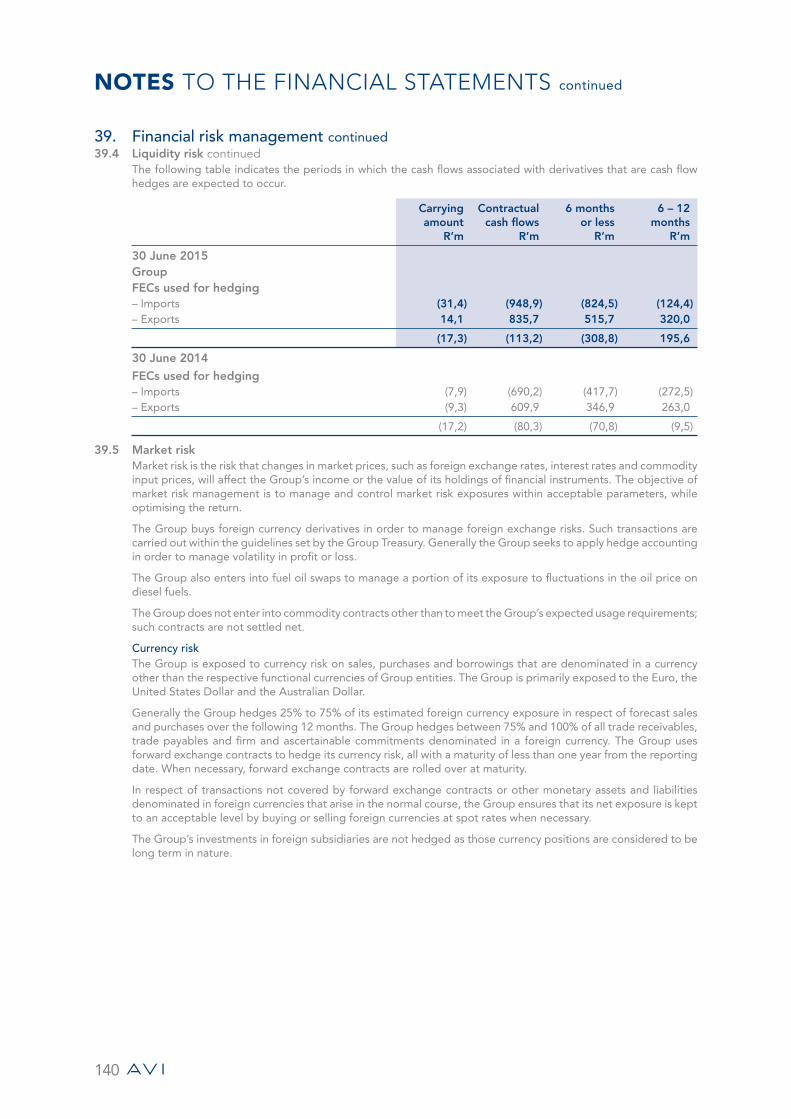
NOTES TO THE FINANCIAL STATEMENTS continued
140
39. Financial risk management continued39.4 Liquidity risk continued
The following table indicates the periods in which the cash flows associated with derivatives that are cash flow hedges are expected to occur.
Carrying amount
R’m
Contractual cash flows
R’m
6 months or less
R’m
6 – 12 months
R’m
30 June 2015GroupFECs used for hedging– Imports (31,4) (948,9) (824,5) (124,4)– Exports 14,1 835,7 515,7 320,0
(17,3) (113,2) (308,8) 195,6
30 June 2014
FECs used for hedging– Imports (7,9) (690,2) (417,7) (272,5)– Exports (9,3) 609,9 346,9 263,0
(17,2) (80,3) (70,8) (9,5)
39.5 Market risk Market risk is the risk that changes in market prices, such as foreign exchange rates, interest rates and commodity input prices, will affect the Group’s income or the value of its holdings of financial instruments. The objective of market risk management is to manage and control market risk exposures within acceptable parameters, while optimising the return.
The Group buys foreign currency derivatives in order to manage foreign exchange risks. Such transactions are carried out within the guidelines set by the Group Treasury. Generally the Group seeks to apply hedge accounting in order to manage volatility in profit or loss.
The Group also enters into fuel oil swaps to manage a portion of its exposure to fluctuations in the oil price on diesel fuels.
The Group does not enter into commodity contracts other than to meet the Group’s expected usage requirements; such contracts are not settled net.
Currency risk The Group is exposed to currency risk on sales, purchases and borrowings that are denominated in a currency other than the respective functional currencies of Group entities. The Group is primarily exposed to the Euro, the United States Dollar and the Australian Dollar.
Generally the Group hedges 25% to 75% of its estimated foreign currency exposure in respect of forecast sales and purchases over the following 12 months. The Group hedges between 75% and 100% of all trade receivables, trade payables and firm and ascertainable commitments denominated in a foreign currency. The Group uses forward exchange contracts to hedge its currency risk, all with a maturity of less than one year from the reporting date. When necessary, forward exchange contracts are rolled over at maturity.
In respect of transactions not covered by forward exchange contracts or other monetary assets and liabilities denominated in foreign currencies that arise in the normal course, the Group ensures that its net exposure is kept to an acceptable level by buying or selling foreign currencies at spot rates when necessary.
The Group’s investments in foreign subsidiaries are not hedged as those currency positions are considered to be long term in nature.
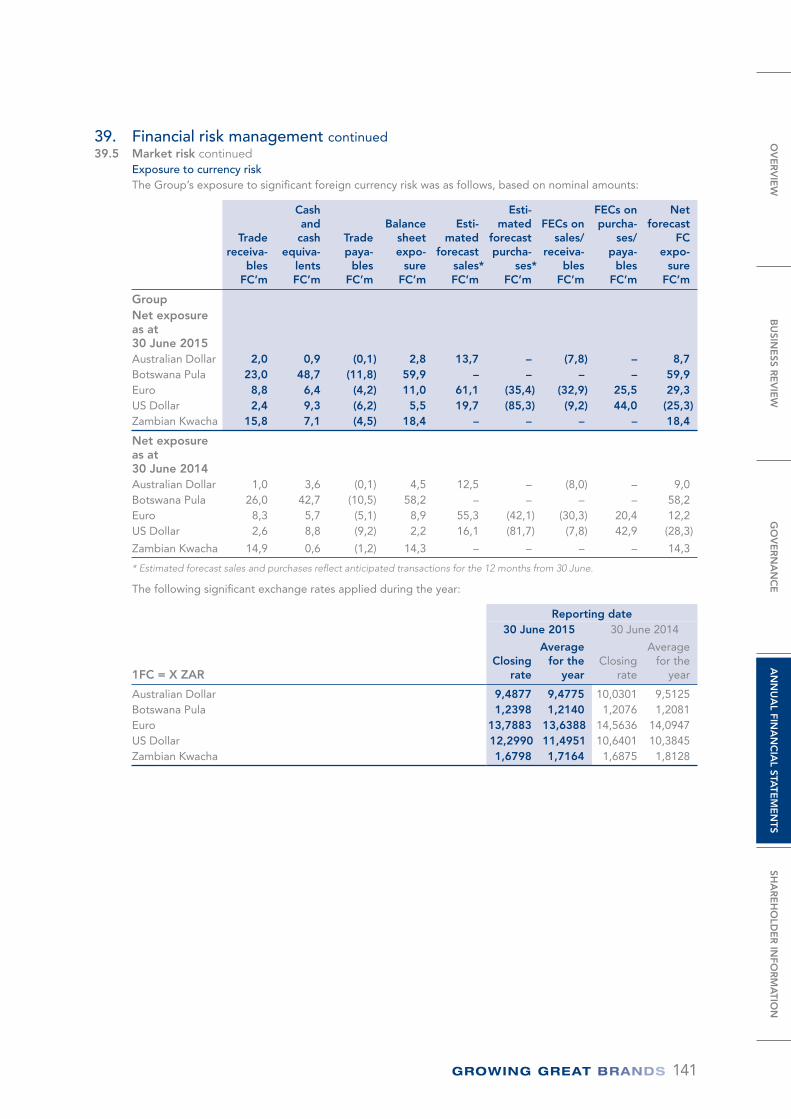
141
39. Financial risk management continued39.5 Market risk continued
Exposure to currency risk The Group’s exposure to significant foreign currency risk was as follows, based on nominal amounts:
Trade receiva-
blesFC’m
Cash and cash
equiva-lentsFC’m
Trade paya-
blesFC’m
Balance sheetexpo-
sureFC’m
Esti-mated
forecast sales*FC’m
Esti-mated
forecast purcha-
ses*FC’m
FECs on sales/
receiva-bles
FC’m
FECs on purcha-
ses/paya-
blesFC’m
Net forecast
FC expo-
sureFC’m
GroupNet exposure as at 30 June 2015Australian Dollar 2,0 0,9 (0,1) 2,8 13,7 – (7,8) – 8,7 Botswana Pula 23,0 48,7 (11,8) 59,9 – – – – 59,9 Euro 8,8 6,4 (4,2) 11,0 61,1 (35,4) (32,9) 25,5 29,3 US Dollar 2,4 9,3 (6,2) 5,5 19,7 (85,3) (9,2) 44,0 (25,3)Zambian Kwacha 15,8 7,1 (4,5) 18,4 – – – – 18,4
Net exposure as at 30 June 2014Australian Dollar 1,0 3,6 (0,1) 4,5 12,5 – (8,0) – 9,0 Botswana Pula 26,0 42,7 (10,5) 58,2 – – – – 58,2 Euro 8,3 5,7 (5,1) 8,9 55,3 (42,1) (30,3) 20,4 12,2 US Dollar 2,6 8,8 (9,2) 2,2 16,1 (81,7) (7,8) 42,9 (28,3)
Zambian Kwacha 14,9 0,6 (1,2) 14,3 – – – – 14,3
* Estimated forecast sales and purchases reflect anticipated transactions for the 12 months from 30 June.
The following significant exchange rates applied during the year:
Reporting date30 June 2015 30 June 2014
1FC = X ZARClosing
rate
Average for the
yearClosing
rate
Average for the
year
Australian Dollar 9,4877 9,4775 10,0301 9,5125 Botswana Pula 1,2398 1,2140 1,2076 1,2081 Euro 13,7883 13,6388 14,5636 14,0947 US Dollar 12,2990 11,4951 10,6401 10,3845 Zambian Kwacha 1,6798 1,7164 1,6875 1,8128
OV
ER
VIE
WB
USIN
ESS R
EV
IEW
GO
VE
RN
AN
CE
AN
NU
AL FIN
AN
CIA
L STATE
ME
NTS
SHA
RE
HO
LDE
R IN
FOR
MA
TION
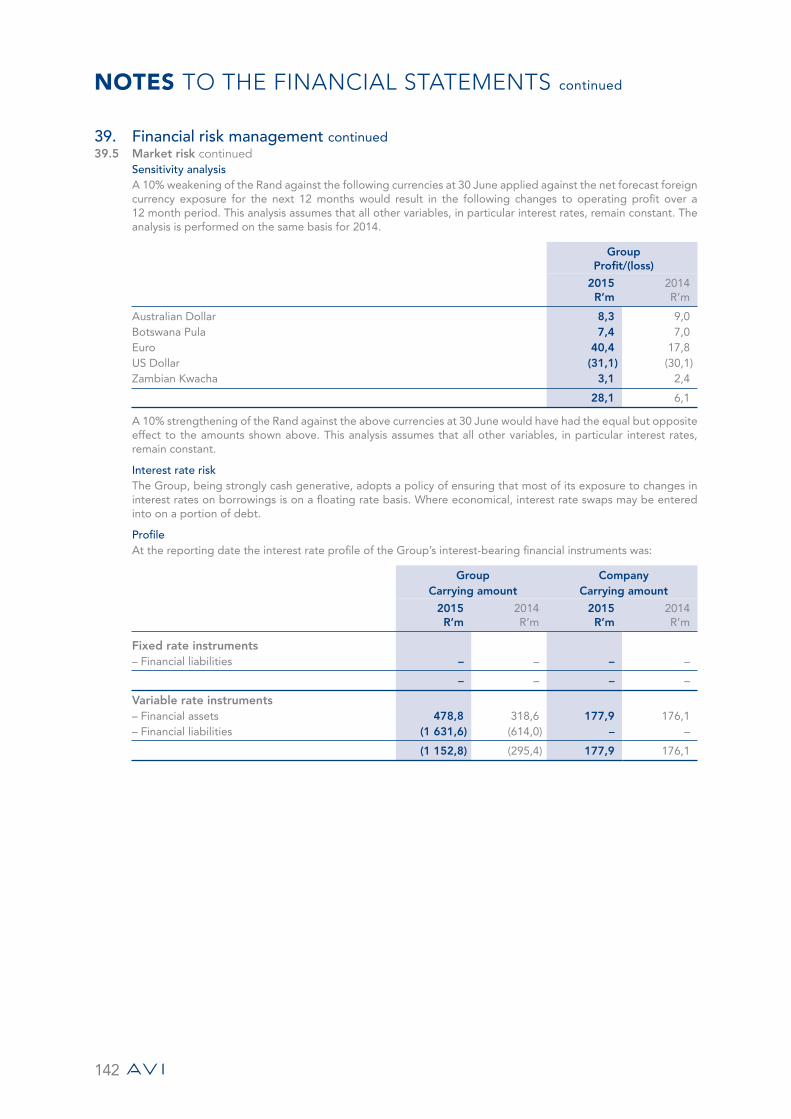
NOTES TO THE FINANCIAL STATEMENTS continued
142
39. Financial risk management continued39.5 Market risk continued
Sensitivity analysis A 10% weakening of the Rand against the following currencies at 30 June applied against the net forecast foreign currency exposure for the next 12 months would result in the following changes to operating profit over a 12 month period. This analysis assumes that all other variables, in particular interest rates, remain constant. The analysis is performed on the same basis for 2014.
Group Profit/(loss)
2015R’m
2014R’m
Australian Dollar 8,3 9,0 Botswana Pula 7,4 7,0 Euro 40,4 17,8 US Dollar (31,1) (30,1)Zambian Kwacha 3,1 2,4
28,1 6,1
A 10% strengthening of the Rand against the above currencies at 30 June would have had the equal but opposite effect to the amounts shown above. This analysis assumes that all other variables, in particular interest rates, remain constant.
Interest rate risk The Group, being strongly cash generative, adopts a policy of ensuring that most of its exposure to changes in interest rates on borrowings is on a floating rate basis. Where economical, interest rate swaps may be entered into on a portion of debt.
Profile At the reporting date the interest rate profile of the Group’s interest-bearing financial instruments was:
Group Company Carrying amount Carrying amount
2015R’m
2014R’m
2015R’m
2014R’m
Fixed rate instruments– Financial liabilities – – – –
– – – –
Variable rate instruments– Financial assets 478,8 318,6 177,9 176,1 – Financial liabilities (1 631,6) (614,0) – –
(1 152,8) (295,4) 177,9 176,1
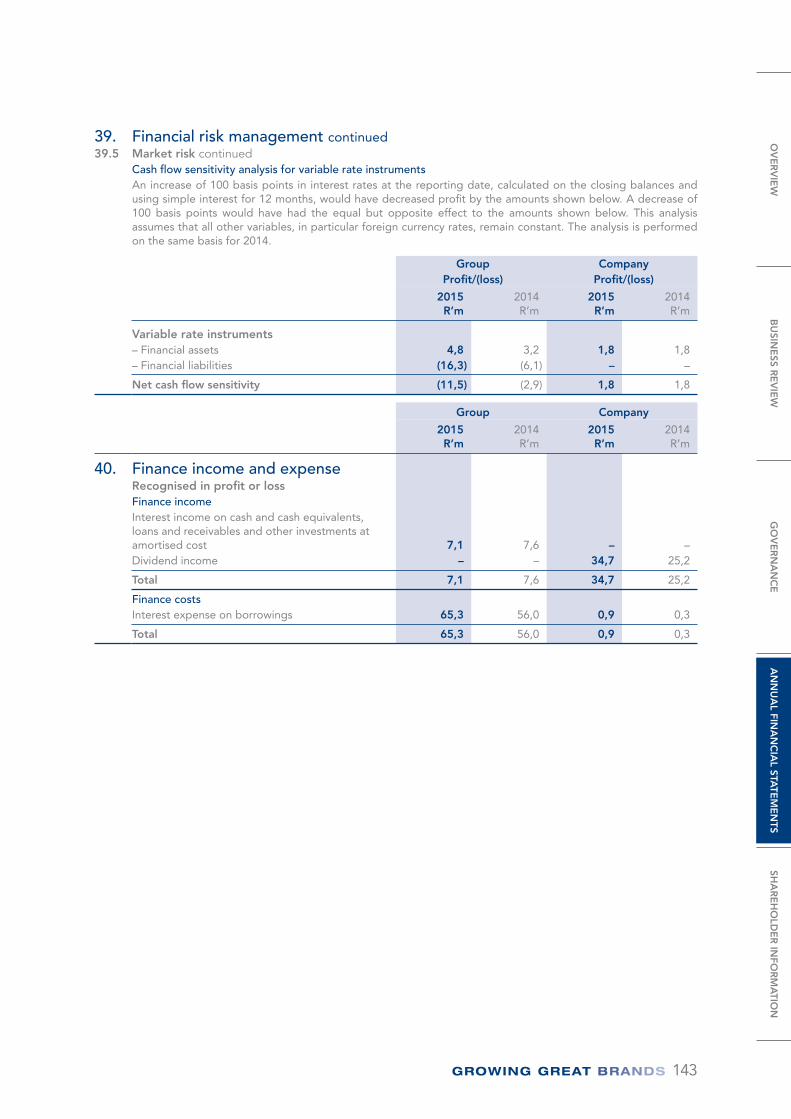
143
39. Financial risk management continued39.5 Market risk continued
Cash flow sensitivity analysis for variable rate instruments An increase of 100 basis points in interest rates at the reporting date, calculated on the closing balances and using simple interest for 12 months, would have decreased profit by the amounts shown below. A decrease of 100 basis points would have had the equal but opposite effect to the amounts shown below. This analysis assumes that all other variables, in particular foreign currency rates, remain constant. The analysis is performed on the same basis for 2014.
Group Company Profit/(loss) Profit/(loss)
2015R’m
2014R’m
2015R’m
2014R’m
Variable rate instruments– Financial assets 4,8 3,2 1,8 1,8 – Financial liabilities (16,3) (6,1) – –
Net cash flow sensitivity (11,5) (2,9) 1,8 1,8
Group Company
2015R’m
2014R’m
2015R’m
2014R’m
40. Finance income and expense Recognised in profit or lossFinance incomeInterest income on cash and cash equivalents, loans and receivables and other investments at amortised cost 7,1 7,6 – – Dividend income – – 34,7 25,2
Total 7,1 7,6 34,7 25,2
Finance costsInterest expense on borrowings 65,3 56,0 0,9 0,3
Total 65,3 56,0 0,9 0,3
OV
ER
VIE
WB
USIN
ESS R
EV
IEW
GO
VE
RN
AN
CE
AN
NU
AL FIN
AN
CIA
L STATE
ME
NTS
SHA
RE
HO
LDE
R IN
FOR
MA
TION
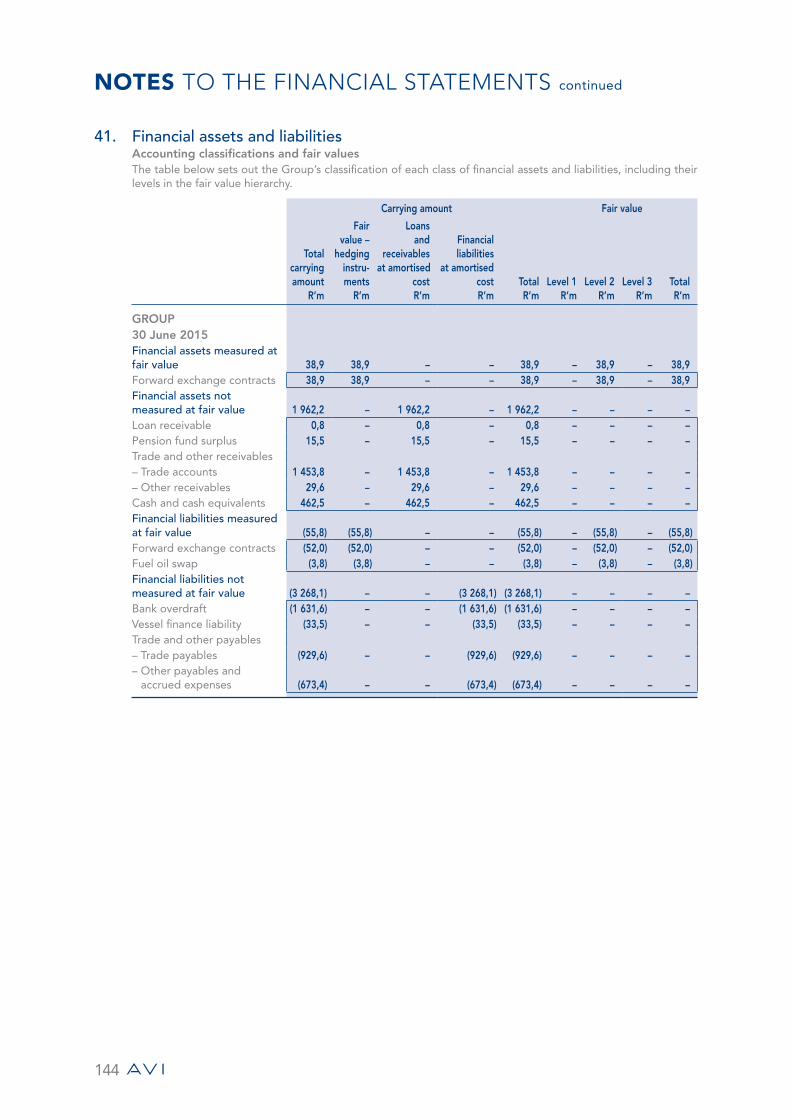
NOTES TO THE FINANCIAL STATEMENTS continued
144
41. Financial assets and liabilities Accounting classifications and fair values The table below sets out the Group’s classification of each class of financial assets and liabilities, including their levels in the fair value hierarchy.
Carrying amount Fair value
Total carrying amount
R’m
Fair value –
hedging instru-ments
R’m
Loans and
receivables at amortised
costR’m
Financial liabilities
at amortised costR’m
TotalR’m
Level 1R’m
Level 2R’m
Level 3R’m
TotalR’m
GROUP 30 June 2015Financial assets measured at fair value 38,9 38,9 – – 38,9 – 38,9 – 38,9 Forward exchange contracts 38,9 38,9 – – 38,9 – 38,9 – 38,9 Financial assets not measured at fair value 1 962,2 – 1 962,2 – 1 962,2 – – – – Loan receivable 0,8 – 0,8 – 0,8 – – – – Pension fund surplus 15,5 – 15,5 – 15,5 – – – – Trade and other receivables– Trade accounts 1 453,8 – 1 453,8 – 1 453,8 – – – – – Other receivables 29,6 – 29,6 – 29,6 – – – – Cash and cash equivalents 462,5 – 462,5 – 462,5 – – – – Financial liabilities measured at fair value (55,8) (55,8) – – (55,8) – (55,8) – (55,8)Forward exchange contracts (52,0) (52,0) – – (52,0) – (52,0) – (52,0)Fuel oil swap (3,8) (3,8) – – (3,8) – (3,8) – (3,8)Financial liabilities not measured at fair value (3 268,1) – – (3 268,1) (3 268,1) – – – – Bank overdraft (1 631,6) – – (1 631,6) (1 631,6) – – – – Vessel finance liability (33,5) – – (33,5) (33,5) – – – –Trade and other payables– Trade payables (929,6) – – (929,6) (929,6) – – – – – Other payables and
accrued expenses (673,4) – – (673,4) (673,4) – – – –
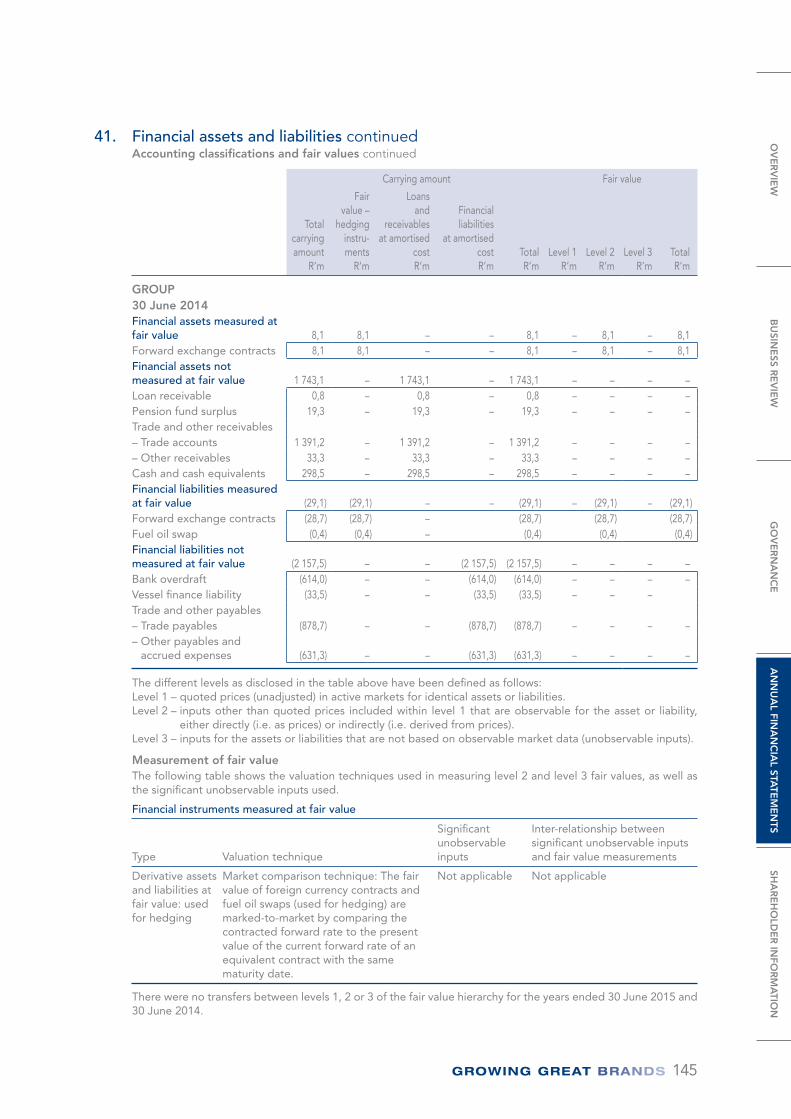
145
41. Financial assets and liabilities continuedAccounting classifications and fair values continued
Carrying amount Fair value
Total carrying amount
R’m
Fair value –
hedging instru-ments
R’m
Loans and
receivables at amortised
costR’m
Financial liabilities
at amortised costR’m
TotalR’m
Level 1R’m
Level 2R’m
Level 3R’m
TotalR’m
GROUP30 June 2014Financial assets measured at fair value 8,1 8,1 – – 8,1 – 8,1 – 8,1 Forward exchange contracts 8,1 8,1 – – 8,1 – 8,1 – 8,1 Financial assets not measured at fair value 1 743,1 – 1 743,1 – 1 743,1 – – – – Loan receivable 0,8 – 0,8 – 0,8 – – – – Pension fund surplus 19,3 – 19,3 – 19,3 – – – – Trade and other receivables– Trade accounts 1 391,2 – 1 391,2 – 1 391,2 – – – – – Other receivables 33,3 – 33,3 – 33,3 – – – – Cash and cash equivalents 298,5 – 298,5 – 298,5 – – – – Financial liabilities measured at fair value (29,1) (29,1) – – (29,1) – (29,1) – (29,1)Forward exchange contracts (28,7) (28,7) – (28,7) (28,7) (28,7)Fuel oil swap (0,4) (0,4) – (0,4) (0,4) (0,4)Financial liabilities not measured at fair value (2 157,5) – – (2 157,5) (2 157,5) – – – – Bank overdraft (614,0) – – (614,0) (614,0) – – – – Vessel finance liability (33,5) – – (33,5) (33,5) – – –Trade and other payables– Trade payables (878,7) – – (878,7) (878,7) – – – – – Other payables and
accrued expenses (631,3) – – (631,3) (631,3) – – – –
The different levels as disclosed in the table above have been defined as follows: Level 1 – quoted prices (unadjusted) in active markets for identical assets or liabilities. Level 2 – inputs other than quoted prices included within level 1 that are observable for the asset or liability,
either directly (i.e. as prices) or indirectly (i.e. derived from prices).Level 3 – inputs for the assets or liabilities that are not based on observable market data (unobservable inputs).
Measurement of fair value The following table shows the valuation techniques used in measuring level 2 and level 3 fair values, as well as the significant unobservable inputs used.
Financial instruments measured at fair value
Type Valuation technique
Significant unobservable inputs
Inter-relationship between significant unobservable inputs and fair value measurements
Derivative assets and liabilities at fair value: used for hedging
Market comparison technique: The fair value of foreign currency contracts and fuel oil swaps (used for hedging) are marked-to-market by comparing the contracted forward rate to the present value of the current forward rate of an equivalent contract with the same maturity date.
Not applicable Not applicable
There were no transfers between levels 1, 2 or 3 of the fair value hierarchy for the years ended 30 June 2015 and 30 June 2014.
OV
ER
VIE
WB
USIN
ESS R
EV
IEW
GO
VE
RN
AN
CE
AN
NU
AL FIN
AN
CIA
L STATE
ME
NTS
SHA
RE
HO
LDE
R IN
FOR
MA
TION
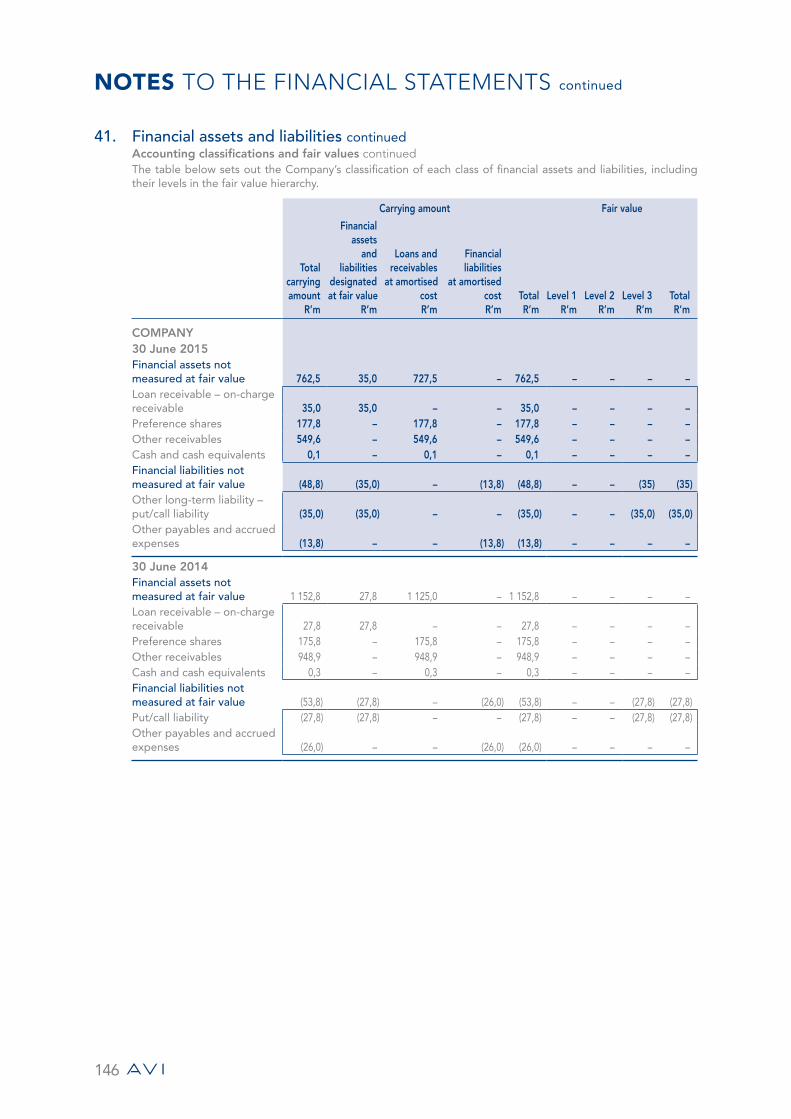
NOTES TO THE FINANCIAL STATEMENTS continued
146
41. Financial assets and liabilities continuedAccounting classifications and fair values continuedThe table below sets out the Company’s classification of each class of financial assets and liabilities, including their levels in the fair value hierarchy.
Carrying amount Fair value
Total carrying amount
R’m
Financial assets
and liabilities
designated at fair value
R’m
Loans and receivables
at amortised costR’m
Financial liabilities
at amortised costR’m
TotalR’m
Level 1R’m
Level 2R’m
Level 3R’m
TotalR’m
COMPANY 30 June 2015Financial assets not measured at fair value 762,5 35,0 727,5 – 762,5 – – – –Loan receivable – on-charge receivable 35,0 35,0 – – 35,0 – – – – Preference shares 177,8 – 177,8 – 177,8 – – – – Other receivables 549,6 – 549,6 – 549,6 – – – – Cash and cash equivalents 0,1 – 0,1 – 0,1 – – – – Financial liabilities not measured at fair value (48,8) (35,0) – (13,8) (48,8) – – (35) (35)Other long-term liability – put/call liability (35,0) (35,0) – – (35,0) – – (35,0) (35,0)Other payables and accrued expenses (13,8) – – (13,8) (13,8) – – – –
30 June 2014Financial assets not measured at fair value 1 152,8 27,8 1 125,0 – 1 152,8 – – – –Loan receivable – on-charge receivable 27,8 27,8 – – 27,8 – – – – Preference shares 175,8 – 175,8 – 175,8 – – – – Other receivables 948,9 – 948,9 – 948,9 – – – – Cash and cash equivalents 0,3 – 0,3 – 0,3 – – – – Financial liabilities not measured at fair value (53,8) (27,8) – (26,0) (53,8) – – (27,8) (27,8)Put/call liability (27,8) (27,8) – – (27,8) – – (27,8) (27,8)Other payables and accrued expenses (26,0) – – (26,0) (26,0) – – – –
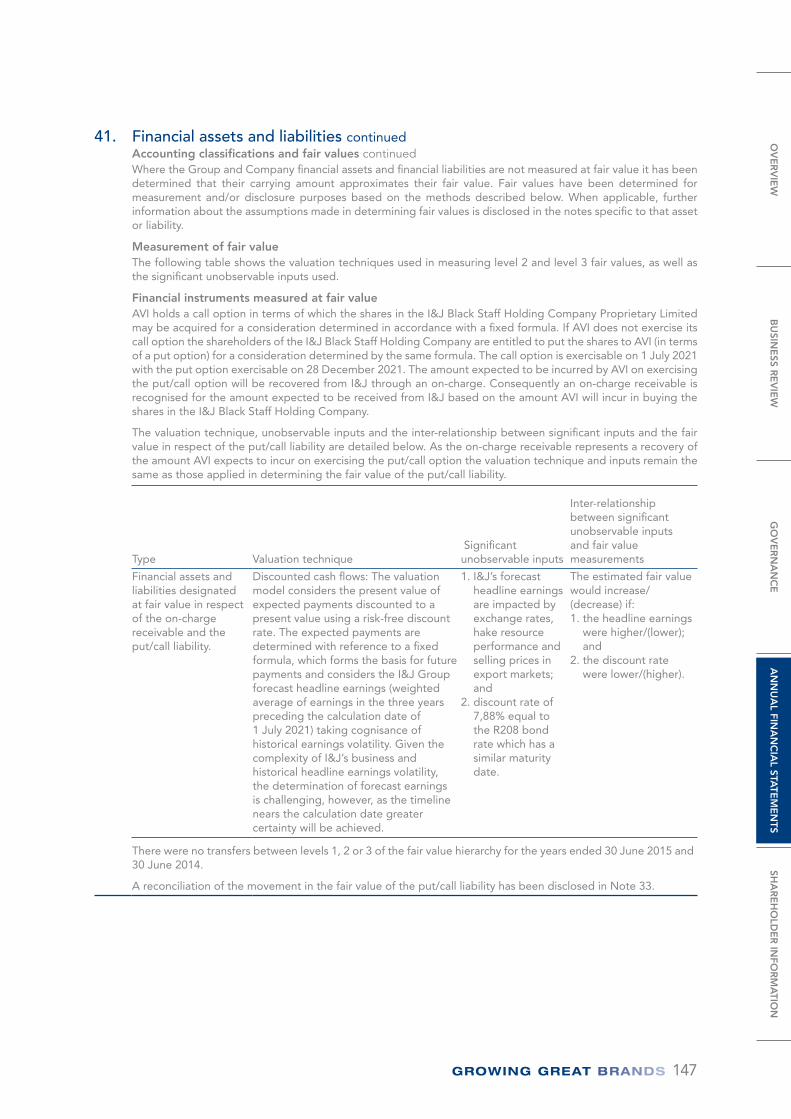
147
41. Financial assets and liabilities continuedAccounting classifications and fair values continuedWhere the Group and Company financial assets and financial liabilities are not measured at fair value it has been determined that their carrying amount approximates their fair value. Fair values have been determined for measurement and/or disclosure purposes based on the methods described below. When applicable, further information about the assumptions made in determining fair values is disclosed in the notes specific to that asset or liability.
Measurement of fair value The following table shows the valuation techniques used in measuring level 2 and level 3 fair values, as well as the significant unobservable inputs used.
Financial instruments measured at fair value AVI holds a call option in terms of which the shares in the I&J Black Staff Holding Company Proprietary Limited may be acquired for a consideration determined in accordance with a fixed formula. If AVI does not exercise its call option the shareholders of the I&J Black Staff Holding Company are entitled to put the shares to AVI (in terms of a put option) for a consideration determined by the same formula. The call option is exercisable on 1 July 2021 with the put option exercisable on 28 December 2021. The amount expected to be incurred by AVI on exercising the put/call option will be recovered from I&J through an on-charge. Consequently an on-charge receivable is recognised for the amount expected to be received from I&J based on the amount AVI will incur in buying the shares in the I&J Black Staff Holding Company.
The valuation technique, unobservable inputs and the inter-relationship between significant inputs and the fair value in respect of the put/call liability are detailed below. As the on-charge receivable represents a recovery of the amount AVI expects to incur on exercising the put/call option the valuation technique and inputs remain the same as those applied in determining the fair value of the put/call liability.
Type Valuation technique Significant unobservable inputs
Inter-relationship between significant unobservable inputs and fair value measurements
Financial assets and liabilities designated at fair value in respect of the on-charge receivable and the put/call liability.
Discounted cash flows: The valuation model considers the present value of expected payments discounted to a present value using a risk-free discount rate. The expected payments are determined with reference to a fixed formula, which forms the basis for future payments and considers the I&J Group forecast headline earnings (weighted average of earnings in the three years preceding the calculation date of 1 July 2021) taking cognisance of historical earnings volatility. Given the complexity of I&J’s business and historical headline earnings volatility, the determination of forecast earnings is challenging, however, as the timeline nears the calculation date greater certainty will be achieved.
1. I&J’s forecast headline earnings are impacted by exchange rates, hake resource performance and selling prices in export markets; and
2. discount rate of 7,88% equal to the R208 bond rate which has a similar maturity date.
The estimated fair value would increase/(decrease) if: 1. the headline earnings
were higher/(lower); and
2. the discount rate were lower/(higher).
There were no transfers between levels 1, 2 or 3 of the fair value hierarchy for the years ended 30 June 2015 and 30 June 2014.
A reconciliation of the movement in the fair value of the put/call liability has been disclosed in Note 33.
OV
ER
VIE
WB
USIN
ESS R
EV
IEW
GO
VE
RN
AN
CE
AN
NU
AL FIN
AN
CIA
L STATE
ME
NTS
SHA
RE
HO
LDE
R IN
FOR
MA
TION
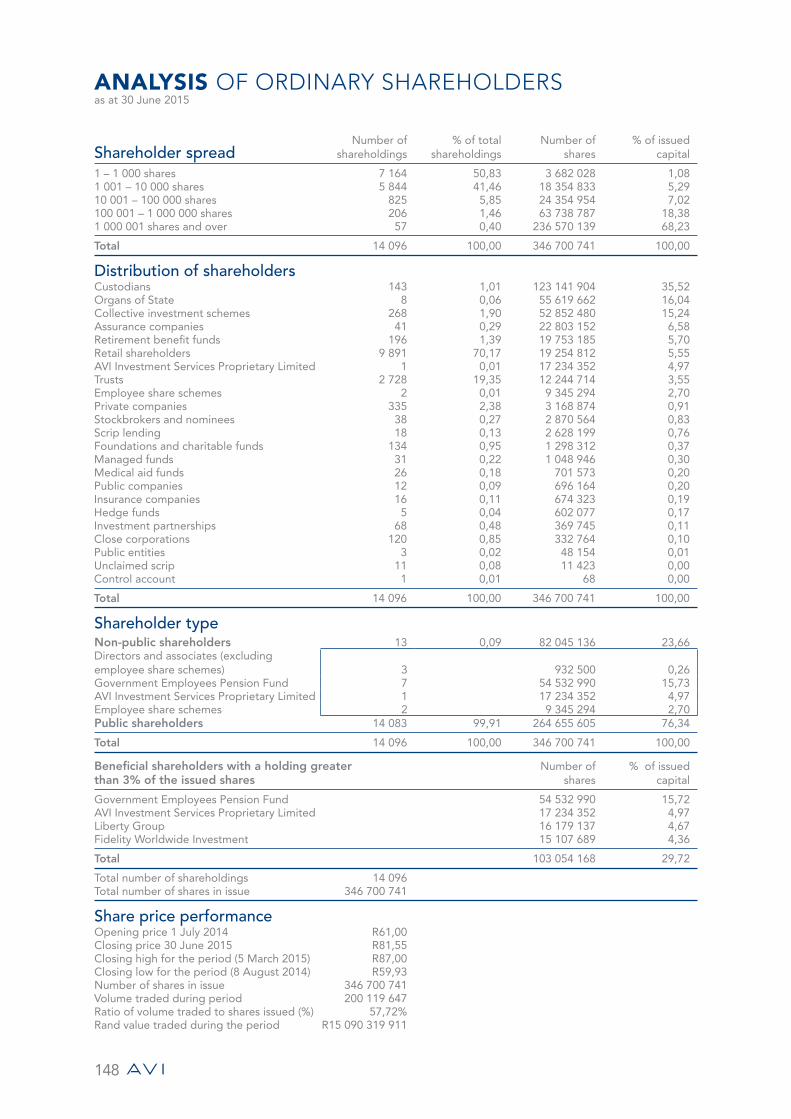
148
ANALYSIS OF ORDINARY SHAREHOLDERSas at 30 June 2015
Shareholder spreadNumber of
shareholdings% of total
shareholdingsNumber of
shares% of issued
capital
1 – 1 000 shares 7 164 50,83 3 682 028 1,081 001 – 10 000 shares 5 844 41,46 18 354 833 5,2910 001 – 100 000 shares 825 5,85 24 354 954 7,02100 001 – 1 000 000 shares 206 1,46 63 738 787 18,381 000 001 shares and over 57 0,40 236 570 139 68,23
Total 14 096 100,00 346 700 741 100,00
Distribution of shareholdersCustodians 143 1,01 123 141 904 35,52Organs of State 8 0,06 55 619 662 16,04Collective investment schemes 268 1,90 52 852 480 15,24Assurance companies 41 0,29 22 803 152 6,58Retirement benefit funds 196 1,39 19 753 185 5,70Retail shareholders 9 891 70,17 19 254 812 5,55AVI Investment Services Proprietary Limited 1 0,01 17 234 352 4,97Trusts 2 728 19,35 12 244 714 3,55Employee share schemes 2 0,01 9 345 294 2,70Private companies 335 2,38 3 168 874 0,91Stockbrokers and nominees 38 0,27 2 870 564 0,83Scrip lending 18 0,13 2 628 199 0,76Foundations and charitable funds 134 0,95 1 298 312 0,37Managed funds 31 0,22 1 048 946 0,30Medical aid funds 26 0,18 701 573 0,20Public companies 12 0,09 696 164 0,20Insurance companies 16 0,11 674 323 0,19Hedge funds 5 0,04 602 077 0,17Investment partnerships 68 0,48 369 745 0,11Close corporations 120 0,85 332 764 0,10Public entities 3 0,02 48 154 0,01Unclaimed scrip 11 0,08 11 423 0,00Control account 1 0,01 68 0,00
Total 14 096 100,00 346 700 741 100,00
Shareholder typeNon-public shareholders 13 0,09 82 045 136 23,66Directors and associates (excluding employee share schemes) 3 932 500 0,26Government Employees Pension Fund 7 54 532 990 15,73AVI Investment Services Proprietary Limited 1 17 234 352 4,97Employee share schemes 2 9 345 294 2,70Public shareholders 14 083 99,91 264 655 605 76,34
Total 14 096 100,00 346 700 741 100,00
Beneficial shareholders with a holding greater than 3% of the issued shares
Number of shares
% of issued capital
Government Employees Pension Fund 54 532 990 15,72AVI Investment Services Proprietary Limited 17 234 352 4,97Liberty Group 16 179 137 4,67Fidelity Worldwide Investment 15 107 689 4,36
Total 103 054 168 29,72
Total number of shareholdings 14 096Total number of shares in issue 346 700 741
Share price performanceOpening price 1 July 2014 R61,00Closing price 30 June 2015 R81,55Closing high for the period (5 March 2015) R87,00Closing low for the period (8 August 2014) R59,93Number of shares in issue 346 700 741Volume traded during period 200 119 647Ratio of volume traded to shares issued (%) 57,72%Rand value traded during the period R15 090 319 911
149
SHAREHOLDERS’ DIARY
Reports and profit statementsInterim report announcement in press Tuesday, 10 March
Annual results announcement in press Tuesday, 8 September
Annual Financial Statements posted Tuesday, 6 October
Final dividendDividends declared Friday, 4 September
Details of dividends announcement in SENS Monday, 7 September
Details of dividends announcement in press Tuesday, 8 September
Last day to trade cum dividend on the JSE Limited (“JSE”) Friday, 9 October
First day trading ex dividend on the JSE Monday, 12 October
Record date Friday, 16 October
Payment date Monday, 19 October
OV
ER
VIE
WB
USIN
ESS R
EV
IEW
GO
VE
RN
AN
CE
AN
NU
AL FIN
AN
CIA
L STATE
ME
NTS
SHA
RE
HO
LDE
R IN
FOR
MA
TION
150
NOTICE OF ANNUAL GENERAL MEETING
AVI Limited(Incorporated in the Republic of South Africa)
(Registration number 1944/017201/06)
Share code: AVI
ISIN: ZAE000049433
(“AVI” or “the Company” or “the Group”)
NOTICE OF ANNUAL GENERAL MEETINGINCORPORATING A FORM OF PROXY FOR THE USE OF HOLDERS OF CERTIFICATED ORDINARY SHARES AND DEMATERIALISED ORDINARY SHARES WITH “OWN NAME” REGISTRATION ONLY.
Notice is hereby given that the seventy-first Annual General Meeting of members of the Company will be held at
2 Harries Road, Illovo, Johannesburg on Thursday, 5 November 2015 at 11:00 for the following purposes:
To consider and if deemed fit, to pass with or without modification, ordinary resolutions 1 to 9. In terms of the Companies Act No 71 of 2008, as amended (“the Companies Act”), for an ordinary resolution to be adopted, it must be supported by more than 50% of the total number of votes exercised on the resolution by the shareholders present or represented by proxy at this meeting and entitled to vote thereon.
1. “That the Annual Financial Statements for the year ended 30 June 2015, together with the reports of the directors,
the independent auditors, and the Audit and Risk Committee, be and are hereby adopted.”
2. “That KPMG Inc. be and are hereby re-appointed as the external auditors of the Company.”
3. “That Mr MJ Bosman, who will retire by rotation in accordance with the Company’s Memorandum of Incorporation
and who, being eligible, offers himself for re-election, be and is hereby re-elected as a director of the Company.”*
4. “That Ms A Kawa, who will retire by rotation in accordance with the Company’s Memorandum of Incorporation and
who, being eligible, offers herself for re-election, be and is hereby re-elected as a director of the Company.”*
5. “That Mr A Nühn, who will retire by rotation in accordance with the Company’s Memorandum of Incorporation and
who, being eligible, offers himself for re-election, be and is hereby re-elected as a director of the Company.”*
6. “That Mr AM Thebyane, who will retire by rotation in accordance with the Company’s Memorandum of Incorporation
and who, being eligible, offers himself for re-election, be and is hereby re-elected as a director of the Company.”*
7. “That Mr MJ Bosman, be and is hereby elected as a member and the Chairman of the Audit and Risk Committee.”*
8. “That Mr JR Hersov, be and is hereby elected as a member of the Audit and Risk Committee.”*
9. “That Mrs NP Dongwana, be and is hereby elected as a member of the Audit and Risk Committee.”*
*Brief CVs of the directors appear on page 60 of the Integrated Annual Report.
151
To consider and if deemed fit, to pass with or without modification, special resolutions 10 to 19. In terms of the Companies Act for a special resolution to be adopted, it must be supported by at least 75% of the total number of votes exercised on the resolution by shareholders present or represented by proxy at this meeting and entitled to vote thereon.
10. “That with effect from 1 July 2015 the fees payable to the current non-executive directors, excluding the Chairman
of the Board and the foreign non-executive director, Mr A Nühn, be increased from R246 000 per year to R263 000
per year.”
11. “That with effect from 1 July 2015 the fees payable to the Chairman of the Board be increased from R744 000 per
year to R818 000 per year.”
12. “That with effect from 1 July 2015 the fees payable to the foreign non-executive director, Mr A Nühn, be increased
from EUR43 870 per year to EUR44 700 per year.”
13. “That with effect from 1 July 2015 the fees payable to the members of the Remuneration, Nomination and
Appointments Committee, excluding the Chairman of this committee, be increased from R84 000 per year to
R90 000 per year.”
14. “That with effect from 1 July 2015 the fees payable to the members of the Audit and Risk Committee, excluding the
Chairman of this committee, be increased from R91 500 per year to R98 000 per year.”
15. “That with effect from 1 July 2015 the fees payable to the members of the Social and Ethics Committee, excluding
the Chairman of this committee, be increased from R62 000 per year to R66 300 per year.”
16. “That with effect from 1 July 2015 the fees payable to the Chairman of the Remuneration, Nomination and
Appointments Committee be increased from R183 000 per year to R196 000 per year. If the foreign non-executive
director, Mr A Nühn, is Chairman of the Remuneration, Nomination and Appointments Committee, the fee will be
increased from EUR14 445 per year to EUR14 700 per year with effect from 1 July 2015.”
17. “That with effect from 1 July 2015 the fees payable to the Chairman of the Audit and Risk Committee be increased
from R198 000 per year to R212 000 per year.”
18. “That with effect from 1 July 2015 the fees payable to the Chairman of the Social and Ethics Committee be increased
from R91 500 per year to R98 000 per year.”
The increases in non-executive directors’ fees proposed in terms of special resolutions 10 to 18 above are based on a
detailed review and comparison of non-executive directors’ fees to market-related benchmarks. Non-executive directors’
fees are paid as a combination of a fixed retainer and for attendance at formally convened meetings.
19. “That the Company and/or any of its subsidiaries be and are hereby authorised, by way of a general approval in
terms of the Listings Requirements of the JSE Limited (“the JSE”), to acquire ordinary shares issued by the Company,
upon such terms and conditions and in such amounts as the directors of the Company may from time to time decide,
provided that:
• any such acquisition shall only be made in compliance with the provisions of sections 4 and 48 read with section 46
of the Companies Act;
• any such acquisition of ordinary shares shall be effected on the open market through the order book operated by
the JSE trading system and done without any prior understanding or arrangement between the Company and the
counterparty (reported trades being prohibited);
• any such acquisition of ordinary shares is authorised by the Company’s Memorandum of Incorporation;
• this general authority shall be valid until the Company’s next Annual General Meeting, provided that it shall not
extend beyond 15 (fifteen) months from the date of passing of this special resolution;
• the Company, may not, in any one financial year, acquire in excess of 10% of the Company’s issued ordinary share
capital as at the date of passing of this special resolution;
OV
ER
VIE
WB
USIN
ESS R
EV
IEW
GO
VE
RN
AN
CE
AN
NU
AL FIN
AN
CIA
L STATE
ME
NTS
SHA
RE
HO
LDE
R IN
FOR
MA
TION
152
NOTICE OF ANNUAL GENERAL MEETING continued
• the Company’s subsidiaries shall not be entitled to acquire, on a cumulative basis, in excess of 10% of the
Company’s issued ordinary share capital as at the date of passing this special resolution;
• a resolution by the Board of directors that it has authorised the repurchase, that the Company and its subsidiary/
ies have passed the solvency and liquidity test and that, since the test was performed, there have been no
material changes to the financial position of the Group;
• in determining the price at which ordinary shares issued by the Company are acquired by it or any of its subsidiaries
in terms of this general authority, the maximum premium at which such ordinary shares may be acquired will be
10% of the weighted average of the market value at which such ordinary shares are traded on the JSE as
determined over the five business days immediately preceding the date of repurchase of such ordinary shares by
the Company or any of its subsidiaries;
• at any point in time, the Company may only appoint one agent to effect any repurchase on the Company’s behalf;
• the Company and/or its subsidiaries may not repurchase any ordinary shares during a prohibited period as defined
by the Listings Requirements unless they have in place a repurchase programme where the dates and quantities
of ordinary shares to be traded during the relevant period are fixed and have been submitted to the JSE in writing
prior to the commencement of the prohibited period. The Company will instruct an independent third party,
which makes its investment decisions in relation to the Company’s securities independently of, and uninfluenced
by, the Company, prior to the commencement of the prohibited period to execute the repurchase programme
submitted to the JSE; and
• shares held within the AVI Group (so called treasury shares) will not have their votes at general meetings taken
account of for Listings Requirements resolution approval purposes.”
The directors consider that such a general authority should be put in place in accordance with the Listings
Requirements in order to enable the repurchase of the Company’s shares should an opportunity to do so, which is
in the best interests of the Company and its shareholders, present itself during the year.
Upon cumulatively repurchasing 3% of the initial number of ordinary shares in issue and for each 3% of ordinary
shares repurchased thereafter, the Company will make an announcement to such effect not later than 08:30 on the
second business day following the day on which the relevant threshold is reached or exceeded.
To consider the non-binding ordinary resolution 20. 20. “That, by way of a non-binding advisory ordinary resolution, the Company’s remuneration policy as set out in the
Remuneration Report contained in the Integrated Annual Report of which this notice forms part, be and is hereby
endorsed.”
King III dealing with boards and directors requires companies to table their remuneration policy every year to
shareholders by way of a non-binding advisory vote at the Annual General Meeting. This vote enables shareholders
to express their views on the remuneration policy adopted.
To consider any other business.21. To transact such other business as may be transacted at an Annual General Meeting.
153
Directors’ statementThe directors, having considered the effects of special resolution 19 above, consider that for a period of 12 (twelve)
months after the date of this notice:
• the Company and the Group will be able, in the ordinary course of business, to pay their debts;
• the assets of the Company and the Group, fairly valued in accordance with generally accepted accounting practice,
will exceed the liabilities of the Company and the Group; and
• the Company and the Group’s ordinary share capital, reserves and working capital will be adequate for ordinary
business purposes.
General informationThe following additional information, some of which may appear elsewhere in the Integrated Annual Report of which this
notice forms part, is provided in terms of the Listings Requirements of the JSE for purposes of the general authority to
repurchase shares (resolution 19):
• major beneficial shareholders – pages 130 and 148; and
• share capital of the Company – page 81.
Directors’ responsibility statementThe directors, whose names appear on pages 60 and 61 of the Integrated Annual Report, collectively and individually
accept full responsibility for the accuracy of the information pertaining to resolution 19 above and certify that, to the
best of their knowledge and belief, there are no facts that have been omitted which would make any statement false or
misleading, and that all reasonable enquiries to ascertain such facts have been made and that this notice contains all
information required by law and the Listings Requirements of the JSE.
Material changesOther than the facts and developments reported on in the Integrated Annual Report, there have been no material
changes in the affairs or financial position of the Company and its subsidiaries since the date of signature of the Annual
Report and up to the date of this notice.
Record dateThe directors have determined in accordance with sections 59 (1) (a) and (b) of the Companies Act that:
• the record date for the purposes of receiving notice of the Annual General Meeting shall be the close of business on
Friday, 25 September; and
• the record date for the purposes of the Annual General Meeting (being the date on which a shareholder must be
registered in the Company’s share register in order to participate in and vote at the Annual General Meeting) shall
be the close of business on Friday, 30 October 2015.
OV
ER
VIE
WB
USIN
ESS R
EV
IEW
GO
VE
RN
AN
CE
AN
NU
AL FIN
AN
CIA
L STATE
ME
NTS
SHA
RE
HO
LDE
R IN
FOR
MA
TION
154
NOTICE OF ANNUAL GENERAL MEETING continued
IdentificationIn terms of Section 63(1) of the Companies Act, before any person may attend or participate in an Annual General
Meeting, that person must present reasonably satisfactory identification and the person presiding at the Annual General
Meeting must be reasonably satisfied that the right of the person to participate in and vote at the Annual General
Meeting, either as a shareholder, or as a proxy for a shareholder, has been reasonably verified.
Voting and proxiesOn a show of hands, every shareholder who is present in person or by proxy at the Annual General Meeting shall have
one vote, and on a poll, every shareholder who is present in person or by proxy at the Annual General Meeting or which
(being a company or body corporate) is represented, shall have one vote for every ordinary share in the Company of
which such shareholder is the holder.
Dematerialised shareholders (who are not “own name” dematerialised shareholders) who wish to attend the Annual
General Meeting or to vote by way of proxy, must contact their Central Securities Depository Participant (“CSDP”) or
broker who will furnish them with the necessary authority to attend the Annual General Meeting or they must provide
their CSDP or broker with their voting instructions in terms of the relevant custody agreement entered into between
them and their CSDP or broker.
Shareholders entitled to attend and vote at the Annual General Meeting may appoint one or more persons as such
shareholder’s proxy to attend, speak and vote in their stead. A proxy need not be a shareholder of the Company.
A form of proxy is attached for the convenience of certificated shareholders and “own name” dematerialised shareholders
only, who are unable to attend the Annual General Meeting, but who wish to be represented thereat. In order to be
valid, duly completed forms of proxy must be received by the transfer secretaries of the Company, Computershare
Investor Services 2004 Proprietary Limited, 70 Marshall Street, Johannesburg 2001 (PO Box 61051, Marshalltown, 2107)
by not later than 11:00 on Tuesday, 3 November 2015.
By order of the Board
Sureya Naidoo
Company Secretary
2 Harries Road, Illovo
6 October 2015
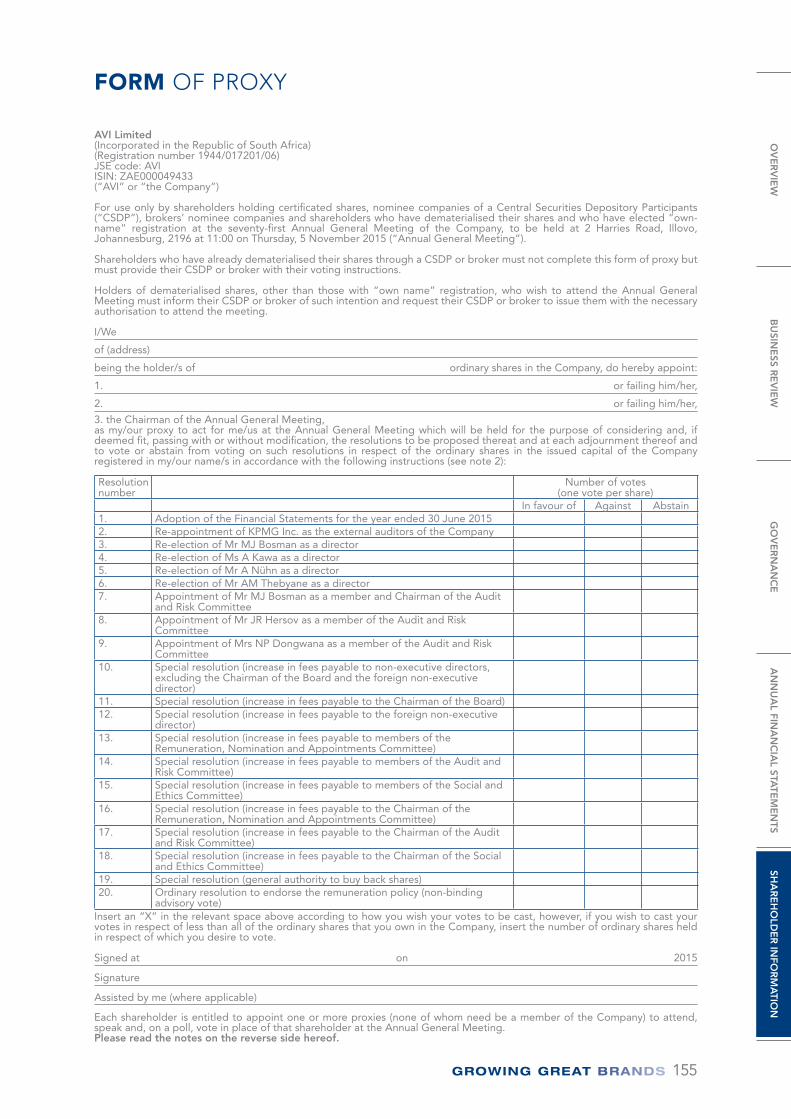
155
FORM OF PROXY
AVI Limited(Incorporated in the Republic of South Africa)(Registration number 1944/017201/06)JSE code: AVIISIN: ZAE000049433(“AVI” or “the Company”)
For use only by shareholders holding certificated shares, nominee companies of a Central Securities Depository Participants (“CSDP”), brokers’ nominee companies and shareholders who have dematerialised their shares and who have elected “own-name” registration at the seventy-first Annual General Meeting of the Company, to be held at 2 Harries Road, Illovo, Johannesburg, 2196 at 11:00 on Thursday, 5 November 2015 (“Annual General Meeting”).
Shareholders who have already dematerialised their shares through a CSDP or broker must not complete this form of proxy but must provide their CSDP or broker with their voting instructions.
Holders of dematerialised shares, other than those with “own name” registration, who wish to attend the Annual General Meeting must inform their CSDP or broker of such intention and request their CSDP or broker to issue them with the necessary authorisation to attend the meeting.
I/We
of (address)
being the holder/s of ordinary shares in the Company, do hereby appoint:
1. or failing him/her,
2. or failing him/her,
3. the Chairman of the Annual General Meeting,as my/our proxy to act for me/us at the Annual General Meeting which will be held for the purpose of considering and, if deemed fit, passing with or without modification, the resolutions to be proposed thereat and at each adjournment thereof and to vote or abstain from voting on such resolutions in respect of the ordinary shares in the issued capital of the Company registered in my/our name/s in accordance with the following instructions (see note 2):
Resolution number
Number of votes (one vote per share)
In favour of Against Abstain1. Adoption of the Financial Statements for the year ended 30 June 20152. Re-appointment of KPMG Inc. as the external auditors of the Company3. Re-election of Mr MJ Bosman as a director4. Re-election of Ms A Kawa as a director5. Re-election of Mr A Nühn as a director6. Re-election of Mr AM Thebyane as a director7. Appointment of Mr MJ Bosman as a member and Chairman of the Audit
and Risk Committee 8. Appointment of Mr JR Hersov as a member of the Audit and Risk
Committee9. Appointment of Mrs NP Dongwana as a member of the Audit and Risk
Committee10. Special resolution (increase in fees payable to non-executive directors,
excluding the Chairman of the Board and the foreign non-executive director)
11. Special resolution (increase in fees payable to the Chairman of the Board)12. Special resolution (increase in fees payable to the foreign non-executive
director)13. Special resolution (increase in fees payable to members of the
Remuneration, Nomination and Appointments Committee)14. Special resolution (increase in fees payable to members of the Audit and
Risk Committee)15. Special resolution (increase in fees payable to members of the Social and
Ethics Committee)16. Special resolution (increase in fees payable to the Chairman of the
Remuneration, Nomination and Appointments Committee)17. Special resolution (increase in fees payable to the Chairman of the Audit
and Risk Committee)18. Special resolution (increase in fees payable to the Chairman of the Social
and Ethics Committee)19. Special resolution (general authority to buy back shares)20. Ordinary resolution to endorse the remuneration policy (non-binding
advisory vote)Insert an “X” in the relevant space above according to how you wish your votes to be cast, however, if you wish to cast your votes in respect of less than all of the ordinary shares that you own in the Company, insert the number of ordinary shares held in respect of which you desire to vote.
Signed at on 2015
Signature
Assisted by me (where applicable)
Each shareholder is entitled to appoint one or more proxies (none of whom need be a member of the Company) to attend, speak and, on a poll, vote in place of that shareholder at the Annual General Meeting.Please read the notes on the reverse side hereof.
OV
ER
VIE
WB
USIN
ESS R
EV
IEW
GO
VE
RN
AN
CE
AN
NU
AL FIN
AN
CIA
L STATE
ME
NTS
SHA
RE
HO
LDE
R IN
FOR
MA
TION
156
NOTES TO FORM OF PROXY
1. A shareholder may insert the name of a proxy or the names of two alternative proxies of the shareholder’s choice in the space/s provided, with or without deleting “the Chairman of the Annual General Meeting”, but any such deletion must be initialled by the shareholder concerned. The person whose name stands first on the form of proxy and who is present at the Annual General Meeting will be entitled to act as proxy to the exclusion of those whose names follow.
2. Please insert an “X” in the relevant spaces according to how you wish your votes to be cast. However, if you wish to cast your votes in respect of a lesser number of shares than you own in the Company, insert the number of ordinary shares held in respect of which you wish to vote. Failure to comply with the above will be deemed to authorise the Chairman of the Annual General Meeting, if he is the proxy, to vote in favour of and any other proxy to vote or to abstain from voting in respect of the resolutions to be considered at the Annual General Meeting as he/she deems fit, in either case, in respect of all the shareholder’s votes exercisable thereat. A shareholder or the proxy is not obliged to exercise all the votes exercisable by the shareholder or by the proxy, but the total of the votes cast and in respect whereof abstention is recorded may not exceed the total of the votes exercisable by the shareholder or by the proxy.
3. Duly completed forms of proxy must be received at the office of the transfer secretaries, Computershare Investor Services 2004 Proprietary Limited, Ground Floor, 70 Marshall Street, Johannesburg, 2001 or posted to PO Box 61051, Marshalltown, 2107 to be received by not later than 11:00 on Tuesday, 3 November 2015.
4. The completion and lodging of this form of proxy will not preclude the relevant shareholder from attending the Annual General Meeting and speaking and voting in person thereat to the exclusion of any proxy appointed in terms hereof. The appointment of a proxy or proxies is furthermore revocable, in which case a shareholder may revoke the proxy appointment by cancelling it in writing or making a later inconsistent appointment of a proxy, and delivering a copy of the revocation instrument to the proxy and to the Company.
5. Documentary evidence establishing the authority of a person signing this form of proxy in a representative capacity must be attached to this form of proxy unless previously recorded by the Company’s transfer secretaries or waived by the Chairman of the Annual General Meeting.
6. Any alteration or correction made to this form of proxy must be initialled by the signatory/ies.
7. A minor must be assisted by his/her parent or guardian unless the relevant documents establishing his/her legal capacity are produced or have been registered by the transfer secretaries of the Company.
8. The Chairman of the Annual General Meeting may reject or accept a form of proxy which is completed and/or received other than in accordance with these notes if he is satisfied as to the manner in which the shareholder wishes to vote.
9. If the instrument appointing a proxy or proxies has been delivered to the Company, as long as that appointment remains in effect, any notice that is required by the Companies Act or the Company’s Memorandum of Incorporation to be delivered by the Company to the shareholder must be delivered by the Company to the shareholder, or to the proxy or proxies, if the shareholder has directed the Company to do so in writing and paid any reasonable fee charged by the Company for doing so.
10. The appointment of a proxy or proxies remains valid only until the end of the Annual General Meeting subject to any revocation thereof.
ADMINISTRATION AND PRINCIPAL SUBSIDIARIES
BASTION GRAPHICS
Administration Company registrationAVI Limited (“AVI”)Registration number 1944/017201/06Share code: AVIISIN: ZAE000049433
Company secretarySureya Naidoo
Business address and registered office2 Harries RoadIllovoJohannesburg 2196South Africa
Postal addressPO Box 1897Saxonwold 2132South Africa
Telephone: +27 (0)11 502 1300Telefax: +27 (0)11 502 1301E-mail: [email protected]: www.avi.co.za
AuditorsKPMG Inc.
SponsorThe Standard Bank of South Africa Limited
Commercial bankersStandard BankFirstRand Bank
Transfer secretariesComputershare Investor Services Proprietary LimitedBusiness address70 Marshall StreetMarshalltownJohannesburg 2001South Africa
Postal addressPO Box 61051Marshalltown 2107South Africa
Telephone: +27 (0)11 370 5000Telefax: +27 (0)11 370 5271
Principal subsidiariesFood and Beverage brandsNational Brands LimitedRegistration number 1948/029389/06(incorporating Entyce Beverages and Snackworks)30 Sloane StreetBryanston 2021
PO Box 5159Rivonia 2128
Managing directorsSarah-Anne Orphanides (Entyce Beverages)Telephone: +27 (0)11 707 7100Telefax: +27 (0)11 707 7799
Gaynor Poretti (Snackworks)Telephone: +27 (0)11 707 7200Telefax: +27 (0)11 707 7799
I&JIrvin & Johnson Holding Company Proprietary LimitedRegistration number 2004/013127/07
1 Davidson StreetWoodstockCape Town 7925
Postal addressPO Box 1628Cape Town 8000
Managing directorJonty JankovichTelephone: +27 (0)21 440 7800Telefax: +27 (0)21 440 7270
Fashion brandsPersonal CareIndigo Brands Proprietary LimitedRegistration number 2003/009934/0716 – 20 Evans AvenueEpping 1 7460
PO Box 3460Cape Town 8000
Managing directorRobert LuntTelephone: +27 (0)21 507 8500Telefax: +27 (0)21 507 8501
Footwear and ApparelA&D Spitz Proprietary LimitedRegistration number 1999/025520/0729 Eaton Avenue Bryanston 2021
PO Box 782916Sandton 2145
Acting managing directorSimon Crutchley Telephone: +27 (0)11 707 7300Telefax: +27 (0)11 707 7763
Green Cross Manufacturers Proprietary Limited Registration number 1994/08549/0726 – 30 Benbow AvenueEpping Industria7460
PO Box 396Epping Industria 7475
Managing directorGreg SmithTelephone: +27 (0)21 507 9700Telefax: +27 (0)21 507 9707
DirectorsExecutiveSimon CrutchleyChief executive officerOwen CresseyChief financial officerMichael Koursaris Business development director
Independent non-executiveGavin Tipper1 (Chairman)James Hersov2
Adriaan Nühn1, 4
Mike Bosman2
Andisiwe Kawa1 Abe Thebyane1
Neo Dongwana2, 3
Barry Smith3 (resigned 30 October 2014)Richard Inskip3
1 Member of the Remuneration, Nomination and Appointments Committee
2 Member of the Audit and Risk Committee
3 Member of the Social and Ethics Committee
4 Dutch