Embed Size (px)
Citation preview

AVIAN CENSUS TECHNIQUES:
Counting Crows (and other birds!)• Why count birds?• Descriptive Studies = asks “what types of birds
occur in a particular habitat?”- Provides gross overview of bird occurrence and
perhaps a crude estimate of abundance (e.g., common or rare)
• Distribution Studies = asks “where do or don’t birds occur?”- Provides a general picture of habitat associations

Why Count Birds? (cont.)
• Population Monitoring = asks “have bird densities within a particular area or within a given habitat changed over time?”
• Generally provides a more precise estimate of bird population densities within the study area for comparison with previous or later studies asking whether populations have changed.
• Works best if similar methods used during both study periods.

Why Count Birds? (cont.)
• Assessing Habitat Requirements = asks “do birds occur at higher or lower densities in different habitat types?”
• Provides information of what habitats support higher densities of particular bird species.
• Usually fairly precise measures of density are required for comparison among habitats.
• Often serve as “jumping off point” for additional studies detailing what particular features of the habitat are important to birds.

Why Count Birds? (cont.)
• Management Experiments = asks “do alterations of the habitat (e.g., logging, grazing, fire, restoration) impact bird densities with a habitat?”
• Fairly accurate measures of density are required for comparisons of pre- and post-treatment effects.
• Some attempt to control for confounding factors must be made.
Additional Factors to Consider
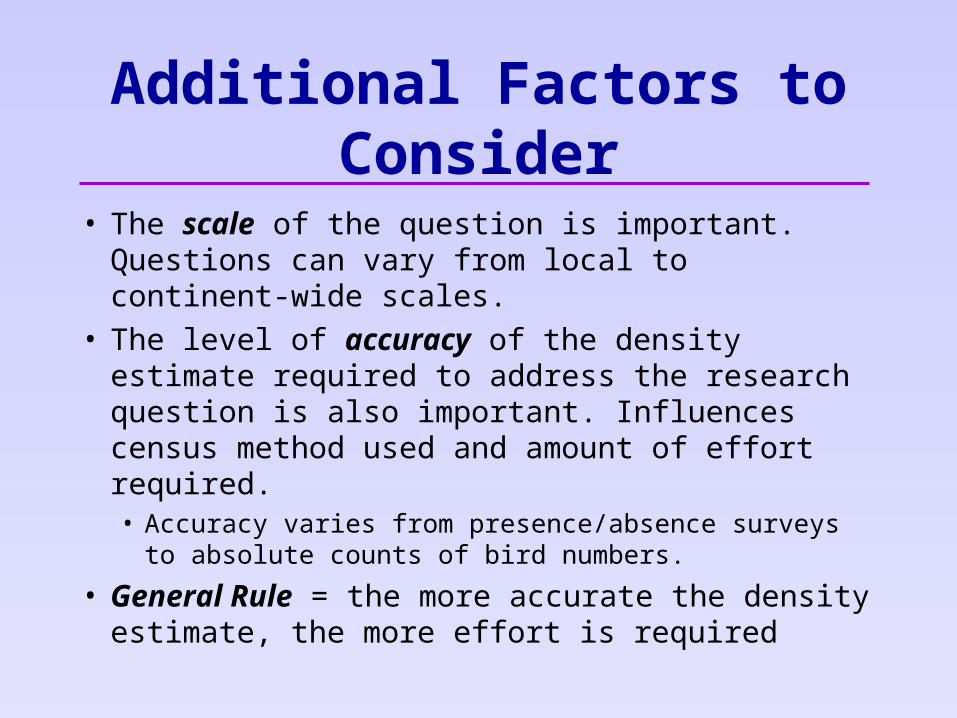
• The scale of the question is important. Questions can vary from local to continent-wide scales.
• The level of accuracy of the density estimate required to address the research question is also important. Influences census method used and amount of effort required. • Accuracy varies from presence/absence surveys to
absolute counts of bird numbers.
• General Rule = the more accurate the density estimate, the more effort is required

Relationship betweencount accuracy and effort
requiredExample: Magpie
Nest records -last 5 years Sample Surveys
CompleteMapping
Types of Surveys
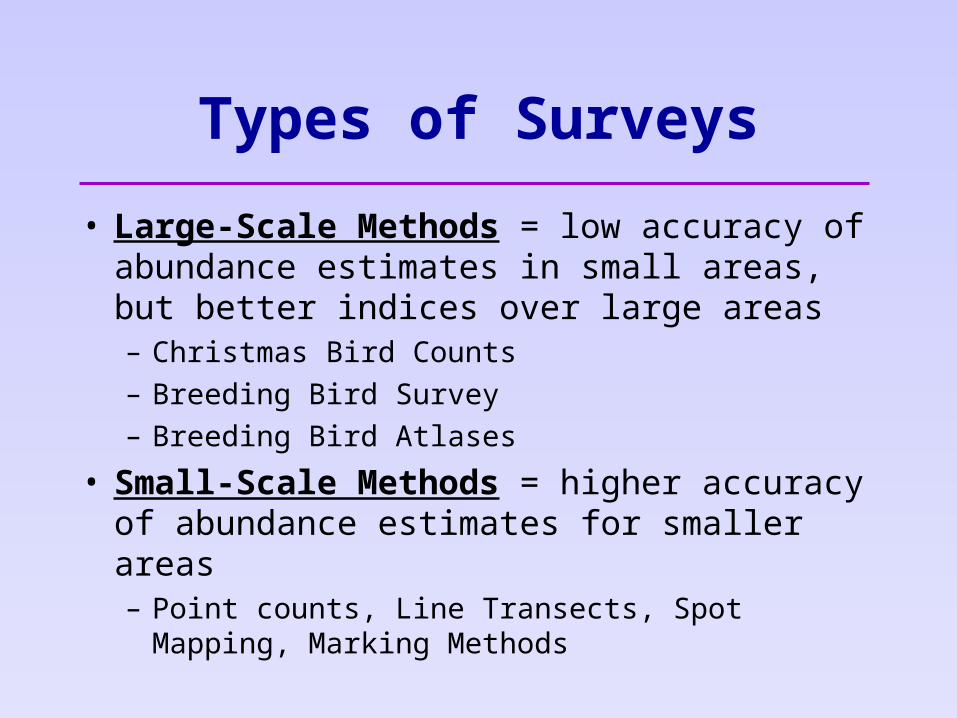
• Large-Scale Methods = low accuracy of abundance estimates in small areas, but better indices over large areas– Christmas Bird Counts
– Breeding Bird Survey
– Breeding Bird Atlases
• Small-Scale Methods = higher accuracy of abundance estimates for smaller areas– Point counts, Line Transects, Spot Mapping, Marking
Methods

Christmas Bird Counts
• Initiated in 1900 by National Audubon Society.
• Currently occur throughout North America (and in a number of other locations as well).
• Scheduled annually during the three weeks around Christmas, so provides a measure of winter populations.

Christmas Bird Counts
• Description of Data Collection: – Observers cover a 15-mile diameter count circle,
established initially by the count compiler but repeated annually, and count all birds observed within one day.
– Usually groups of observers are assigned to a particular section of the count circle and spend all day there counting birds.
– A compiler is responsible for submitting the data summary for each location to the National Audubon Society. The NAS maintains the database and provides access to researchers.

Christmas Bird Counts
• Advantages = standardized count areas and timing, data from throughout the continent for assessing large-scale population questions.
• Potential for Errors = variability in coverage (few vs. many observers), variability in observer expertise, double-counting of birds, annual variations in weather. – However, over the long-term for the more common
species many of these errors are washed-out by the sheer volume of data collected.
• South Dakota currently has 17 CBCs.

Breeding Bird Survey
• Initiated in 1966 by the U.S. Fish and Wildlife Service (now part of the USGS)
• Currently extends throughout North America (although some regions receive much heavier coverage than other regions)
• 3700 active routes; 2900 surveyed annually
• Scheduled annually during the peak of the nesting season (primarily June), so provides a measure of breeding bird abundance

Breeding Bird Survey
• Description of Data Collection: – Volunteer observers conduct the BBS surveys. – Each route is a 24.5-mile transect (along roads);
consists of 50 stops at 1/2-mile intervals. – Surveys of routes begin at dawn. Each stop
lasts for 3 minutes and the observer records all birds seen or heard with 0.25-mile of the stop.
– Routes not conducted in poor weather. – Routes are randomly located in order to sample
representative habitats within a region.
Breeding Bird Survey
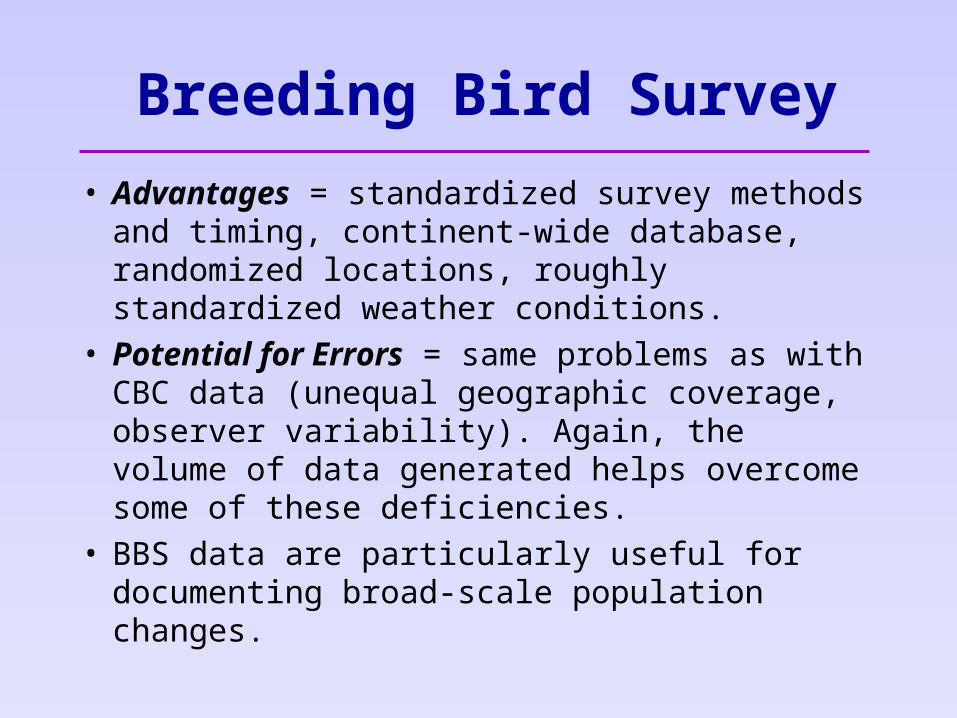
• Advantages = standardized survey methods and timing, continent-wide database, randomized locations, roughly standardized weather conditions.
• Potential for Errors = same problems as with CBC data (unequal geographic coverage, observer variability). Again, the volume of data generated helps overcome some of these deficiencies.
• BBS data are particularly useful for documenting broad-scale population changes.

Breeding Bird Atlases
• Conducted by individual states or provinces, modeled after atlases that were conducted in European countries.
• Carried out during the breeding season (May – July mainly).
• Blocks of habitat (9-square miles is common size) are surveyed by observers over a period of several years. Some blocks may be repeatedly visited, others visited only once during the study period.
• Rough estimates of abundance of individual species are often included.

Breeding Bird Atlases
• Provides good distributional data for species in a state or province.
• Abundance estimates crude enough so that they aren’t that useful for population monitoring (large changes required to detect population changes).
• Breeding evidence (nests, carrying food, courtship, copulation) and general habitat characteristics are also reported.
• Allows assessment of breeding distributions and broad-scale habitat preferences for individual species.
Point Counts
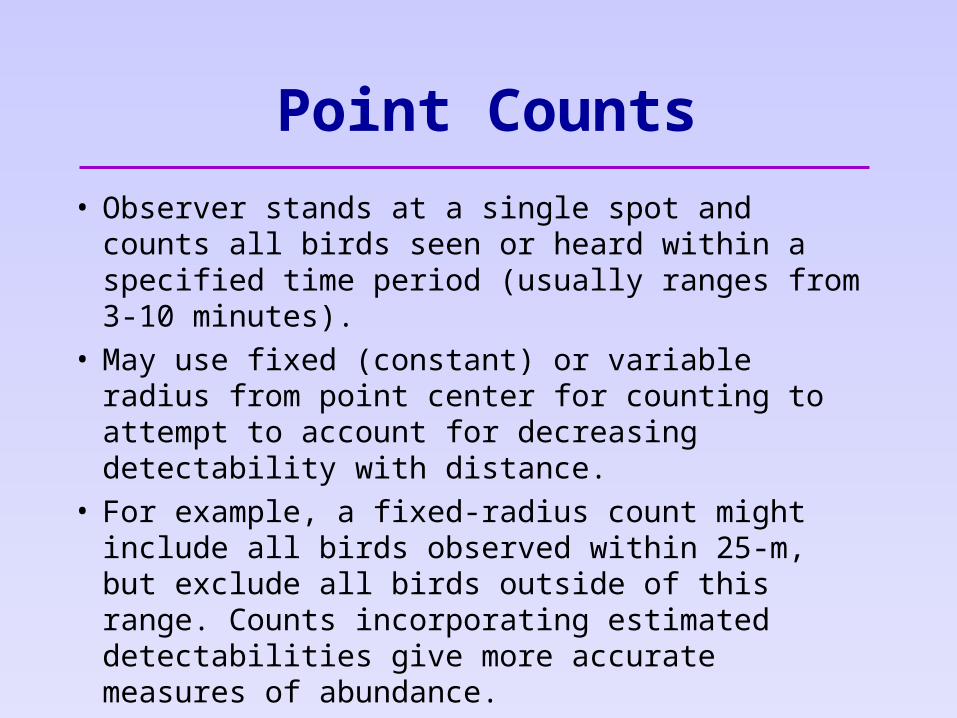
• Observer stands at a single spot and counts all birds seen or heard within a specified time period (usually ranges from 3-10 minutes).
• May use fixed (constant) or variable radius from point center for counting to attempt to account for decreasing detectability with distance.
• For example, a fixed-radius count might include all birds observed within 25-m, but exclude all birds outside of this range. Counts incorporating estimated detectabilities give more accurate measures of abundance.

Point Counts
• Multiple points are included within a particular type of habitat so that broad coverage of the habitat is obtained.
• Points may or may not be surveyed more than once during a particular season.
• If interested in abundance at particular sites, repetition of surveys at each point is recommended so that birds missed on one count might be observed on another visit.

Point Counts
• Provides fairly accurate measure of relative abundance for individual species.
• Counts not performed under adverse weather conditions.
• Sources of Error = observer ability, differences in detectability among species, mobility of bird species (mobile species may move in and out of the count area so the actual detection distance covered by the count is unknown).

Line Transects
• Observer slowly walks (1 km/hr) a transect, counting all birds seen or heard and measuring their distance from the transect line.
• Like point counts, transects may use a fixed or variable radius for detection to account for decreasing detectability with distance.
• Multiple transects within a particular habitat type are required for proper detection of the avifauna. Repeated visits are also recommended, if interested in site-specific abundances
• Transects not run during adverse weather.
Line Transects
• Better suited to open habitats, while point counts are better suited for dense habitats.
• Covers more of the habitat than do point counts. However, secretive birds in dense vegetation are often more likely to be detected if the observer stays still than if they are moving.
• Like point counts, measures relative abundance.• Sources of Error = essentially the same as for
point counts.
Spot Mapping
• Territories of individual pairs (of some or all species) within a given area (plot) are mapped.
• Requires multiple visits to properly determine boundaries of individual territories.
• Boundaries are determined by observation of territorial behavior of individuals (e.g., singing, chases, etc.).

Spot mappingExample

Spot Mapping
• Method is more difficult to carry out in densely vegetated habitats, particularly those with tall trees (e.g., dense forests).
• Size of the plot mapped depends on vegetation structure and bird densities.
• General Rule = denser vegetation and higher densities require smaller plot sizes.
• Surveys usually conducted in the morning and early in the breeding season, when territorial activity is at its peak.

Spot Mapping• Sources of Error = changes in territorial behavior over the
breeding season, differences in territorial behavior among species, inaccurate mapping of territories, misidentifying individuals, differences in observer effort among studies.
• Some of these sources of errors (e.g., inaccurate mapping, misidentifying individuals) can be minimized by multiple visits.
• This is the most time-consuming of the general density estimate methods (point counts, line transects, and spot-mapping), but has the potential to be the most accurate.
• Only accurate if all territories are correctly mapped.

Comparisons of Methods
• Comparisons of these methods suggests that, with repeated visits, they all serve fairly well as measures of relative abundance.
• However, density estimates can sometimes vary widely among the three methods.
• In reality, only the spot-mapping method is a true measure of density.
• This is because the other methods allow for movement of birds into the count area during the count period, so the actual area covered is unknown and varies among species.

Marking Methods
• Involves marking some individuals in a population (with a band, color-marking, etc.) and then using individuals captured per unit effort as an index of relative abundance (capture rates).
• Sources of Error = differences in vegetation structure, differences in capture probabilities among species.

Marking Methods
• Some authors suggest that these problems make capture rates useless for measures of relative abundance, but if capture effort is standardized within a given vegetation type, this method is especially useful for monitoring population changes within species.
• Used in conjunction other survey methods (point counts, etc.), it can also provide a clearer picture of relative abundances of birds within or among particular habitats.

Marking Methods• Mist-netting, for example, is biased against
species that spend most of their time high in the canopy or don’t move around much, but is pretty good at sampling secretive understory species.
• Count methods are usually biased against secretive understory species because they are more difficult to detect.
• Biases of the two methods counteract each other.• Combining count surveys and mist-netting is now
being encouraged to better document relative abundance of birds within a habitat.
Mark-Recapture Methods
• A variation of the marking method, known as the Mark-Recapture Method, can actually provide density estimates for some species.
• This procedure involves marking individuals, then later recapturing some of these individuals and using the number of individuals recaptured out of the total number of individuals captured as an index of population size.
• Involves some fairly complex mathematical calculations.
Mark-Recapture Methods
• Usually used for only a single, or at most a few, species within a habitat.
• A long list of assumptions must be met for this method to work as a proper index of relative abundance (e.g., no dispersal, no effect of marking on behavior, capture probability does not differ temporally), although some methods mathematically account for violation of some of these assumptions.
• Mark-recapture methods are much more time-intensive than general marking methods.


![crows nest 02.01.10_issue15[1]](https://img.pdfslide.net/doc/110x75/568c4e091a28ab4916a650e8/crows-nest-020110issue151.jpg)

![crows nest 04.26.10_issue26final[2]](https://img.pdfslide.net/doc/110x75/568c34441a28ab02358fccbd/crows-nest-042610issue26final2.jpg)