Embed Size (px)
Citation preview
June 2002 • NREL/TP-500-30844
Avian Hearing and the Avoidance of Wind Turbines
R. Dooling, Ph.D. University of Maryland College Park, Maryland
National Renewable Energy Laboratory 1617 Cole Boulevard Golden, Colorado 80401-3393 NREL is a U.S. Department of Energy LaboratoryOperated by Midwest Research Institute • Battelle • Bechtel
Contract No. DE-AC36-99-GO10337
June 2002 • NREL/TP-500-30844
Avian Hearing and the Avoidance of Wind Turbines
R. Dooling, Ph.D. University of Maryland College Park, Maryland Prepared under Task No. WER2.1610
National Renewable Energy Laboratory 1617 Cole Boulevard Golden, Colorado 80401-3393 NREL is a U.S. Department of Energy LaboratoryOperated by Midwest Research Institute • Battelle • Bechtel
Contract No. DE-AC36-99-GO10337
NOTICE
This report was prepared as an account of work sponsored by an agency of the United States government. Neither the United States government nor any agency thereof, nor any of their employees, makes any warranty, express or implied, or assumes any legal liability or responsibility for the accuracy, completeness, or usefulness of any information, apparatus, product, or process disclosed, or represents that its use would not infringe privately owned rights. Reference herein to any specific commercial product, process, or service by trade name, trademark, manufacturer, or otherwise does not necessarily constitute or imply its endorsement, recommendation, or favoring by the United States government or any agency thereof. The views and opinions of authors expressed herein do not necessarily state or reflect those of the United States government or any agency thereof.
Available electronically at http://www.osti.gov/bridge
Available for a processing fee to U.S. Department of Energy and its contractors, in paper, from:
U.S. Department of Energy Office of Scientific and Technical Information P.O. Box 62 Oak Ridge, TN 37831-0062 phone: 865.576.8401 fax: 865.576.5728 email: [email protected]
Available for sale to the public, in paper, from: U.S. Department of Commerce National Technical Information Service 5285 Port Royal Road Springfield, VA 22161 phone: 800.553.6847 fax: 703.605.6900 email: [email protected] online ordering: http://www.ntis.gov/ordering.htm
Printed on paper containing at least 50% wastepaper, including 20% postconsumer waste
Table of Contents
Executive Summary and Recommendation ...........................................................................1
Hearing in Birds in Quiet and in Noise..................................................................................3
Avian Audibility Curves – Absolute Thresholds and Bandwidths..................................3
Species Differences in Audibility Curves........................................................................3
The Significance of Poor High- and Low-Frequency Hearing in Birds ..........................5
Noise Levels, Spectra, and Decibels – Overall Noise Level Versus Spectrum Level.....5
Masking – the Effect of Noise on Signal Detection ........................................................6
Environmental Noise Versus Wind Turbine Noise .........................................................8
Detectability of Wind Turbine Blade Noise ....................................................................10
Object Localization Versus Acoustic Deterrents .............................................................12
Recommendations..................................................................................................................13
References..............................................................................................................................14
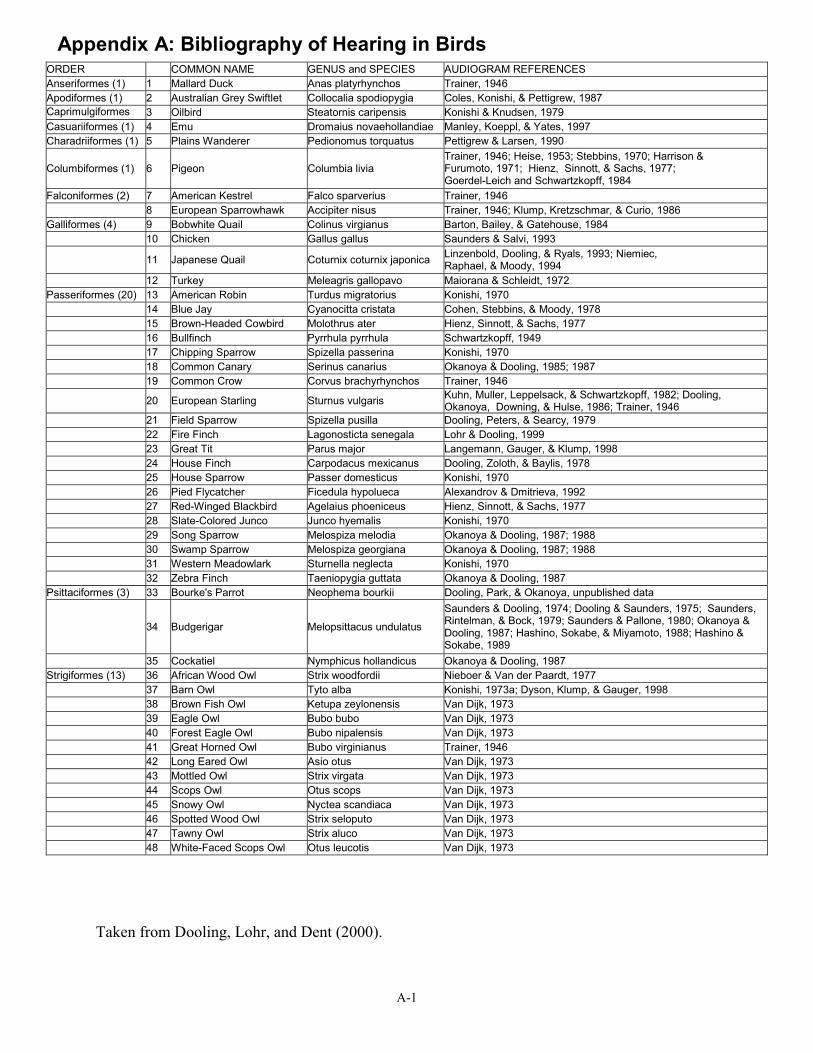
Appendix A: Bibliography of Hearing in Birds.....................................................................A-1
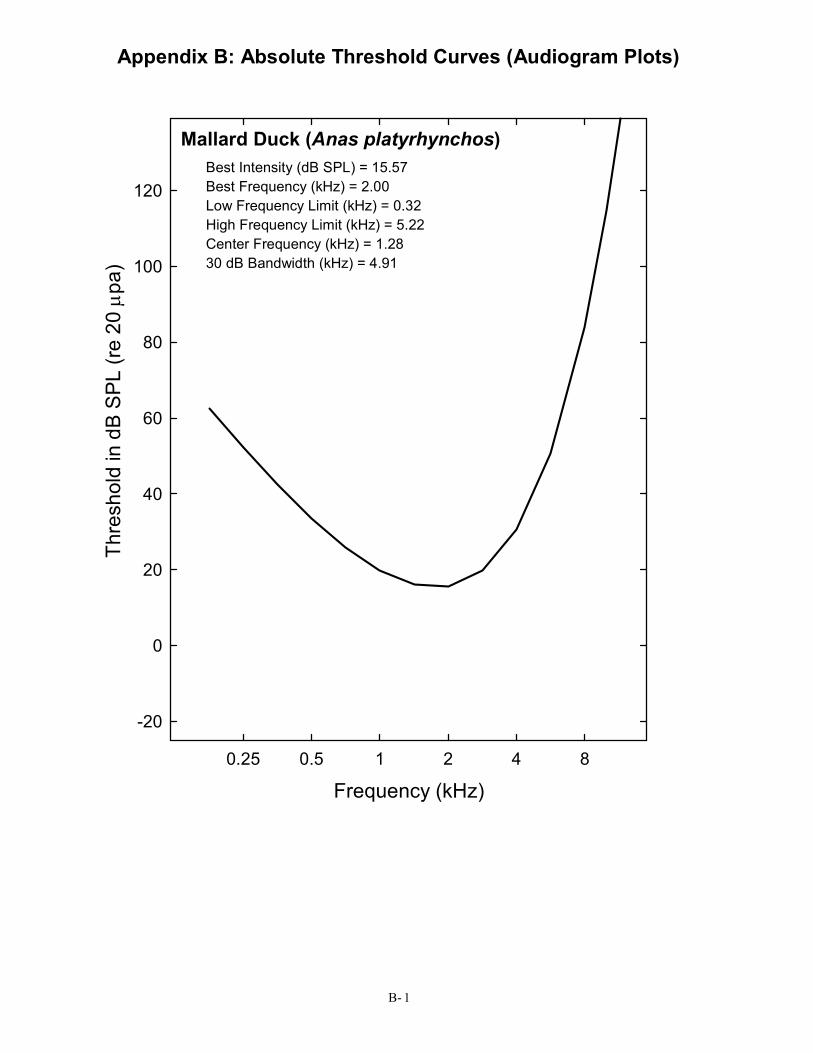
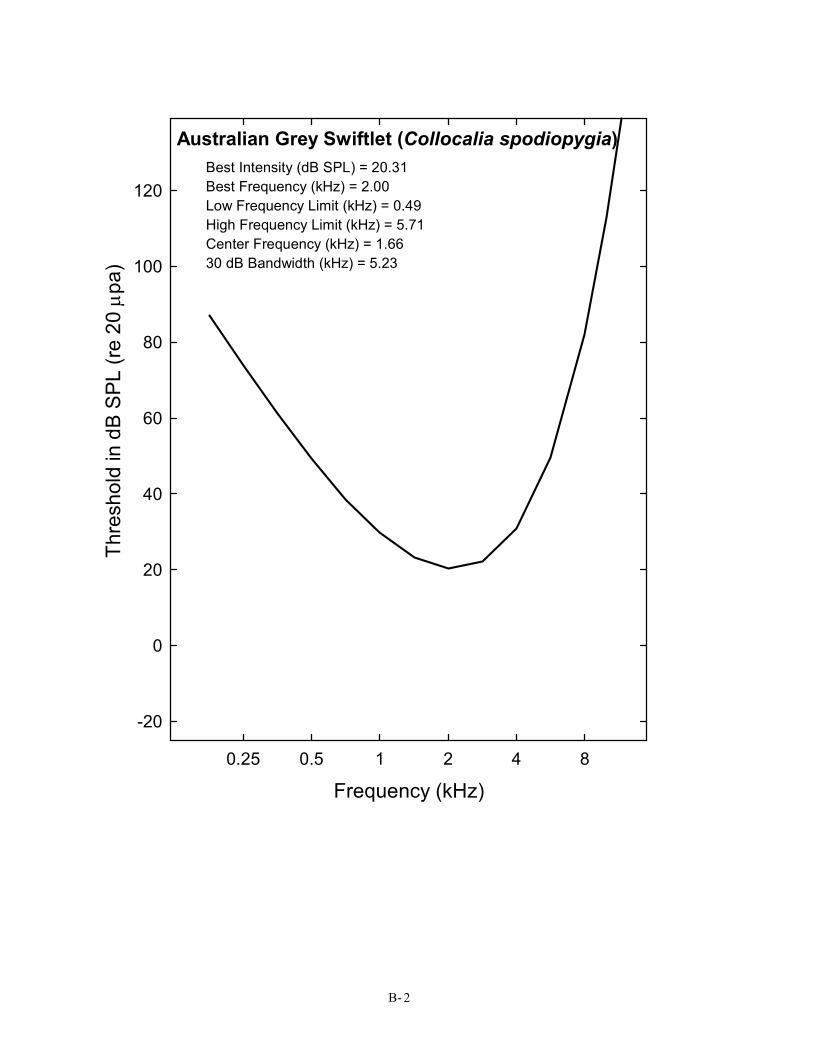
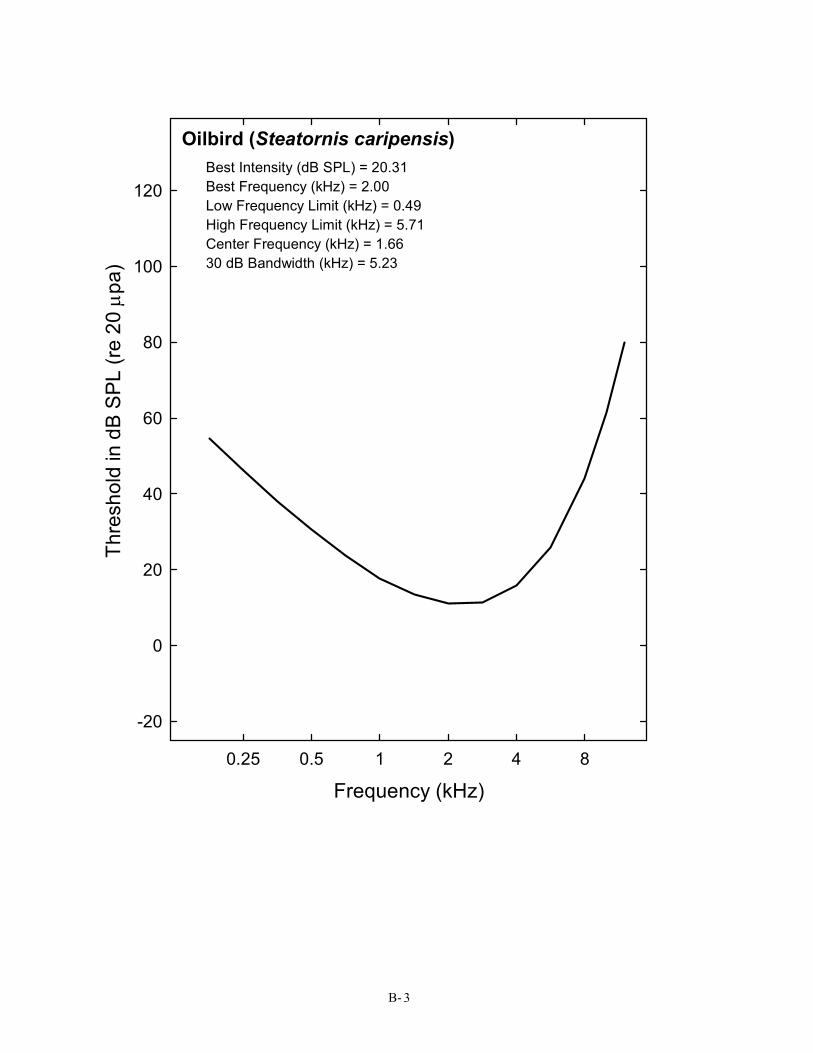
Appendix B: Absolute Threshold Curves (Audiogram Plots) ...............................................B-1
Appendix C: Bibliography of Masked Thresholds ................................................................C-1
Appendix D: Plots of Masked Threshold Curves ..................................................................D-1
iii
Executive Summary and Recommendations
This report provides a complete summary of what is known about basic hearing capabilities in birds in relation to the characteristics of noise generated by wind turbines. It is a review of existing data on bird hearing with some preliminary estimates of environmental noise and wind turbine noise at Altamont Pass, California, in the summer of 1999. It is intended as a resource in future discussions of the role that hearing might play in bird avoidance of turbines.
The main body of this report describes hearing measurement in birds, the effects of noise on hearing, and the relationship between avian hearing and the general noise levels around wind turbines. The main body is followed by four appendices. Appendix A is a table organized by species which provides a comprehensive bibliography of the literature on hearing in the quiet (audiograms) in birds, followed by Appendix B which provides plots of the audiograms from 49 species of birds that have been tested to date. Similarly, a bibliography of the literature on how birds hear in noise is given in a table in Appendix C, with corresponding plots of masked auditory thresholds in Appendix D.
There are a number of long-standing myths about what birds can or cannot hear. One myth is that birds hear better at high frequencies than do humans or other mammals. Another myth is that birds have exceptionally acute hearing. A considerable amount of work over the past 50 years has repeatedly shown that neither of these notions is true. When hearing is defined as the softest sound that can be heard at different frequencies, birds on average hear less well than many mammals, including humans.
Birds hear best between about 1 and 5 kHz. Acoustic deterrents or “scarecrow” devices are not generally effective because birds habituate to them and eventually ignore them completely. Devices that purport to use sound frequencies outside the hearing range of humans are most certainly inaudible to birds as well because birds have a narrower range of hearing than humans do. A review of the literature on how well birds can hear in noisy (windy) conditions suggests that birds cannot hear the noise from wind turbine blades as well as humans can. In practical terms, a human with normal hearing can probably hear a wind turbine blade twice as far away as can the average bird.
Some wind turbine blades whistle due to blade defects. Depending on the sound level of the whistle produced from a blade defect and the level of the background noise, blade whistles may help birds avoid turbine blades. Because turbine noise and wind noise are predominantly low frequency, almost all the contribution to an overall sound pressure level reading [e.g., 65 dB(A) SPL], comes from frequencies below 1 – 2 kHz. This means that adding an acoustic cue in the region of best hearing for birds (2 – 4 kHz) would add almost nothing to overall sound pressure level but might help birds hear the blades. The existence of blade defects that produce whistles suggests that minor modifications to the acoustic signature of a turbine blade, in the form of whistles, could make blades more audible to birds and at the same time make no measurable contribution to overall noise level.
It is entirely possible, however, that as birds approach a wind turbine, especially under high wind conditions, they lose the ability to see the blade (because of motion smear) before they are close
1
enough to hear the blade. The hypothesis that louder (to birds) blade noises result in fewer fatalities is untested. Making the necessary noise measurements and comparing fatalities at turbines with noticeable whistles with those having no whistles provide one test of this hypothesis.
2
Hearing in Birds in Quiet and in Noise
The sense of hearing in animals may be studied using anatomical, physiological, and behavioral approaches, and each method has advantages and disadvantages. Hearing is traditionally and most generally defined as the behavioral response to sound involving the whole, awake organism. The data presented below are almost completely from behavioral or psychoacoustic procedures, which are the most direct and most appropriate means of assessing an animal’s hearing capabilities. In a few cases, data are considered from physiological approaches in which there is strong evidence that the particular methods used correlate well with other (behavioral) estimates of absolute sensitivity and hearing range. In addition to hearing threshold curves or audibility curves, behavioral data are presented on how well birds hear in noise – a condition that is more relevant to the problem of detecting wind turbine noise than is absolute threshold or threshold in the quiet.
Avian Audibility Curves – Absolute Thresholds and Bandwidths
The minimum audible sound pressure that can be detected at frequencies throughout an animal’s range of hearing defines the audibility curve. This is the most basic measure of hearing and one most people are familiar with from having their own hearing tested. Over the past 50 years, behavioral audibility curves have been collected for 39 species of birds, and this database can be extended by another 10 species of birds by including data from physiological recordings. The references to these papers are given in Appendix A. Birds were typically tested at frequencies between about 0.5 to 10.0 kHz, but all birds were not tested at exactly the same frequencies across these studies. The data for each species were fit with a polynomial function to provide a continuous curve describing the minimum audible sound pressure over the range of hearing for a particular species. This function was not selected for any theoretical reasons but simply because it provided the best fit to the most data nearly all the time. These audibility curves for each species are given in Appendix B. Summary data in each audiogram figure in Appendix B give the lowest intensity heard (best intensity), the frequency at which hearing is best (best frequency), the bandwidth of the audiogram 30 dB above the best frequency/lowest intensity, the low and high frequency limits of hearing (the frequencies at which thresholds are 30 dB above the best intensity), and the midfrequency of the audiogram (the midpoint between the low and high frequency limits of hearing on a log scale).
Species Differences in Audibility Curves
For a rough idea of the variation among species, average audibility curves are shown for three groups of birds: the Passeriformes (songbirds), the evolutionarily older orders of birds constituting many of the non-Passeriformes (Anseriformes, Caprimulgiformes, Casuariformes, Charadriiformes, Columbiformes, Falconiformes, Galliformes, and Psittaciformes), and a rather special group of birds that are nocturnal predators, the Strigiformes (Tytonidae and Strigidae). A complete list of the common names of the species tested is given in Appendix A. Roughly equal numbers of species have been tested behaviorally in each of these three broad groups of birds. Summarizing the data this way provides an idea of the variation in hearing sensitivity among birds. In general, there is less variation in hearing sensitivity among birds than among members of other vertebrate groups.
3
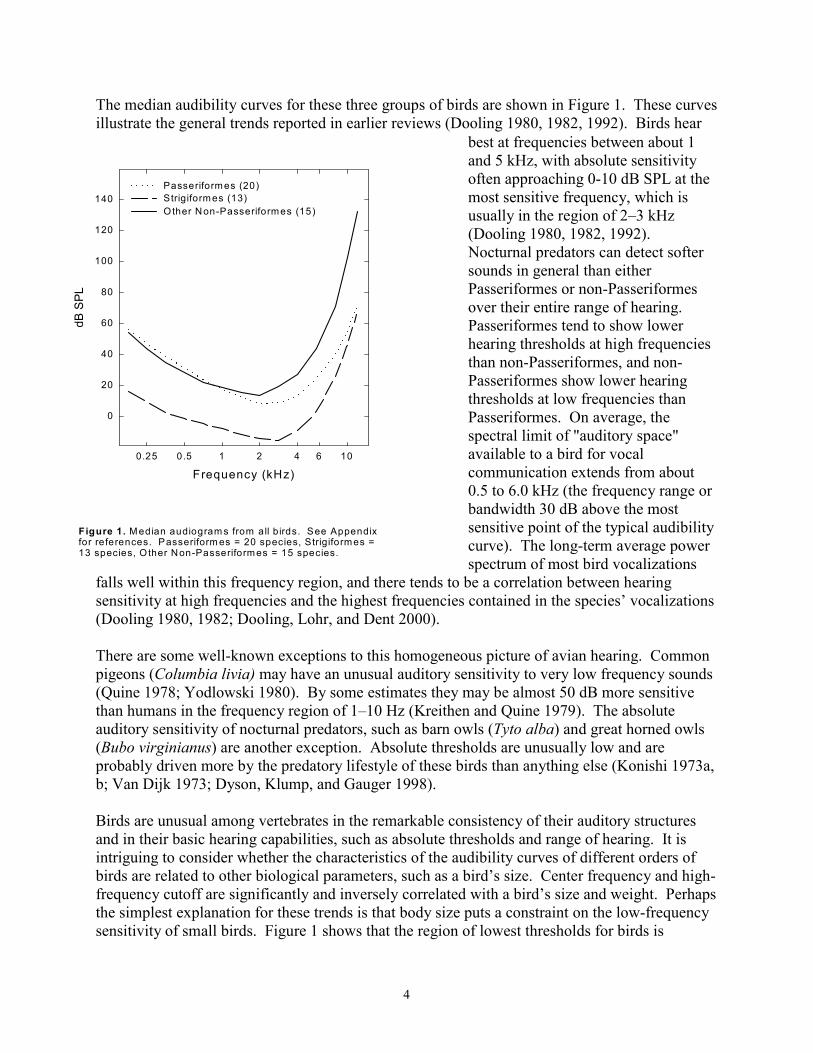
The median audibility curves for these three groups of birds are shown in Figure 1. These curves illustrate the general trends reported in earlier reviews (Dooling 1980, 1982, 1992). Birds hear
dB S
PL
140
120
100
80
60
40
20
0
O ther N on-Pass eriform e s (15)
Pass eriform e s (20) S trigifo rm e s (1 3)
0.25 0.5 1 2 4 6 10
Frequency (kHz)
best at frequencies between about 1 and 5 kHz, with absolute sensitivity often approaching 0-10 dB SPL at the most sensitive frequency, which is usually in the region of 2–3 kHz (Dooling 1980, 1982, 1992). Nocturnal predators can detect softer sounds in general than either Passeriformes or non-Passeriformes over their entire range of hearing. Passeriformes tend to show lower hearing thresholds at high frequencies than non-Passeriformes, and non-Passeriformes show lower hearing thresholds at low frequencies than Passeriformes. On average, the spectral limit of "auditory space" available to a bird for vocal communication extends from about 0.5 to 6.0 kHz (the frequency range or bandwidth 30 dB above the most
Figure 1. Median audiogram s from all b irds. See Appendix sensitive point of the typical audibility for references. Passeriform es = 20 species, Strigiformes = curve). The long-term average power13 species, O ther Non-Passeriformes = 15 species.
spectrum of most bird vocalizations falls well within this frequency region, and there tends to be a correlation between hearing sensitivity at high frequencies and the highest frequencies contained in the species’ vocalizations (Dooling 1980, 1982; Dooling, Lohr, and Dent 2000).
There are some well-known exceptions to this homogeneous picture of avian hearing. Common pigeons (Columbia livia) may have an unusual auditory sensitivity to very low frequency sounds (Quine 1978; Yodlowski 1980). By some estimates they may be almost 50 dB more sensitive than humans in the frequency region of 1–10 Hz (Kreithen and Quine 1979). The absolute auditory sensitivity of nocturnal predators, such as barn owls (Tyto alba) and great horned owls (Bubo virginianus) are another exception. Absolute thresholds are unusually low and are probably driven more by the predatory lifestyle of these birds than anything else (Konishi 1973a, b; Van Dijk 1973; Dyson, Klump, and Gauger 1998).
Birds are unusual among vertebrates in the remarkable consistency of their auditory structures and in their basic hearing capabilities, such as absolute thresholds and range of hearing. It is intriguing to consider whether the characteristics of the audibility curves of different orders of birds are related to other biological parameters, such as a bird’s size. Center frequency and high-frequency cutoff are significantly and inversely correlated with a bird’s size and weight. Perhaps the simplest explanation for these trends is that body size puts a constraint on the low-frequency sensitivity of small birds. Figure 1 shows that the region of lowest thresholds for birds is
4
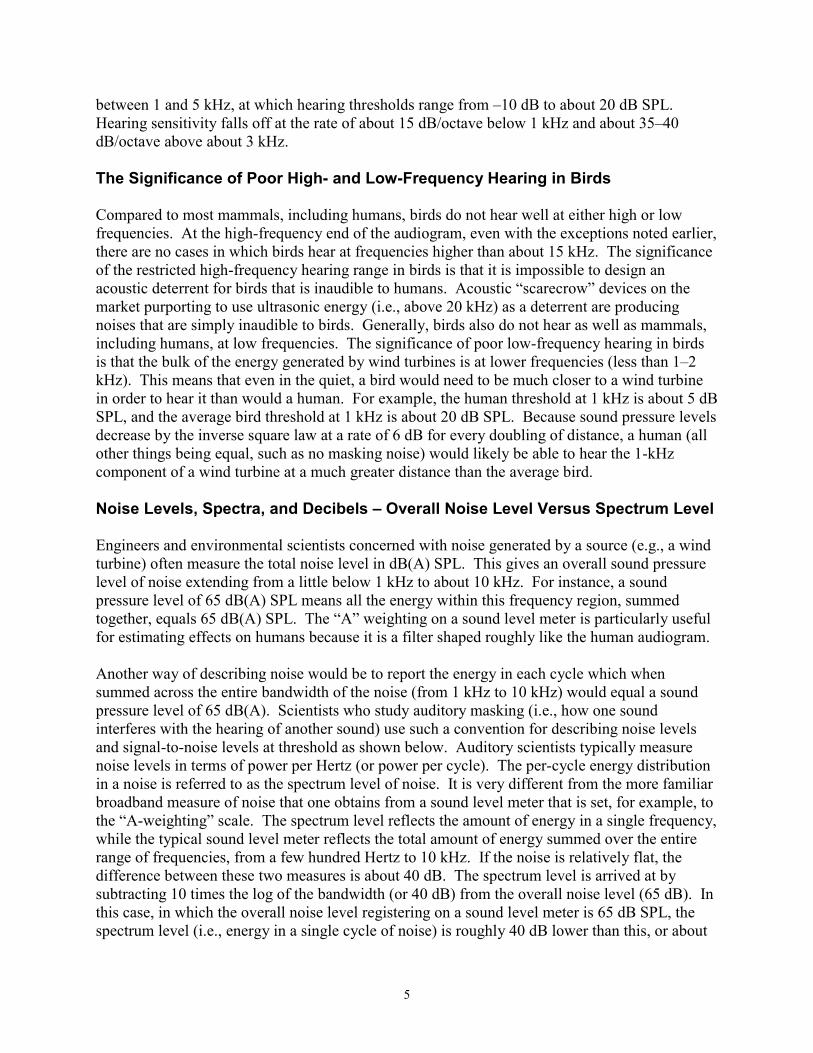
between 1 and 5 kHz, at which hearing thresholds range from –10 dB to about 20 dB SPL. Hearing sensitivity falls off at the rate of about 15 dB/octave below 1 kHz and about 35–40 dB/octave above about 3 kHz.
The Significance of Poor High- and Low-Frequency Hearing in Birds
Compared to most mammals, including humans, birds do not hear well at either high or low frequencies. At the high-frequency end of the audiogram, even with the exceptions noted earlier, there are no cases in which birds hear at frequencies higher than about 15 kHz. The significance of the restricted high-frequency hearing range in birds is that it is impossible to design an acoustic deterrent for birds that is inaudible to humans. Acoustic “scarecrow” devices on the market purporting to use ultrasonic energy (i.e., above 20 kHz) as a deterrent are producing noises that are simply inaudible to birds. Generally, birds also do not hear as well as mammals, including humans, at low frequencies. The significance of poor low-frequency hearing in birds is that the bulk of the energy generated by wind turbines is at lower frequencies (less than 1–2 kHz). This means that even in the quiet, a bird would need to be much closer to a wind turbine in order to hear it than would a human. For example, the human threshold at 1 kHz is about 5 dB SPL, and the average bird threshold at 1 kHz is about 20 dB SPL. Because sound pressure levels decrease by the inverse square law at a rate of 6 dB for every doubling of distance, a human (all other things being equal, such as no masking noise) would likely be able to hear the 1-kHz component of a wind turbine at a much greater distance than the average bird.
Noise Levels, Spectra, and Decibels – Overall Noise Level Versus Spectrum Level
Engineers and environmental scientists concerned with noise generated by a source (e.g., a wind turbine) often measure the total noise level in dB(A) SPL. This gives an overall sound pressure level of noise extending from a little below 1 kHz to about 10 kHz. For instance, a sound pressure level of 65 dB(A) SPL means all the energy within this frequency region, summed together, equals 65 dB(A) SPL. The “A” weighting on a sound level meter is particularly useful for estimating effects on humans because it is a filter shaped roughly like the human audiogram.
Another way of describing noise would be to report the energy in each cycle which when summed across the entire bandwidth of the noise (from 1 kHz to 10 kHz) would equal a sound pressure level of 65 dB(A). Scientists who study auditory masking (i.e., how one sound interferes with the hearing of another sound) use such a convention for describing noise levels and signal-to-noise levels at threshold as shown below. Auditory scientists typically measure noise levels in terms of power per Hertz (or power per cycle). The per-cycle energy distribution in a noise is referred to as the spectrum level of noise. It is very different from the more familiar broadband measure of noise that one obtains from a sound level meter that is set, for example, to the “A-weighting” scale. The spectrum level reflects the amount of energy in a single frequency, while the typical sound level meter reflects the total amount of energy summed over the entire range of frequencies, from a few hundred Hertz to 10 kHz. If the noise is relatively flat, the difference between these two measures is about 40 dB. The spectrum level is arrived at by subtracting 10 times the log of the bandwidth (or 40 dB) from the overall noise level (65 dB). In this case, in which the overall noise level registering on a sound level meter is 65 dB SPL, the spectrum level (i.e., energy in a single cycle of noise) is roughly 40 dB lower than this, or about
5
25 dB SPL, assuming the energy is equally distributed across the entire band.
This difference is relevant because overall sound pressure level readings from a sound level meter are used to describe the noise generated by a wind turbine blade, but the auditory system is only concerned with frequencies in the noise immediately surrounding the signal. The two are not the same. The spectrum level is the correct measure to use in estimating how close a bird must be to a turbine blade before it can hear it against a background of environmental (wind) noise. The spectrum level of noise is always lower than the overall level of noise. The spectrum level in the region of the signal is the most useful in calculating signal-to-noise ratios and estimating whether a sound is detectable in noise.
Another critical concept when considering signal levels, noise levels, and bandwidths of noise is that of the decibel. Because it is the logarithm of a ratio between two sound powers or pressures, decibels do not add in a simple way. In other words, summing two pure tones of 60 dB SPL does not result in a single pure tone of 120 dB SPL. By the same token, adding energy at a single frequency (e.g., 2 kHz) in a broadband noise (e.g., from 0.1 kHz to 10 kHz or 9,899 other frequencies) has little effect on the overall SPL measurement. That is because energy is summed over the entire band of noise so that the contribution of the 2 kHz component becomes very small indeed. These issues are relevant to the discussion below.
Masking – the Effect of Noise on Signal Detection
Absolute auditory sensitivity is, by definition, the minimum sound pressure level that can be heard in the quiet. It should be obvious that in normal everyday life — for humans or other animals — hearing is taking place against a background of noise. For animals, this background noise is usually environmental noise from a variety of sources, including wind, other animal vocalizations, and anthropogenic sources. It should come as no surprise that auditory scientists have spent a great deal of effort investigating the effect of noise on hearing a signal (i.e., masking) not just in humans but in many other animals, including a number of bird species. The present concern is with estimating at what distance a bird can hear the noise of a wind turbine blade in a background noise consisting predominantly of wind noise. There are no direct field data available on this point, but there are data from controlled masking conditions in the laboratory that can be used to provide estimates. Data from two kinds of masking experiments are described below that are particularly relevant for detecting wind turbine blades in a noisy environment.
Detection of tones in noise
Measuring pure tone thresholds in broadband noise is the simplest kind of masking experiment. In such an experiment, auditory scientists use the spectrum level (not overall sound pressure level) when describing the level of noise that masks a signal. This is because they know that it is the noise in the frequency region of a signal that is most important in masking the signal—not noise at more distant frequency regions. In a typical masking experiment, the ratio between the power in a pure tone at threshold and the power per Hertz (spectrum level) of the background noise is called the critical ratio.
6
Crit
ical
Rat
io (d
B)
35
30
25
20
15 0.25 0.5 1 2 4 8
G reat T it
Barn Owl Average of 10 Species of Birds Budgerigar
3 dB/octave
Humans
Frequency (kHz)
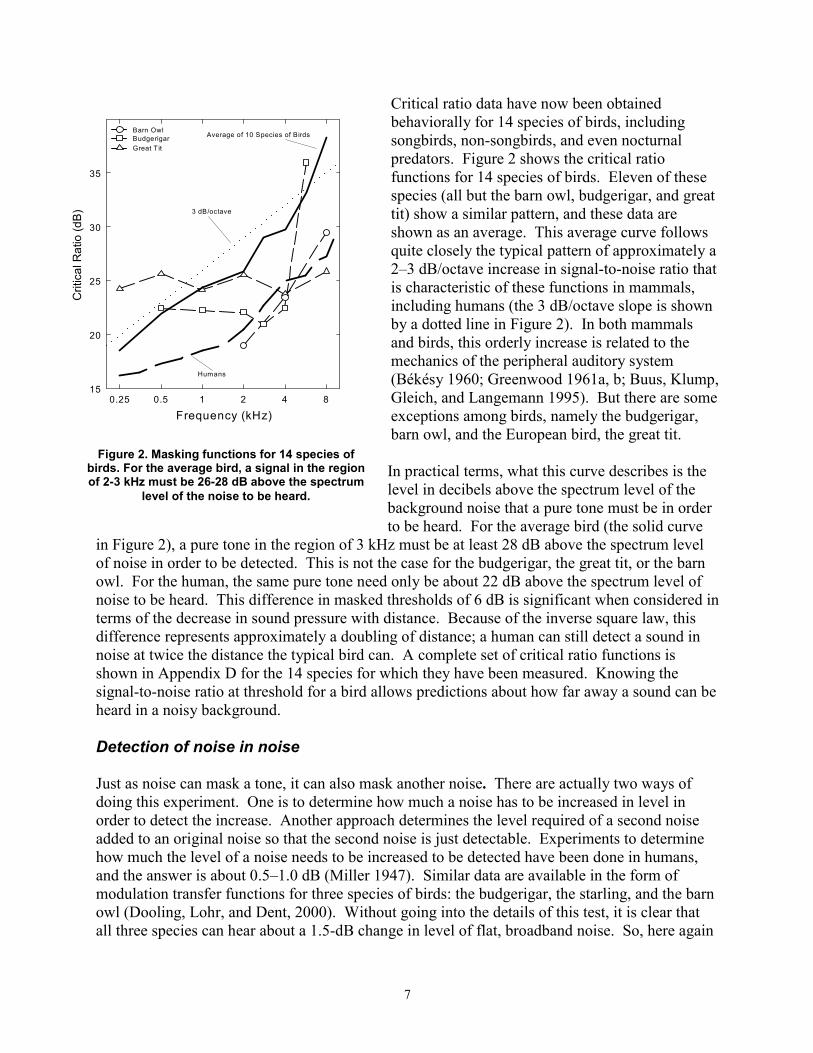
Figure 2. Masking functions for 14 species of birds. For the average bird, a signal in the region of 2-3 kHz must be 26-28 dB above the spectrum
level of the noise to be heard.
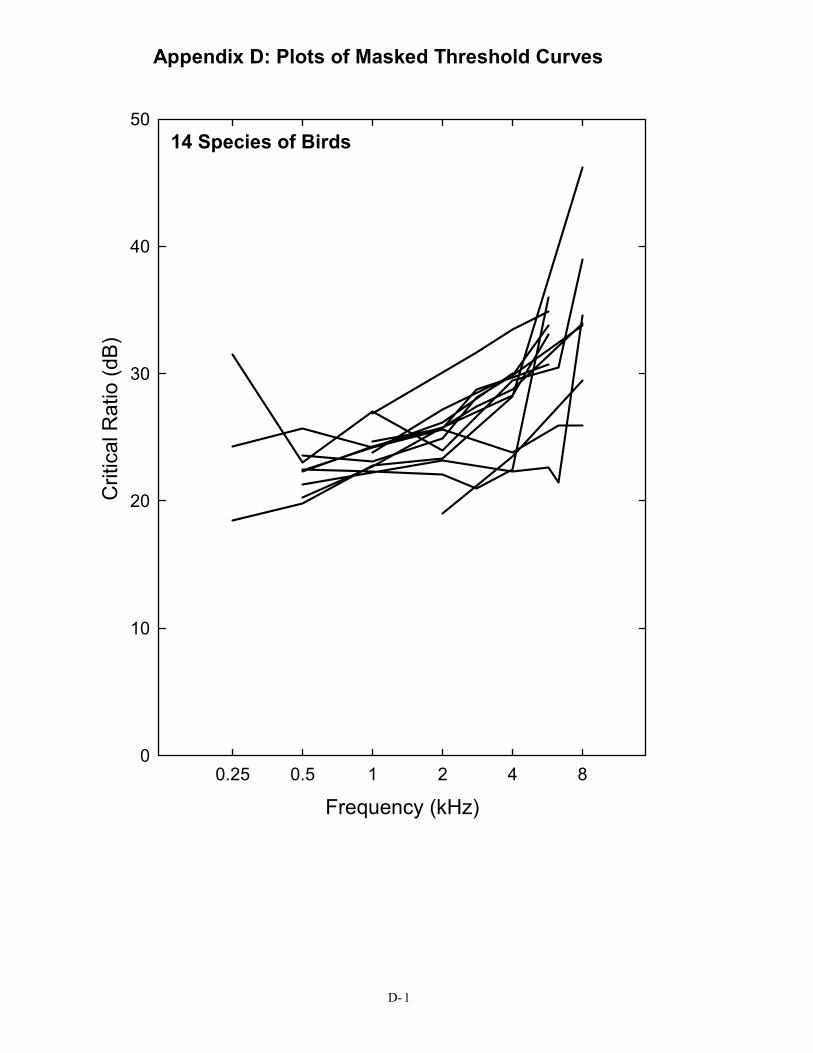
Critical ratio data have now been obtained behaviorally for 14 species of birds, including songbirds, non-songbirds, and even nocturnal predators. Figure 2 shows the critical ratio functions for 14 species of birds. Eleven of these species (all but the barn owl, budgerigar, and great tit) show a similar pattern, and these data are shown as an average. This average curve follows quite closely the typical pattern of approximately a 2–3 dB/octave increase in signal-to-noise ratio that is characteristic of these functions in mammals, including humans (the 3 dB/octave slope is shown by a dotted line in Figure 2). In both mammals and birds, this orderly increase is related to the mechanics of the peripheral auditory system (Békésy 1960; Greenwood 1961a, b; Buus, Klump, Gleich, and Langemann 1995). But there are some exceptions among birds, namely the budgerigar, barn owl, and the European bird, the great tit.
In practical terms, what this curve describes is the level in decibels above the spectrum level of the background noise that a pure tone must be in order to be heard. For the average bird (the solid curve
in Figure 2), a pure tone in the region of 3 kHz must be at least 28 dB above the spectrum level of noise in order to be detected. This is not the case for the budgerigar, the great tit, or the barn owl. For the human, the same pure tone need only be about 22 dB above the spectrum level of noise to be heard. This difference in masked thresholds of 6 dB is significant when considered in terms of the decrease in sound pressure with distance. Because of the inverse square law, this difference represents approximately a doubling of distance; a human can still detect a sound in noise at twice the distance the typical bird can. A complete set of critical ratio functions is shown in Appendix D for the 14 species for which they have been measured. Knowing the signal-to-noise ratio at threshold for a bird allows predictions about how far away a sound can be heard in a noisy background.
Detection of noise in noise
Just as noise can mask a tone, it can also mask another noise. There are actually two ways of doing this experiment. One is to determine how much a noise has to be increased in level in order to detect the increase. Another approach determines the level required of a second noise added to an original noise so that the second noise is just detectable. Experiments to determine how much the level of a noise needs to be increased to be detected have been done in humans, and the answer is about 0.5–1.0 dB (Miller 1947). Similar data are available in the form of modulation transfer functions for three species of birds: the budgerigar, the starling, and the barn owl (Dooling, Lohr, and Dent, 2000). Without going into the details of this test, it is clear that all three species can hear about a 1.5-dB change in level of flat, broadband noise. So, here again
7
is an example of human acoustic discrimination abilities being slightly better than those of birds. For humans, a noise needs to be about 0.5 dB greater than the background noise to be detected, while birds require an added noise to be at least 1.5 dB above the background noise to be detected.
In summary, the thresholds from these two types of auditory tests— the critical ratio and the threshold for masking of one noise by another— are the relevant thresholds to use when estimating how far away a bird can hear a wind turbine blade against a background of environmental noise. Table 1 shows the signal-to-noise levels that must be exceeded for a bird to detect different types of signals—either pure tones or a broadband noise.
Table 1. Signal/Noise (S/N) in dB to Be Exceeded for Detection of Tones and
Signal Noise for an Average Bird (Solid Line in Figure 2)
1 kHz 2 kHz 3 kHz 4 kHz Noise S/N (dB) 24 dB 27 dB 28.5 dB 30 dB 1.5 dB
Environmental Noise Versus Wind Turbine Noise
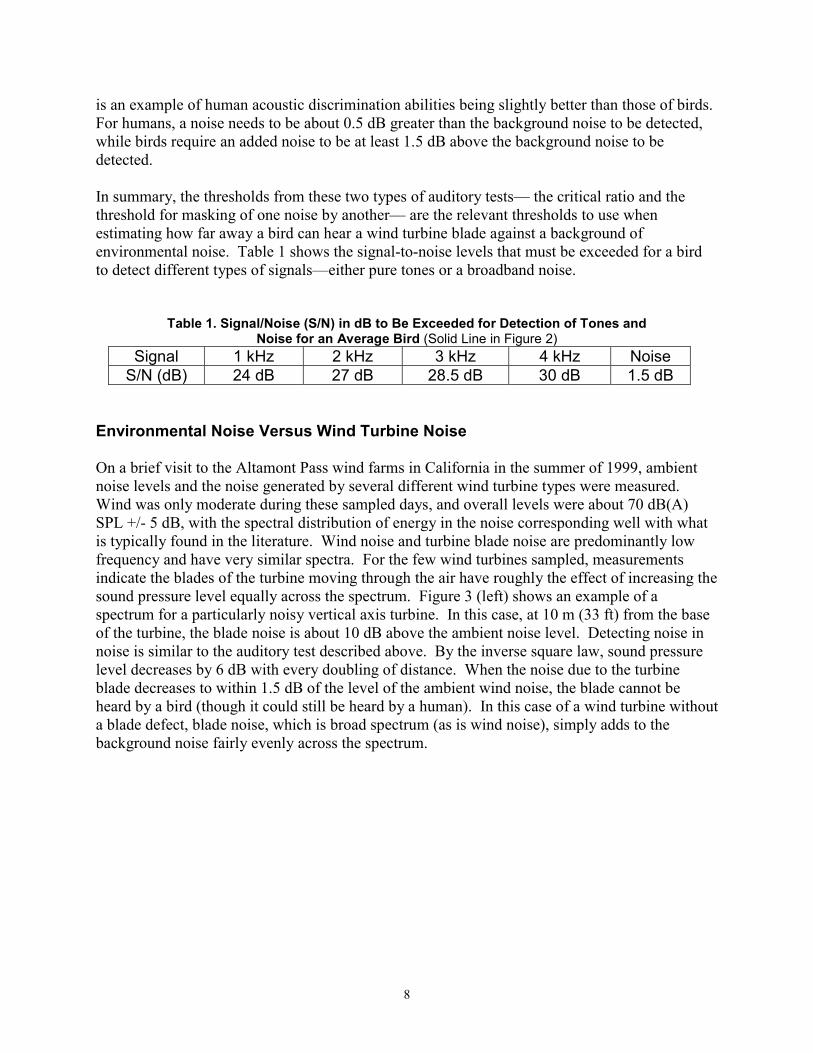
On a brief visit to the Altamont Pass wind farms in California in the summer of 1999, ambient noise levels and the noise generated by several different wind turbine types were measured. Wind was only moderate during these sampled days, and overall levels were about 70 dB(A) SPL +/- 5 dB, with the spectral distribution of energy in the noise corresponding well with what is typically found in the literature. Wind noise and turbine blade noise are predominantly low frequency and have very similar spectra. For the few wind turbines sampled, measurements indicate the blades of the turbine moving through the air have roughly the effect of increasing the sound pressure level equally across the spectrum. Figure 3 (left) shows an example of a spectrum for a particularly noisy vertical axis turbine. In this case, at 10 m (33 ft) from the base of the turbine, the blade noise is about 10 dB above the ambient noise level. Detecting noise in noise is similar to the auditory test described above. By the inverse square law, sound pressure level decreases by 6 dB with every doubling of distance. When the noise due to the turbine blade decreases to within 1.5 dB of the level of the ambient wind noise, the blade cannot be heard by a bird (though it could still be heard by a human). In this case of a wind turbine without a blade defect, blade noise, which is broad spectrum (as is wind noise), simply adds to the background noise fairly evenly across the spectrum.
8
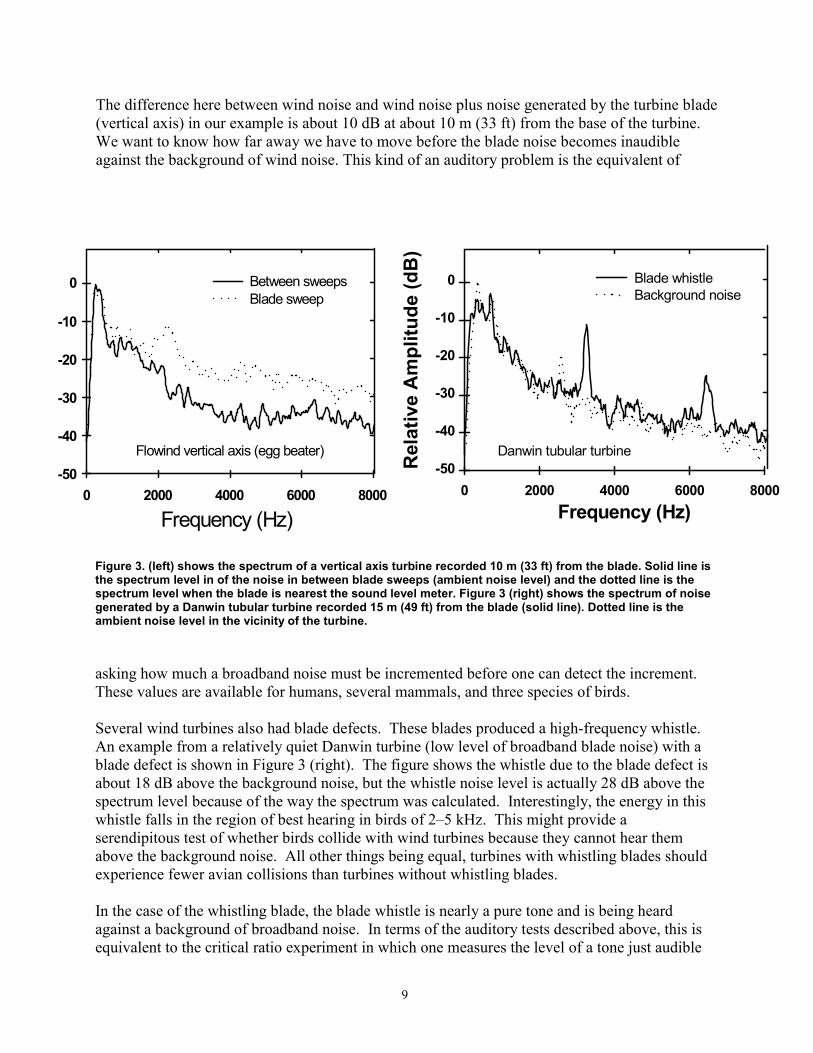
The difference here between wind noise and wind noise plus noise generated by the turbine blade (vertical axis) in our example is about 10 dB at about 10 m (33 ft) from the base of the turbine. We want to know how far away we have to move before the blade noise becomes inaudible against the background of wind noise. This kind of an auditory problem is the equivalent of
0
Flowind vertical axis (egg beater)
Between sweeps Blade sweep
0
-10 -10
-20 -20
-30 -30
-40 -40
-50 -50
Blade whistle Background noise
Danwin tubular turbine
0 2000 4000 6000 8000 0 2000 4000 6000 8000
Frequency (Hz) Frequency (Hz)
Figure 3. (left) shows the spectrum of a vertical axis turbine recorded 10 m (33 ft) from the blade. Solid line is the spectrum level in of the noise in between blade sweeps (ambient noise level) and the dotted line is the spectrum level when the blade is nearest the sound level meter. Figure 3 (right) shows the spectrum of noise generated by a Danwin tubular turbine recorded 15 m (49 ft) from the blade (solid line). Dotted line is the ambient noise level in the vicinity of the turbine.
asking how much a broadband noise must be incremented before one can detect the increment. These values are available for humans, several mammals, and three species of birds.
Several wind turbines also had blade defects. These blades produced a high-frequency whistle. An example from a relatively quiet Danwin turbine (low level of broadband blade noise) with a blade defect is shown in Figure 3 (right). The figure shows the whistle due to the blade defect is about 18 dB above the background noise, but the whistle noise level is actually 28 dB above the spectrum level because of the way the spectrum was calculated. Interestingly, the energy in this whistle falls in the region of best hearing in birds of 2–5 kHz. This might provide a serendipitous test of whether birds collide with wind turbines because they cannot hear them above the background noise. All other things being equal, turbines with whistling blades should experience fewer avian collisions than turbines without whistling blades.
In the case of the whistling blade, the blade whistle is nearly a pure tone and is being heard against a background of broadband noise. In terms of the auditory tests described above, this is equivalent to the critical ratio experiment in which one measures the level of a tone just audible
Rel
ativ
e A
mpl
itude
(dB
)
9
above the spectrum level of noise. Again, for humans, other mammals, and a number of species of birds, there are laboratory data that bear directly on this issue. The results from these tests form the basis of the predictions made in this report.
The spectra in these figures are independent, and relative comparisons are not appropriate. For instance, the relative noise levels generated by vertical axis versus Danwin turbines is not known, and every blade defect does not produce the same kind of whistle. These two particular spectra are presented only because they represent the extremes of what were sampled (a noisy vertical axis versus a quiet Danwin with a whistle). They are used here simply to provide a concrete example of the factors to consider in estimating the distance at which a bird can hear a turbine blade.
Detectability of Wind Turbine Blade Noise
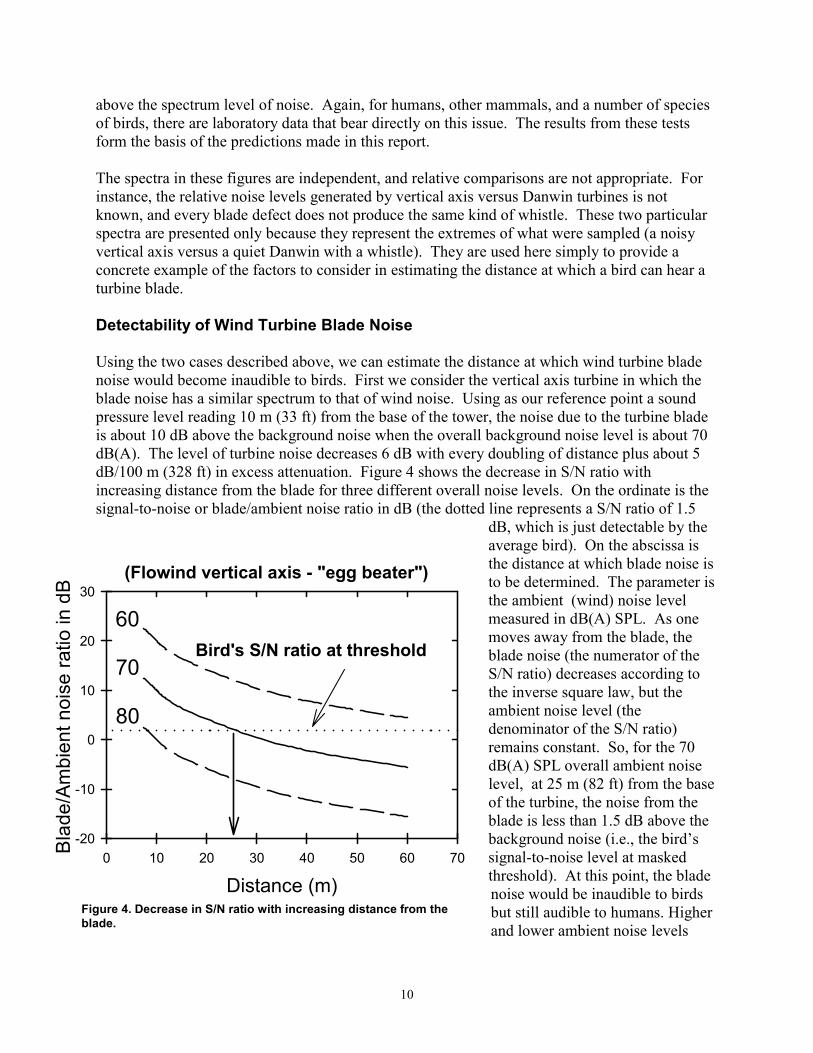
Using the two cases described above, we can estimate the distance at which wind turbine blade noise would become inaudible to birds. First we consider the vertical axis turbine in which the blade noise has a similar spectrum to that of wind noise. Using as our reference point a sound pressure level reading 10 m (33 ft) from the base of the tower, the noise due to the turbine blade is about 10 dB above the background noise when the overall background noise level is about 70 dB(A). The level of turbine noise decreases 6 dB with every doubling of distance plus about 5 dB/100 m (328 ft) in excess attenuation. Figure 4 shows the decrease in S/N ratio with increasing distance from the blade for three different overall noise levels. On the ordinate is the signal-to-noise or blade/ambient noise ratio in dB (the dotted line represents a S/N ratio of 1.5
dB, which is just detectable by the average bird). On the abscissa is the distance at which blade noise is
Bird's S/N ratio at threshold 60
70
80
(Flowind vertical axis - "egg beater") to be determined. The parameter is30 the ambient (wind) noise level
measured in dB(A) SPL. As one 20 moves away from the blade, the
blade noise (the numerator of the S/N ratio) decreases according to
10 the inverse square law, but the ambient noise level (the denominator of the S/N ratio)
0 remains constant. So, for the 70 dB(A) SPL overall ambient noise
-10 level, at 25 m (82 ft) from the base of the turbine, the noise from the blade is less than 1.5 dB above the
-20 background noise (i.e., the bird’s 0 10 20 30 40 50 60 70 signal-to-noise level at masked
threshold). At this point, the bladeDistance (m) noise would be inaudible to birds Figure 4. Decrease in S/N ratio with increasing distance from the but still audible to humans. Higher blade. and lower ambient noise levels
Blad
e/Am
bien
t noi
se ra
tio in
dB
10
have a dramatic effect on the hearing distance. If the overall ambient noise (wind) level is increased 10 db to 80 dB(A) SPL, the blade noise would not become audible to a bird until it was within less than 10 m (33 ft) of the blade. Since the value of 1.5 dB for detecting noise in noise has been shown to be identical in budgerigars, starlings, and barn owls – three very unrelated species – it is likely to hold true for all birds.
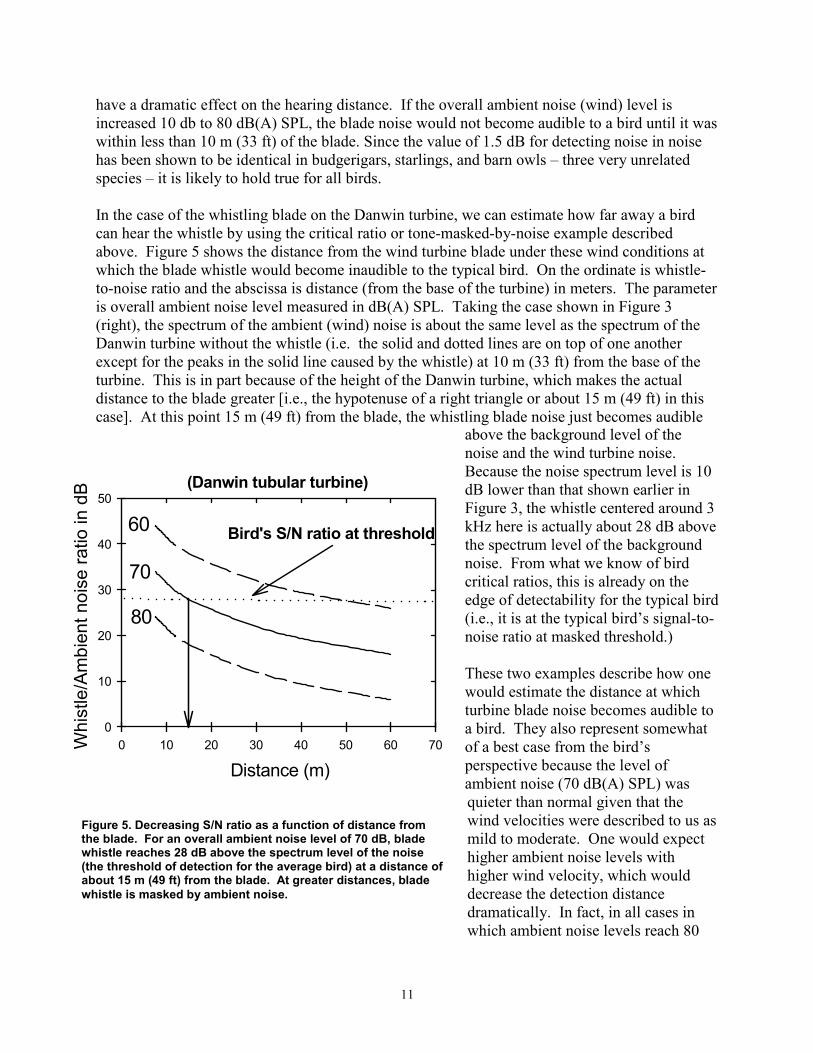
In the case of the whistling blade on the Danwin turbine, we can estimate how far away a bird can hear the whistle by using the critical ratio or tone-masked-by-noise example described above. Figure 5 shows the distance from the wind turbine blade under these wind conditions at which the blade whistle would become inaudible to the typical bird. On the ordinate is whistle-to-noise ratio and the abscissa is distance (from the base of the turbine) in meters. The parameter is overall ambient noise level measured in dB(A) SPL. Taking the case shown in Figure 3 (right), the spectrum of the ambient (wind) noise is about the same level as the spectrum of the Danwin turbine without the whistle (i.e. the solid and dotted lines are on top of one another except for the peaks in the solid line caused by the whistle) at 10 m (33 ft) from the base of the turbine. This is in part because of the height of the Danwin turbine, which makes the actual distance to the blade greater [i.e., the hypotenuse of a right triangle or about 15 m (49 ft) in this case]. At this point 15 m (49 ft) from the blade, the whistling blade noise just becomes audible
Whi
stle
/Am
bien
t noi
se ra
tio in
dB (Danwin tubular turbine)
50
40
30
20
10
0 0 10 20 30 40 50 60 70
Bird's S/N ratio at threshold 60
70
80
Distance (m)
Figure 5. Decreasing S/N ratio as a function of distance from the blade. For an overall ambient noise level of 70 dB, blade whistle reaches 28 dB above the spectrum level of the noise (the threshold of detection for the average bird) at a distance of about 15 m (49 ft) from the blade. At greater distances, blade whistle is masked by ambient noise.
above the background level of the noise and the wind turbine noise. Because the noise spectrum level is 10 dB lower than that shown earlier in Figure 3, the whistle centered around 3 kHz here is actually about 28 dB above the spectrum level of the background noise. From what we know of bird critical ratios, this is already on the edge of detectability for the typical bird (i.e., it is at the typical bird’s signal-to-noise ratio at masked threshold.)
These two examples describe how one would estimate the distance at which turbine blade noise becomes audible to a bird. They also represent somewhat of a best case from the bird’s perspective because the level of ambient noise (70 dB(A) SPL) was quieter than normal given that the wind velocities were described to us as mild to moderate. One would expect higher ambient noise levels with higher wind velocity, which would decrease the detection distance dramatically. In fact, in all cases in which ambient noise levels reach 80
11
dB(A) SPL (probably fairly typical), detection is not possible at distances greater than 10 m (33 ft). To point out the obvious, for flying birds, this would certainly represent a hazard.
The S/N ratio of 28 dB shown here is for the typical (average) bird detecting a 3-kHz pure tone in noise. It is taken from the average critical ratio function shown in Figure 2 and Table 1. Critical ratio functions for 14 species of birds are given in Appendix D. The first Figure in Appendix D shows that, as a group, birds attain signal-to-noise ratio of about 20 – 28 dB in the frequency region of 1–4 kHz. Critical ratio values from these plots can be used directly in understanding Figure 5. To take one example, the song sparrow critical ratio at 3 kHz is about 25 dB. This would suggest that song sparrows could hear blade noise out to about 25 m (82 ft) against an ambient noise level of 70 dB (A) SPL.
Object Localization Versus Acoustic Deterrents
The above review of the hearing capabilities of birds in the quiet and in noise suggests a new way to think about the role of hearing in the avoidance of wind turbine blades. The traditional way of thinking about the use of sound and the role of hearing in keeping animals away from areas or structures is that the sound should function as an acoustic deterrent. Acoustic deterrents are promoted as an auditory stimulus or set of stimuli that are so aversive that animals avoid the area completely. In the case of birds, acoustic deterrents do not work for two reasons. First, even though loud noises, explosions, alarm calls, and other complex sounds have been promoted over the years as acoustic deterrents, birds habituate to such stimuli. It cannot be stated too strongly that none of these acoustic strategies have proven effective over the long term. The all too common observation of birds foraging and nesting near busy airport runways provides an example of such a failure.
The second reason that acoustic deterrents are typically seen as an attractive solution is the possibility of using sounds outside the range of human hearing. In the case of birds, this is simply impossible because the range of bird hearing is narrower than the range of human hearing. Any sound audible to birds will also be audible to humans. Thus, as attractive as the notion of an acoustic deterrent outside the range of human hearing is, it is not possible in the case of birds because birds cannot hear outside the range of human hearing.
So does the literature on bird hearing offer any possible solutions for the problem of bird collisions with wind turbines? Birds (and most other vertebrates) use their hearing as they use their vision —to locate objects in space. This is apparent in the case of vision, but somewhat less so with audition. Thus, we tend to think of solutions to the wind turbine collision problem differently in the two domains. As an example, it seems quite reasonable to entertain painting wind turbine blades with different patterns to make them more visible to birds under the assumption that birds will not collide with something they can see. In the parlance of sensory biology, this manipulation increases the perceptual contrast between the background and the object so that the object may be more easily detected. Oddly enough, the role for hearing is typically and almost exclusively considered in the context of an acoustic deterrent—not as part of the normal, multisensory process of object localization. It is worthwhile to consider the acoustic parallel to the visual case (i.e. increasing the perceptual contrast between ambient noise and blade noise). This is especially important because most objects we localize are both seen
12
and heard with the two sensory systems working in concert. It might be fruitful to think of hearing as playing the same role as vision in enabling a bird to avoid colliding with a moving object such as a wind turbine blade.
This review of avian hearing is intended to provide a set of considerations for determining whether birds can hear wind turbine blades and estimating the distances at which detection might occur. As a general rule of thumb, noise produced by wind turbine blades is probably less audible to birds than humans. This gives one a sense of the problem faced by birds. It is entirely possible that as a flying bird approaches a wind turbine, especially under high wind conditions, it loses the ability to see the blade (due to motion smear) before it is close enough to hear the blade. If it could both see and hear the blade it needs to avoid, the number of collisions should decrease. The underlying assumption here is simply that birds are less likely to collide with something they can see and hear than something they can only see (or cannot see or hear). The recommendations in the following section suggest ways to approach this issue.
Recommendations
1) Experiment with “whistles” by placing them on blades of turbines with a known history of fatalities. This approach controls for other variables, such as location, vegetation, prey abundance, etc. The whistle-to-noise ratio should be sufficient to be heard by birds— an estimate can be obtained from data in this report.
2) Systematically measure the spectrum and the level of blade and ambient noises at selected locations—particularly those with high fatalities—to define the existing acoustic problem.
3) It might be cost-effective and valuable to supplement recommendation 2 with informal judgments by field census workers of how far away they can hear a turbine blade (i.e., how many paces from the turbine base) to get a sense of the dimensions of the problem. The typical bird would need to be half again as close to the blade as a human would to hear it.
13
References
Aleksandrov, L.I.; Dmitrieva, L.P. (1992). "Development of Auditory Sensitivity of Altricial Birds: Absolute Thresholds of the Generation of Evoked Potentials." Neurosci Behav Physiol; 22:132-137.
Barton, L.A.; Bailey, E.D.; Gatehouse, R.W. (1984). "Audibility Curve of Bobwhite Quail (Colinus virginianus).” J Auditory Res; 24:87-97.
Békésy, G.V. (1960). Experiments in Hearing. New York: McGraw-Hill.
Buss, S.; Klump, G.M.; Gleich, O.; Langemann, U. (1995). “An Excitation-Pattern Model for the Starling (Sturnus vulgaris). J Acoust Soc Am; 98:112-124.
Cohen, S.M.; Stebbins, W.C.; Moody, D.B. (1978). "Audibility Thresholds of the Blue Jay." Auk; 95:563-568.
Coles, R.B.; Konishi, M.; Pettigrew, J.D. (1987). "Hearing and Echolocation in the Australian Grey Swiftlet, Collocalia spodiopygia." J Exp Biol; 129:365-371.
Dooling, R.J. (1980). "Behavior and Psychophysics of Hearing in Birds." Popper, A.N.; Fay, R.R., eds. Comparative Studies of Hearing in Vertebrates. New York: Springer-Verlag, pp. 261-288.
_____. (1982). "Auditory Perception in Birds." Kroodsma, D.E.; Miller, E.H., eds. Acoustic Communication in Birds, Vol 1. New York: Academic Press, pp. 95-130.
_____. (1992). "Hearing in Birds." Webster, D.B.; Fay, R.R.; Popper, A.N., eds. The Evolutionary Biology of Hearing. New York: Springer-Verlag, pp. 545-559.
Dooling, R.J.; Okanoya, K.; Downing, J.; Hulse, S. (1986). "Hearing in the Starling (Sturnus vulgaris): Absolute Thresholds and Critical Ratios." Bull Psychonomic Soc; 24:462-464.
Dooling, R.J.; Peters, S.S.; Searcy, M.H. (1979). "Auditory Sensitivity and Vocalizations of the Field Sparrow (Spizella pusilla)." Bull Psychon Soc; 14:106-108.
Dooling, R.J.; Saunders, J.C. (1975a). "Hearing in the Parakeet (Melopsittacus undulatus): Absolute Thresholds, Critical Ratios, Frequency Difference Limens, and Vocalizations." J Comp Physiol; 88:1-20.
Dooling, R.J.; Searcy, M.H. (1979). "The Relation Among Critical Ratios, Critical Bands, and Intensity Difference Limens in the Parakeet (Melopsittacus undulatus)." Bull Psychon Soc; 13:300-302.
14
Dooling, R.J.; Zoloth, S.R.; Baylis J.R. (1978). “Auditory Sensitivity, Equal Loudness, Temporal Resolving Power and Vocalizations in the House Finch (Carpodacus mexicanus).” J Comp Physiol Psych; 92:867-876.
Dooling, R.J.; Lohr, B.; and Dent, M.L. (2000). “Hearing in Birds and Reptiles.” Dooling, R.J.; Fay, R.R.; and Popper, A.H., eds. Comparative Hearing: Birds and Reptiles. New York: Springer-Verlag, pp. 308-359.
Dyson, M.L.; Klump, G.M.; Gauger, B. (1998). “Absolute Hearing Thresholds and Critical Masking Ratios in the European Barn Owl: A Comparison With Other Owls.” J Comp Physiol A; 182:695-702.
Greenwood, D.D. (1961a). “Auditory Masking and the Critical Band.” J Acoust Soc Am; 33:484-502.
_____. (1961b). “Critical Bandwidth and the Frequency Coordinates of the Basilar Membrane.” J Acoust Soc Am; 33:1344-1356.
Harrison, J.B.; Furumoto, L. (1971). “Pigeon Audiograms: Comparison of Evoked Potential and Behavioral Thresholds in Individual Birds.” J Aud Res; 11:3342.
Hashino, E.; Sokabe, M. (1989). “Hearing Loss in the Budgerigar (Melopsittacus undulatus).” J Acoust Soc Am; 85:289-294.
Hashino, E.; Sokabe, M.; Miyamoto, K. (1988). “Frequency Specific Susceptibility to Acoustic Trauma in the Budgerigar.” J Acoust Soc Am; 83:2450-2452.
Heise, G.A. (1953). “Auditory Thresholds in the Pigeon.” Amer J Psychol; 66:1-19.
Hienz, R.D.; Sachs, M.B. (1987). “Effects of Noise on Pure-Tone Thresholds in Blackbirds (Agelaius phoeniceus and Molothrus ater) and Pigeon (Columbia livia).” J Comp Psych; 101:16-24.
Hienz, R.D.; Sinnott, J.M.; Sachs, M.B. (1977). “Auditory Sensitivity of the Redwing Blackbird and the Brown-Headed Cowbird.” J Comp Physiol Psych; 91:1365-1376.
Klump, G.M.; Kretzschmar, E.; Curio, E. (1986). “The Hearing of an Avian Predator and its Avian Prey.” Behav Ecol Sociobiol; 18:317-323.
Konishi, M. (1970). “Comparative Neurophysiological Studies of Hearing and Vocalizations on Song Birds.” Z Vergl Physiol; 66:257-272.
_____. (1973a). “How the Barn Owl Tracks its Prey.” Am Sci; 61:414-424.
_____. (1973b). “Locatable and Nonlocatable Acoustic Signals for Barn Owls.” Am Nat; 107:775-785.
15
Konishi, M.; Knudsen, E.I. (1979). “The Oilbird: Hearing and Echolocation.” Science; 204:425-427.
Kreithen, M.L.; Quine, D.M. (1979). “Infrasound Detection by the Homing Pigeon: A Behavioral Audiogram.” J Comp Physiol; 129:1-4.
Kuhn, A.; Muller, C.M.; Leppelsack H-J; Schwartzkopff, J. (1982). “Heart Rate Conditioning Used for Determination of Auditory Thresholds in the Starling.” Naturwiss; 69:245-256.
Langemann, U.; Gauger, B.; Klump, G.M. (1998). “Auditory Sensitivity in the Great Tit: Perception of Signals in the Presence and Absence of Noise.” Anim Behav; 56:763-769.
Linzenbold, A.; Dooling, R.J.; Ryals, B.M. (1993). “A Behavioral Audibility Curve for the Japanese Quail (Coturnix coturnix japonica).” Paper presented at Midwinter meeting of the Association for Research in Otolaryngology, St Petersburg, FL.
Lohr, B.; Dooling, R.J. (1999). “Hearing in the Red-billed Firefinch (Lagonosticta senegala): An Estrildid Finch with Narrowband Vocalizations.” Paper presented at Midwinter meeting of the Association for Research in Otolaryngology, St Petersburg, FL.
Maiorana, V.A.; Schleidt, W.M. (1972). “The Auditory Sensitivity of the Turkey.” J Aud Res; 12:203-207.
Manley, G.A.; Köppl, C.; Yates, G.K. (1997). “Activity of Primary Auditory Neurons in the Cochlear Ganglion of the Emu Dromaius novaehollandiae: Spontaneous Discharge, Frequency Tuning, and Phase Locking.” J Acoust Soc Am; 101:1560-1573.
Miller, G.A. (1947). “Sensitivity to Changes in the Intensity of White Noise and its Relation to Masking and Loudness.” J. Acoust. Soc. Am.; 191, 609-619.
Nieboer, E.; Van der Paardt, M. (1977). “Hearing of the African Wood Owl Strix woodfordii.” Neth J Zool; 27:227-229.
Niemiec, A.J.; Raphael, Y.; Moody, D.B. (1994). Return of Auditory Function Following Structural Regeneration After Acoustic Trauma: Behavioral Measures From Quail.” Hear Res; 79:1-16.
Okanoya, K.; Dooling, R.J. (1985). “Colony Differences in Auditory Thresholds in the Canary.” J Acoust Soc Am; 78:1170-1176.
_____. (1987). “Hearing in Passerine and Psittacine Birds: A Comparative Study of Masked and Absolute Auditory Thresholds.” J Comp Psychol; 101:7-15.
_____. (1988). “Hearing in the Swamp Sparrow (Melospiza georgiana) and the Song Sparrow (Melospiza melodia).” Anim Behav; 36:726-732.
16

Pettigrew, J.D.; Larsen, O.N. (1990). “Directional Hearing in the Plains-Wanderer, Pedionomus torquatus.”
Rowe, M.; Aitkin, L., eds. Information Processing in Mammalian Auditory and Tactile Systems. New York: Wiley-Liss, pp. 179-190.
Quine, D.B. (1978). “Infrasound Detection and Ultra Low Frequency Discrimination in the Homing Pigeon (Columba livia).” J Acoust Soc Am; 63:S75.
Saunders, J.C.; Dooling, R.J. (1974). “Noise-Induced Threshold Shift in the Parakeet (Melopsittacus undulatus).” Proc Nat Acad Sci; 71:1962-1965.
Saunders, J.C.; Rintelmann, W.F.; Bock, G. (1979). “Frequency Selectivity in Bird and Man: A Comparison Among Critical Ratios, Critical Bands, and Psychophysical Tuning Curves.” Hear Res; 1:303-323.
Saunders, J.C.; Salvi, R.J. (1993). “Psychoacoustics of Normal Adult Chickens: Thresholds and Temporal Integration.” J Acoust Soc Am; 94:83-90.
Schwartzkopff, J. (1949). “Über Sitz und Leistung von Gehör und Vibrationssinn bei Vögeln.” Z Vergl Physiol; 31:527-603.
Stebbins, W.C., ed. (1970). “Studies of Hearing and Hearing Loss in the Monkey.” Animal Psychophysics: The Design and Conduct of Sensory Experiments. New York: Appleton, pp. 41-66.
Trainer, J.E. (1946). The Auditory Acuity of Certain Birds. PhD Thesis. Ithaca, NY: Cornell University.
Van Dijk, T. (1973). “A Comparative Study of Hearing in Owls of the Family Strigidae.” Neth J Zool; 23:131-167.
Wright, T.F., Dooling, R.J., Cortopassi, K.A., and Bradbury, J. (2000). Hearing and Vocalizations in the Orange-Fronted Conure (Aratinga Canicularis), a Small Parrot. Paper presented at the 139th Meeting of the Acoustical Society of America, Atlanta, GA.
Yodlowski, M.L. (1980). “Infrasonic Sensitivity in Pigeons (Columba livia).” PhD Thesis. New York: Rockefeller University.
17
5
10
15
20
25
30
35
40
45
Appendix A: Bibliography of Hearing in BirdsORDER COMMON NAME GENUS and SPECIES AUDIOGRAM REFERENCES Anseriformes (1) 1 Mallard Duck Anas platyrhynchos Trainer, 1946 Apodiformes (1) 2 Australian Grey Swiftlet Collocalia spodiopygia Coles, Konishi, & Pettigrew, 1987 Caprimulgiformes 3 Oilbird Steatornis caripensis Konishi & Knudsen, 1979 Casuariiformes (1) 4 Emu Dromaius novaehollandiae Manley, Koeppl, & Yates, 1997 Charadriiformes (1) Plains Wanderer Pedionomus torquatus Pettigrew & Larsen, 1990
Columbiformes (1) 6 Pigeon Columbia livia Trainer, 1946; Heise, 1953; Stebbins, 1970; Harrison & Furumoto, 1971; Hienz, Sinnott, & Sachs, 1977; Goerdel-Leich and Schwartzkopff, 1984
Falconiformes (2) 7 American Kestrel Falco sparverius Trainer, 1946 8 European Sparrowhawk Accipiter nisus Trainer, 1946; Klump, Kretzschmar, & Curio, 1986
Galliformes (4) 9 Bobwhite Quail Colinus virgianus Barton, Bailey, & Gatehouse, 1984 Chicken Gallus gallus Saunders & Salvi, 1993
11 Japanese Quail Coturnix coturnix japonica Linzenbold, Dooling, & Ryals, 1993; Niemiec, Raphael, & Moody, 1994
12 Turkey Meleagris gallopavo Maiorana & Schleidt, 1972 Passeriformes (20) 13 American Robin Turdus migratorius Konishi, 1970
14 Blue Jay Cyanocitta cristata Cohen, Stebbins, & Moody, 1978 Brown-Headed Cowbird Molothrus ater Hienz, Sinnott, & Sachs, 1977
16 Bullfinch Pyrrhula pyrrhula Schwartzkopff, 1949 17 Chipping Sparrow Spizella passerina Konishi, 1970 18 Common Canary Serinus canarius Okanoya & Dooling, 1985; 1987 19 Common Crow Corvus brachyrhynchos Trainer, 1946
European Starling Sturnus vulgaris Kuhn, Muller, Leppelsack, & Schwartzkopff, 1982; Dooling, Okanoya, Downing, & Hulse, 1986; Trainer, 1946
21 Field Sparrow Spizella pusilla Dooling, Peters, & Searcy, 1979 22 Fire Finch Lagonosticta senegala Lohr & Dooling, 1999 23 Great Tit Parus major Langemann, Gauger, & Klump, 1998 24 House Finch Carpodacus mexicanus Dooling, Zoloth, & Baylis, 1978
House Sparrow Passer domesticus Konishi, 1970 26 Pied Flycatcher Ficedula hypolueca Alexandrov & Dmitrieva, 1992 27 Red-Winged Blackbird Agelaius phoeniceus Hienz, Sinnott, & Sachs, 1977 28 Slate-Colored Junco Junco hyemalis Konishi, 1970 29 Song Sparrow Melospiza melodia Okanoya & Dooling, 1987; 1988
Swamp Sparrow Melospiza georgiana Okanoya & Dooling, 1987; 1988 31 Western Meadowlark Sturnella neglecta Konishi, 1970 32 Zebra Finch Taeniopygia guttata Okanoya & Dooling, 1987
Psittaciformes (3) 33 Bourke's Parrot Neophema bourkii Dooling, Park, & Okanoya, unpublished data
34 Budgerigar Melopsittacus undulatus
Saunders & Dooling, 1974; Dooling & Saunders, 1975; Saunders, Rintelman, & Bock, 1979; Saunders & Pallone, 1980; Okanoya & Dooling, 1987; Hashino, Sokabe, & Miyamoto, 1988; Hashino & Sokabe, 1989
Cockatiel Nymphicus hollandicus Okanoya & Dooling, 1987 Strigiformes (13) 36 African Wood Owl Strix woodfordii Nieboer & Van der Paardt, 1977
37 Barn Owl Tyto alba Konishi, 1973a; Dyson, Klump, & Gauger, 1998 38 Brown Fish Owl Ketupa zeylonensis Van Dijk, 1973 39 Eagle Owl Bubo bubo Van Dijk, 1973
Forest Eagle Owl Bubo nipalensis Van Dijk, 1973 41 Great Horned Owl Bubo virginianus Trainer, 1946 42 Long Eared Owl Asio otus Van Dijk, 1973 43 Mottled Owl Strix virgata Van Dijk, 1973 44 Scops Owl Otus scops Van Dijk, 1973
Snowy Owl Nyctea scandiaca Van Dijk, 1973 46 Spotted Wood Owl Strix seloputo Van Dijk, 1973 47 Tawny Owl Strix aluco Van Dijk, 1973 48 White-Faced Scops Owl Otus leucotis Van Dijk, 1973
Taken from Dooling, Lohr, and Dent (2000).
A-1
Appendix B: Absolute Threshold Curves (Audiogram Plots)
Thre
shol
d in
dB
SPL
(re 2
0 µ p
a)
120
100
80
60
40
20
0
-20
Mallard Duck (Anas platyrhynchos) Best Intensity (dB SPL) = 15.57 Best Frequency (kHz) = 2.00 Low Frequency Limit (kHz) = 0.32 High Frequency Limit (kHz) = 5.22 Center Frequency (kHz) = 1.28 30 dB Bandwidth (kHz) = 4.91
0.25 0.5 1 2 4 8
Frequency (kHz)
B- 1
Thre
shol
d in
dB
SPL
(re 2
0 µ p
a)
120
100
80
60
40
20
0
-20
Australian Grey Swiftlet (Collocalia spodiopygia) Best Intensity (dB SPL) = 20.31 Best Frequency (kHz) = 2.00 Low Frequency Limit (kHz) = 0.49 High Frequency Limit (kHz) = 5.71 Center Frequency (kHz) = 1.66 30 dB Bandwidth (kHz) = 5.23
0.25 0.5 1 2 4 8
Frequency (kHz)
B- 2
Thre
shol
d in
dB
SPL
(re 2
0 µ p
a)
120
100
80
60
40
20
0
-20
0.25 0.5 1 2 4
Frequency (kHz)
Oilbird (Steatornis caripensis) Best Intensity (dB SPL) = 20.31 Best Frequency (kHz) = 2.00 Low Frequency Limit (kHz) = 0.49 High Frequency Limit (kHz) = 5.71 Center Frequency (kHz) = 1.66 30 dB Bandwidth (kHz) = 5.23
B- 3
8
Thre
shol
d in
dB
SPL
(re 2
0 µ p
a)
120
100
80
60
40
20
0
-20
0.25 0.5 1 2 4
Frequency (kHz)
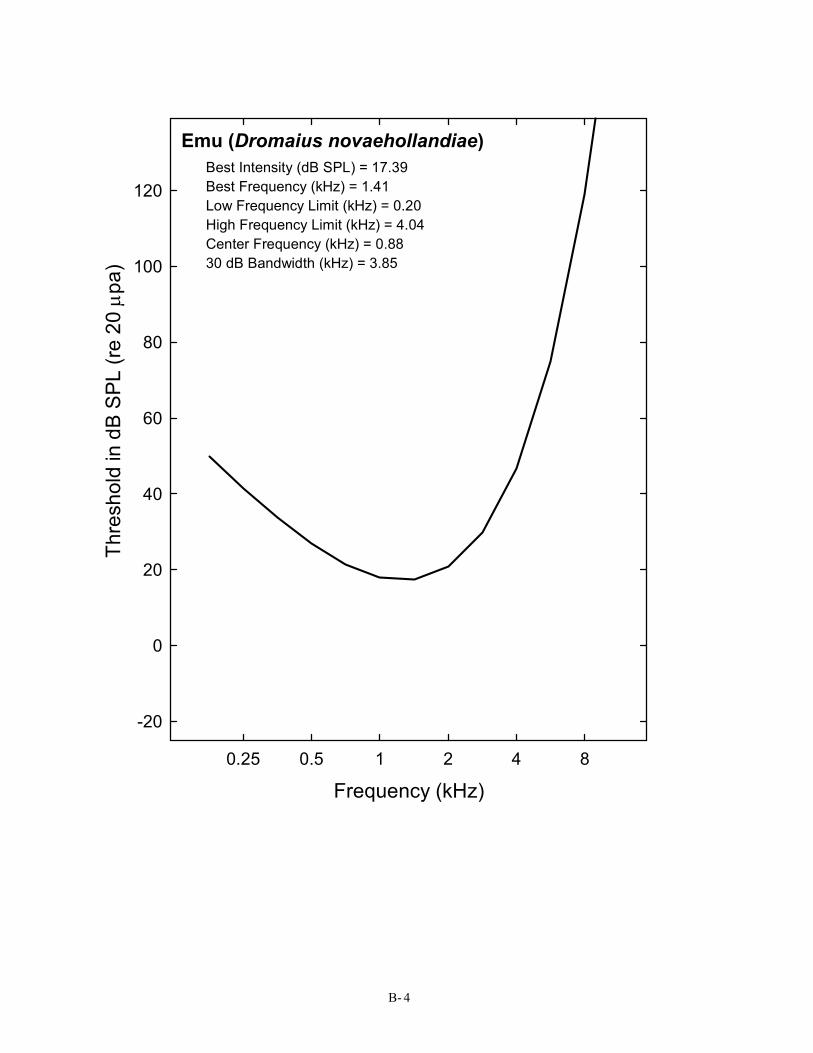
Emu (Dromaius novaehollandiae) Best Intensity (dB SPL) = 17.39 Best Frequency (kHz) = 1.41 Low Frequency Limit (kHz) = 0.20 High Frequency Limit (kHz) = 4.04 Center Frequency (kHz) = 0.88 30 dB Bandwidth (kHz) = 3.85
B- 4
8
Thre
shol
d in
dB
SPL
(re 2
0 µ p
a)
120
100
80
60
40
20
0
-20
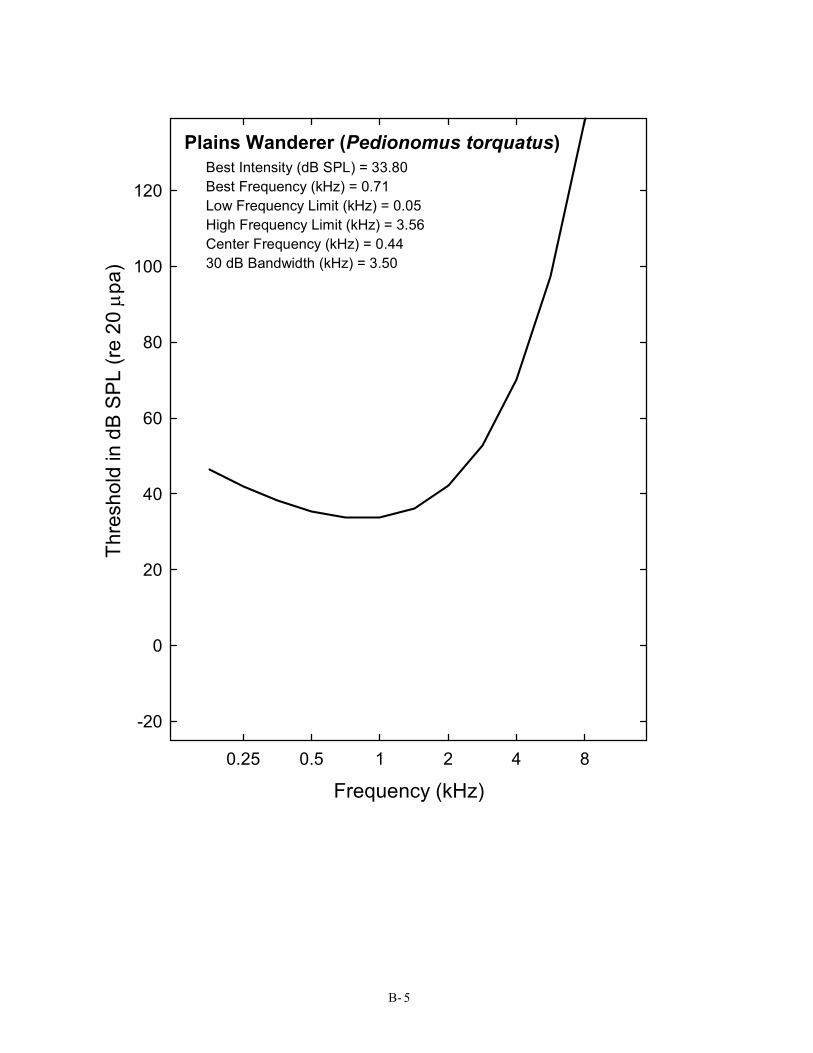
Plains Wanderer (Pedionomus torquatus) Best Intensity (dB SPL) = 33.80 Best Frequency (kHz) = 0.71 Low Frequency Limit (kHz) = 0.05 High Frequency Limit (kHz) = 3.56 Center Frequency (kHz) = 0.44 30 dB Bandwidth (kHz) = 3.50
0.25 0.5 1 2 4 8
Frequency (kHz)
B- 5
Thre
shol
d in
dB
SPL
(re 2
0 µ p
a)
120
100
80
60
40
20
0
-20
0.25 0.5 1 2 4
Frequency (kHz)
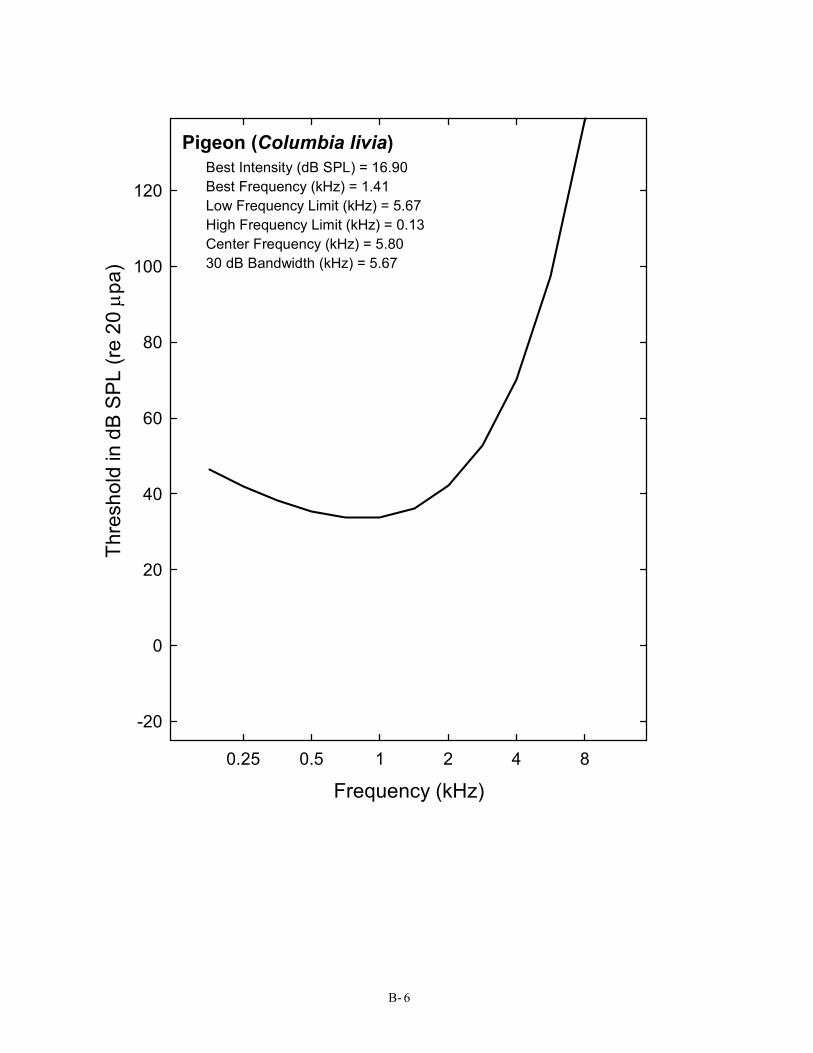
Pigeon (Columbia livia) Best Intensity (dB SPL) = 16.90 Best Frequency (kHz) = 1.41 Low Frequency Limit (kHz) = 5.67 High Frequency Limit (kHz) = 0.13 Center Frequency (kHz) = 5.80 30 dB Bandwidth (kHz) = 5.67
B- 6
8

Thre
shol
d in
dB
SPL
(re 2
0 µ p
a)
120
100
80
60
40
20
0
-20
0.25 0.5 1 2 4
Frequency (kHz)
American Kestrel (Falco sparverius) Best Intensity (dB SPL) = 2.42 Best Frequency (kHz) = 2.00 Low Frequency Limit (kHz) = 0.36 High Frequency Limit (kHz) = 5.25 Center Frequency (kHz) = 1.37 30 dB Bandwidth (kHz) = 4.89
B- 7
8
Thre
shol
d in
dB
SPL
(re 2
0 µ p
a)
120
100
80
60
40
20
0
-20
0.25 0.5 1 2 4
Frequency (kHz)
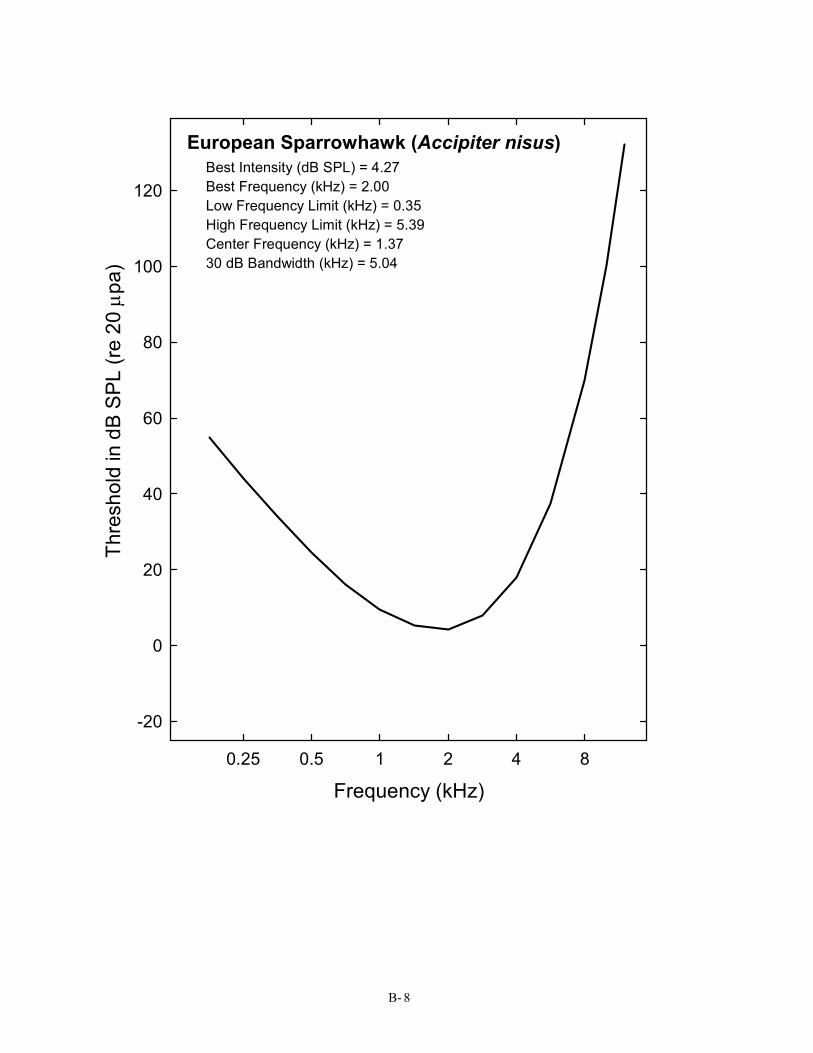
European Sparrowhawk (Accipiter nisus) Best Intensity (dB SPL) = 4.27 Best Frequency (kHz) = 2.00 Low Frequency Limit (kHz) = 0.35 High Frequency Limit (kHz) = 5.39 Center Frequency (kHz) = 1.37 30 dB Bandwidth (kHz) = 5.04
B- 8
8

Thre
shol
d in
dB
SPL
(re 2
0 µ p
a)
120
100
80
60
40
20
0
-20
0.25 0.5 1 2 4
Frequency (kHz)
Bobwhite Quail (Colinus virgianus) Best Intensity (dB SPL) = 13.15 Best Frequency (kHz) = 2.00 Low Frequency Limit (kHz) = 2.13 High Frequency Limit (kHz) = 8.70 Center Frequency (kHz) = 1.35 30 dB Bandwidth (kHz) = 6.57
B- 9
8
Thre
shol
d in
dB
SPL
(re 2
0 µ p
a)
120
100
80
60
40
20
0
-20
0.25 0.5 1 2 4
Frequency (kHz)
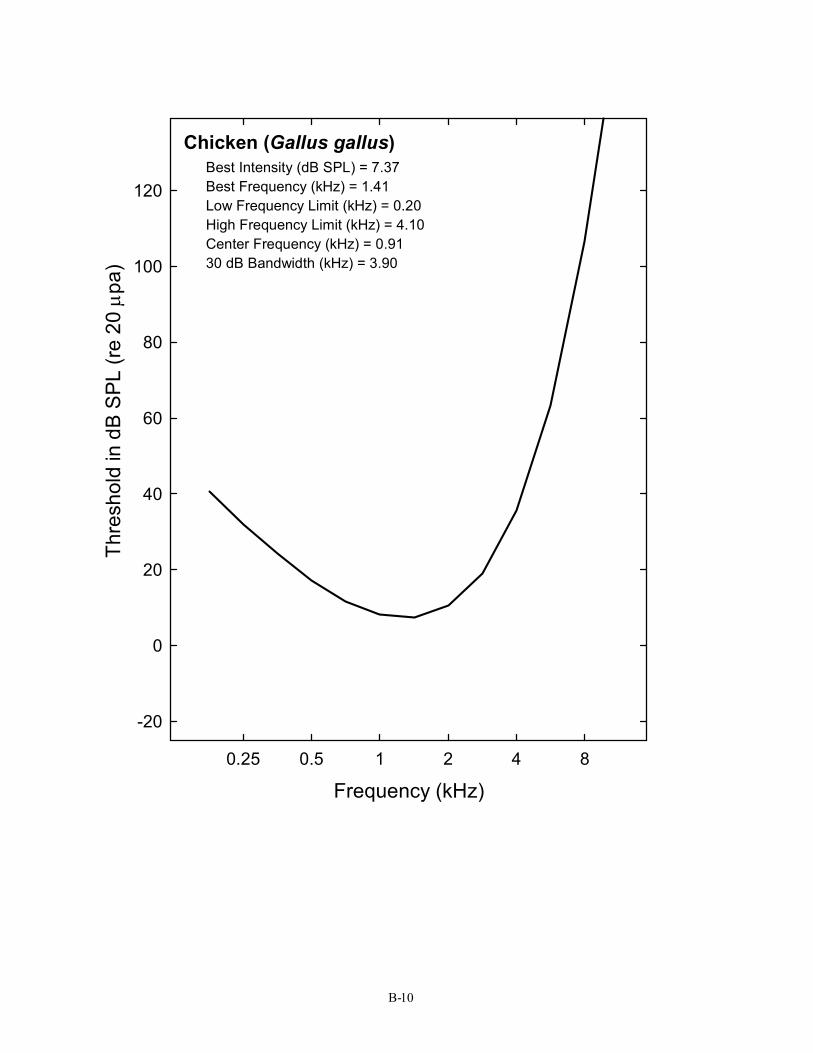
Chicken (Gallus gallus) Best Intensity (dB SPL) = 7.37 Best Frequency (kHz) = 1.41 Low Frequency Limit (kHz) = 0.20 High Frequency Limit (kHz) = 4.10 Center Frequency (kHz) = 0.91 30 dB Bandwidth (kHz) = 3.90
B-10
8

Thre
shol
d in
dB
SPL
(re 2
0 µ p
a)
120
100
80
60
40
20
0
-20
0.25 0.5 1 2 4
Frequency (kHz)
Japanese Quail (Coturnix coturnix japonica) Best Intensity (dB SPL) = 1.40 Best Frequency (kHz) = 2.00 Low Frequency Limit (kHz) = 0.47 High Frequency Limit (kHz) = 5.90 Center Frequency (kHz) = 1.66 30 dB Bandwidth (kHz) = 5.43
B-11
8
Thre
shol
d in
dB
SPL
(re 2
0 µ p
a)
120
100
80
60
40
20
0
-20
0.25 0.5 1 2 4
Frequency (kHz)
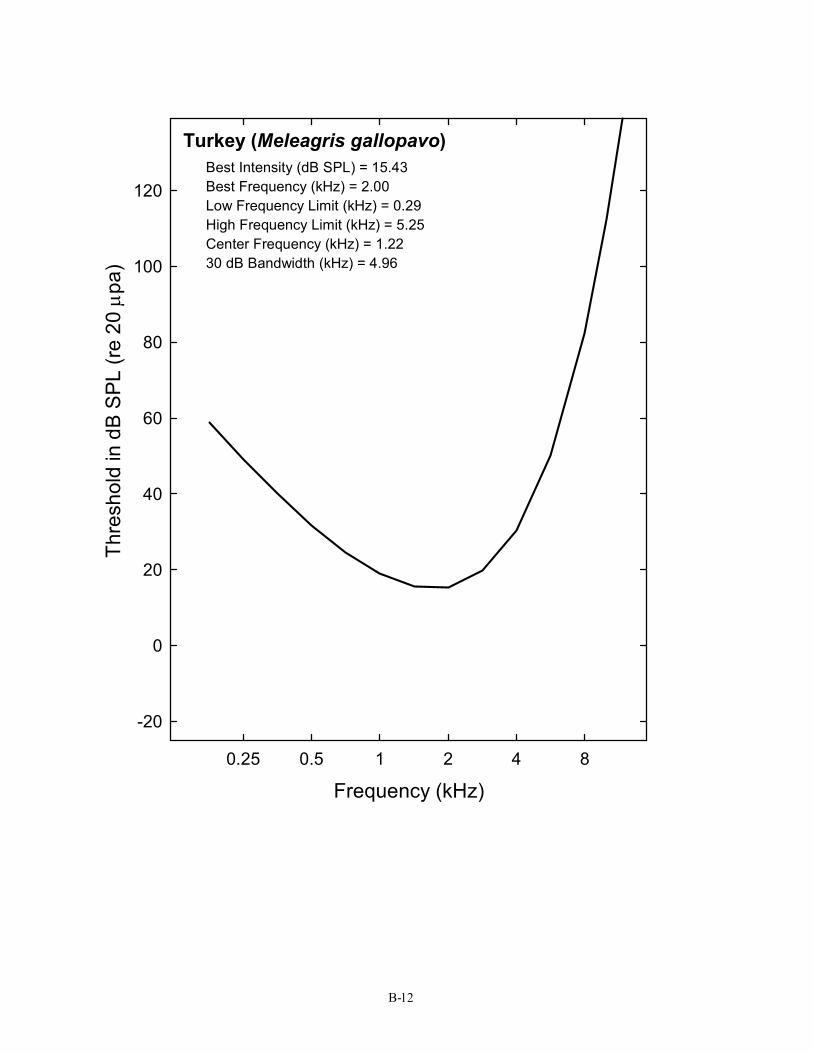
Turkey (Meleagris gallopavo) Best Intensity (dB SPL) = 15.43 Best Frequency (kHz) = 2.00 Low Frequency Limit (kHz) = 0.29 High Frequency Limit (kHz) = 5.25 Center Frequency (kHz) = 1.22 30 dB Bandwidth (kHz) = 4.96
B-12
8
Thre
shol
d in
dB
SPL
(re 2
0 µ p
a)
120
100
80
60
40
20
0
-20
0.25 0.5 1 2 4
Frequency (kHz)
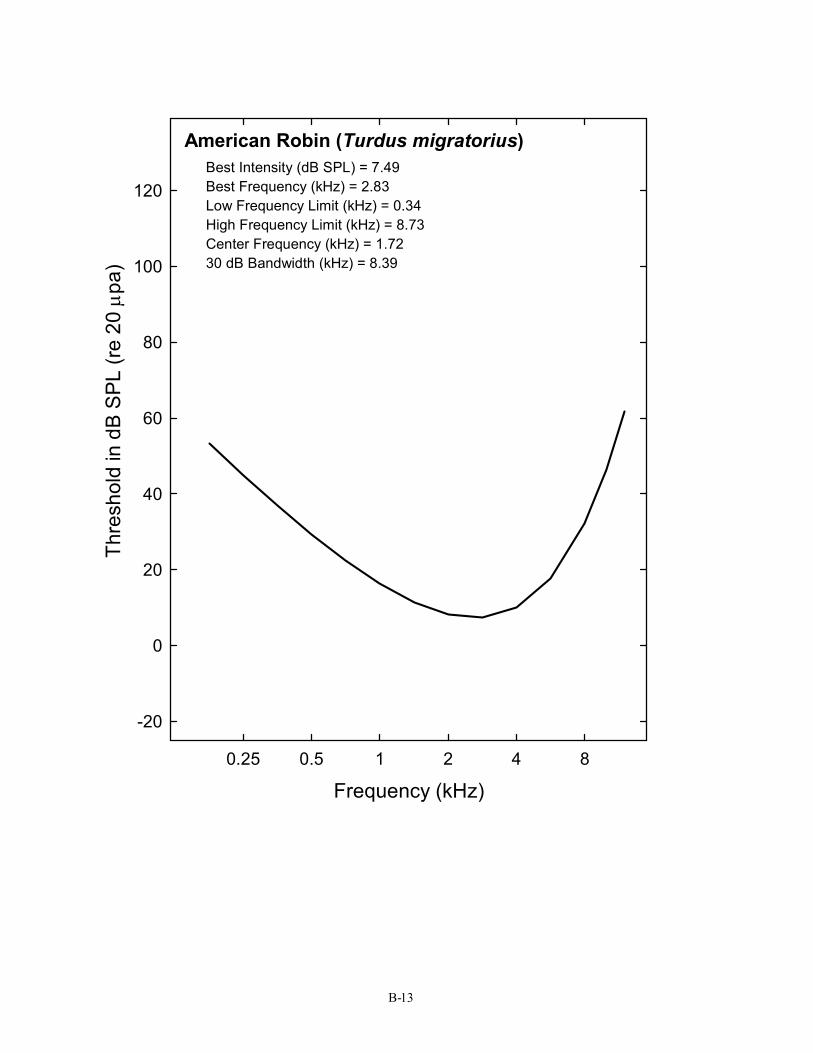
American Robin (Turdus migratorius) Best Intensity (dB SPL) = 7.49 Best Frequency (kHz) = 2.83 Low Frequency Limit (kHz) = 0.34 High Frequency Limit (kHz) = 8.73 Center Frequency (kHz) = 1.72 30 dB Bandwidth (kHz) = 8.39
B-13
8

Thre
shol
d in
dB
SPL
(re 2
0 µ p
a)
120
100
80
60
40
20
0
-20
0.25 0.5 1 2 4
Frequency (kHz)
Blue Jay (Cyanocitta cristata) Best Intensity (dB SPL) =14.46 Best Frequency (kHz) = 2.00 Low Frequency Limit (kHz) = 0.28 High Frequency Limit (kHz) = 6.31 Center Frequency (kHz) = 1.33 30 dB Bandwidth (kHz) = 6.03
B-14
8
Thre
shol
d in
dB
SPL
(re 2
0 µ p
a)
120
100
80
60
40
20
0
-20
0.25 0.5 1 2 4
Frequency (kHz)
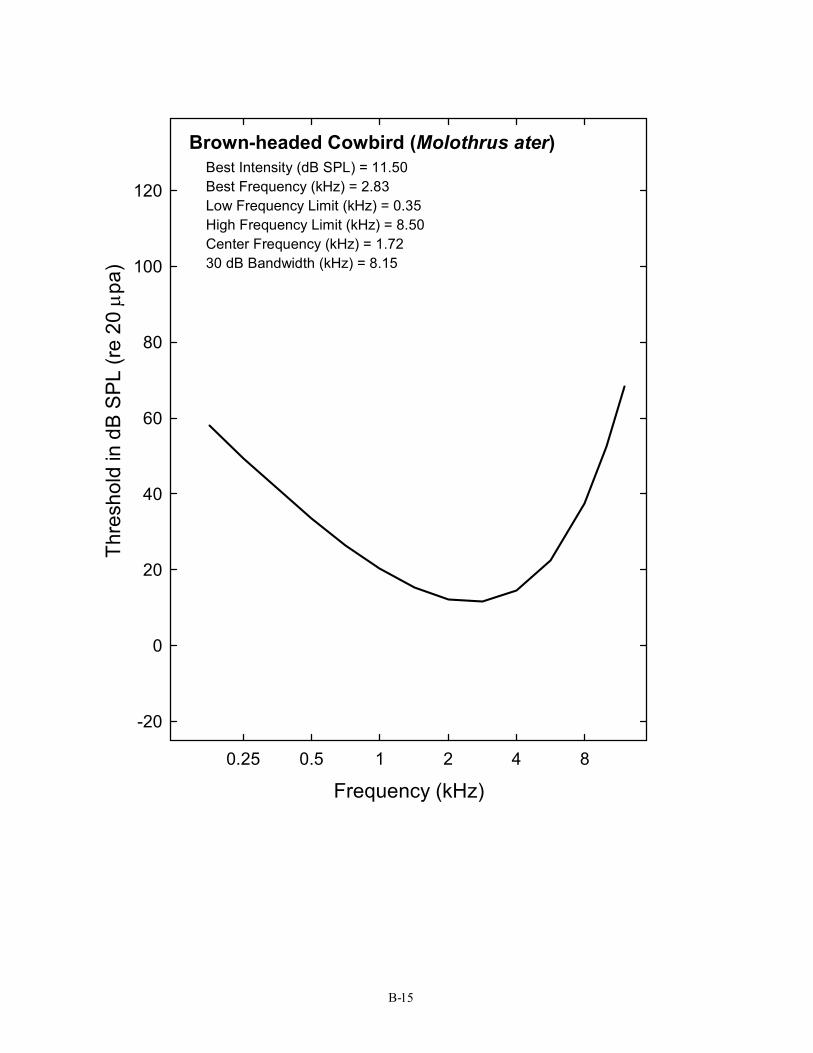
Brown-headed Cowbird (Molothrus ater) Best Intensity (dB SPL) = 11.50 Best Frequency (kHz) = 2.83 Low Frequency Limit (kHz) = 0.35 High Frequency Limit (kHz) = 8.50 Center Frequency (kHz) = 1.72 30 dB Bandwidth (kHz) = 8.15
B-15
8
Thre
shol
d in
dB
SPL
(re 2
0 µ p
a)
120
100
80
60
40
20
0
-20
0.25 0.5 1 2 4
Frequency (kHz)
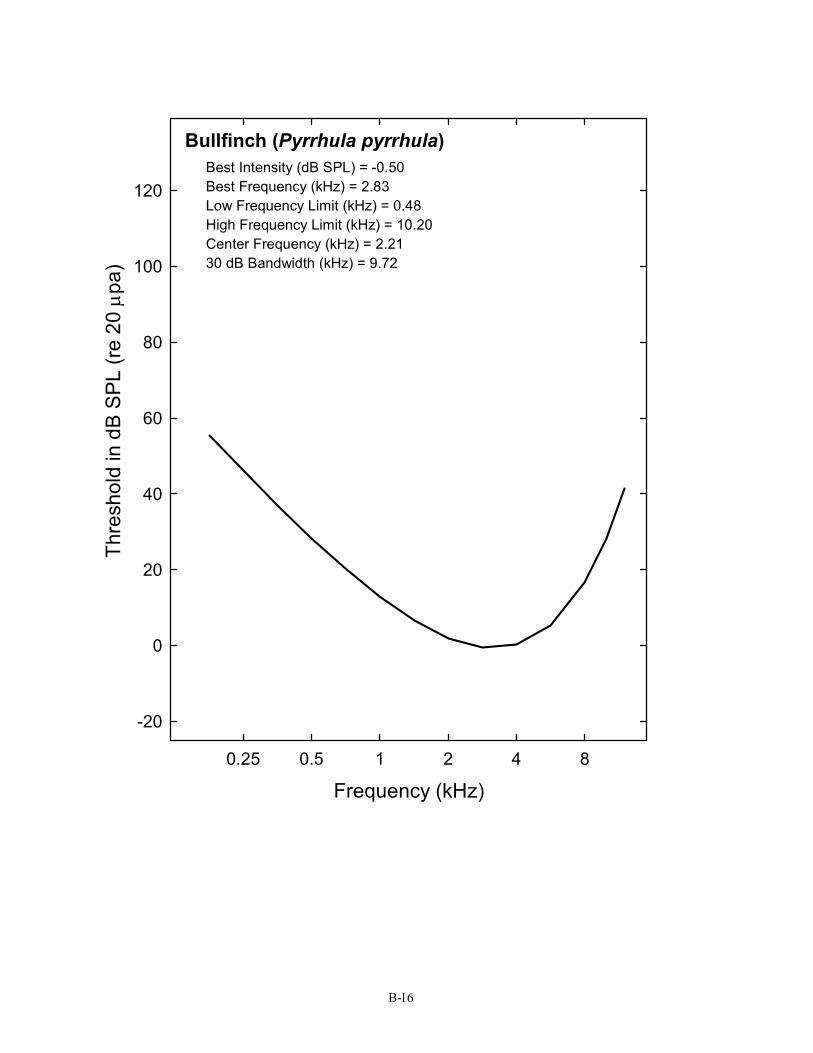
Bullfinch (Pyrrhula pyrrhula) Best Intensity (dB SPL) = -0.50 Best Frequency (kHz) = 2.83 Low Frequency Limit (kHz) = 0.48 High Frequency Limit (kHz) = 10.20 Center Frequency (kHz) = 2.21 30 dB Bandwidth (kHz) = 9.72
B-16
8

Thre
shol
d in
dB
SPL
(re 2
0 µ p
a)
120
100
80
60
40
20
0
-20
0.25 0.5 1 2 4
Frequency (kHz)
Chipping Sparrow (Spizella passerina) Best Intensity (dB SPL) = 2.06 Best Frequency (kHz) = 4.00 Low Frequency Limit (kHz) = 0.59 High Frequency Limit (kHz) = 12.90 Center Frequency (kHz) = 2.75 30 dB Bandwidth (kHz) = 12.31
B-17
8
Thre
shol
d in
dB
SPL
(re 2
0 µ p
a)
120
100
80
60
40
20
0
-20
0.25 0.5 1 2 4
Frequency (kHz)
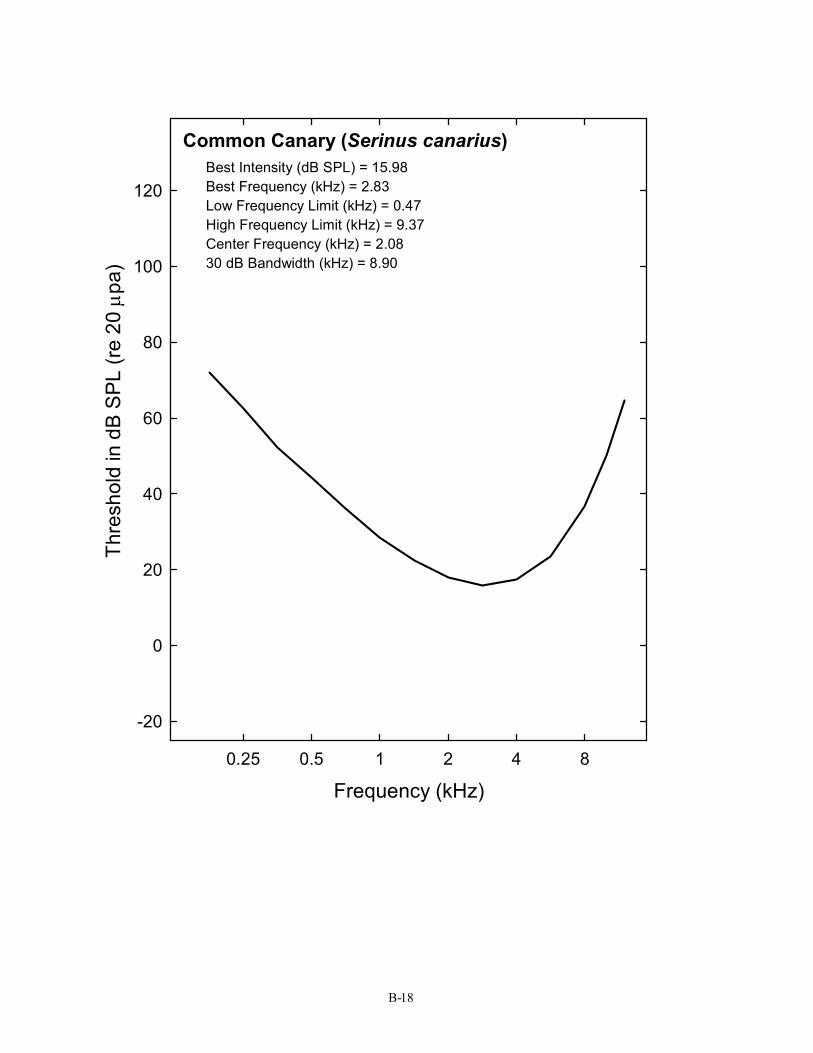
Common Canary (Serinus canarius) Best Intensity (dB SPL) = 15.98 Best Frequency (kHz) = 2.83 Low Frequency Limit (kHz) = 0.47 High Frequency Limit (kHz) = 9.37 Center Frequency (kHz) = 2.08 30 dB Bandwidth (kHz) = 8.90
B-18
8
Thre
shol
d in
dB
SPL
(re 2
0 µ p
a)
120
100
80
60
40
20
0
-20
0.25 0.5 1 2 4
Frequency (kHz)
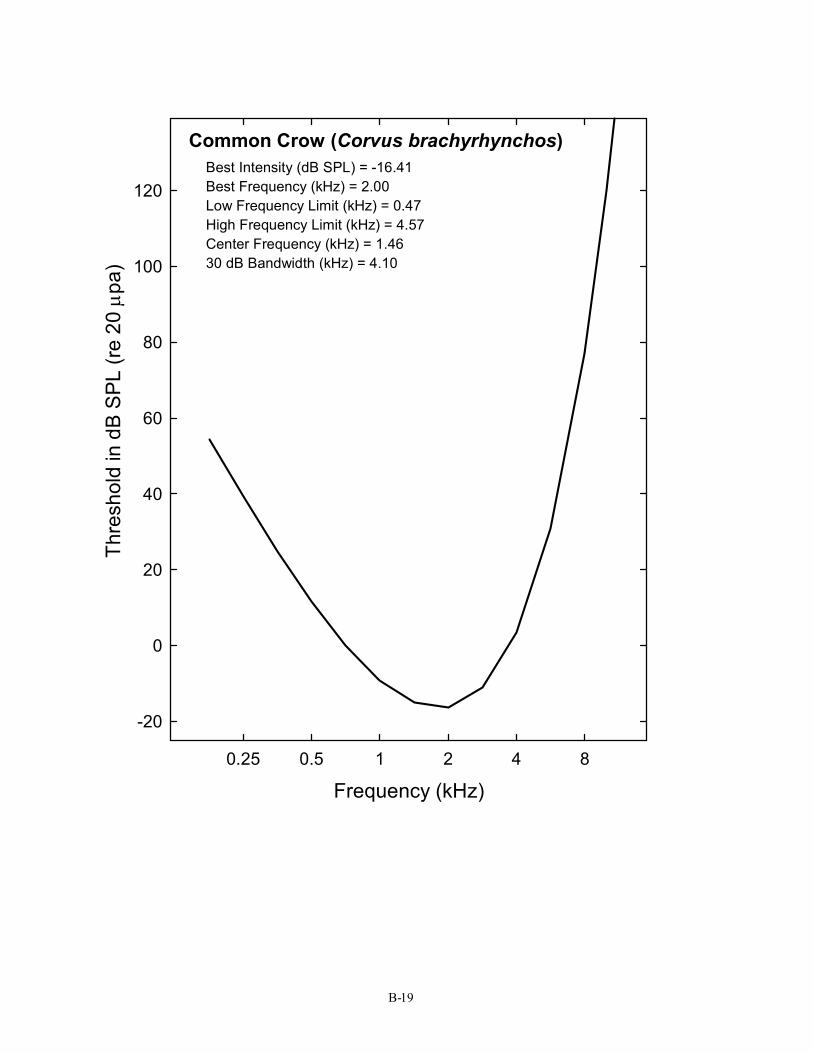
Common Crow (Corvus brachyrhynchos) Best Intensity (dB SPL) = -16.41 Best Frequency (kHz) = 2.00 Low Frequency Limit (kHz) = 0.47 High Frequency Limit (kHz) = 4.57 Center Frequency (kHz) = 1.46 30 dB Bandwidth (kHz) = 4.10
B-19
8

Thre
shol
d in
dB
SPL
(re 2
0 µ p
a)
120
100
80
60
40
20
0
-20
0.25 0.5 1 2 4
Frequency (kHz)
European Starling (Sturnus vulgaris) Best Intensity (dB SPL) = 8.00 Best Frequency (kHz) = 2.00 Low Frequency Limit (kHz) = 0.23 High Frequency Limit (kHz) = 6.43 Center Frequency (kHz) = 1.20 30 dB Bandwidth (kHz) = 6.20
B-20
8

Thre
shol
d in
dB
SPL
(re 2
0 µ p
a)
120
100
80
60
40
20
0
-20
0.25 0.5 1 2 4
Frequency (kHz)
Field Sparrow (Spizella pusilla) Best Intensity (dB SPL) = 9.61 Best Frequency (kHz) = 2.83 Low Frequency Limit (kHz) = 0.32 High Frequency Limit (kHz) = 8.65 Center Frequency (kHz) = 1.65 30 dB Bandwidth (kHz) = 8.33
B-21
8
Thre
shol
d in
dB
SPL
(re 2
0 µ p
a)
120
100
80
60
40
20
0
-20
0.25 0.5 1 2 4
Frequency (kHz)
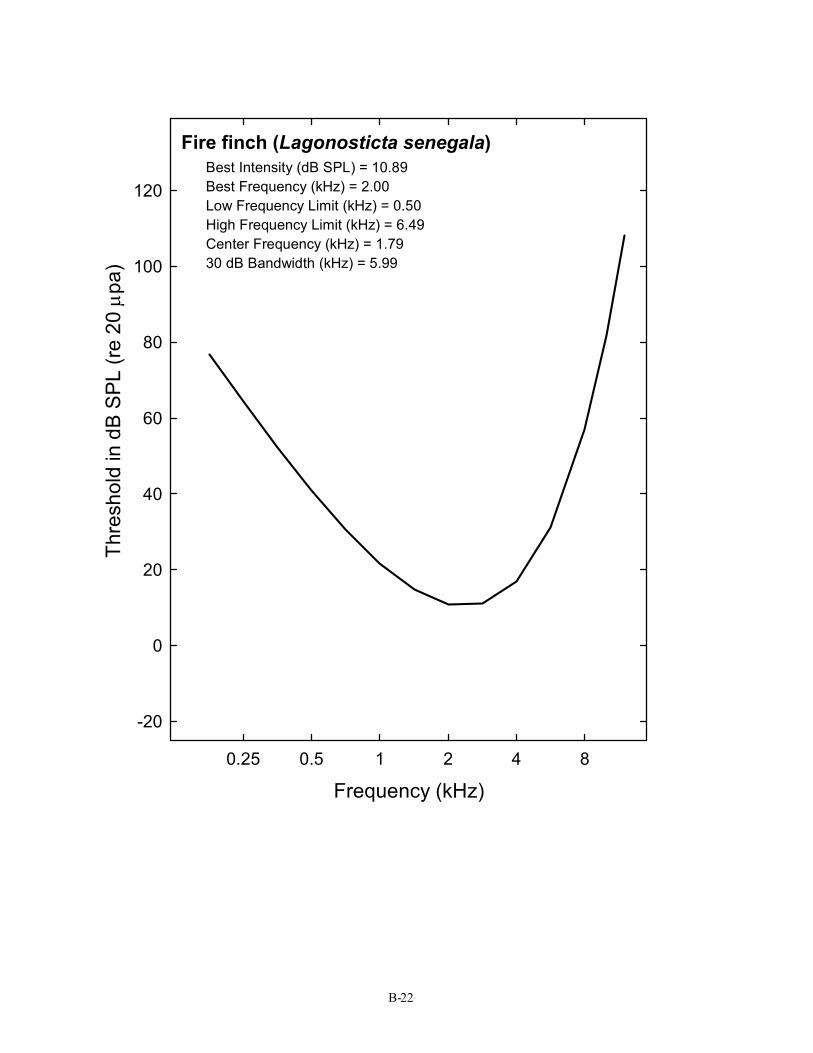
Fire finch (Lagonosticta senegala) Best Intensity (dB SPL) = 10.89 Best Frequency (kHz) = 2.00 Low Frequency Limit (kHz) = 0.50 High Frequency Limit (kHz) = 6.49 Center Frequency (kHz) = 1.79 30 dB Bandwidth (kHz) = 5.99
B-22
8
Thre
shol
d in
dB
SPL
(re 2
0 µ p
a)
120
100
80
60
40
20
0
-20
0.25 0.5 1 2 4
Frequency (kHz)
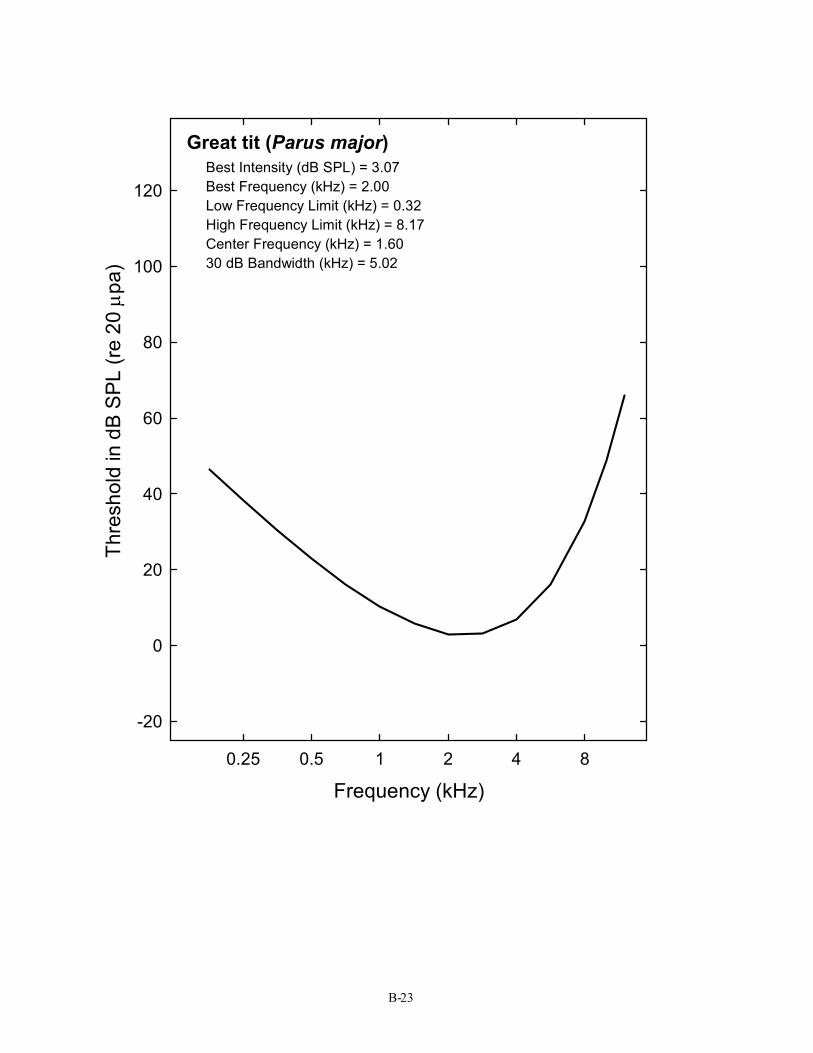
Great tit (Parus major) Best Intensity (dB SPL) = 3.07 Best Frequency (kHz) = 2.00 Low Frequency Limit (kHz) = 0.32 High Frequency Limit (kHz) = 8.17 Center Frequency (kHz) = 1.60 30 dB Bandwidth (kHz) = 5.02
B-23
8
Thre
shol
d in
dB
SPL
(re 2
0 µ p
a)
120
100
80
60
40
20
0
-20
0.25 0.5 1 2 4
Frequency (kHz)
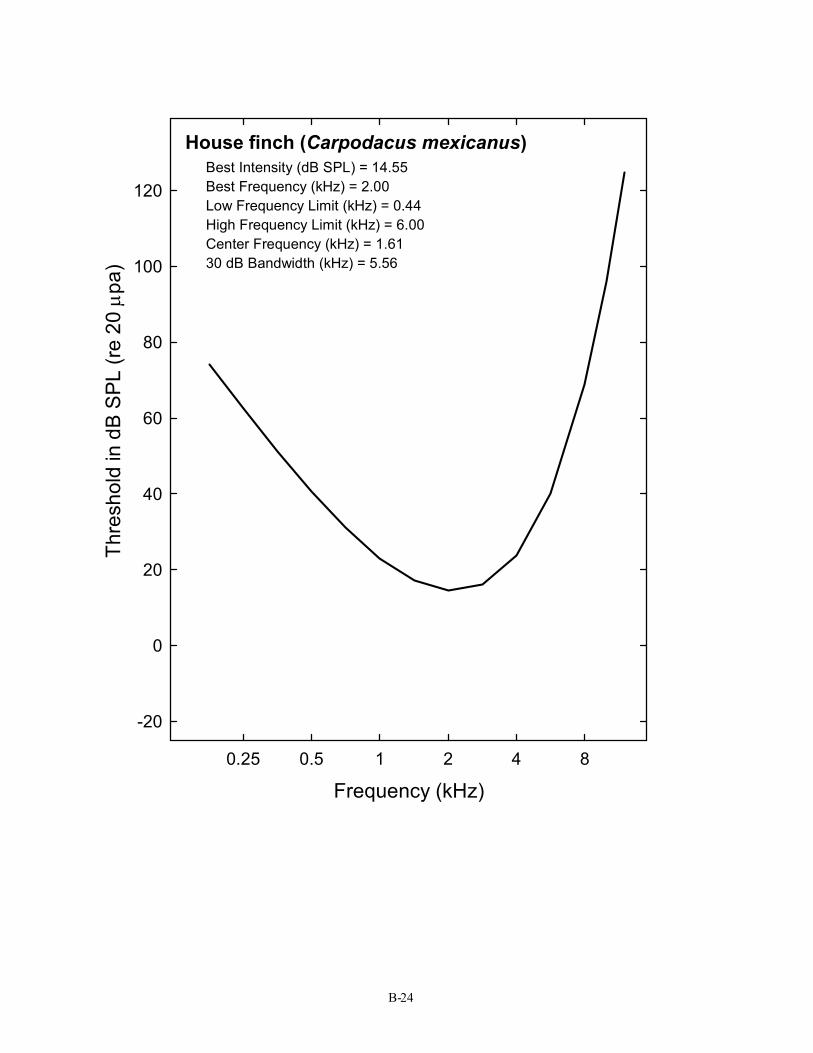
House finch (Carpodacus mexicanus) Best Intensity (dB SPL) = 14.55 Best Frequency (kHz) = 2.00 Low Frequency Limit (kHz) = 0.44 High Frequency Limit (kHz) = 6.00 Center Frequency (kHz) = 1.61 30 dB Bandwidth (kHz) = 5.56
B-24
8

Thre
shol
d in
dB
SPL
(re 2
0 µ p
a)
120
100
80
60
40
20
0
-20
0.25 0.5 1 2 4
Frequency (kHz)
House Sparrow (Passer domesticus) Best Intensity (dB SPL) = -8.31 Best Frequency (kHz) = 1.41 Low Frequency Limit (kHz) = 0.29 High Frequency Limit (kHz) = 4.55 Center Frequency (kHz) = 1.13 30 dB Bandwidth (kHz) = 4.27
B-25
8

Thre
shol
d in
dB
SPL
(re 2
0 µ p
a)
120
100
80
60
40
20
0
-20
0.25 0.5 1 2 4
Frequency (kHz)
Pied Flycatcher (Ficedula hypolueca) Best Intensity (dB SPL) = 11.70 Best Frequency (kHz) = 2.83 Low Frequency Limit (kHz) = 0.44 High Frequency Limit (kHz) = 7.34 Center Frequency (kHz) = 1.79 30 dB Bandwidth (kHz) = 6.90
B-26
8
Thre
shol
d in
dB
SPL
(re 2
0 µ p
a)
120
100
80
60
40
20
0
-20
0.25 0.5 1 2 4
Frequency (kHz)
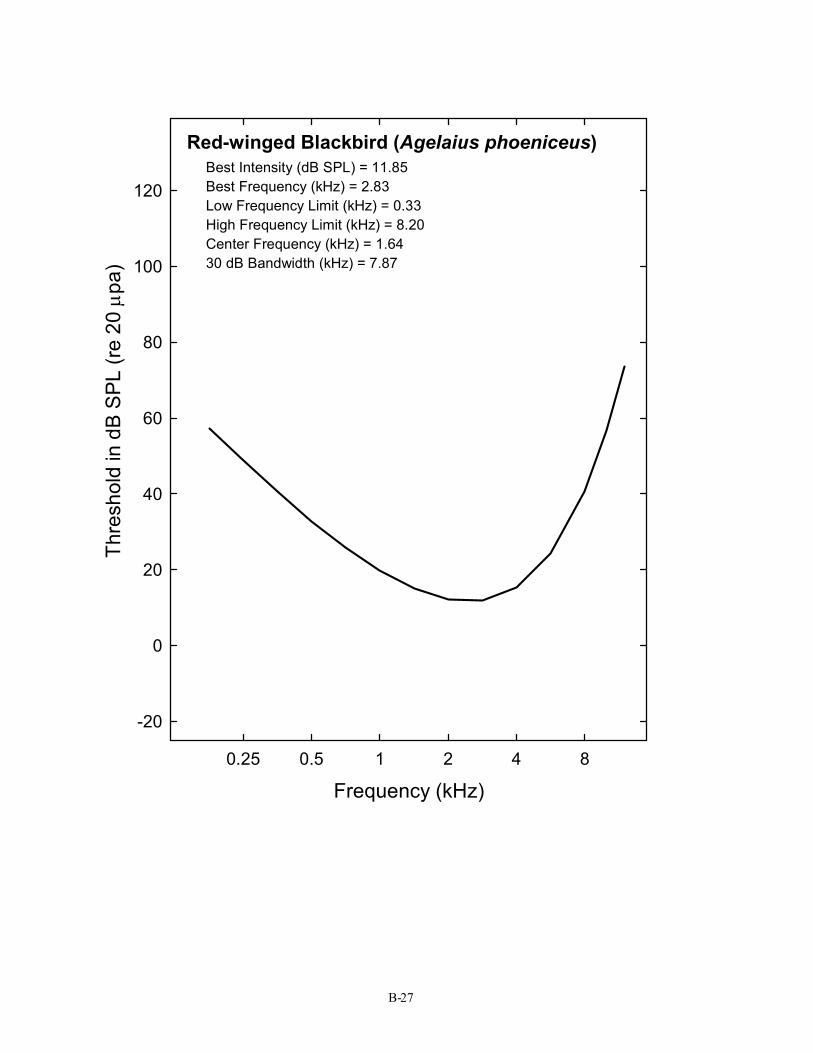
Red-winged Blackbird (Agelaius phoeniceus) Best Intensity (dB SPL) = 11.85 Best Frequency (kHz) = 2.83 Low Frequency Limit (kHz) = 0.33 High Frequency Limit (kHz) = 8.20 Center Frequency (kHz) = 1.64 30 dB Bandwidth (kHz) = 7.87
B-27
8

Thre
shol
d in
dB
SPL
(re 2
0 µ p
a)
120
100
80
60
40
20
0
-20
0.25 0.5 1 2 4
Frequency (kHz)
Slate-colored Junco (Junco hyemalis) Best Intensity (dB SPL) = -5.29 Best Frequency (kHz) = 2.83 Low Frequency Limit (kHz) = 0.68 High Frequency Limit (kHz) = 8.25 Center Frequency (kHz) = 2.36 30 dB Bandwidth (kHz) = 7.57
B-28
8
Thre
shol
d in
dB
SPL
(re 2
0 µ p
a)
120
100
80
60
40
20
0
-20
0.25 0.5 1 2 4
Frequency (kHz)
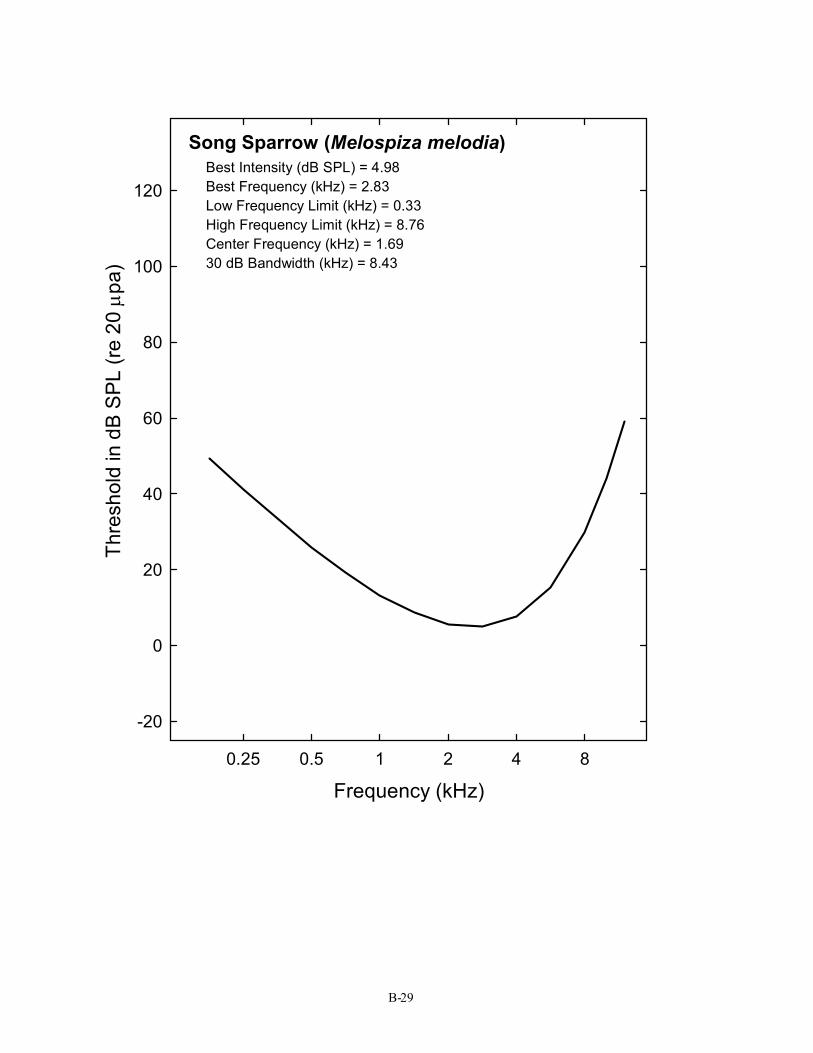
Song Sparrow (Melospiza melodia) Best Intensity (dB SPL) = 4.98 Best Frequency (kHz) = 2.83 Low Frequency Limit (kHz) = 0.33 High Frequency Limit (kHz) = 8.76 Center Frequency (kHz) = 1.69 30 dB Bandwidth (kHz) = 8.43
B-29
8

Thre
shol
d in
dB
SPL
(re 2
0 µ p
a)
120
100
80
60
40
20
0
-20
0.25 0.5 1 2 4
Frequency (kHz)
Swamp Sparrow (Melospiza georgiana) Best Intensity (dB SPL) = 6.05 Best Frequency (kHz) = 2.83 Low Frequency Limit (kHz) = 0.37 High Frequency Limit (kHz) = 9.00 Center Frequency (kHz) = 1.82 30 dB Bandwidth (kHz) = 8.63
B-30
8

Thre
shol
d in
dB
SPL
(re 2
0 µ p
a)
120
100
80
60
40
20
0
-20
0.25 0.5 1 2 4
Frequency (kHz)
Western Meadowlark (Sturnella neglecta) Best Intensity (dB SPL) = -3.06 Best Frequency (kHz) = 2.00 Low Frequency Limit (kHz) =0.37 High Frequency Limit (kHz) = 5.55 Center Frequency (kHz) = 1.42 30 dB Bandwidth (kHz) = 5.18
B-31
8
Thre
shol
d in
dB
SPL
(re 2
0 µ p
a)
120
100
80
60
40
20
0
-20
0.25 0.5 1 2 4
Frequency (kHz)
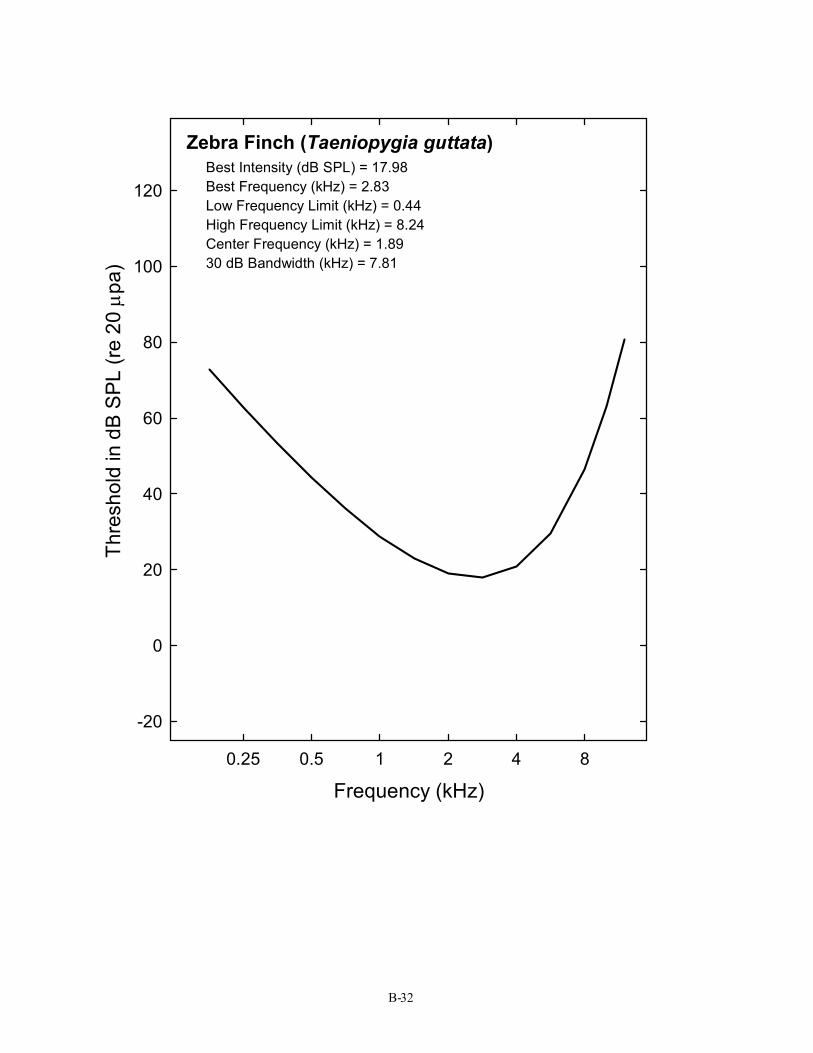
Zebra Finch (Taeniopygia guttata) Best Intensity (dB SPL) = 17.98 Best Frequency (kHz) = 2.83 Low Frequency Limit (kHz) = 0.44 High Frequency Limit (kHz) = 8.24 Center Frequency (kHz) = 1.89 30 dB Bandwidth (kHz) = 7.81
B-32
8
Thre
shol
d in
dB
SPL
(re 2
0 µ p
a)
120
100
80
60
40
20
0
-20
0.25 0.5 1 2 4
Frequency (kHz)
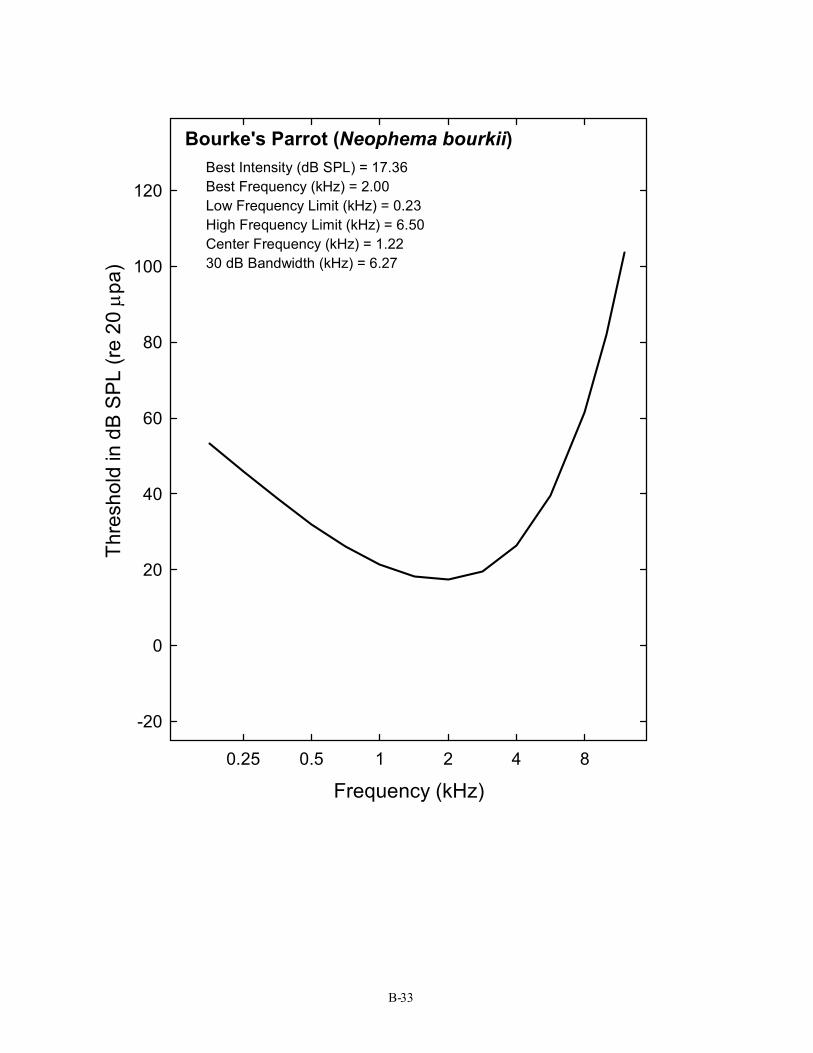
Bourke's Parrot (Neophema bourkii) Best Intensity (dB SPL) = 17.36 Best Frequency (kHz) = 2.00 Low Frequency Limit (kHz) = 0.23 High Frequency Limit (kHz) = 6.50 Center Frequency (kHz) = 1.22 30 dB Bandwidth (kHz) = 6.27
B-33
8

Thre
shol
d in
dB
SPL
(re 2
0 µ p
a)
120
100
80
60
40
20
0
-20
0.25 0.5 1 2 4
Frequency (kHz)
Budgerigar (Melopsittacus undulatus) Best Intensity (dB SPL) = 0.80 Best Frequency (kHz) = 2.00 Low Frequency Limit (kHz) = 0.36 High Frequency Limit (kHz) = 5.97 Center Frequency (kHz) = 1.45 30 dB Bandwidth (kHz) = 5.62
B-34
8
Thre
shol
d in
dB
SPL
(re 2
0 µ p
a)
120
100
80
60
40
20
0
-20
0.25 0.5 1 2 4
Frequency (kHz)
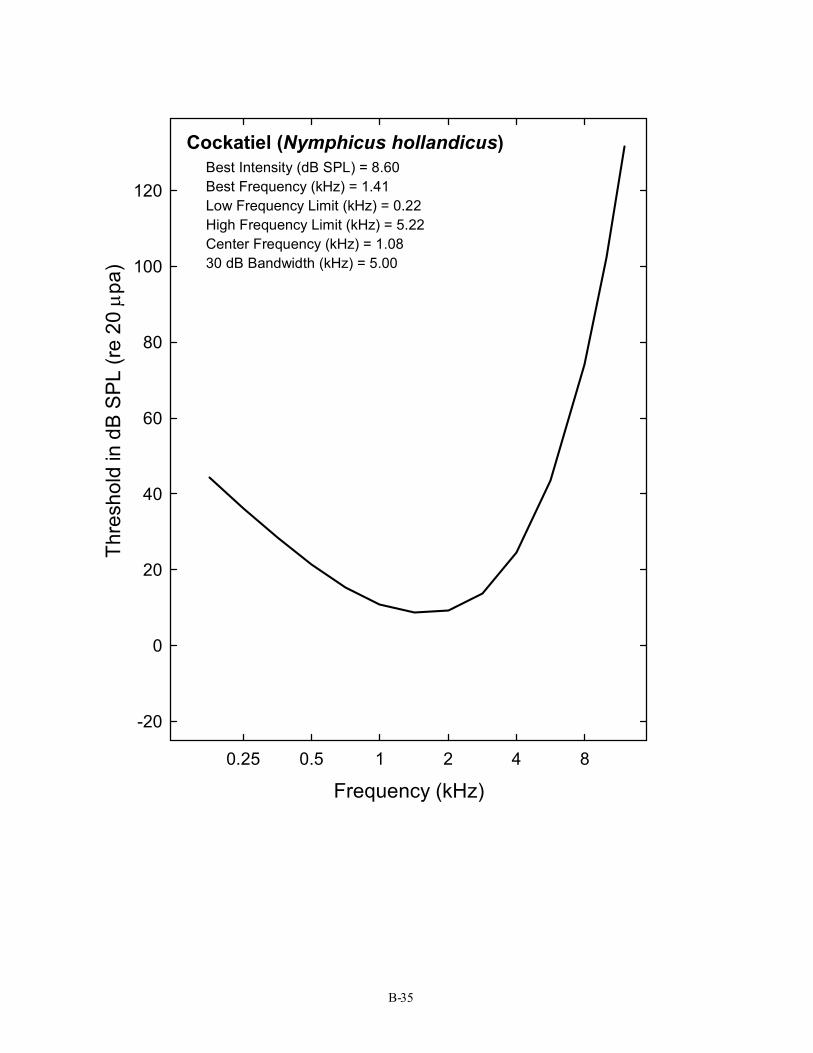
Cockatiel (Nymphicus hollandicus) Best Intensity (dB SPL) = 8.60 Best Frequency (kHz) = 1.41 Low Frequency Limit (kHz) = 0.22 High Frequency Limit (kHz) = 5.22 Center Frequency (kHz) = 1.08 30 dB Bandwidth (kHz) = 5.00
B-35
8
Thre
shol
d in
dB
SPL
(re 2
0 µ p
a)
120
100
80
60
40
20
0
-20
0.25 0.5 1 2 4
Frequency (kHz)
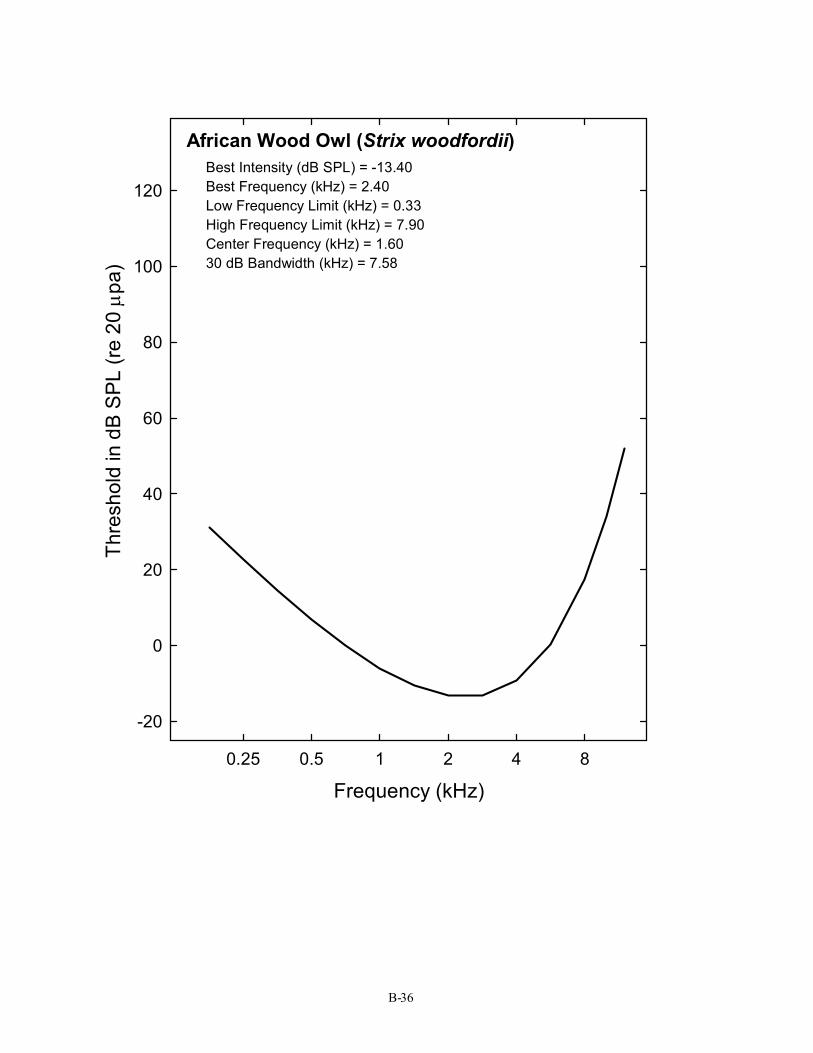
African Wood Owl (Strix woodfordii) Best Intensity (dB SPL) = -13.40 Best Frequency (kHz) = 2.40 Low Frequency Limit (kHz) = 0.33 High Frequency Limit (kHz) = 7.90 Center Frequency (kHz) = 1.60 30 dB Bandwidth (kHz) = 7.58
B-36
8
Thre
shol
d in
dB
SPL
(re 2
0 µ p
a)
120
100
80
60
40
20
0
-20
0.25 0.5 1 2 4
Frequency (kHz)
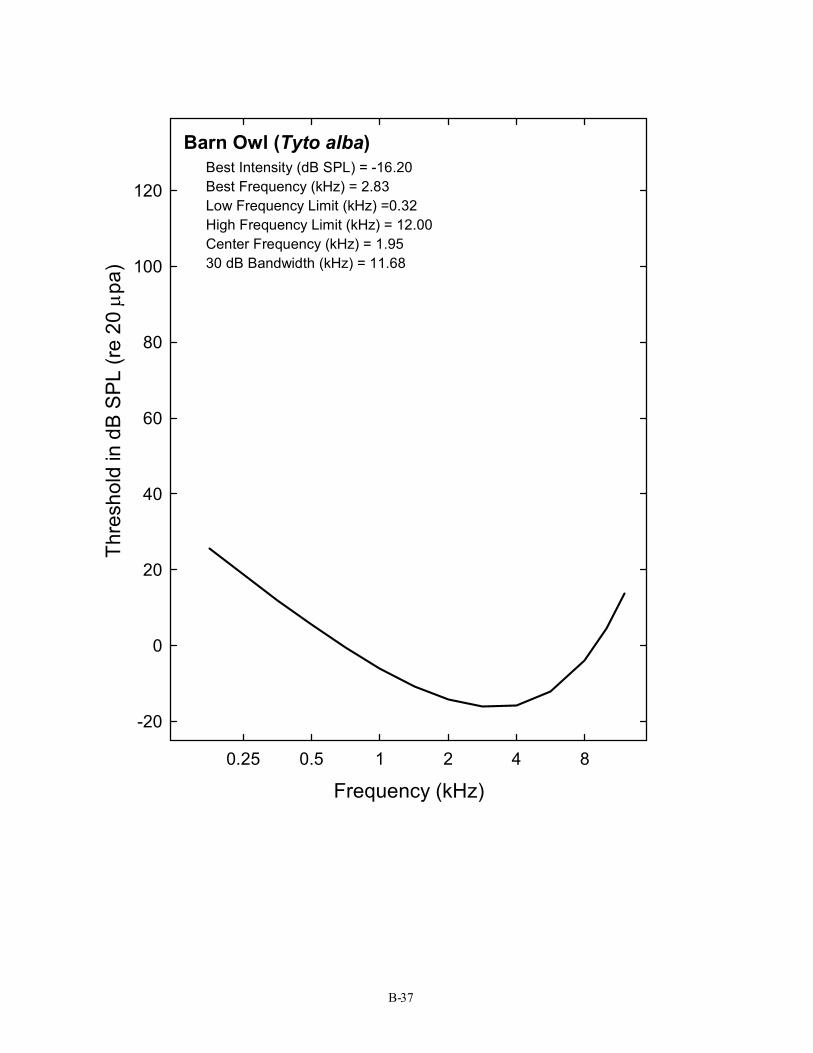
Barn Owl (Tyto alba) Best Intensity (dB SPL) = -16.20 Best Frequency (kHz) = 2.83 Low Frequency Limit (kHz) =0.32 High Frequency Limit (kHz) = 12.00 Center Frequency (kHz) = 1.95 30 dB Bandwidth (kHz) = 11.68
B-37
8

Thre
shol
d in
dB
SPL
(re 2
0 µ p
a)
120
100
80
60
40
20
0
-20
0.25 0.5 1 2 4
Frequency (kHz)
Brown Fish Owl (Ketupa zeylonensis) Best Intensity (dB SPL) = -1.60 Best Frequency (kHz) = 1.00 Low Frequency Limit (kHz) = 0.08 High Frequency Limit (kHz) = 4.00 Center Frequency (kHz) = 0.57 30 dB Bandwidth (kHz) = 3.92
B-38
8

Thre
shol
d in
dB
SPL
(re 2
0 µ p
a)
120
100
80
60
40
20
0
-20
0.25 0.5 1 2 4
Frequency (kHz)
Eagle Owl (Bubo bubo) Best Intensity (dB SPL) = -23.48 Best Frequency (kHz) = 2.00 Low Frequency Limit (kHz) = 0.21 High Frequency Limit (kHz) = 6.52 Center Frequency (kHz) = 1.18 30 dB Bandwidth (kHz) = 6.31
B-39
8
Thre
shol
d in
dB
SPL
(re 2
0 µ p
a)
120
100
80
60
40
20
0
-20
0.25 0.5 1 2 4
Frequency (kHz)
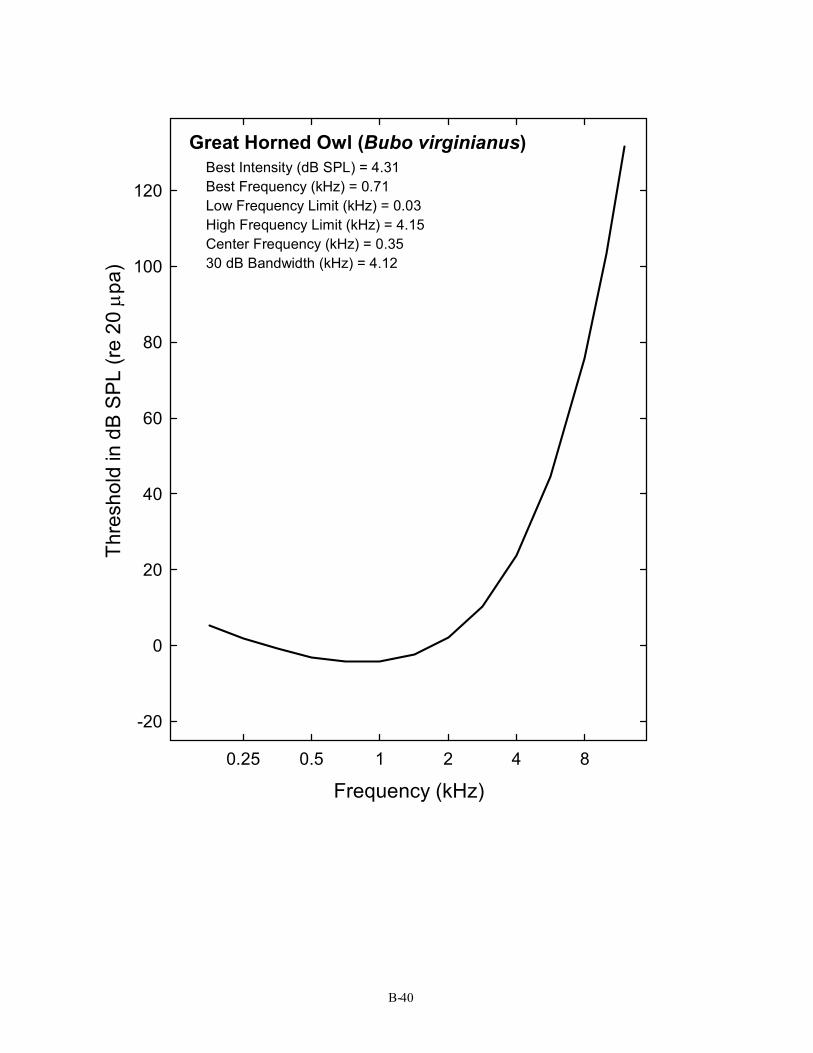
Great Horned Owl (Bubo virginianus) Best Intensity (dB SPL) = 4.31 Best Frequency (kHz) = 0.71 Low Frequency Limit (kHz) = 0.03 High Frequency Limit (kHz) = 4.15 Center Frequency (kHz) = 0.35 30 dB Bandwidth (kHz) = 4.12
B-40
8
Thre
shol
d in
dB
SPL
(re 2
0 µ p
a)
120
100
80
60
40
20
0
-20
0.25 0.5 1 2 4
Frequency (kHz)
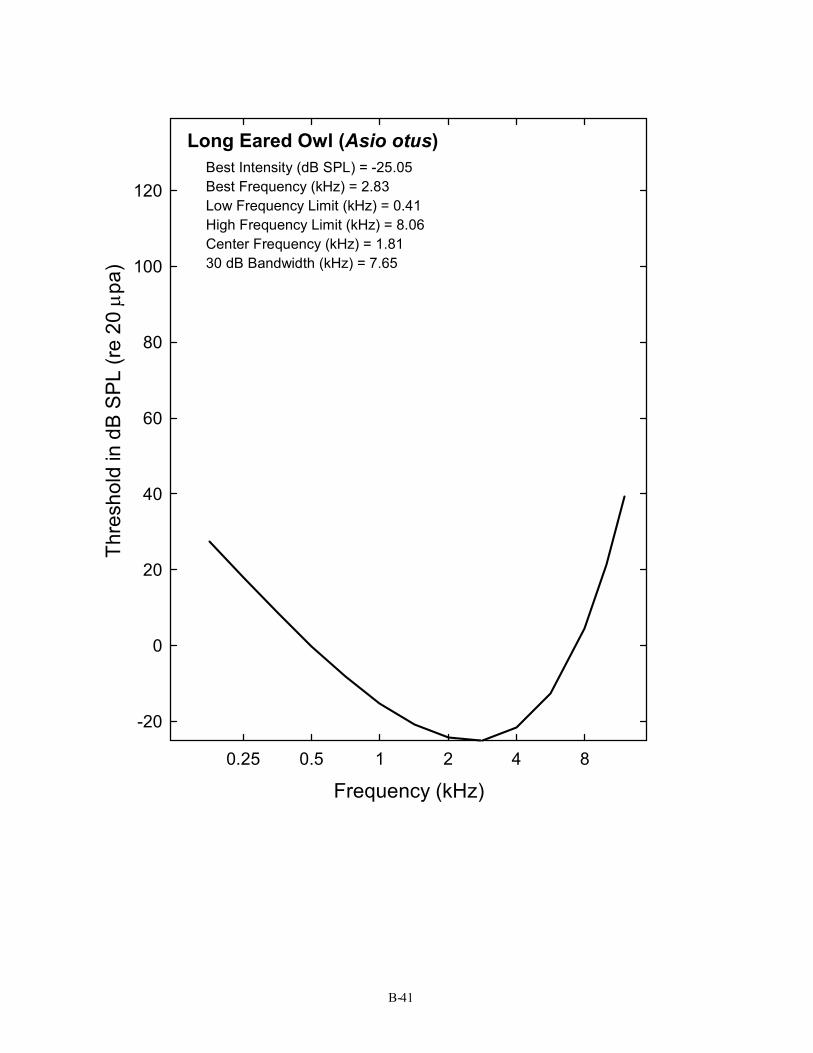
Long Eared Owl (Asio otus) Best Intensity (dB SPL) = -25.05 Best Frequency (kHz) = 2.83 Low Frequency Limit (kHz) = 0.41 High Frequency Limit (kHz) = 8.06 Center Frequency (kHz) = 1.81 30 dB Bandwidth (kHz) = 7.65
B-41
8

Thre
shol
d in
dB
SPL
(re 2
0 µ p
a)
120
100
80
60
40
20
0
-20
0.25 0.5 1 2 4
Frequency (kHz)
Mottled Owl (Strix virgata) Best Intensity (dB SPL) = -9.54 Best Frequency (kHz) = 1.41 Low Frequency Limit (kHz) = 0.06 High Frequency Limit (kHz) = 8.20 Center Frequency (kHz) = 0.72 30 dB Bandwidth (kHz) = 8.14
B-42
8
Thre
shol
d in
dB
SPL
(re 2
0 µ p
a)
120
100
80
60
40
20
0
-20
0.25 0.5 1 2 4
Frequency (kHz)
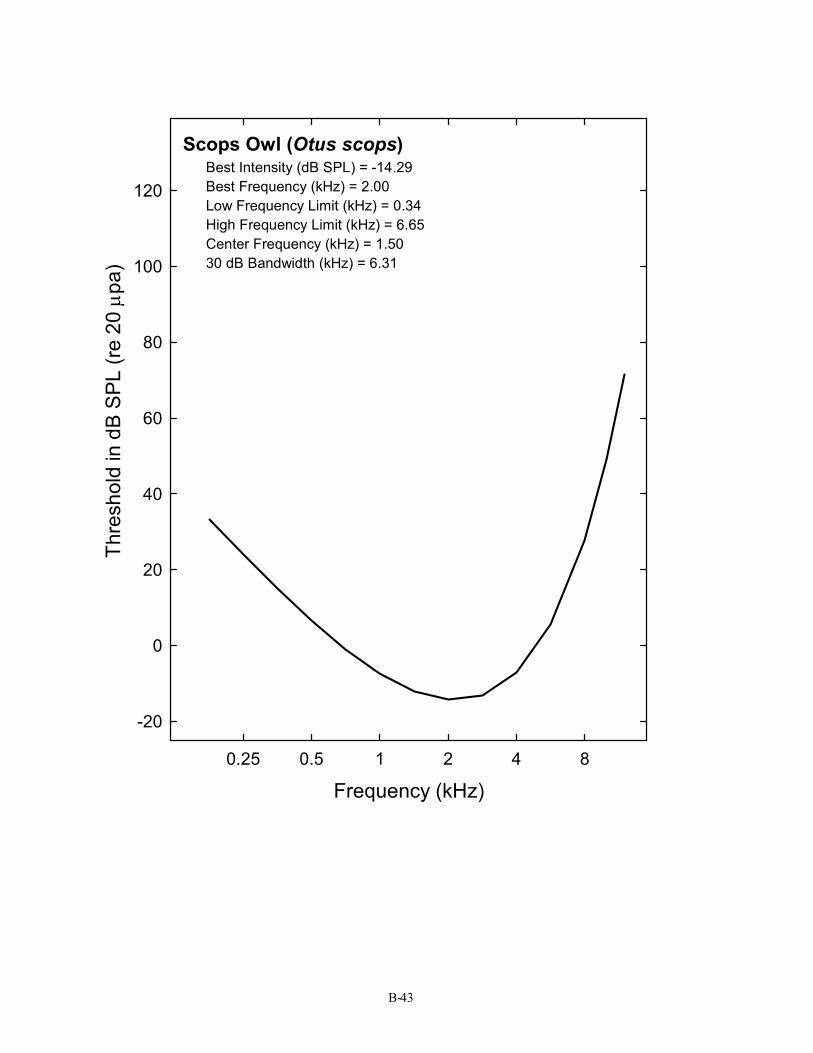
Scops Owl (Otus scops) Best Intensity (dB SPL) = -14.29 Best Frequency (kHz) = 2.00 Low Frequency Limit (kHz) = 0.34 High Frequency Limit (kHz) = 6.65 Center Frequency (kHz) = 1.50 30 dB Bandwidth (kHz) = 6.31
B-43
8
Thre
shol
d in
dB
SPL
(re 2
0 µ p
a)
120
100
80
60
40
20
0
-20
0.25 0.5 1 2 4
Frequency (kHz)
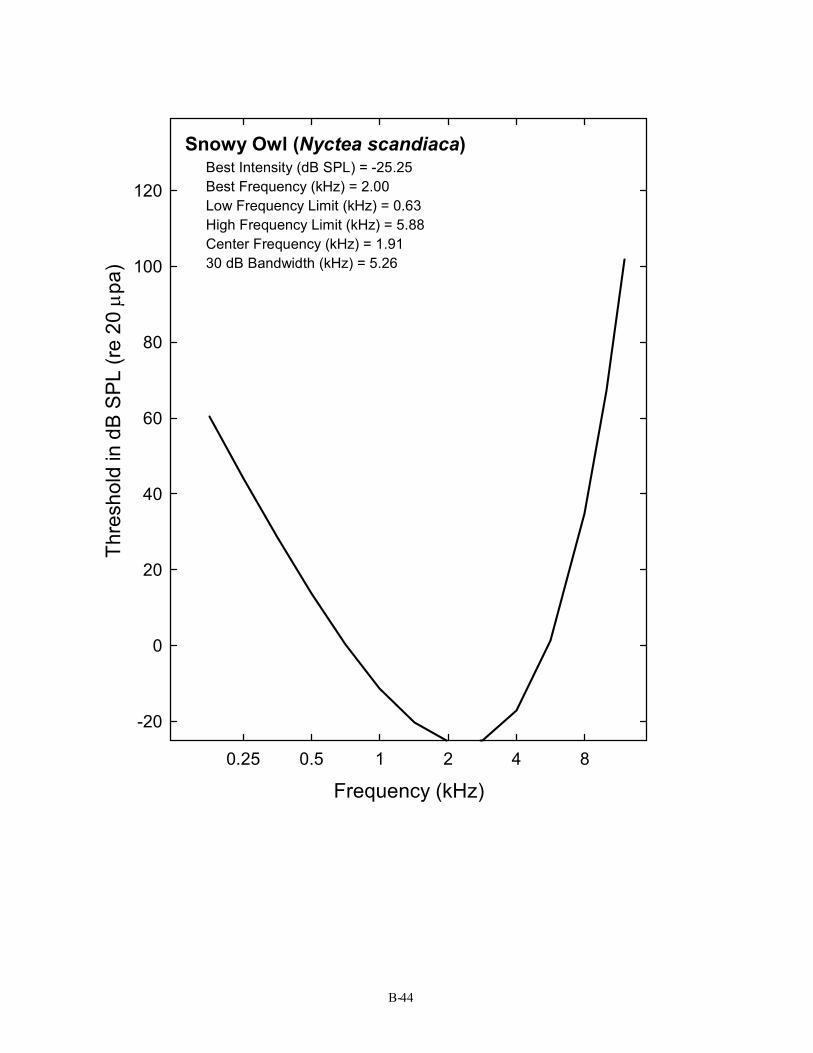
Snowy Owl (Nyctea scandiaca) Best Intensity (dB SPL) = -25.25 Best Frequency (kHz) = 2.00 Low Frequency Limit (kHz) = 0.63 High Frequency Limit (kHz) = 5.88 Center Frequency (kHz) = 1.91 30 dB Bandwidth (kHz) = 5.26
B-44
8

Thre
shol
d in
dB
SPL
(re 2
0 µ p
a)
120
100
80
60
40
20
0
-20
0.25 0.5 1 2 4
Frequency (kHz)
Spotted Wood Owl (Strix seloputo) Best Intensity (dB SPL) = -17.89 Best Frequency (kHz) = 2.00 Low Frequency Limit (kHz) = 0.21 High Frequency Limit (kHz) = 6.55 Center Frequency (kHz) = 1.17 30 dB Bandwidth (kHz) = 6.34
B-45
8
Thre
shol
d in
dB
SPL
(re 2
0 µ p
a)
120
100
80
60
40
20
0
-20
0.25 0.5 1 2 4
Frequency (kHz)
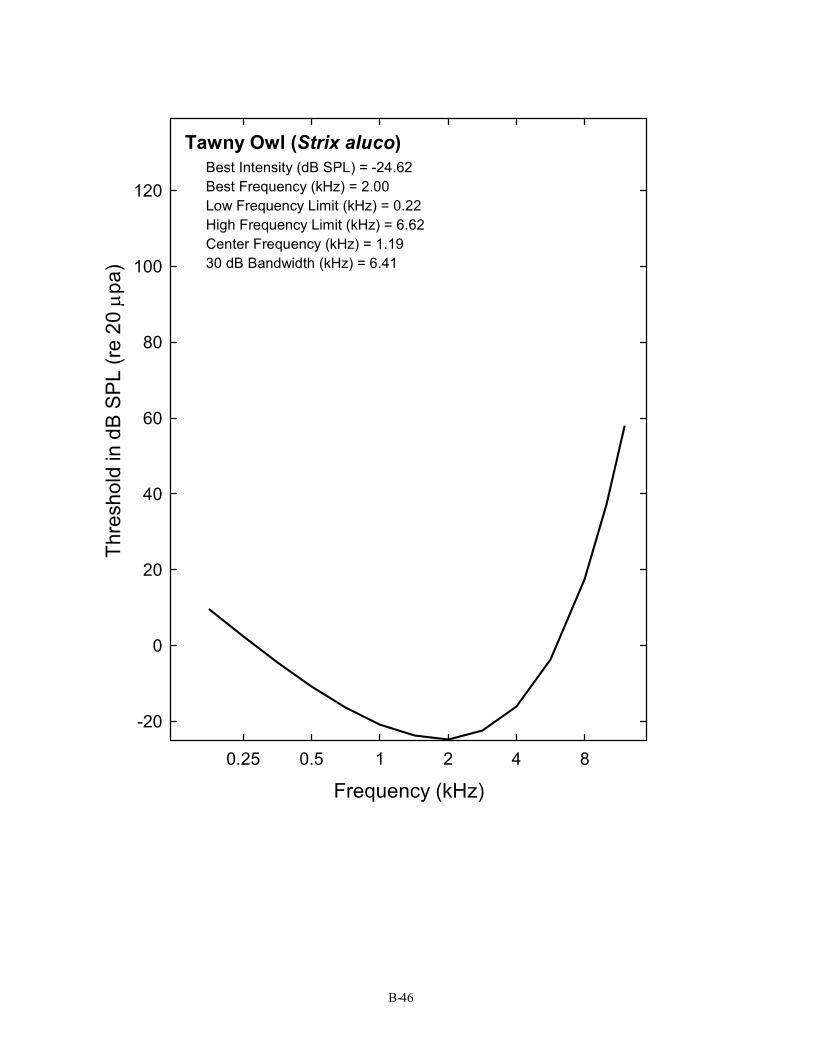
Tawny Owl (Strix aluco) Best Intensity (dB SPL) = -24.62 Best Frequency (kHz) = 2.00 Low Frequency Limit (kHz) = 0.22 High Frequency Limit (kHz) = 6.62 Center Frequency (kHz) = 1.19 30 dB Bandwidth (kHz) = 6.41
B-46
8

Thre
shol
d in
dB
SPL
(re 2
0 µ p
a)
120
100
80
60
40
20
0
-20
0.25 0.5 1 2 4
Frequency (kHz)
White-faced Scops Owl (Otus leucotis) Best Intensity (dB SPL) = -23.26 Best Frequency (kHz) = 2.00 Low Frequency Limit (kHz) = 0.28 High Frequency Limit (kHz) = 6.04 Center Frequency (kHz) = 1.29 30 dB Bandwidth (kHz) = 5.76
B-47
8
1 2 3 4 5 6 7 8 9 10
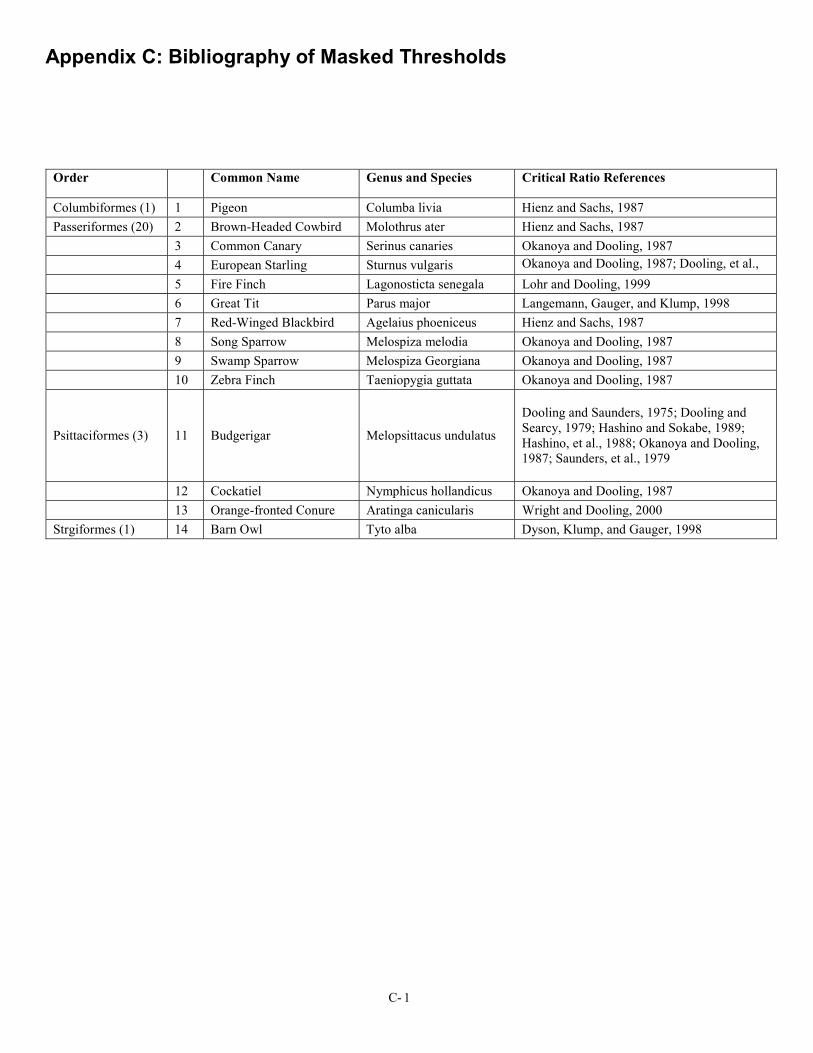
Appendix C: Bibliography of Masked Thresholds
Order Common Name Genus and Species Critical Ratio References
Columbiformes (1) Pigeon Columba livia Hienz and Sachs, 1987 Passeriformes (20) Brown-Headed Cowbird Molothrus ater Hienz and Sachs, 1987
Common Canary Serinus canaries Okanoya and Dooling, 1987 European Starling Sturnus vulgaris Okanoya and Dooling, 1987; Dooling, et al., Fire Finch Lagonosticta senegala Lohr and Dooling, 1999 Great Tit Parus major Langemann, Gauger, and Klump, 1998 Red-Winged Blackbird Agelaius phoeniceus Hienz and Sachs, 1987 Song Sparrow Melospiza melodia Okanoya and Dooling, 1987 Swamp Sparrow Melospiza Georgiana Okanoya and Dooling, 1987 Zebra Finch Taeniopygia guttata Okanoya and Dooling, 1987
Psittaciformes (3) 11 Budgerigar Melopsittacus undulatus
Dooling and Saunders, 1975; Dooling and Searcy, 1979; Hashino and Sokabe, 1989; Hashino, et al., 1988; Okanoya and Dooling, 1987; Saunders, et al., 1979
12 Cockatiel Nymphicus hollandicus Okanoya and Dooling, 1987 13 Orange-fronted Conure Aratinga canicularis Wright and Dooling, 2000
Strgiformes (1) 14 Barn Owl Tyto alba Dyson, Klump, and Gauger, 1998
C- 1
Appendix D: Plots of Masked Threshold Curves
Crit
ical
Rat
io (d
B)
50
40
30
20
10
00.25 0.5 1 2 4 8
14 Species of Birds
Frequency (kHz)
D- 1
50C
ritic
al R
atio
(dB)
40
30
20
10
00.25 0.5 1 2 4
Frequency (kHz)
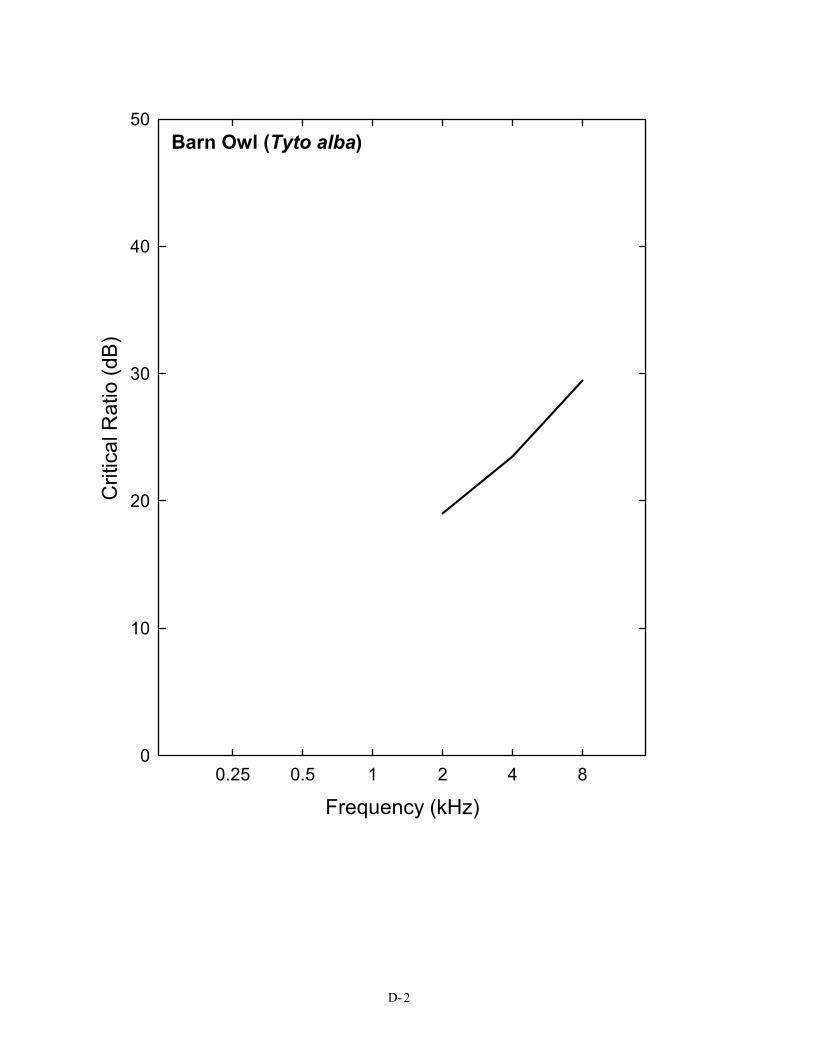
Barn Owl (Tyto alba)
D- 2
8
Crit
ical
Rat
io (d
B)
50
40
30
20
10
00.25 0.5 1 2 4 8
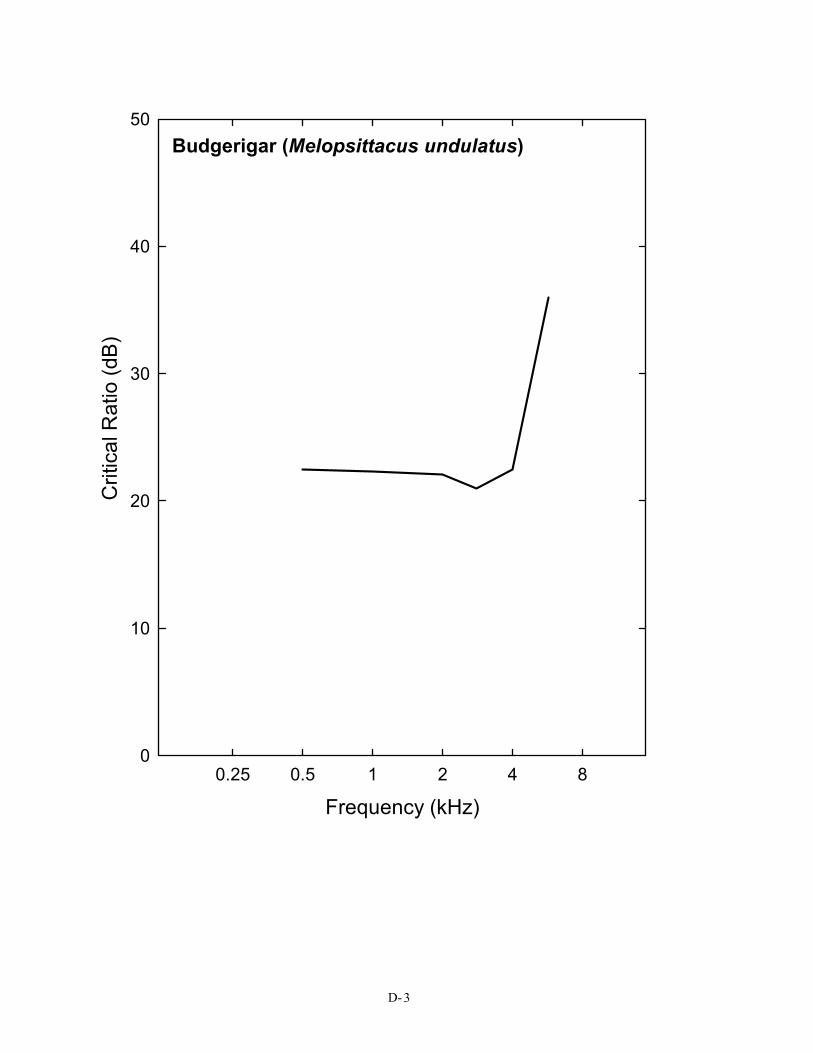
Budgerigar (Melopsittacus undulatus)
Frequency (kHz)
D- 3

Crit
ical
Rat
io (d
B)
50
40
30
20
10
00.25 0.5 1 2 4 8
Cockatiel (Nymphicus hollandicus)
Frequency (kHz)
D- 4
Crit
ical
Rat
io (d
B)
50
40
30
20
10
00.25 0.5 1 2 4 8
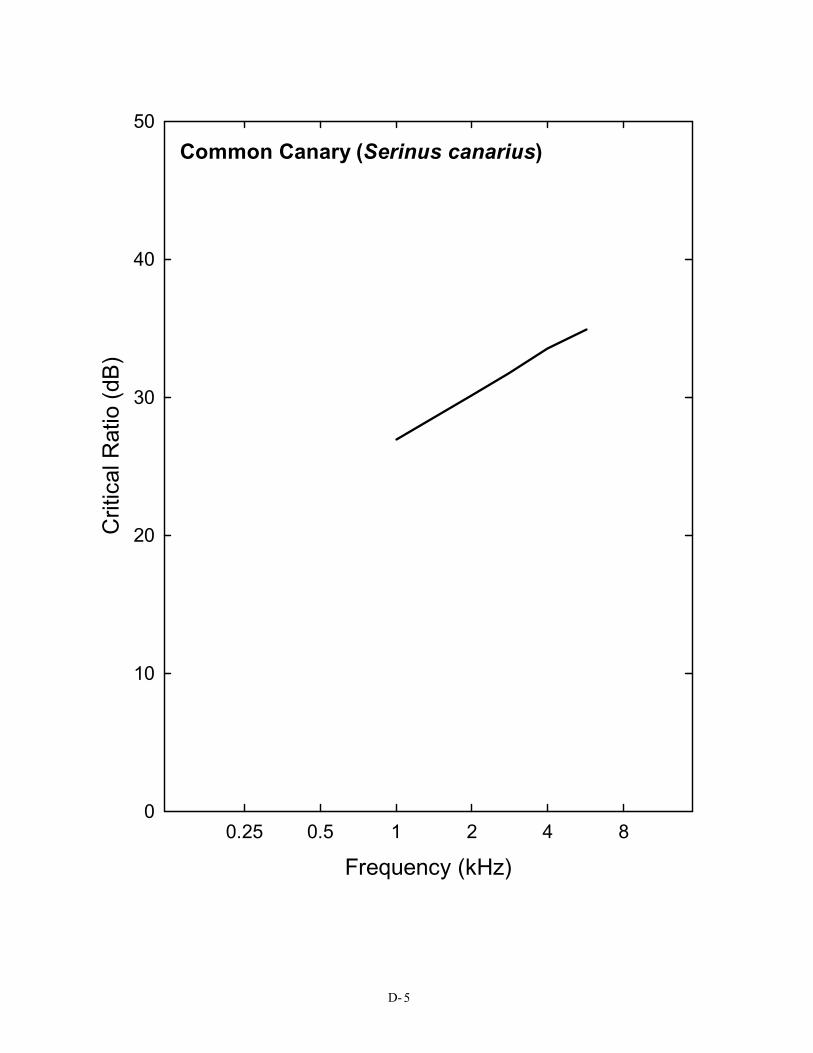
Common Canary (Serinus canarius)
Frequency (kHz)
D- 5
Crit
ical
Rat
io (d
B)
50
40
30
20
10
00.25 0.5 1 2 4 8
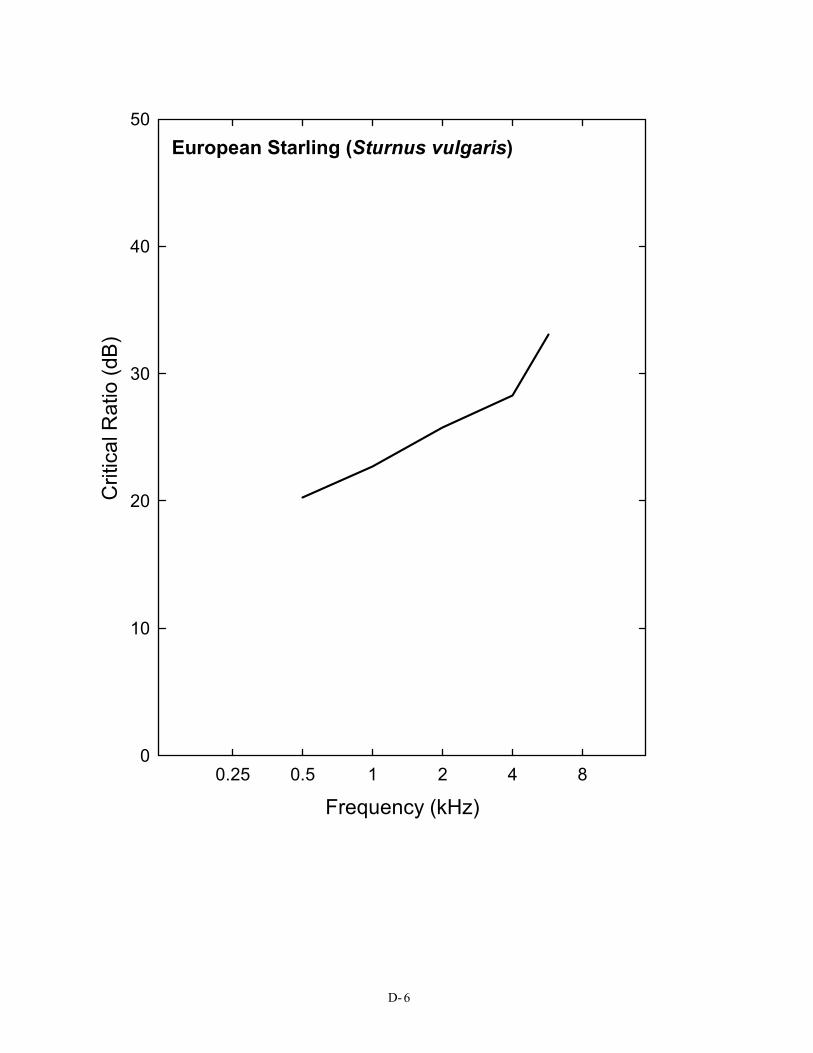
European Starling (Sturnus vulgaris)
Frequency (kHz)
D- 6

Crit
ical
Rat
io (d
B)
50
40
30
20
10
00.25 0.5 1 2 4 8
Fire Finch (Lagonosticta senegala)
Frequency (kHz)
D- 7
50C
ritic
al R
atio
(dB)
40
30
20
10
00.25 0.5 1 2 4 8
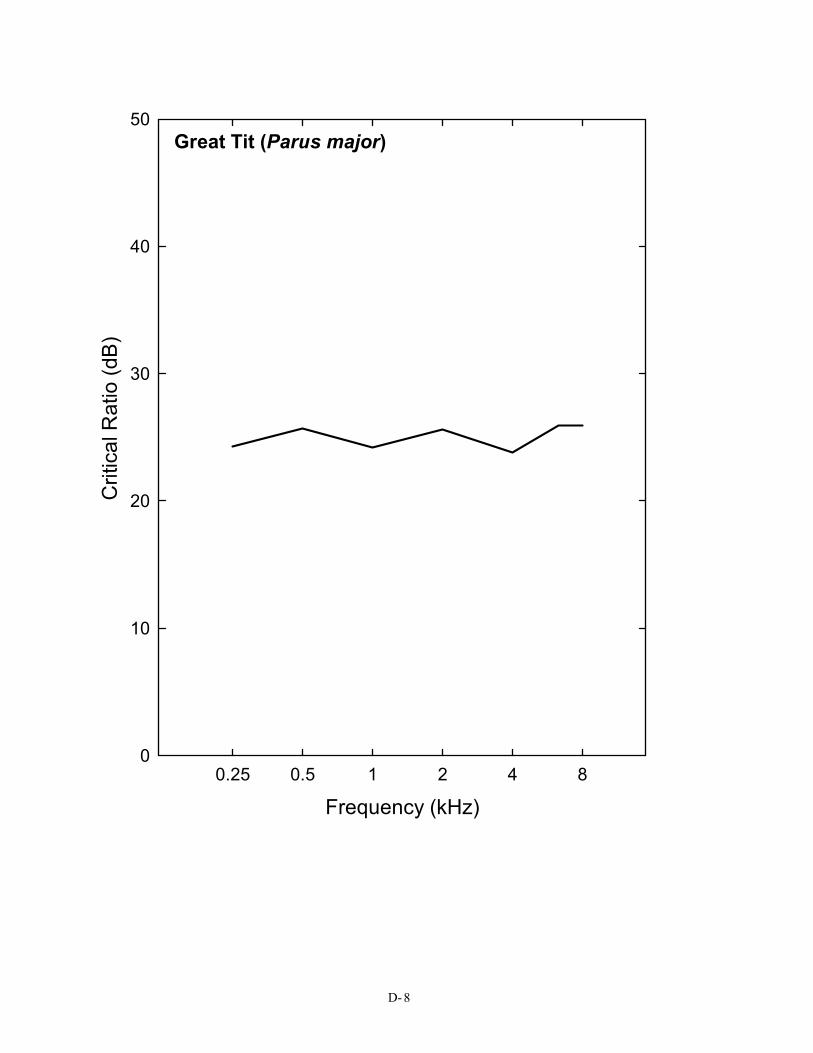
Great Tit (Parus major)
Frequency (kHz)
D- 8
Crit
ical
Rat
io (d
B)
50
40
30
20
10
00.25 0.5 1 2 4 8
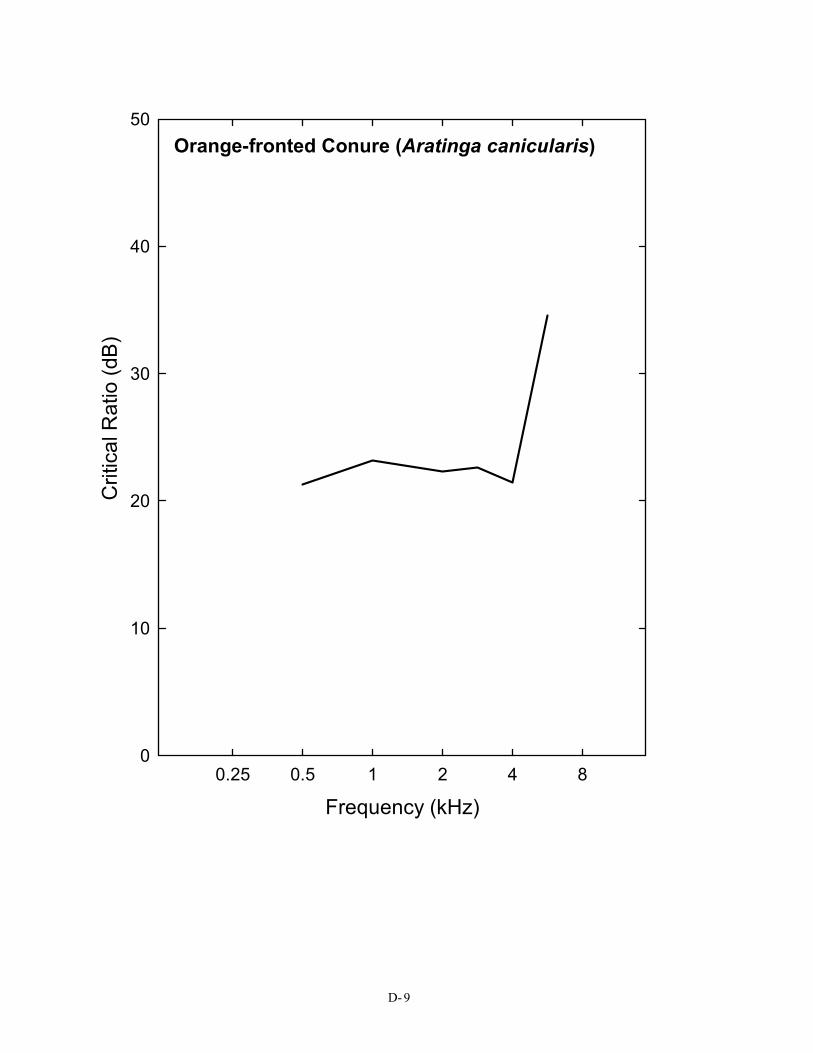
Orange-fronted Conure (Aratinga canicularis)
Frequency (kHz)
D- 9
Crit
ical
Rat
io (d
B)
50
40
30
20
10
00.25 0.5 1 2 4 8
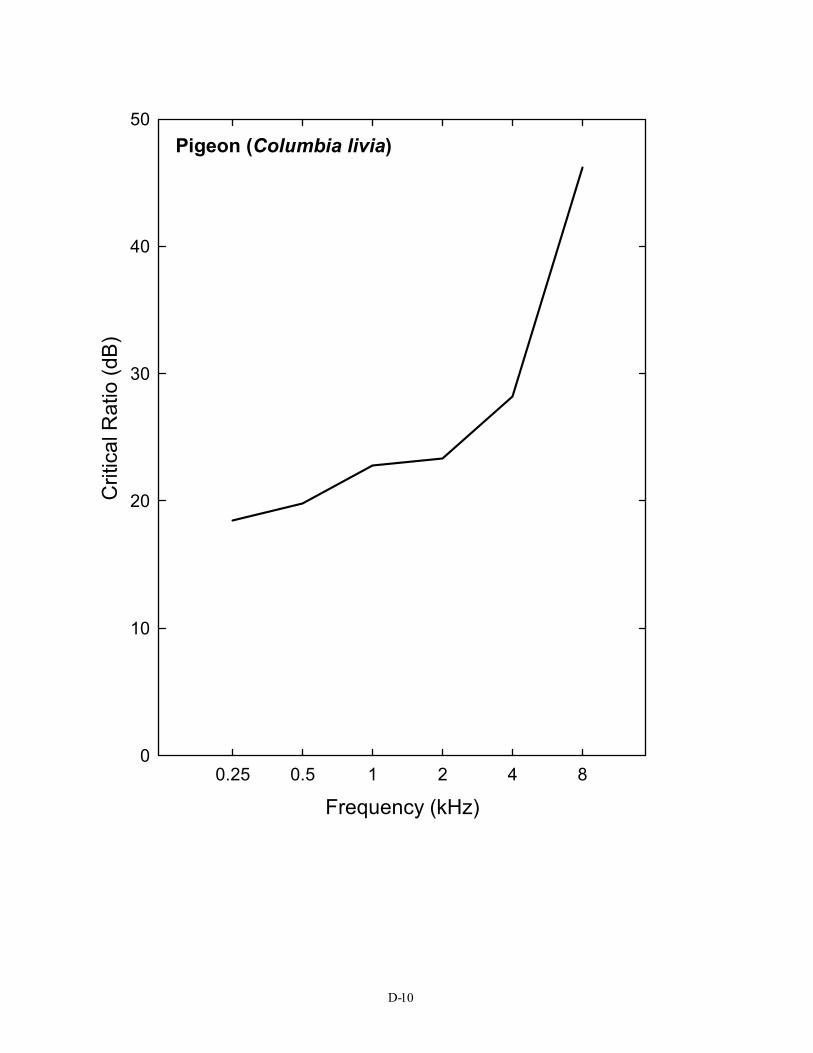
Pigeon (Columbia livia)
Frequency (kHz)
D-10
Crit
ical
Rat
io (d
B)
50
40
30
20
10
00.25 0.5 1 2 4 8
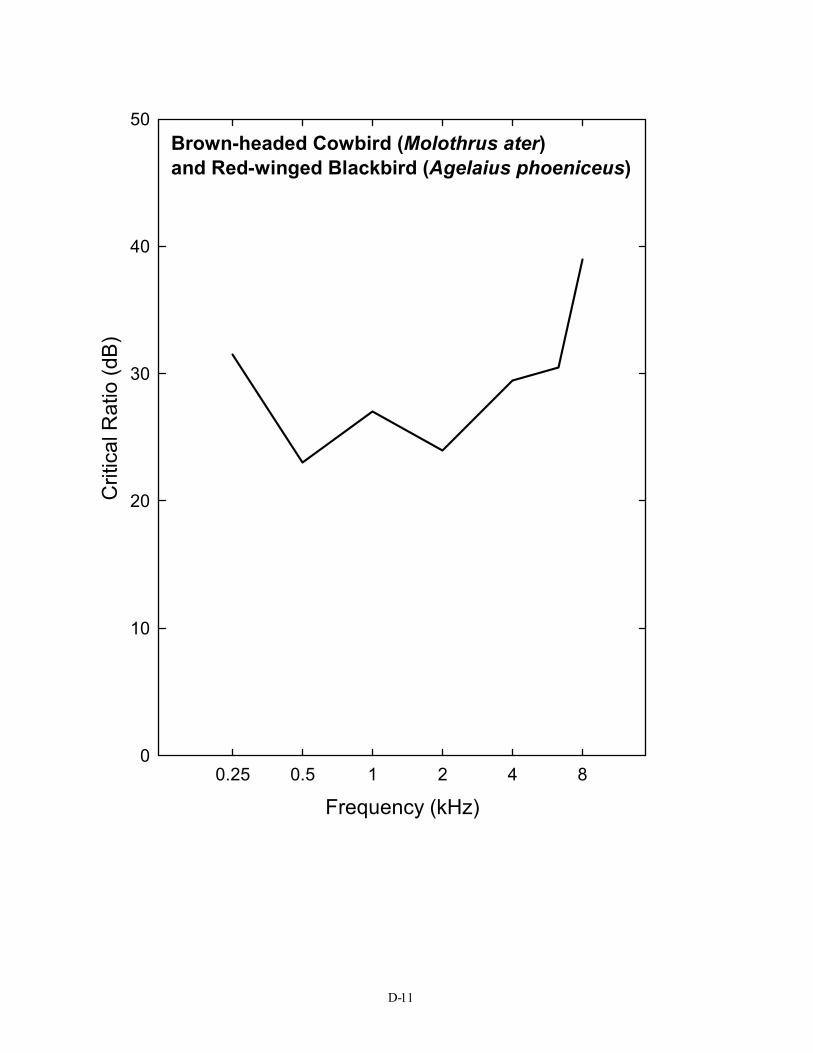
Brown-headed Cowbird (Molothrus ater) and Red-winged Blackbird (Agelaius phoeniceus)
Frequency (kHz)
D-11

Crit
ical
Rat
io (d
B)
50
40
30
20
10
00.25 0.5 1 2 4 8
Song Sparrow (Melospiza melodia)
Frequency (kHz)
D-12

Crit
ical
Rat
io (d
B)
50
40
30
20
10
00.25 0.5 1 2 4 8
Zebra Finch (Taeniopygia guttata)
Frequency (kHz)
D-13
REPORT DOCUMENTATION PAGE Form Approved OMB NO. 0704-0188
Public reporting burden for this collection of information is estimated to average 1 hour per response, including the time for reviewing instructions, searching existing data sources,gathering and maintaining the data needed, and completing and reviewing the collection of information. Send comments regarding this burden estimate or any other aspect of this collection of information, including suggestions for reducing this burden, to Washington Headquarters Services, Directorate for Information Operations and Reports, 1215 JeffersonDavis Highway, Suite 1204, Arlington, VA 22202-4302, and to the Office of Management and Budget, Paperwork Reduction Project (0704-0188), Washington, DC 20503.
1. AGENCY USE ONLY (Leave blank) 2. REPORT DATE
June 2002
3. REPORT TYPE AND DATES COVERED
Technical Report 4. TITLE AND SUBTITLE
Avian Hearing and the Avoidance of Wind Turbines 5. FUNDING NUMBERS WER21610
6. AUTHOR(S) R. Dooling
7. PERFORMING ORGANIZATION NAME(S) AND ADDRESS(ES) Robert J. Dooling, Ph.D. Department of Psychology University of Maryland College Park, MD 20742
8. PERFORMING ORGANIZATION REPORT NUMBER
TP-500-30844
9. SPONSORING/MONITORING AGENCY NAME(S) AND ADDRESS(ES) National Renewable Energy Laboratory 1617 Cole Blvd. Golden, CO 80401-3393
10. SPONSORING/MONITORING AGENCY REPORT NUMBER
NREL/TP-500-30844
11. SUPPLEMENTARY NOTES
NREL Technical Monitor: Karin Sinclair 12a. DISTRIBUTION/AVAILABILITY STATEMENT
National Technical Information Service U.S. Department of Commerce 5285 Port Royal Road Springfield, VA 22161
12b. DISTRIBUTION CODE
13. ABSTRACT (Maximum 200 words) This report provides a complete summary of what is known about basic hearing capabilities in birds in relation to the characteristics of noise generated by wind turbines. It is a review of existing data on bird hearing with some preliminary estimates of environmental noise and wind turbine noise at Altamont Pass, California, in the summer of 1999. It is intended as a resource in future discussions of the role that hearing might play in bird avoidance of turbines.
14. SUBJECT TERMS wind turbine; wind blade; birds; hearing; noise; sound; wind farm
15. NUMBER OF PAGES 83
16. PRICE CODE
17. SECURITY CLASSIFICATION OF REPORT Unclassified
18. SECURITY CLASSIFICATION OF THIS PAGE Unclassified
19. SECURITY CLASSIFICATION OF ABSTRACT Unclassified
20. LIMITATION OF ABSTRACT
UL
NSN 7540-01-280-5500 Standard Form 298 (Rev. 2-89) Prescribed by ANSI Std. Z39-18
298-102