Embed Size (px)
Citation preview
642
Spe
cial
Feat
ure
Ecology, 81(3), 2000, pp. 642–653q 2000 by the Ecological Society of America
AVIAN LIFE HISTORY VARIATION AND CONTRIBUTION OFDEMOGRAPHIC TRAITS TO THE POPULATION GROWTH RATE
BERNT-ERIK SÆTHER1,3 AND ØYVIND BAKKE2
1Department of Zoology, Norwegian University of Science and Technology, N-491 Trondheim, Norway2Department of Mathematical Sciences, Norwegian University of Science and Technology,
N-491 Trondheim, Norway
Abstract. A central goal in ecology is to predict population dynamics from demographicinformation. Based on the asymptotic population growth rate l, calculated from a projectionmatrix model as a descriptor of the population dynamics, we analyze published data of 49species of birds to determine how l is influenced by variation in different demographictraits. Across species, the mean elasticity of the adult survival rate was significantly largerthan the mean elasticity of the fecundity rate. The contribution of the fecundity rate to thepopulation growth rate increased with increasing clutch size and decreasing adult survivalrate, while the greatest contribution of adult survival rate occurred among long-lived speciesthat matured late and laid few eggs. This represents a continuum from ‘‘highly reproductivespecies’’ at one end to ‘‘survivor species’’ at the other end. In addition, a high contributionof adult survival rate was found in some relatively long-lived species with early age atmaturity (and a large clutch size) which was assumed to represent a bet-hedging strategy,i.e., producing a large number of offspring in some occasional good years. In a retrospectiveanalysis, interspecific differences in the effects of actual temporal variation in adult survivalrate and fecundity rate on the variability of l were analyzed. These effects are expectedto be large when the variance or the sensitivity of the trait is large. Because there was anegative relationship among species, both for the adult survival rate and the fecundity ratebetween the variability and the sensitivity of the trait, contribution of a trait to the variancein l decreased with sensitivity. Similarly, within species, less temporal variation was foundin traits with high elasticities than in traits with less contribution to l. In some species,covariance among matrix elements also influenced the contribution of a demographic traitto l. Monitoring schemes of bird demography should be designed in such a way thattemporal variances and covariances among demographic traits can be estimated. Further-more, it is important in such schemes to include data from a combination of traits thateither have large sensitivities or high temporal variation.
Key words: birds; demography; elasticity analysis; life history variation; perturbation analysis;population dynamics; population growth rate; projection matrix model; temporal variation.
INTRODUCTION
There is a strong need in population ecology to de-velop an empirically based theory for predicting var-iation in the population growth rate (l) (Caughley1994). One important question to address when de-veloping such a theory is how differences in life historycharacteristics affect the population responses to tem-poral variation in demographic traits. Such temporalvariation may be due to environmental stochasticity ordensity-dependent variation (e.g., Sæther 1997, Grantand Benton 2000). Theoretical analyses have shownthat the impact of temporal variation in a demographictrait on the population dynamics can be approximatedin a projection matrix model (Caswell 1989), by thecombined effect of the variance in the trait and thesensitivity of l to a change in the trait (Caswell 1989,
Manuscript received 9 October 1998; revised 20 April 1999;accepted 3 May 1999. For reprints of this Special Feature, seefootnote 1, p. 605.
3 E-mail: [email protected]
Brault and Caswell 1993, Wisdom and Mills 1997).Thus, in order to predict the effects on l of a demo-graphic change, we need information for a wide varietyof species on both the magnitude of the temporal var-iation in different traits, as well as how this variationrelates to the sensitivity of the trait.
Our approach is based on perturbation analysis of aprojection matrix model (Caswell 1997, 2000, Horvitzet al. 1997). Two approaches can be used to examinethe consequences of such demographic perturbations.The purpose of a prospective analysis is to comparethe effects on l of a given change in a demographictrait, and such analyses are made by sensitivity (Cas-well 1978) or elasticity calculations (de Kroon et al.1986). Such knowledge is important in many fields ofresearch (Caswell 1997). For instance, in life historytheory an essential question is how variation in a de-mographic rate affects fitness (e.g., Caswell and Werner1978). Similarly, conservation ecologists often try topredict how variation in the level of protection at dif-ferent life history stages will influence the population
March 2000 643ELASTICITY ANALYSIS IN POPULATION BIOLOGY
Spec
ialFeatu
re
growth rate of threatened or endangered species (Men-ges 1990, Heppell et al. 1994). In retrospective ana-lyses, the contribution of actual variation in differentdemographic traits on the variability of l is examined.A small contribution is expected when there is lowvariability in the trait, when the sensitivity is small, orif both occur.
The search for general patterns in the effects of var-iation in a demographic trait on the population growthrate may be facilitated by the documentation in severaltaxa of a strong covariation among different life historytraits (e.g., Sæther 1988, Charnov 1993). For instance,in birds, the species can be placed along a ‘‘slow–fastcontinuum,’’ where species with a high fecundity rate,but a low survival, are found at one end (Sæther et al.1996). At the other end of this continuum lie speciesthat mature late, produce few (often a single) offspring,and have a long life expectancy. It is likely that thespecies’ position along this continuum will affect howthe population growth rate will respond to a change ina demographic trait. However, few comparative ana-lyses of the relationship between life history charac-teristics and the impact of different demographic traitson l have been made. A notable exception is the com-parative analysis of life history variation in plants (Sil-vertown et al. 1993, 1996). Analyzing interspecific dif-ferences in the contribution of different life historystages to population growth rates, these studies dem-onstrated that the species cluster into distinct groups,based on particular combinations of fecundity, growth,and longevity. For instance, high adult mortality wasassociated with early age at maturity and short lifespans (Franco and Silvertown 1996). In contrast, dif-ferences among plant species in several reproductivetraits were independent of adult survival, which differsfrom the pattern recorded in several vertebrate taxa(Charnov 1993, Sæther et al. 1996, Heppell et al. 2000).This suggests that there may be large differencesamong taxa in the relative contribution to populationgrowth by different stages in the life cycle.
Here, we present a comparative analysis of how var-iation in different demographic traits is likely to affectthe population dynamics (summarized by l) of birdswith different life history characteristics. We do thisin three steps. First, by a prospective analysis (Caswell1997, 2000), we will examine whether interspecific lifehistory differences (e.g., clutch size, age at maturity,or adult survival rate) can be used to predict the con-tributions of two demographic traits (i.e., fecundity andadult survival rate) to l. Second, by using long-termavian demographic studies, we will analyze how thecontributions to the temporal variance in the populationgrowth rate are related to the sensitivity and the var-iance of the two traits. More specifically, we will usethis retrospective analysis (Caswell 1997, 2000) to ex-amine (1) how the contribution of the fecundity andadult survival rate to the variation in l differs amongspecies in relation to their life history characteristics,
and (2) whether a relationship between temporal var-iation and the sensitivity of a demographic trait is pres-ent within a species (cf. Pfister 1998). Because speciescan not be considered as independent data points (seeHarvey and Pagel 1991), we analyze the data by aphylogenetic correction, based on a modification ofFelsenstein’s (1985) independent-contrast method.Third, by an examination of some case studies, we willshow that covariation between demographic traits mayalso affect the contribution of a single trait to the var-iance in the population growth rate.
METHODS
Interspecific differences in elasticities
By surveying the literature, we obtained estimatesof fecundity rate, age at maturity, and age-specific sur-vival rates. The data and sources, following the tax-onomy and classification of Sibley and Monroe (1990,1993), are readily available (see the Appendix). Wemanaged to obtain data from 49 species, including 27species from the order Cicconiformes, 16 species fromthe order Passeriformes, two species from each of theorders Anseriformes and Strigiformes, and one specieseach from the orders Coraciiformes and Piciformes.
Estimates of adult survival rate (Pad) were based ondata from individually color-banded individuals froma single population. Two different types of estimateswere available. In 18 cases, the probability of not re-capturing or resighting an individual actually presentin the population was included into the estimation pro-cedure, as described, for example, by Lebreton et al.(1992). In 28 cases, adult survival rate was estimatedas the return rate of breeding birds from one season tothe next, which is likely to underestimate the adultsurvival rate (Martin et al. 1996). However, this biasis probably small compared to the range of the inter-specific variation. When data were available for severalyears, the unweighted mean value was used. In somecases where the data were pooled over years, the sur-vival rate was calculated as the weighted mean of theage-specific adult survival rates.
The modal number of eggs laid in the first clutchwas used as an estimator of the clutch size (CS). Thefecundity rate (F ) was estimated as the number of fe-male offspring (assuming an equal sex ratio) producedto fledging at the end of the breeding season, per adultfemale. For most species, all adult females were as-sumed to breed each year. However, in several speciesfrom the family Procellariidae, the interval betweenbreeding attempts were .1 yr, and were often alsodependent on previous breeding success. In such cases,the fecundity rate in year t (i.e., Ft) is
F 5 p S 1 p S 1 p St s,t21 s,t21 u,t21 u,t21 n,t21 n,t21
where p is the proportion of the population and S isthe breeding success, in year t of a female that wassuccessful (s), unsuccessful (u), or nonbreeding (n) in
Spe
cial
Feat
ure
644 BERNT-ERIK SÆTHER AND ØYVIND BAKKE Ecology, Vol. 81, No. 3
year t 2 1, respectively. Furthermore, the modal agewhen the females first started to breed was used as anestimate of age at maturity (k).
The most uncertain estimates were available for thesurvival rate in the prereproductive period of life. Thiswas related to high natal dispersal rate of birds. Fur-thermore, juveniles of many long-lived species spendthis period of their life away from the breeding area,which makes it difficult to obtain reliable estimates ofthe return rates. Thus, we used the estimates of thesurvival rate in the first year of life after fledging ( ju-venile survival rate, Pjuv), as presented by the author(s)of each study, and assumed that the survival rate in therest of the prereproductive period was equal to the adultsurvival rate Pad. However, in order to minimize theeffects of bias in the estimates of Pjuv, we also analyzedthe data assuming a value of Pjuv that gave a populationgrowth rate l 5 1.
Based on these estimates, we computed the asymp-totic population growth rate (l) as the dominant ei-genvalue of the k 3 k prebirth (Noon and Sauer 1992)Leslie matrix:
0 0 0 · · · 0 FP juv
P 0 0 · · · 0 0s 0 P 0 · · · 0 0s(1)
_ 5 _
0 0 0 · · · 0 0 0 0 0 · · · P P s ad
where Ps is the subadult survival rate after one year ofage until maturity, at age k. In all analyses not involvingcovariation among traits, it is assumed that Ps 5 Pad.This matrix has been suggested to provide a good de-scription of avian demography (Lebreton and Clobert1991). The population growth rate l is determined bythe characteristic equation
k k21 k21l 2 P l 2 FP P 5 0ad juv s (2)
which was solved numerically. Applying implicit dif-ferentiation, we obtain the lower level elasticities (Wis-dom and Mills 1997) e(T ) 5 ]log l/]log T 5 T(]l/]T )/l of trait T, holding other traits constant:
k21FP Pjuv se(F ) 5 e(FP ) 5 e(P ) 5juv juv k k21kl 2 (k 2 1)P lad
15 (3)
1k 1
l2 1
Pad
where the final equality follows from Eq. 2, as well as
e(P ) 5 (k 2 1)e(F )s (4)
and
k21P l 1ade(P ) 5 5 . (5)ad k k21kl 2 (k 2 1)P lad lk 2 1 1 11 2Pad
Matrix entry elasticities are the same as the lower-levelelasticities for the matrix elements FPjuv and Pad, where-as the elasticity for each of the elements Ps is equal toe(F ). The sum of the elasticities of the matrix elementsis equal to 1 (de Kroon et al. 1986, Mesterton-Gibbons1993):
ke(F ) 1 e(P ) 5 1.ad
Analysis of the effects of temporal variation indemographic traits on variation in l
We wished to examine the effect of temporal vari-ation of different life history traits on the contributionof adult survival and fecundity rates to the variance inpopulation growth rate. To achieve this end, using aretrospective analysis (Caswell 1997), we only includ-ed studies where data on the probability of capture andrecapture of recognizable individuals were availablefor $10 yr within a single population at the breedingsite. In this way, we reduced the bias due to a positiverelationship between the length of the study period andvariance (Pimm 1991). When more than one study wasavailable for a species, we chose the one that had beenrunning for the longest time. However, in most cases,data on temporal variation in the fecundity rate wereavailable for shorter time periods than was the case forthe adult survival rate. In order to obtain the longestpossible study periods, data on the fecundity rate andadult survival rate in three species (Parus major, Ci-conia ciconia, and Haematopus ostralegus) were takenfrom two different populations. Temporal variation inF and Pad was expressed as the standard deviation ofthe annual mean values, and the coefficient of variation(CV 5 standard deviation/mean) was used as a measureof relative variability. In this way, we obtained data(see Appendix for sources) of the species Anser caeru-lescens in the order Anseriformes; Accipiter nisus, Fra-tercula arctica, Haematopus ostralegus, Morus bas-sanus, Phalacrocorax aristotelis, Pluvialis apricaria,Puffinus diomedea, Rissa tridactyla, Tringa hypoleu-cos, and T. macularia in the order Ciconiiformes; andAphelocoma coerulescens, Catharus mustelinus, Den-droica discolor, Gymnorhinus cyanocephalus, Melos-piza melodia, and Parus major in the order Passeri-formes.
The effects of the temporal variation in a demo-graphic trait T on the standard deviation (SD) of l canbe approximated, according to Caswell (1989), by us-ing a first order Taylor expansion, by SD(l) ø
, where s(T ) 5 ]l/]T is the sensitivity of2Ïs(T ) varTl to trait T, the other traits being held constant in thepartial differentiation. This approximation has beenshown in most cases to be quite accurate (Houllier etal. 1989). However, we assume that the sampling errors
March 2000 645ELASTICITY ANALYSIS IN POPULATION BIOLOGY
Spec
ialFeatu
re
are negligible compared to the interspecific variation.Finally, we also ignore covariation among demographictraits (see Brault and Caswell 1993, Wisdom et al.2000) because of lack of data. Thus, in each case wheresufficient data were available, we computed how thestandard deviation in l was related to temporal vari-ation in the adult survival rate or fecundity rate.
In order to examine the correlation between elasticityand temporal variation in demographic traits within aspecies, we compared the relative contribution of adultsurvival rate and the fecundity rate to the populationgrowth rate. We expect the contribution of adult sur-vival rate, relative to fecundity, to decrease when theadult survival rate varies more than the fecundity rate.Since these two traits are measured at different scales,any time dependence in the variance is likely to be lessimportant, so studies lasting $5 yr were included. Theelasticity index e(T ) (see Eqs. 3–5) of a matrix elementT was used to compare the relative contribution of thetwo traits to the growth rate.
The effects of covariation among demographic traitson elasticities
The analyses presented thus far assume that there isno temporal correlation among the demographic traits.Such covariations will strongly influence the values ofthe elasticities. For instance, if there is a trade-off be-tween life cycle components (Silvertown et al. 1993),a change in one element of the projection matrix mayaffect other elements in the opposite direction. Then,the net consequences on the population growth rate,due to variation in a demographic trait, cannot be in-ferred from the sensitivity or elasticity of a single el-ement (Brault and Caswell 1993, Shea et al. 1994, vanTienderen 1995).
In our database, computation of the correlation co-efficients between the annual variation in the elementsof the Leslie matrix (Eq. 1) was possible for eight spe-cies, where temporal data on all elements included inthe projection matrix were available for .5 yr (Table1). The integrated elasticity of element i (IEi) was cal-culated according to van Tienderen (1995) as
IE 5 r e CV /CV (6)Oi ij j j ij
where rij is the temporal correlation coefficient betweenelement i and j, and CVi is the coefficient of variationin element i. Thus, the total contribution to ln l is thesum of the direct contribution of the parameter (givenby its elasticity) and the indirect contributions throughthe correlation with other parameters. Note that nowthe IEi values do not sum to unity.
Comparative analyses
In comparative studies, species’ values cannot beconsidered as statistically independent data points.Closely related species will tend to share more char-acters through common ancestry than through inde-
pendent evolution (Harvey and Pagel 1991). In orderto control for the effects of phylogeny, we used theindependent comparison method of Felsenstein (1985)to look for independent evolutionary events. We cal-culated independent contrasts by identifying a set ofindependent data points (e.g., the difference betweentwo pairs of species) by the Comparative Analysis byIndependent Comparisons (CAIC) software program(Purvis and Rambault 1995), basing the phylogeny ofSibley and Ahlquist (1990) at higher taxonomic levels,and Sibley and Monroe (1990, 1993) for the classifi-cation of genera and species. We then tested for a re-lationship between two variables by correlating thestandardized linear contrasts for one variable with thosefor the other, using regression through the origin (forrationale, see Garland et al. [1992: Appendix 1]), andassuming equal rates of evolutionary change per unitbranch length in all branches of the phylogenetic tree.
RESULTS
Elasticities in relation to life history characteristics
There was a great difference in our data set betweenthe distribution of the elasticities of the fecundity ratee(F ) and the distribution of the elasticities of the adultsurvival rate e(Pad ). The mean elasticity of the adultsurvival rate was significantly larger than the meanelasticity of fecundity rate (Fig. 1; t 5 7.165, P ,0.001, df 5 38). Furthermore, the distribution of e(F )was skewed against small values, whereas the e(Pad)values were approximately normally distributed aroundthe mean. This difference between the distributions re-mained when the elasticities were computed, assuminga value of Pjuv that gave a population growth rate l 51. This suggests that these differences were not due toan effect of biases in the estimates of the juvenile sur-vival rate.
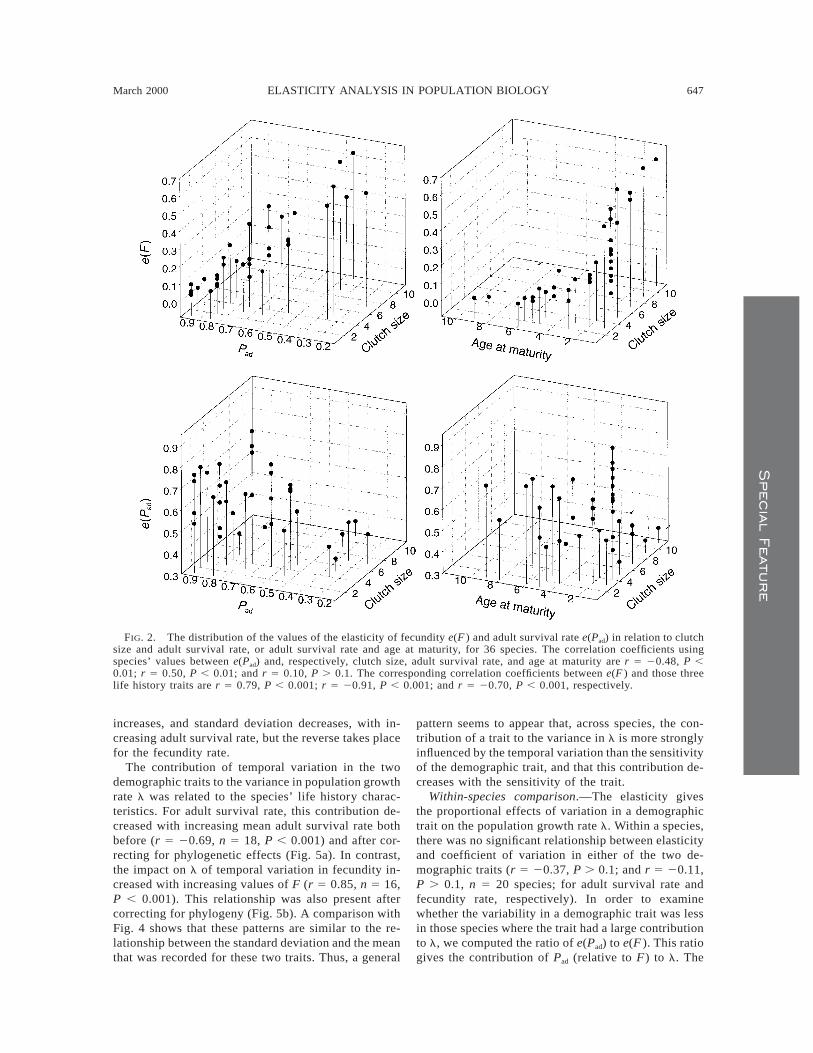
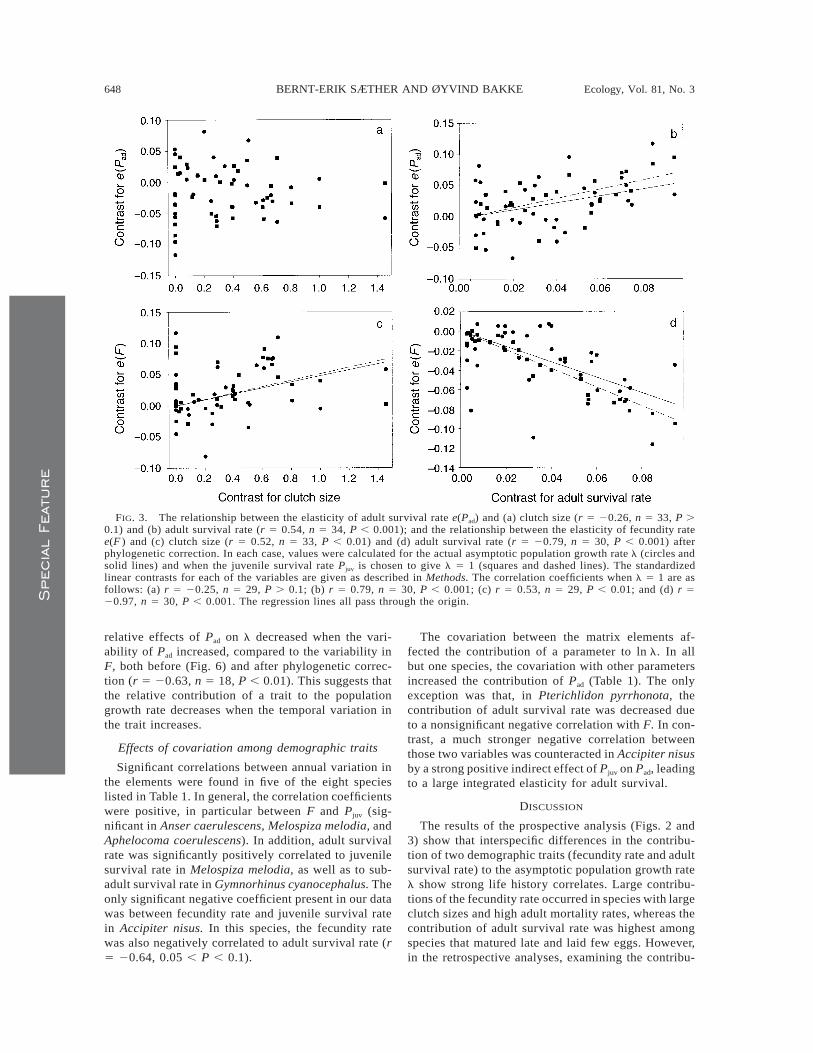
The contribution to the population growth of adultsurvival differed in relation to the life history char-acteristics. For species values, the elasticity of adultsurvival decreased with clutch size (Fig. 2), but thisrelationship was not significant after accounting for theeffects of phylogeny (Fig. 3a). Furthermore, e(Pad) alsoincreased with adult survival rate (Fig. 2) after a phy-logenetic correction (Fig. 3b). No significant (P . 0.1)relationship appeared between e(Pad) and age at ma-turity (Fig. 2). The elasticity of fecundity rate (e(F ))increased with the clutch size, and decreased stronglywith adult survival rate, both before (Fig. 2) and afteraccounting for the effects of phylogeny (Fig. 3c, d).Furthermore, e(F ) also decreased with age at maturity(Fig. 2), after phylogenetic correction (r 5 20.47, n5 34, P , 0.01).
Because interspecific variation in several avian lifehistory traits are correlated with differences in adultsurvival rate (Sæther 1988, Sæther et al. 1996), a mul-tiple correlation analysis showed that variation in thespecies values (n 5 36) of e(Pad) was positively cor-

Spe
cial
Feat
ure
646 BERNT-ERIK SÆTHER AND ØYVIND BAKKE Ecology, Vol. 81, No. 3
FIG. 1. The distribution among species of the elasticitiesof (a) the fecundity rate e(F ) and (b) adult survival rate e(Pad),calculated for the actual asymptotic population growth ratel (solid bars), and when the juvenile survival rate Pjuv ischosen to give l 5 1 (open bars).
related with adult survival rate (partial correlation co-efficient rp 5 0.42, P , 0.05). In contrast, e(Pad) de-creased with age at maturity (rp 5 20.45, P , 0.01).The distribution of species in the clutch size–age atmaturity plane show that this was due to the high e(Pad)values among species with large clutch sizes and early(2–3-yr-old) age at maturity (Fig. 2). In contrast, e(F )decreased with adult survival rate (rp 5 20.71, P ,0.001) and increased with clutch size (rp 5 0.34, P ,0.05). Thus, the highest elasticities of fecundity oc-curred among species with high adult mortality andlarge clutch sizes (Fig. 2). Very similar results wereobtained when phylogenetically corrected values wereused in the comparisons.
In order to control for the effects of interspecific indifferences in l, we computed e(F ) and e(Pad), assum-ing a juvenile survival rate that gave l 5 1. Afterphylogenetic correction, only small changes occurredfor the relationship between e(F ) and the two life his-tory traits (Fig. 3c, d). However, e(F ) decreased morestrongly (Fig. 3d), and e(Pad) showed a stronger in-
crease with adult survival rate, after accounting for theeffects of differences in l (Fig. 3b).
Sensitivity of the population growth rate to temporalvariation in demographic traits
Interspecific comparison.—Retrospective analysisexamines the contribution of actual variation in a de-mographic trait to the variability in l. This contributionwill be related to the variance in the trait, as well asto its sensitivity (see Methods). Here we will examinewhether the interspecific differences recorded by theprospective analysis also are present in the retrospec-tive analysis. For instance, is the contribution of tem-poral variation in adult survival rate to the variabilityin l larger in long-lived than in short-lived species, asexpected from Fig. 3b?
Across species, the sensitivity of the populationgrowth rate to adult survival rate s(Pad) increased withadult survival rate (r 5 0.71, n 5 18, P , 0.001),whereas there was an insignificant decrease in the sen-sitivity s(F ) with F (r 5 20.21, n 5 18, P . 0.1).However, after phylogenetic correction both relation-ships were significant (r 5 0.59, n 5 15, P , 0.05;and r 5 20.54, n 5 15, P , 0.05; for s(Pad) and s(F ),respectively).
The standard deviation of adult survival rate de-creased with the mean adult survival rate both before(r 5 20.78, n 5 18, P , 0.001) and after (r 5 20.75,n 5 15, P , 0.001) phylogenetic correction. Accord-ingly, the scale-invariant coefficient of variation inadult survival also decreased with adult survival (spe-cies values, r 5 20.87, n 5 18, P , 0.001; after phy-logentic correction, r 5 20.88, n 5 15, P , 0.001).Such a decrease could be expected from a reduction ofthe sampling error with increasing survival, for ex-ample as a result of a binomial sampling distribution(Lande 1988). However, using a data set of 13 species,where adult survival rate was estimated during each of$10 yr, there was only a slight (and insignificant) de-crease in sampling error with adult survival rate (r 520.43, P . 0.1). Thus, the decrease in temporal var-iability with increasing survival rate is likely to becaused by a decrease in environmental stochasticity, ora different pattern of density dependence among long-lived species.
There was a strong positive relationship between themean fledgling rate and its standard deviation (r 5 0.92,n 5 16, P , 0.001; after phylogenetic correction, r 50.92, n 5 15, P , 0.001). However, the coefficient ofvariation in F was not significantly related to F (r 520.15, n 5 16, P . 0.1).
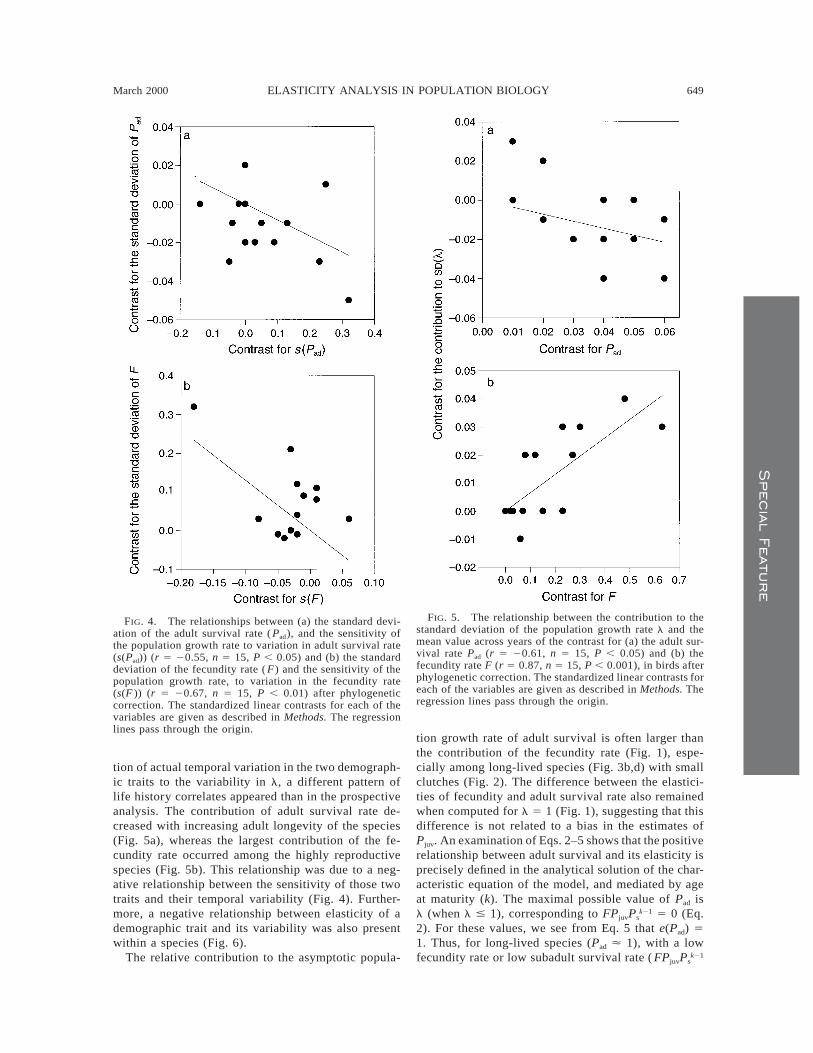
For both demographic traits, the standard deviationof the temporal variation decreased with increasingsensitivity after correcting for phylogeny (Fig. 4), butthis relationship was significant only when using spe-cies values for adult survival rate (r 5 20.72, n 5 18,P , 0.001). This negative relationship is realized forthe two demographic traits in different ways: sensitivity
March 2000 647ELASTICITY ANALYSIS IN POPULATION BIOLOGY
Spec
ialFeatu
re
FIG. 2. The distribution of the values of the elasticity of fecundity e(F ) and adult survival rate e(Pad) in relation to clutchsize and adult survival rate, or adult survival rate and age at maturity, for 36 species. The correlation coefficients usingspecies’ values between e(Pad) and, respectively, clutch size, adult survival rate, and age at maturity are r 5 20.48, P ,0.01; r 5 0.50, P , 0.01; and r 5 0.10, P . 0.1. The corresponding correlation coefficients between e(F ) and those threelife history traits are r 5 0.79, P , 0.001; r 5 20.91, P , 0.001; and r 5 20.70, P , 0.001, respectively.
increases, and standard deviation decreases, with in-creasing adult survival rate, but the reverse takes placefor the fecundity rate.
The contribution of temporal variation in the twodemographic traits to the variance in population growthrate l was related to the species’ life history charac-teristics. For adult survival rate, this contribution de-creased with increasing mean adult survival rate bothbefore (r 5 20.69, n 5 18, P , 0.001) and after cor-recting for phylogenetic effects (Fig. 5a). In contrast,the impact on l of temporal variation in fecundity in-creased with increasing values of F (r 5 0.85, n 5 16,P , 0.001). This relationship was also present aftercorrecting for phylogeny (Fig. 5b). A comparison withFig. 4 shows that these patterns are similar to the re-lationship between the standard deviation and the meanthat was recorded for these two traits. Thus, a general
pattern seems to appear that, across species, the con-tribution of a trait to the variance in l is more stronglyinfluenced by the temporal variation than the sensitivityof the demographic trait, and that this contribution de-creases with the sensitivity of the trait.
Within-species comparison.—The elasticity givesthe proportional effects of variation in a demographictrait on the population growth rate l. Within a species,there was no significant relationship between elasticityand coefficient of variation in either of the two de-mographic traits (r 5 20.37, P . 0.1; and r 5 20.11,P . 0.1, n 5 20 species; for adult survival rate andfecundity rate, respectively). In order to examinewhether the variability in a demographic trait was lessin those species where the trait had a large contributionto l, we computed the ratio of e(Pad) to e(F ). This ratiogives the contribution of Pad (relative to F) to l. The
Spe
cial
Feat
ure
648 BERNT-ERIK SÆTHER AND ØYVIND BAKKE Ecology, Vol. 81, No. 3
FIG. 3. The relationship between the elasticity of adult survival rate e(Pad) and (a) clutch size (r 5 20.26, n 5 33, P .0.1) and (b) adult survival rate (r 5 0.54, n 5 34, P , 0.001); and the relationship between the elasticity of fecundity ratee(F ) and (c) clutch size (r 5 0.52, n 5 33, P , 0.01) and (d) adult survival rate (r 5 20.79, n 5 30, P , 0.001) afterphylogenetic correction. In each case, values were calculated for the actual asymptotic population growth rate l (circles andsolid lines) and when the juvenile survival rate Pjuv is chosen to give l 5 1 (squares and dashed lines). The standardizedlinear contrasts for each of the variables are given as described in Methods. The correlation coefficients when l 5 1 are asfollows: (a) r 5 20.25, n 5 29, P . 0.1; (b) r 5 0.79, n 5 30, P , 0.001; (c) r 5 0.53, n 5 29, P , 0.01; and (d) r 520.97, n 5 30, P , 0.001. The regression lines all pass through the origin.
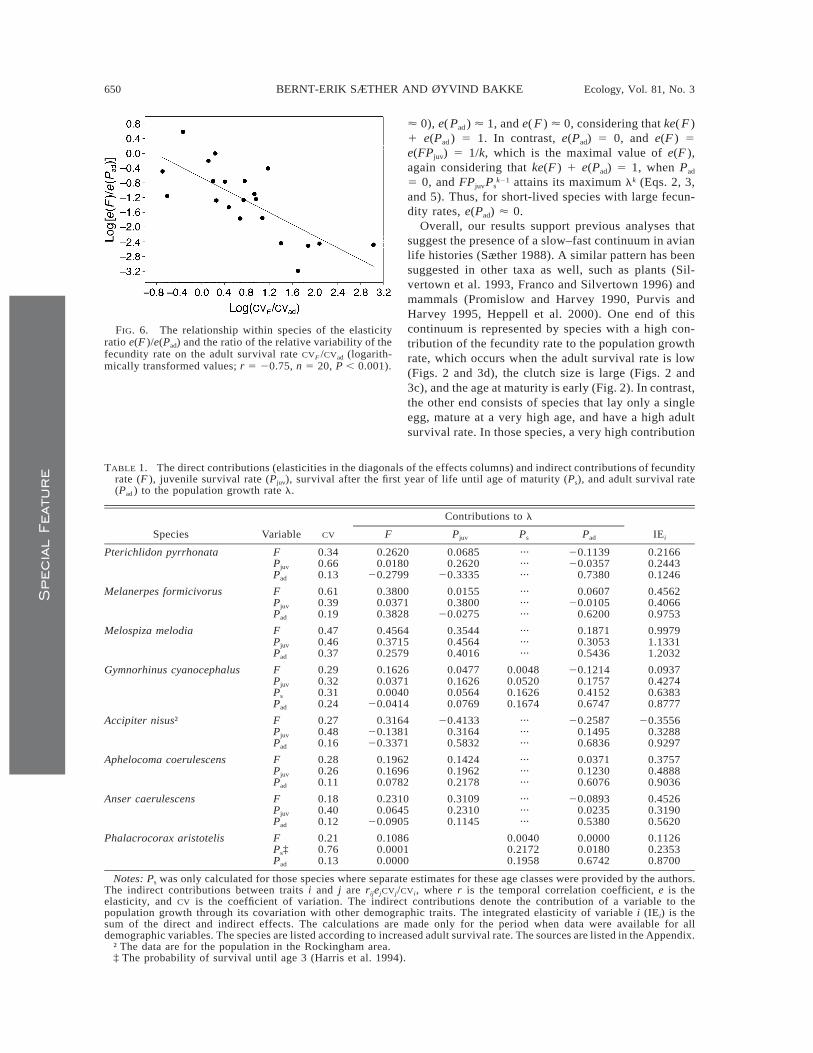
relative effects of Pad on l decreased when the vari-ability of Pad increased, compared to the variability inF, both before (Fig. 6) and after phylogenetic correc-tion (r 5 20.63, n 5 18, P , 0.01). This suggests thatthe relative contribution of a trait to the populationgrowth rate decreases when the temporal variation inthe trait increases.
Effects of covariation among demographic traits
Significant correlations between annual variation inthe elements were found in five of the eight specieslisted in Table 1. In general, the correlation coefficientswere positive, in particular between F and Pjuv (sig-nificant in Anser caerulescens, Melospiza melodia, andAphelocoma coerulescens). In addition, adult survivalrate was significantly positively correlated to juvenilesurvival rate in Melospiza melodia, as well as to sub-adult survival rate in Gymnorhinus cyanocephalus. Theonly significant negative coefficient present in our datawas between fecundity rate and juvenile survival ratein Accipiter nisus. In this species, the fecundity ratewas also negatively correlated to adult survival rate (r5 20.64, 0.05 , P , 0.1).
The covariation between the matrix elements af-fected the contribution of a parameter to ln l. In allbut one species, the covariation with other parametersincreased the contribution of Pad (Table 1). The onlyexception was that, in Pterichlidon pyrrhonota, thecontribution of adult survival rate was decreased dueto a nonsignificant negative correlation with F. In con-trast, a much stronger negative correlation betweenthose two variables was counteracted in Accipiter nisusby a strong positive indirect effect of Pjuv on Pad, leadingto a large integrated elasticity for adult survival.
DISCUSSION
The results of the prospective analysis (Figs. 2 and3) show that interspecific differences in the contribu-tion of two demographic traits (fecundity rate and adultsurvival rate) to the asymptotic population growth ratel show strong life history correlates. Large contribu-tions of the fecundity rate occurred in species with largeclutch sizes and high adult mortality rates, whereas thecontribution of adult survival rate was highest amongspecies that matured late and laid few eggs. However,in the retrospective analyses, examining the contribu-
March 2000 649ELASTICITY ANALYSIS IN POPULATION BIOLOGY
Spec
ialFeatu
re
FIG. 4. The relationships between (a) the standard devi-ation of the adult survival rate ( Pad), and the sensitivity ofthe population growth rate to variation in adult survival rate(s(Pad)) (r 5 20.55, n 5 15, P , 0.05) and (b) the standarddeviation of the fecundity rate ( F) and the sensitivity of thepopulation growth rate, to variation in the fecundity rate(s(F )) (r 5 20.67, n 5 15, P , 0.01) after phylogeneticcorrection. The standardized linear contrasts for each of thevariables are given as described in Methods. The regressionlines pass through the origin.
FIG. 5. The relationship between the contribution to thestandard deviation of the population growth rate l and themean value across years of the contrast for (a) the adult sur-vival rate Pad (r 5 20.61, n 5 15, P , 0.05) and (b) thefecundity rate F (r 5 0.87, n 5 15, P , 0.001), in birds afterphylogenetic correction. The standardized linear contrasts foreach of the variables are given as described in Methods. Theregression lines pass through the origin.
tion of actual temporal variation in the two demograph-ic traits to the variability in l, a different pattern oflife history correlates appeared than in the prospectiveanalysis. The contribution of adult survival rate de-creased with increasing adult longevity of the species(Fig. 5a), whereas the largest contribution of the fe-cundity rate occurred among the highly reproductivespecies (Fig. 5b). This relationship was due to a neg-ative relationship between the sensitivity of those twotraits and their temporal variability (Fig. 4). Further-more, a negative relationship between elasticity of ademographic trait and its variability was also presentwithin a species (Fig. 6).
The relative contribution to the asymptotic popula-
tion growth rate of adult survival is often larger thanthe contribution of the fecundity rate (Fig. 1), espe-cially among long-lived species (Fig. 3b,d) with smallclutches (Fig. 2). The difference between the elastici-ties of fecundity and adult survival rate also remainedwhen computed for l 5 1 (Fig. 1), suggesting that thisdifference is not related to a bias in the estimates ofPjuv. An examination of Eqs. 2–5 shows that the positiverelationship between adult survival and its elasticity isprecisely defined in the analytical solution of the char-acteristic equation of the model, and mediated by ageat maturity (k). The maximal possible value of Pad isl (when l # 1), corresponding to FPjuvPs
k21 5 0 (Eq.2). For these values, we see from Eq. 5 that e(Pad) 51. Thus, for long-lived species (Pad ø 1), with a lowfecundity rate or low subadult survival rate ( FPjuvPs
k21
Spe
cial
Feat
ure
650 BERNT-ERIK SÆTHER AND ØYVIND BAKKE Ecology, Vol. 81, No. 3
FIG. 6. The relationship within species of the elasticityratio e(F )/e(Pad) and the ratio of the relative variability of thefecundity rate on the adult survival rate CVF /CVad (logarith-mically transformed values; r 5 20.75, n 5 20, P , 0.001).
TABLE 1. The direct contributions (elasticities in the diagonals of the effects columns) and indirect contributions of fecundityrate (F ), juvenile survival rate (Pjuv), survival after the first year of life until age of maturity (Ps), and adult survival rate(Pad ) to the population growth rate l.
Species Variable CV
Contributions to l
F Pjuv Ps Pad IEi
Pterichlidon pyrrhonata FPjuv
Pad
0.340.660.13
0.26200.0180
20.2799
0.06850.2620
20.3335
·········
20.113920.0357
0.7380
0.21660.24430.1246
Melanerpes formicivorus FPjuv
Pad
0.610.390.19
0.38000.03710.3828
0.01550.3800
20.0275
·········
0.060720.0105
0.6200
0.45620.40660.9753
Melospiza melodia FPjuv
Pad
0.470.460.37
0.45640.37150.2579
0.35440.45640.4016
·········
0.18710.30530.5436
0.99791.13311.2032
Gymnorhinus cyanocephalus FPjuv
Ps
Pad
0.290.320.310.24
0.16260.03710.0040
20.0414
0.04770.16260.05640.0769
0.00480.05200.16260.1674
20.12140.17570.41520.6747
0.09370.42740.63830.8777
Accipiter nisus† FPjuv
Pad
0.270.480.16
0.316420.138120.3371
20.41330.31640.5832
·········
20.25870.14950.6836
20.35560.32880.9297
Aphelocoma coerulescens FPjuv
0.280.26
0.19620.1696
0.14240.1962
······
0.03710.1230
0.37570.4888
Pad 0.11 0.0782 0.2178 ··· 0.6076 0.9036
Anser caerulescens FPjuv
Pad
0.180.400.12
0.23100.0645
20.0905
0.31090.23100.1145
·········
20.08930.02350.5380
0.45260.31900.5620
Phalacrocorax aristotelis FPs‡Pad
0.210.760.13
0.10860.00010.0000
0.00400.21720.1958
0.00000.01800.6742
0.11260.23530.8700
Notes: Ps was only calculated for those species where separate estimates for these age classes were provided by the authors.The indirect contributions between traits i and j are rijejCVj/CVi, where r is the temporal correlation coefficient, e is theelasticity, and CV is the coefficient of variation. The indirect contributions denote the contribution of a variable to thepopulation growth through its covariation with other demographic traits. The integrated elasticity of variable i (IEi) is thesum of the direct and indirect effects. The calculations are made only for the period when data were available for alldemographic variables. The species are listed according to increased adult survival rate. The sources are listed in the Appendix.
† The data are for the population in the Rockingham area.‡ The probability of survival until age 3 (Harris et al. 1994).
ø 0), e( Pad ) ø 1, and e( F ) ø 0, considering that ke( F )1 e(Pad ) 5 1. In contrast, e(Pad) 5 0, and e(F ) 5e(FPjuv) 5 1/k, which is the maximal value of e(F ),again considering that ke(F ) 1 e(Pad) 5 1, when Pad
5 0, and FPjuvPsk21 attains its maximum lk (Eqs. 2, 3,
and 5). Thus, for short-lived species with large fecun-dity rates, e(Pad) ø 0.
Overall, our results support previous analyses thatsuggest the presence of a slow–fast continuum in avianlife histories (Sæther 1988). A similar pattern has beensuggested in other taxa as well, such as plants (Sil-vertown et al. 1993, Franco and Silvertown 1996) andmammals (Promislow and Harvey 1990, Purvis andHarvey 1995, Heppell et al. 2000). One end of thiscontinuum is represented by species with a high con-tribution of the fecundity rate to the population growthrate, which occurs when the adult survival rate is low(Figs. 2 and 3d), the clutch size is large (Figs. 2 and3c), and the age at maturity is early (Fig. 2). In contrast,the other end consists of species that lay only a singleegg, mature at a very high age, and have a high adultsurvival rate. In those species, a very high contribution
March 2000 651ELASTICITY ANALYSIS IN POPULATION BIOLOGY
Spec
ialFeatu
re
of adult survival rate to the population growth rate isfound (Figs. 2 and 3b). Sæther et al. (1996) termedthese two groups ‘‘highly reproductive species’’ and‘‘survivor species,’’ respectively. However, an exam-ination of Fig. 2 shows that among species with rela-tively high survival rates, there is large variation in thecontribution of adult survival rate to population growthrate. In particular, high e(Pad) values were found amongspecies (waders, owls, and terns) that have large clutchsizes, but mature early (#3-yr-old). These species mayhave large mean or variable recruitment rates. Such alife history strategy may represent an adaptation to avariable environment by securing a large output of off-spring in occasional favorable years (Sæther et al.1996).
The prospective analysis showed that there are largeinterspecific differences in the proportional effects ofa change in different demographic traits, dependent onthe species’ life history characteristics (Figs. 2 and 3).However, from the retrospective analysis, it was evi-dent that the contribution of a trait to the variance inl is more strongly influenced by its temporal variationthan its sensitivity (Fig. 5). A similar relationship alsoappeared within a species, where there was an inverserelationship between the relative contribution to thegrowth rate of a trait (its elasticity) and its relativevariability (Fig. 6). However, the correlation betweenthe elasticity and the coefficient of variation for eachof them separately was not significant. Accordingly,Pfister (1998) generally found a negative relationshipbetween the contribution of a matrix element to themean population growth rate and its temporal variance,upon the review of stage-based demographic studiesfrom a wide variety of taxa. Such patterns have alsobeen recorded in comparisons within more restrictedtaxa. For instance, in the plant species Calathea ovan-densis, the sensitivity of l to an element in the pro-jection matrix was negatively correlated with the var-iability in the element (Horvitz et al. 1997). Further-more, transitions with high elasticities contributed lessto the spatiotemporal variation in l in the leguminousherb species Lathyrus vernus than expected from theirelasticity values alone, because smaller variability wasfound in those traits (Ehrlen and van Groenendael1998). Similarly, in ungulates (Gaillard et al. 1998),juvenile survival rate has a lower elasticity, but is morevariable and has a greater impact on the variation inpopulation growth rate, than does adult survival rate.Thus, a decrease in the contribution of a trait to thevariance in the population growth rate with increasingsensitivity may be a common pattern (see also de Kroonet al. [2000]). However, some studies have shown highvariability also in sensitive traits (Wisdom and Mills1997, Crooks et al. 1998, Wisdom et al. 2000).
The inverse relationship between the sensitivity ofa trait and its temporal variation, found both in theamong-species (Fig. 4) and within-species comparisons(Fig. 6), suggests that a reduction in the variance of
sensitive traits is favored through selection. Accord-ingly, theoretical analyses have shown that environ-mental stochasticity is likely to strongly affect the se-lection pressure acting on a demographic trait (Bentonand Grant 1996). Thus, the reduction in the impact onthe variance in population growth rate with increasingadult survival (Fig. 5) may be interpreted as the resultof an evolution of a bet-hedging strategy (Seger andBrockman 1987) among long-lived species to spreadthe risk in reproductive investments over several breed-ing seasons. Accordingly, reduced maternal investmentof ungulates during poor reproductive seasons may beone reason for the greater temporal variation recordedin juvenile survival rates, compared to the variation inadult survival rates (J.-M. Gaillard and H. G. Yoccoz,unpublished manuscript)
It is important to distinguish between two differentapproaches that can be taken to demographic pertur-bation analysis (Caswell 1997, 2000, Horvitz et al.1997). In prospective analysis, we ask how the popu-lation growth rate is functionally related to differentdemographic traits. They can be used, for example, inconservation ecology, to examine the frequently askedquestion of how much the population growth rate ischanged if a certain management action that affectssome vital rate is implemented (Heppell et al. 1994).In contrast, retrospective analyses are concerned withhow actual variation in different demographic traitsdetermines the variation in the population growth rate.Our work illustrates that these two types of analysesmay give different answers (Brault and Caswell 1993,Horvitz el al. 1997, Wisdom and Mills 1997). For in-stance, the results of the retrospective analyses (Figs.4–6) show that demographic traits found in prospectiveanalyses that are functionally related most closely tothe population growth rate (Fig. 3) were traits that ex-plained only a small proportion of the variance in l.This pattern may imply that data on the variance, andnot only the mean values of demographic traits, willbe crucial in prospective analyses predicting populationtrends. In particular, changes in the environment thatwill increase the temporal variance in demographictraits with high sensitivities are likely to have a seriouseffect on population viability, because this will causea reduction in the mean population growth rate, andthereby increase the risk of extinction (Lande 1993).Thus, it is important that population studies and mon-itoring schemes incorporate a collection of data thatcan be used in retrospective analyses of populationresponses to temporal variation in demographic traits.
Our retrospective analyses of the impact of variationin different demographic traits on the populationgrowth rate (Figs. 2–6) have ignored the influence ofcovariation among traits. In those species, where suchdata were available, large temporal covariation amongmatrix elements was often recorded (Table 1). Thesecovariations sometimes strongly affected the contri-bution of the trait to the population growth rate (see
Spe
cial
Feat
ure
652 BERNT-ERIK SÆTHER AND ØYVIND BAKKE Ecology, Vol. 81, No. 3
Brault and Caswell 1993, Horvitz et al. 1997, Caswell2000). Several mechanisms may explain such relation-ships. Negative correlations may result as a trade-offbetween life history traits (Silvertown et al. 1993), forinstance, through a survival cost of high fecundity rate(but see Shea et al. [1994]). However, such relation-ships have been difficult to document in birds (Roff1992). A covariance between two elements may alsobe due to a common response of two elements to achange in population density. These relationships maybe both positive (e.g., both juveniles and adults survivewell at low densities) and negative (e.g., high fecundityresults in increased juvenile mortality, because of in-creased intraspecific competition). For instance, in Me-lospiza melodia, the fecundity rate and the adult andjuvenile survival rates were closely correlated withpopulation size (Arcese et al. 1992), which may explainthe large positive indirect effects on the integrated elas-ticity in this species (Table 1). Such density-dependenteffects make it difficult to use integrated elasticities(Eq. 4) in comparative studies, because the data shouldbe sampled from a similar range of density variation(relative to the carrying capacity [K ]) for all species.Furthermore, a relationship between two elements maybe related to a common response to stochastic variationin the environments or to an ecological perturbation.However, the latter two explanations may not be mu-tually exclusively. For instance, the high covariationamong the elements in the projection matrix of theAccipiter nisus population was computed during a pe-riod when the population increased rapidly in size,probably due to a large reduction of the pesticide levelsin the environment (Wyllie and Newton 1991). Ourresults show that, whatever the mechanisms, such co-variations may affect the contribution of an element tothe population growth rate. However, reliable estimatesof such indirect effects will require long-term demo-graphic data, which is currently available only for afew species, as well as estimation procedures that in-clude the effects of sampling error in the different el-ements.
In summary, the results of the elasticity analysis inthis, as well as in other studies (Silvertown et al. 1993,1996, Heppell et al. 2000), have demonstrated that thefunctional dependence of the population growth rate lon different demographic traits differ in a predictiveway, in relation to the life history characteristics of thespecies. Following the categorization of Sæther et al.(1996), the population growth rate of ‘‘survivor’’ and‘‘bet-hedging’’ species is more dependent on variationin adult survival rate than in the case of ‘‘highly re-productive’’ species (Fig. 2). However, the results ofthe retrospective analysis strongly suggest that the con-tribution of temporal variation in a demographic traitto the variance in l (Figs. 5 and 6) is inversely relatedto the sensitivity of the trait, because it seems to be acommon pattern that less sensitive traits are more var-iable (Fig. 4; Horvitz et al. 1997, Ehrlen and van Gro-
enendael 1998, Pfister 1998, Tombre et al. 1998, deKroon et al. 2000). A management implication of thisis that many monitoring schemes should be designedin such a way that statistically reliable data on thetemporal variation in the different demographic traitsare obtained. Our results suggest that large environ-mental variances in sensitive traits of birds should rare-ly occur and that they should attract particular attentionwhen developing management action plans.
ACKNOWLEDGMENTS
We are grateful to A. Purvis and R. Quinn for help withthe computations, as well as S. Engen, H. de Kroon, P. Harvey,S. Heppell, R. Lande, C. Pfister, and M. J. Wisdom for valu-able discussions or comments on previous versions of themanuscript. This work was partially financed through a grantfrom the Norwegian Research Council (programme ‘‘Con-servation of Biodiversity’’).
LITERATURE CITED
Arcese, P., J. N. M. Smith, W. Hochachka, C. M. Rogers, andD. Ludwig. 1992. Stability, regulation, and the determi-nation of abundance in an insular Song Sparrow population.Ecology 73:805–822.
Benton, T. G., and A. Grant. 1996. How to keep fit in thereal world: elasticity analyses and selection pressures onlife histories in a variable environment. American Natu-ralist 147:115–139.
Brault, S., and H. Caswell. 1993. Pod-specific demographyof killer whales (Orcinus orca). Ecology 74:1444–1454.
Caswell, H. 1978. A general formula for the sensitivity ofpopulation growth to changesin life history parameters.Theoretical Population Biology 14:215–230.
Caswell, H. 1989. Matrix population models. Sinauer As-sociates, Sunderland, Massachusetts, USA.
Caswell, H. 1997. Methods of matrix population analyses.Pages 19–58 in S. Tuljapurkar and H. Caswell, editors.Structured-population models in marine, terrestrial, andfreshwater systems. Chapman and Hall, New York, NewYork, USA.
Caswell, H. 2000. Prospective and retrospective perturbationanalyses: their roles in conservation biology. Ecology 81:619–627.
Caswell, H., and P. Werner. 1978. Transient behavior and lifehistory analysis of teasel (Dipsacus sylvestris Huds.). Ecol-ogy 59:53–66.
Caughley, G. 1994. Directions in conservation biology. Jour-nal of Animal Ecology 63:215–244.
Charnov, E. L. 1993. Life history invariants. Oxford Uni-versity Press, Oxford, UK.
Crooks, K. R., M. A. Sanjayan, and D. F. Doak. 1998. Newinsights on cheetah conservation through demographicmodeling. Conservation Biology 12:889–895.
de Kroon, H., A. Plaisier, J. van Groenendael and H. Caswell.1986. Elasticity:the relative contribution of demographicparameters to population growth rate. Ecology 67:1427–1431.
de Kroon, H., J. van Groenendael, and J. Ehrlen. 2000. Elas-ticities: a review of methods and model limitations. Ecol-ogy 81:607–618.
Ehrlen, J., and J. van Groenendael. 1998. Direct perturbationanalysis for better conservation. Conservation Biology 12:470–474.
Felsenstein, J. 1985. Phylogenies and the comparative meth-od. American Naturalist 125:1–15.
Franco, M., and J. Silvertown. 1996. Life history variationin plants: an exploration of the slow–fast continuum hy-pothesis. Philosophical Transactions of the Royal SocietyLondon B 351:1341–1348.
March 2000 653ELASTICITY ANALYSIS IN POPULATION BIOLOGY
Spec
ialFeatu
re
Gaillard, J.-M., M. Festa-Bianchet, and H. G. Yoccoz. 1998.Population dynamics of large herbivores: variable recruit-ment with constant adult survival. Trends in Ecology andEvolution 13:58–63.
Grant, A., and T. G. Benton. 2000. Elasticity analysis fordensity-dependent populations in stochastic environments.Ecology 81:680–693.
Harris, M. P., S. T. Buckland, S. M. Russell, and S. Wanless.1994. Post fledging survival to breeding age of Shags Phal-acrocorax aristotelis in relation to year, date of fledgingand brood size. Journal of Avian Biology 25:268–275.
Harvey, P. H., and M. D. Pagel. 1991. The comparative meth-ods in evolutionary biology. Oxford University Press, Ox-ford, UK.
Heppell, S., H. Caswell, and L. R Crowder. 2000. Life his-tories and elasticity patterns: perturbation analysis for spe-cies with minimal demographic data. Ecology 81:654–665.
Heppell, S., J. R. Walters, and L. B. Crowder. 1994. Eval-uating management alternatives for Red-cockaded Wood-peckers: a modeling approach. Journal of Wildlife Man-agement 58:479–487.
Horvitz, C., D. W. Schemske, and H. Caswell. 1997. Therelative ‘‘importance’’ of life-history stages to populationgrowth: prospective and retrospective analyses. Pages 247–271 in S. Tuljapurkar and H. Caswell, editors. Structured-population models in marine, terrestrial and freshwater sys-tems. Chapman and Hall, New York, New York, USA.
Houllier, F., J.-D. Lebreton, and D. Pontier. 1989. Samplingproperties of the asymptotic behaviour of age- or stage-grouped population models. Mathematical Biosciences 95:161–177.
Lande, R. 1988. Demographic models of the Northern Spot-ted Owl (Strix occidentalis caurina). Oecologia (Berlin) 75:601–607.
Lande, R. 1993. Risks of population extinction from de-mographic and environmental stochasticity, and random ca-tastrophes. American Naturalist 142:911–927.
Lebreton, J.-D., K. P. Burnham, J. Clobert, and D. R. An-derson. 1992. Modeling survival and testing biological hy-pothesis using marked animals: a unified approach withcase studies. Ecological Monographs 62:67–118.
Lebreton, J.-D., and J. Clobert. 1991. Bird population dy-namics, management, and conservation: the role of math-ematical modelling. Pages 104–125 in C. M. Perrins, J.-D.Lebreton, and G. J. M. Hirons, editors. Bird populationstudies. Oxford University Press, Oxford, UK.
Martin, T. E., J. Clobert, and D. R. Anderson. 1996. Returnrates in studies of life history evolution: are biases large?Journal of Applied Statistics 22:863–875.
Menges, E. S. 1990. Population viability for an endangeredplant. Conservation Biology 4:52–62.
Mesterton-Gibbons, M. 1993. Why demographic elasticitiessum up to one: a postscript to de Kroon et al. Ecology 74:2467–2468.
Noon, B. R., and J. R. Sauer. 1992. Population models forpasserine birds: structure, parametrization, and analysis.Pages 441–464 in D. R. McCullough and R. H. Barrett,editors. Wildlife 2001: populations. Elsevier Science, Bark-ing, UK.
Pfister, C. 1998. Patterns of variance in stage-structured pop-ulations: evolutionary predictions and ecological implica-tions. Proceedings of the National Academy of Sciences(USA) 95:213–218.
Pimm, S. L. 1991. The balance of nature? University of Chi-cago Press, Chicago, Illinois, USA. .
Promislow, D. E. L., and P. H. Harvey. 1990. Living fast anddying young: a comparative analysis of life history vari-ation in mammals. Journal of Zoology (London) 232:417–437.
Purvis, A., and P. H. Harvey. 1995. Mammal life historyevolution—a comparative test of Charnov’s model. Journalof Zoology (London) 237:259–283.
Purvis, A., and A. Rambault. 1995. Comparative analysis byindependent contrasts (CAIC): an Apple Macintosh appli-cation for analysing comparative data. Computer AppliedBiosciences 11:247–251.
Roff, D. 1992. The evolution of life histories. Chapman andHall, New York, New York, USA.
Sæther, B.-E. 1988. Pattern of covariation between life his-tory traits of European birds. Nature 331:616–627.
Sæther, B.-E. 1997. Environmental stochasticity and popu-lation dynamics of large herbivores: a search for mecha-nisms. Trends in Ecology and Evolution 12:143–149.
Sæther, B.-E., T. H. Ringsby, and E. Røskaft. 1996. Lifehistory variation, population processes and priorities inspecies conservation: towards a reunion of research para-digms. Oikos 77:217–226.
Seger, J., and H. J. Brockman. 1987. What is bet-hedging?Oxford Surveys in Evolutionary Biology 4:182–211.
Shea, K., M. Rees, and S. N. Wood. 1994. Trade-offs, elas-ticities and the comparative method. Journal of Ecology82:951–957.
Sibley, C. G. and J. E. Ahlquist 1990. Phylogeny and theclassification of birds. Yale University Press, New Haven,Connecticut, USA.
Sibley, C. G., and B. L. Monroe, Jr. 1990. Distribution andtaxonomy of birds of the world. Yale University Press, NewHaven, Connecticut, USA.
Sibley, C. G. and B. L. Monroe, Jr. 1993. A supplement to‘‘Distribution and taxonomy of birds of the world.’’ YaleUniversity Press, New Haven, Connecticut, USA.
Silvertown, J., M. Franco, and E. Menges. 1996. Interpre-tation of elasticity matrices as an aid to the managementof plant populations for conservation. Conservation Biol-ogy 10:591–597.
Silvertown, J., M. Franco, I. Pisanty, and A. Mendoza. 1993.Comparative plant demography—relative importance oflife cycle components to the finite rate of increase in woodyand herbaceous perennials. Journal of Ecology 81:465–476.
Tombre, I. M., J. M. Black, and M. J. J. E. Loonen. 1998.Critical components in the dynamics of a Barnacle Goosecolony: a sensitivity analysis. Norsk Polarinstitutt Skrifter200:81–89.
van Tienderen, P. H. 1995. Life cycle trade-offs in matrixpopulation models. Ecology 76:2482–2489.
Wisdom, M. J., and L. S. Mills. 1997. Sensitivity analysisto guide population recovery: Prairie Chickens as an ex-ample. Journal of Wildlife Management 61:302–312.
Wisdom, M. J., L. S. Mills, and D. F. Doak. 2000. Life stagesimulation analysis: estimating vital-rate effects on popu-lation growth for conservation. Ecology 81:628–641.
Wyllie, I., and I. Newton. 1991. Demography of an increasingpopulation of Sparrowhawks. Journal of Animal Ecology60:749–766.
APPENDIX
Data on bird fecundity rate, age at maturity, and age-specific survival rates, as well as the sources of those data, areavailable in ESA’s Electronic Data Archive: Ecological Archives E081-005.