Embed Size (px)
Citation preview

Aviation Weather Hazards
LT Clayton MartinNAS Patuxent River
Air Operations

• Survey of weather related accidents• Turbulence
– Low-level turbulence and surface wind– Thermal turbulence– Microbursts– Mountain wave turbulence
• IMC conditions
Talk Overview

• Clearly, the responsibility for flight safety is YOU, the pilot• You need to brief (up to 41% don’t)• Clear sky and light wind now does not mean it will be that
way– One hour from now– 50 miles from here– 1,000 ft AGL
Flight Safety and Weather

Fatal GA accidents

Causes of

• Surface wind is the major listed hazard in in ALLALL weather related GA accidents
• Continued flight into IMC conditions (reduced visibility and/or low ceilings) the leading cause of FATALFATAL GA accidents
Aviation Weather Hazards

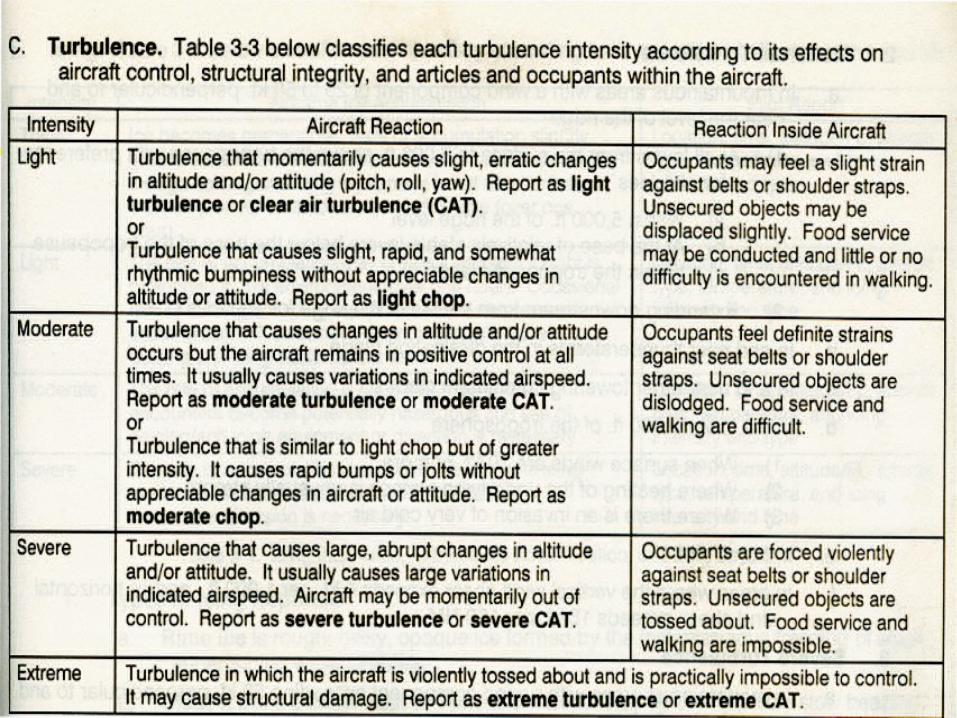
• “Bumpiness” in flight • Four types
– Low-level turbulence (LLT)– Turbulence near thunderstorms (TNT)– Clear-air turbulence above 15,000 ft (CAT)– Mountain wave turbulence (MWT)
• Measured as– Light, moderate or severe– G-load, air speed fluctuations, vertical gust
Turbulence
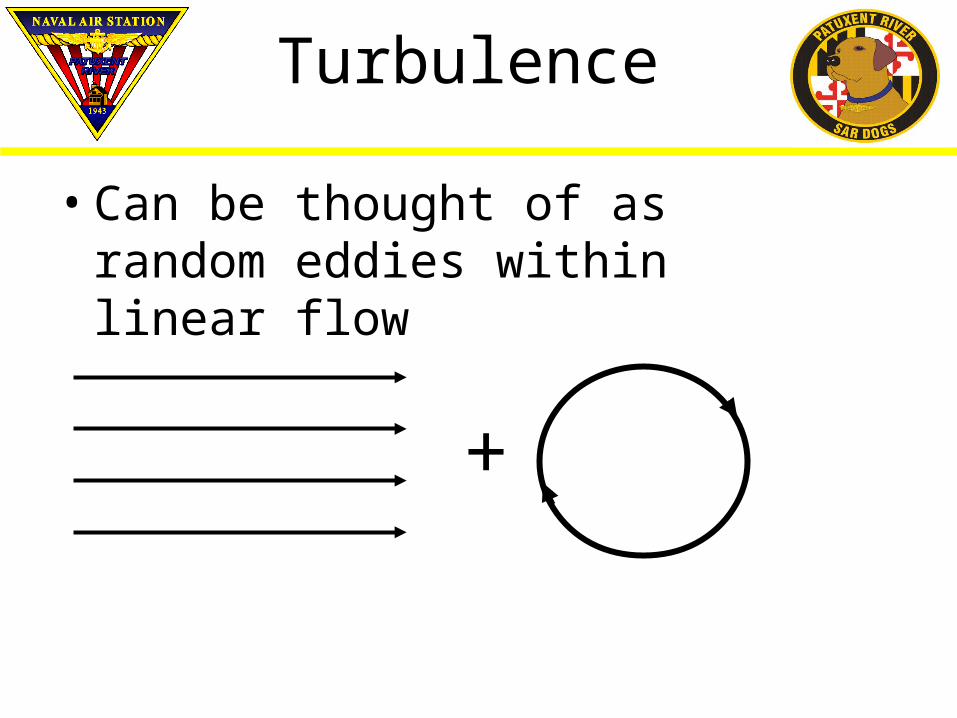
• Can be thought of as random eddies within linear flow
Turbulence
+

• Linear wind and eddy components add to gusts and lulls, up and down drafts that are felt as turbulence
Turbulence
+15 kt wind5 kt eddy
10 kt lull
20 kt gust
downdraftupdraft

• Occurs in the boundary layer– Surface layer of the atmosphere in which the effect of surface
friction is felt– Typically 3,000 ft deep, but varies a lot– Friction is largest at surface, so wind increases with height in
friction layer – Vertical wind shear turbulence
• Important for landing and takeoffs• Results in pitch, yaw and roll
Low-level Turbulence (LLT)

• Unstable air – encourages turbulence– Air is unstable when the surface is heated– Air is most unstable during the afternoon – Cumulus clouds or gusty surface winds generally indicate an unstable
atmosphere• Strong wind
– More energy for turbulent eddies• Rough terrain• When LLT is stronger than usual, the turbulent layer is deeper
than usual
Factors that make low-level turbulence (LLT) stronger
• Mechanical– Created by topographic obstacles like mountains, and by buildings and
trees– Increases with increasing flow speed and increasing surface heating
(afternoon)
• Thermal– Occurs when air is heated from below, as on a summer afternoon– Increases with surface heating
Low-level turbulence (LLT)

• Created by topographic obstacles in flow• Increases in both depth and intensity with increasing wind
strength and decreasing stability. Worst in afternoon– Extends above 3000 ft for gusts more than 50 kt
• Strongest just downwind of obstacles• Over flat terrain, mechanical turbulence intensity is usually
strongest just above surface and decreases with height
Mechanical Turbulence
• Over flat terrain– Maximum surface wind gusts are typically 40% stronger than the
sustained wind– Moderate or greater turbulence for surface wind > 30 kt– When sustained surface wind exceeds 20 kt, expect air speed
fluctuations of 10-20 kts on approach– Use power on approach and power on landing during gusty winds– Sudden lulls may put your airspeed below stall
Mechanical Turbulence
• Produced by thermals (rising bubbles of warm air) during day in unstable airmass
• Common on sunny days with light wind• Stronger above sun-facing slopes in pm• Turbulence intensity typically increases with height from
surface and is strongest 3-6,000 ft above the surface
Thermal turbulence
• Generally light to moderate– Commonly reported CONT LGT-MOD
• Usually occurs in light wind situations, but can combine with mechanical turbulence on windy days
• Often capped by inversion– Top of haze layer (may be Sc cloud)– ~3,000 ft, but up to 20,000 ft over desert in summer– Smoother flight above the inversion
Thermal turbulence

Summer Thermal Turbulence
up to 20,000’ MSL
(deep convective boundary = more stable air above)
thermal thermal
Hot, dry, unstable air
dust devil

• When precipitation falls through unsaturated air, evaporative cooling may produce dry microbursts
• Result in very hazardous shear conditions• Visual clue: fallstreaks or virga (fall streaks that don’t
reach the ground)
Dry microbursts from high based thunderstorms
Flight path of plane
45 kt downburst
45 kt headwind
45 kt tailwind

Diurnal variation of surface wind
Wind at 3,000 ft AGL
Win
d sp
eed
(kt)
0
10
20
30
Midnight 6am 6pmnoon Midnight
Surface wind
Surface wind is stronger and
more turbulent during afternoon

Mountain Wave Turbulence

• Watch for strong downdrafts on lee side– Climb above well above highest peaks before crossing mountain or
exiting valley
• Intensity of turbulence increases with wind speed and steepness of terrain
• Highest wind speed directly above crest of ridge and on downwind side
• Maximum turbulence near and downwind of mountain
In mountainous terrain ...

• Produces the most violent turbulence (other than TS)• Occurs in two regions to the lee of mountains:1. Near the ground and 2. Near the tropopause
– Turbulence at and below mountain top level is associated with rotors
– Turbulence near tropopause associated with breaking waves in the high shear regions just above and below trop
Mountain wave turbulence

• Severity increases with increasing wind speed at mountain crest– For mountain top winds between 25 and 50 kt, expect mod turb at all
levels between the surface and 5,000 ft above the trop– For mountain top winds > 50 kt, expect severe turb 50-150 miles
downstream of mountain at and below rotor level, and within 5,000 ft of the tropopause
– Severe turb in boundary layer. May be violent downslope winds– Dust may indicate rotor cloud (picture)
MWT (cont)

• Mountain waves become more pronounced as height increases and may extend into the stratosphere– Some pilots have reported mountain waves at 60,000 feet. – Vertical airflow component of a standing wave may exceed 8,000
feet per minute• Vertical shear may cause mountain waves to break,
creating stronger turbulence– Often happens below jet streak or near front
Mountain Waves

• Strongest flow near top and on downwind side• For stable air and/or lighter winds, air will tend to go around
rather than over mountain• For less stable air and strong winds, air will go over mountain
Flow over/around mountains

Turbulence PIREPs

• http://adds.aviationweather.gov/ – Hit the turbulence button
• http://www.dispatcher.org/brief/adfbrief.html– Lots of aviation links to real time weather info– Look down to turbulence section
• These are tools to help pilots better visualize aviation weather hazards.
• Not intended as a substitute for a weather briefing from a Flight Service Station
Turbulence Information

Instrument Meteorological Conditions

VFR Minimums
Category Ceiling(feet AGL)
and/or
vis(miles)
VFR(Visual flight rules)
None or >3,000
> 5
MVFR(Marginal VFR)
1,000 to3,000
3 to 5
IFR(Instrument flight
rules)
500 to1000
1 to 3
LIFR(Low IFR)
< 500 < 1

• VFR- Visible Flight Rules – Pilot must be able to see the ground at all times.
• MVFR – Marginal VFR conditions. Still legally VFR but pilots should be aware of conditions that may exceed their capabilities
• IFR – Instrument Flight Rules – Pilot has special training and equipment to fly in clouds.
• LIFR – Low IFR.
IFR/MVFR/VFR

• VFR – Visibility greater than 5 miles.• MVFR – Visibility 3-5 miles.• IFR – Visibility 1-3 miles.• LIFR – Visibility less than 1 mile.
Visibility IFR/MVFR/VFR
Red IFRMagenta LIFRBlue MVFR

• VFR - Ceiling greater than 3,000 ft.• MVFR – Ceiling 1,000 to 3,000 ft.• IFR – Ceiling less than 1,000 ft.• LIFR – Ceiling less than 500 ft.
• IFR may be cause by either (or both) ceiling and visibility restrictions.
Cloud Ceiling IFR/MVFR/VFR
• Fog (radiation fog, advection fog)• Precipitation (snow, heavy rain)• Low Clouds (lifting, cooling)
• High surface Relative Humidity (RH) common factor in all causes of IFR
Meteorological Causes of IFR Conditions

• Fog = low cloud with base < 50 ft AGL• Generally reported when vis <5 miles and there is no
precipitation reducing visibility• Formed by condensation of water vapor on condensation nuclei• Longer-lived when layer of cloud above• Need
– A cooling mechanism– Moisture
• Either lower T (cool) or raise DP (add moisture)
Fog

• Mist (BR) is reported as "A visible aggregate of minute water droplets or ice crystals suspended in the atmosphere that reduces visibility to less than 7 statute miles but greater than or equal to 5/8 statute mile."
Mist
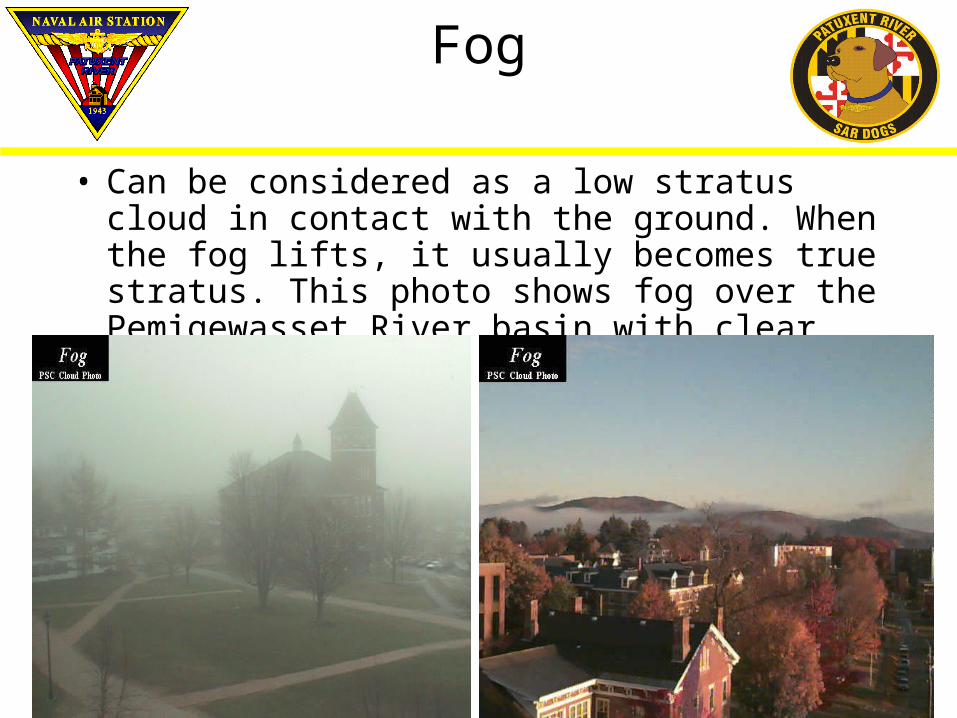
• Can be considered as a low stratus cloud in contact with the ground. When the fog lifts, it usually becomes true stratus. This photo shows fog over the Pemigewasset River basin with clear skies elsewhere.
•
Fog

Foggy Weather

• Radiation fog– Air near ground cools by radiation to saturation– Also called ground fog– Needs clear night, light breeze < 5 kts and high surface relative humidity
at nightfall• Advection fog
– Occurs when warm moist air moves over colder bodies of water (sea fog), or over cold land
– Needs winds up to about 15 kt– Occurs mostly near coasts, day or night
• California coast (+ other upwelling regions)• Near Gulf coast in winter in southerly flow
Fog types

• Upslope fog– Occurs on windward side of mountains– Moist air moves upslope and cools
• Precipitation fog– Occurs with surface inversion during rain– Occurs over land areas in winter– Raindrops fall to cold ground and saturate the air there first
• Three thermodynamic types– Warm fog (temp > 0°C)– Supercooled fog (-30°C < temp < 0°C)– Ice fog (temp < -30°C)
Fog types (cont.)

• Air is lifted by moving up to higher ground.
Types of Fog - Upslope Fog

Types of Fog - Precipitation Fog
• Rain falling into layer of cold air• Evaporation below cloud base raises the dew-point and
lowers the temperature• Typically occurs in winter when there is a surface
inversion• The precipitation itself can also lower visibility to below
IFR criteria in heavy snow or rain conditions

1. How close is the temperature to the dew point? Do I expect the temperature-dew point spread to diminish, creating saturation, or to increase?
2. What time of day is it? Will it get colder and form fog, or will it get warmer and move further from saturation?
3. What is the geography? Is this a valley where there will be significant cold air drainage? Will there be upslope winds that might cool and condense?
4. What is the larger scale weather picture? Will it be windy, suppressing radiation fog formation? Is warm, moist air moving over a cold surface?
Questions to Ask Before Flight

• In west, highest frequency of IFR conditions occur in– Pacific northwest - lots of cyclones & fronts
• > 40% in winter– California coast - coastal upwelling & fog– LA basin - smog– Elswhere in west < 10% IFR conditions
• Higher frequency in east, particularly in midwest and south– In IL, IN, OH, PA, > 50% frequency in winter– Also > 40% along Gulf coast in winter
Climatology of IMC

> 50
40-50
40-50
40-50
40-50
40-5010-40
10-40
< 10
< 10
< 10
10-40
10-40
10-40
10-40
10-40
Climatology of IMC, winter

• AWC Standard Brief – Satellite with AFC – AWC - Standard Brief
• ADDS (Aviation Digital Data Service – run by AWC) Metar regional plots are color coded for IFR conditions– ADDS – METARs
• ADDS Interactive Java tool using sky cover– ADDS - METARs Java Tool
• NCAR-RAP Surface Observations (similar to ADDS site) – RAP Real-Time Weather
WX Information Sources

• Terminal Area Forecast (TAF) – Text product issued by WFOs for selected airports. Hourly resolution of prevailing and temporary surface conditions for up to 24 hours into the future.
• TAF provide visibility and cloud ceilings, which can be related to IFR conditions
• TAF has standard format so can be decoded and displayed as graphics or plain text.
IFR Forecast Products

• ADDS – TAFs – Available as plotted maps for a single time for a given region for prevailing or tempo conditions. Also available in text form in raw or translated formats for a given single station (need to know 4 letter ID).
• ADDS - TAFs Java Tool – Mouse over map for raw TAF data at any station.
• Aviation Weather Center (AWC) - TAF Graphics –Mouse over times and data types showing US prevailing or tempo conditions (3 hour resolution) in graphical form for IFR conditions.
Sources of TAF Forecasts

• Text product generated by AWC. Covers state or part of state VFR conditions for 12 hours into future with 6 hour outlook.
• Coded format not decoded into graphics.• Available at http://aviationweather.gov/products/fa/ NWS
plans to develop graphical Area Forecast product in future.
Area Forecasts

• AIRMET regularly issued for IFR or Mountain Obscuration conditions covering at least 50% of an area.
• 6 hour forecast with 6 hour outlook• Text product with graphical products generated from
decoding of “from” lines.• Available at ADDS - AIRMETs
AIRMET

• These are tools to help pilots better visualize aviation weather hazards.
• Not intended as a substitute for a weather briefing from Flight Weather Briefer
Online Wx info and Forecasts – to reiterate:

• Issues to do with low-level wind are the main weather hazard facing GA – Probably includes cross winds, low-level turbulence, mountain effects
and shear
• Continued flight into IMC conditions the main cause of GA fatalities
• Get a weather brief from your FSS• Get a weather brief from your FSS• Get a weather brief from your FSS
Summary