Embed Size (px)
Citation preview
1
Aviation Weather Testbed – Final Evaluation
Project Title: 2014 GOES-R/JPSS Demonstration
Organization: NOAA’s Aviation Weather Testbed (AWT)
Evaluator(s): Aviation Weather Center (AWC) forecasters, Central Weather
Service Unit (CWSU) forecasters, Federal Aviation Administration (FAA)
personnel, and general aviation personnel
Duration of Evaluation: 1 February 2014 – 1 September 2014
Prepared By: Amanda Terborg (UW/CIMSS and NOAA/AWC)
Final Submitted Date: 19 September 2014
Table of Contents
Contents ...........................................................................................................................................1
1. Summary ......................................................................................................................................2
2. Introduction ..................................................................................................................................2
3. GOES-R Products Evaluated .......................................................................................................4
3.1 Aircraft Flight Icing Threat ........................................................................................................5
3.2 ACHA Cloud Algorithms ..........................................................................................................6
3.3 Convective Toolkit.....................................................................................................................8
3.3.1 GOES-R Convective Initiation ...................................................................................8
3.3.2 Cloud Top Cooling ...................................................................................................10
3.3.3 Overshooting Top Detection .....................................................................................11
3.4 Lightning Detection .................................................................................................................13
3.4.1 Pseudo Geostationary Lightning Mapper .................................................................13
3.5 Fog and Low Stratus ................................................................................................................14
3.6 GeoColor Imagery ...................................................................................................................15
3.7 Nearcasting Model ...................................................................................................................17
3.8 GOES-14 Super Rapid Scan 1-minute imagery.......................................................................19
3.9 Simulated Cloud and Moisture imagery ..................................................................................21
3.10 VIIRS imagery .......................................................................................................................23
4. Summary and Conclusions ........................................................................................................24
5. References ..................................................................................................................................26
2
1. Summary The 2014 demonstration at the Aviation Weather Center (AWC) in Kansas City, MO, took place from 1
March – 1 September 2014, it’s purpose two-fold: (1) it provided a pre-operational environment in which
to test and evaluate new GOES-R/JPSS proxy products, and (2) it also aided in familiarizing forecasters
with the capabilities of our next generation GOES/JPSS satellite series. To accommodate the staffing
shortages at the AWC in 2014, the usual two-week experiments were instead divided into two long-term
evaluations and a single weeklong intensive experiment period. Details of these periods can be found in
Table 1 below.
Table 1. AWC 2014 demonstration schedule and descriptions
Evaluation Period Description 1 March – 16 May
Evaluation Period I
Focus - winter/early spring aviation hazards (icing, ceiling and vis, etc.) and
also early season convection
Training – one-on-one training on the forecast floor
19 May – 11 September
Evaluation Period II
Focus – summer aviation hazards, especially convection.
Training – one-on-one training on the forecast floor and also at the Air Traffic
Control Systems Command Center (ATCSCC) in Warrenton, VA, with the
National Aviation Meteorologists (NAMs)
11 – 15 August
Summer Experiment
Focus – ceiling and visibility, with a secondary focus on convection; tropics
and domestic regions with an Aviation Weather Statement emphasis
Training – real-time training and demonstration with external participants
Participation throughout the two long-term evaluations included only AWC forecasters, while the summer
experiment consisted of a wide variety of external participants from the Central Weather Service Units
(CWSUs), Weather Forecast Offices (WFOs), the Alaska Aviation Weather Unit (AAWU), the Federal
Aviation Administration (FAA) and other flight services companies including Lockheed Martin, FedEx,
and the United Parcel Service (UPS), and research scientists from the Air Force Weather Agency
(AFWA), the GOES-R program, and National Oceanic and Atmospheric Administration (NOAA)
laboratories. The following report details the activities and results of the entirety of the 2014 GOES-
R/JPSS demonstration.
2. Introduction
Although the logistics of the 2014 demonstration were changed, the structure remained based around the
AWC’s operational desks. These include World Area Forecast (WAF) and Tropical desks on the
international operations branch (IOB), and the Convective SIGMET (CSIG), the Collaborative
Convective Forecast Product (CCFP), and the Area Forecast (FA) desks, as well as the National Aviation
Meteorologist (NAM) desk on the domestic operations branch (DOB).
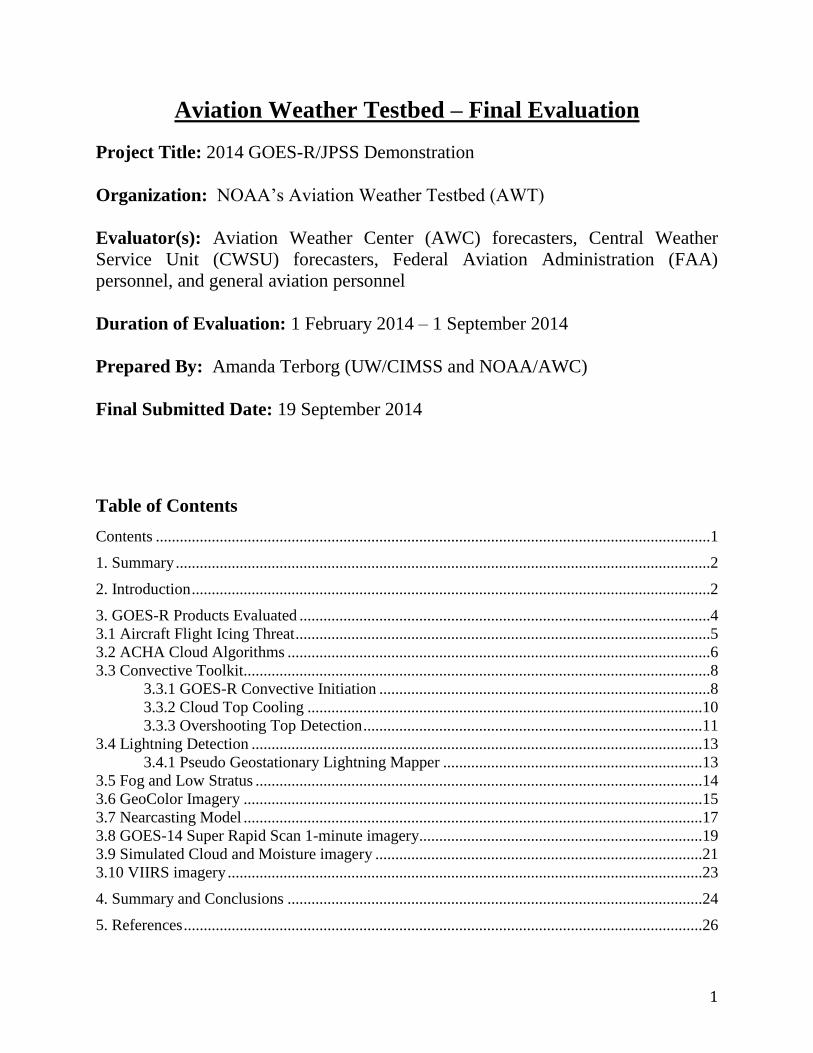
The FA desks are responsible for issuing 0, 3, 6, 9, and 12-hour Graphical AIRMETs (GAIRMETs) and
text forecasts every three hours as well as SIGMETs (if necessary) for hazards including ceiling and
visibility, turbulence, icing, freezing level, low-level wind shear, and low ceilings. Similarly, the WAF
Tropical desk also issues FAs and SIGMETs for these threats, as well as for convection (Fig. 1).
Domestic FAs and GAIRMETs area utilized mainly as flight planning guides by the general aviation
community. On the other hand, the Tropical FAs are an important part of helicopter operations over the
Gulf of Mexico and the Caribbean.
3
Figure 1. Tropcial domain with 1-hour international SIGMETs issued for convection (left), and a 3-hour G-AIRMET forecast for
turbulence (right).
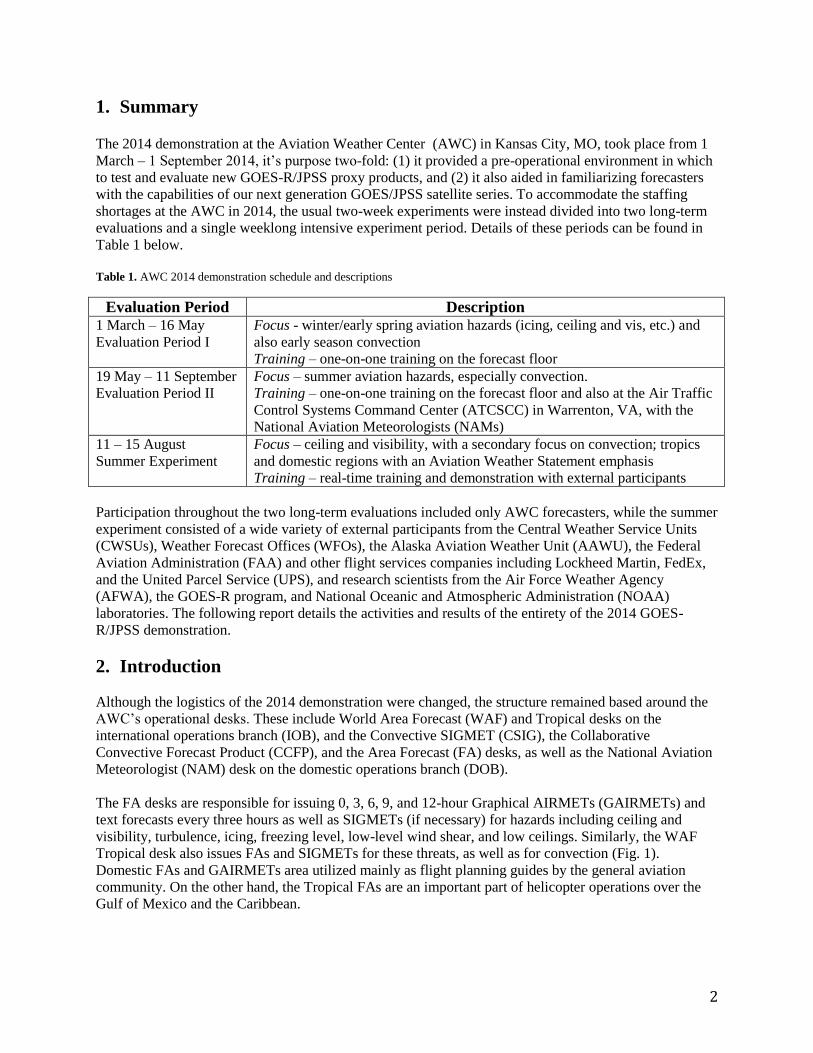
The remainder of the WAF desks are responsible for every corner of the globe and output a 12 and 24-
hour forecast of convection, icing, and turbulence, as well as jets and tropopause heights (Fig. 2). Flight
planners, particularly those mapping flight routes over the oceans, use this information to find the safest
and most cost efficient path for international flights. On the other hand, CSIG and CCFP are domestic
products, with CSIG outlooks and SIGMETs for convection issued and/or updated every hour, and 4, 6,
and 8-hr CCFP forecasts of convective probability issued every 2 hours (Fig. 2).
Figure 2. Global Graphics 12-hr forecast (top), CSIG outlook and SIGMETs (bottom left), and CCFP 6-hr forecast (bottom
right). Red 'cotton balls' denote forecasted convection in the global graphics image. Yellow outlined boxes contain the CSIG
outlook, with red boxes indicating active SIGMETs. Boxes in the CCFP forecast give convective coverage and probability as
well as flight levels at which it is likely to occur.
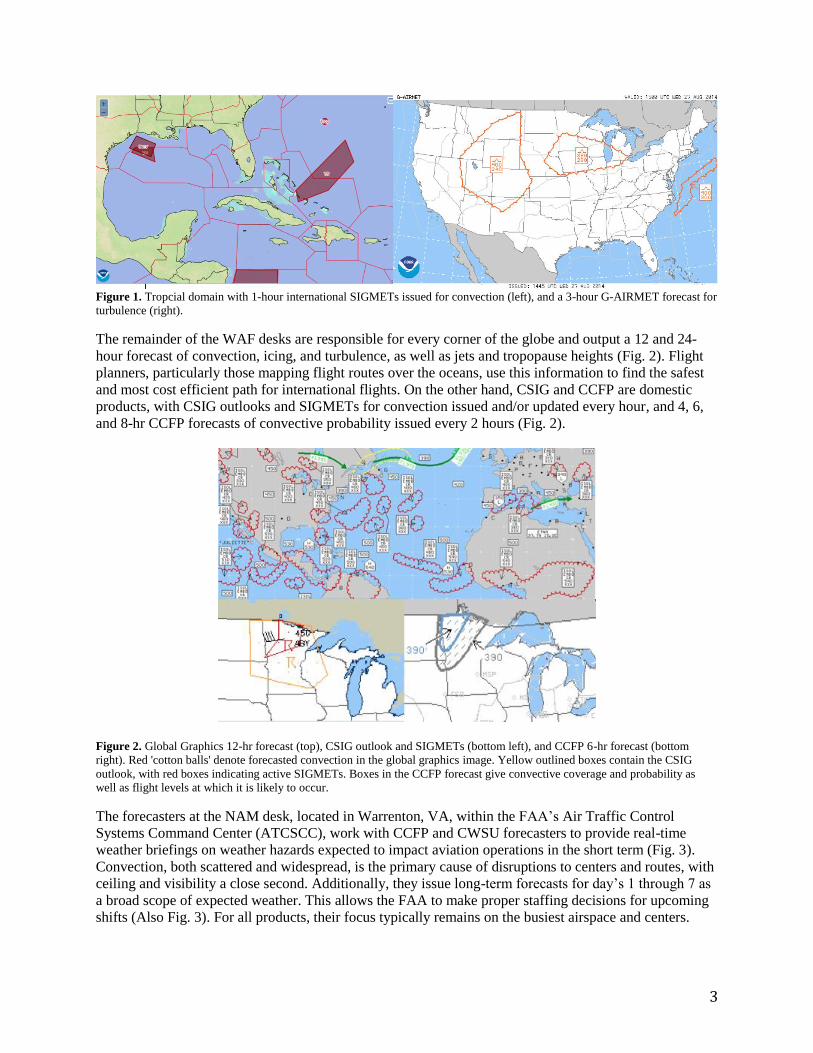
The forecasters at the NAM desk, located in Warrenton, VA, within the FAA’s Air Traffic Control
Systems Command Center (ATCSCC), work with CCFP and CWSU forecasters to provide real-time
weather briefings on weather hazards expected to impact aviation operations in the short term (Fig. 3).
Convection, both scattered and widespread, is the primary cause of disruptions to centers and routes, with
ceiling and visibility a close second. Additionally, they issue long-term forecasts for day’s 1 through 7 as
a broad scope of expected weather. This allows the FAA to make proper staffing decisions for upcoming
shifts (Also Fig. 3). For all products, their focus typically remains on the busiest airspace and centers.
4
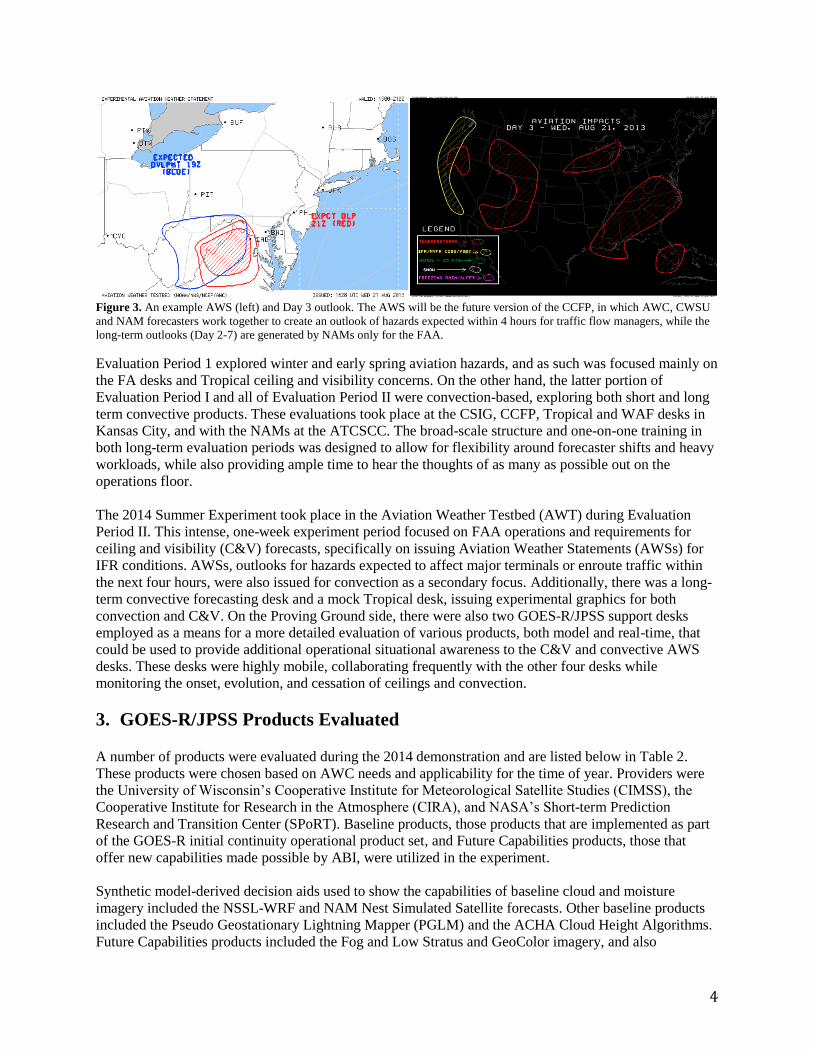
Figure 3. An example AWS (left) and Day 3 outlook. The AWS will be the future version of the CCFP, in which AWC, CWSU
and NAM forecasters work together to create an outlook of hazards expected within 4 hours for traffic flow managers, while the
long-term outlooks (Day 2-7) are generated by NAMs only for the FAA.
Evaluation Period 1 explored winter and early spring aviation hazards, and as such was focused mainly on
the FA desks and Tropical ceiling and visibility concerns. On the other hand, the latter portion of
Evaluation Period I and all of Evaluation Period II were convection-based, exploring both short and long
term convective products. These evaluations took place at the CSIG, CCFP, Tropical and WAF desks in
Kansas City, and with the NAMs at the ATCSCC. The broad-scale structure and one-on-one training in
both long-term evaluation periods was designed to allow for flexibility around forecaster shifts and heavy
workloads, while also providing ample time to hear the thoughts of as many as possible out on the
operations floor.
The 2014 Summer Experiment took place in the Aviation Weather Testbed (AWT) during Evaluation
Period II. This intense, one-week experiment period focused on FAA operations and requirements for
ceiling and visibility (C&V) forecasts, specifically on issuing Aviation Weather Statements (AWSs) for
IFR conditions. AWSs, outlooks for hazards expected to affect major terminals or enroute traffic within
the next four hours, were also issued for convection as a secondary focus. Additionally, there was a long-
term convective forecasting desk and a mock Tropical desk, issuing experimental graphics for both
convection and C&V. On the Proving Ground side, there were also two GOES-R/JPSS support desks
employed as a means for a more detailed evaluation of various products, both model and real-time, that
could be used to provide additional operational situational awareness to the C&V and convective AWS
desks. These desks were highly mobile, collaborating frequently with the other four desks while
monitoring the onset, evolution, and cessation of ceilings and convection.
3. GOES-R/JPSS Products Evaluated A number of products were evaluated during the 2014 demonstration and are listed below in Table 2.
These products were chosen based on AWC needs and applicability for the time of year. Providers were
the University of Wisconsin’s Cooperative Institute for Meteorological Satellite Studies (CIMSS), the
Cooperative Institute for Research in the Atmosphere (CIRA), and NASA’s Short-term Prediction
Research and Transition Center (SPoRT). Baseline products, those products that are implemented as part
of the GOES-R initial continuity operational product set, and Future Capabilities products, those that
offer new capabilities made possible by ABI, were utilized in the experiment.
Synthetic model-derived decision aids used to show the capabilities of baseline cloud and moisture
imagery included the NSSL-WRF and NAM Nest Simulated Satellite forecasts. Other baseline products
included the Pseudo Geostationary Lightning Mapper (PGLM) and the ACHA Cloud Height Algorithms.
Future Capabilities products included the Fog and Low Stratus and GeoColor imagery, and also
5
encompassed those products within the ‘Convective Toolkit’; i.e. Cloud-top Cooling and Overshooting
Top Detection, and the GOES-R Convective Initiation. Super Rapid Scan 1-minute imagery from GOES-
14 was used to showcast the ABI 1-min rapid refresh mesoscale capability. Additionally, a 1-9 hour
Nearcasting model was included as the only Risk Reduction product.
A number of VIIRS products from JPSS were also evaluated to a lesser extent. Specifically, the
Day/Night band and the Nighttime Microphysics product were evaluated. Additionally, the dust products
were evaluated when an event arose.
Table 2. GOES-R/JPSS products demonstrated within the 2014 Demonstration
GOES-R Demonstrated Product Category
Aircraft Flight Icing Threat Future Capability
ACHA Cloud Height Algorithms Baseline
Convective Initiation Future Capability
Cloud Top Cooling/Overshooting Top Detection Future Capability
Fog and Low Stratus Future Capability
GeoColor imagery Future Capability
Nearcasting Model Risk Reduction
Pseudo Geostationary Lightning Mapper Baseline
GOES-14 Super Rapid Scan imagery Baseline
Simulated Cloud and Moisture imagery Baseline
JPSS Demonstrated Products Category
VIIRS Day/Night band imagery Baseline
VIIRS/MODIS Nighttime Microphysics Future Capability
VIIRS/MODIS Dust products Future Capability
Category Definitions:
Baseline Products - GOES-R products providing the initial operational implementation
Future Capabilities Products - New capability made possible by ABI
Risk Reduction – Research initiatives to develop new or enhanced GOES-R applications and
explore possibilities for improving current products
3.1 Aircraft Flight Icing Threat – University of Wisconsin Cooperative Institute of
Meteorological Satellite Studies (UW-CIMSS) and NASA’s Langley Research Center (LaRC)
The Flight Icing Threat (FIT) integrates various cloud properties from the GOES-R baseline DCOMP
algorithm to generate a probability and intensity of icing conditions. It is composed of three components
including (1) an icing mask available day and night which discriminates regions of possible icing, (2) an
icing probability, estimated during the daytime only, and (3) a two-category intensity index which is also
derived during the daytime only. While it is difficult to validate a product such as this given the lack of
icing PIREPs and other methods of ice measurement, it has been shown to have skill in identifying areas
of more significant icing conditions.
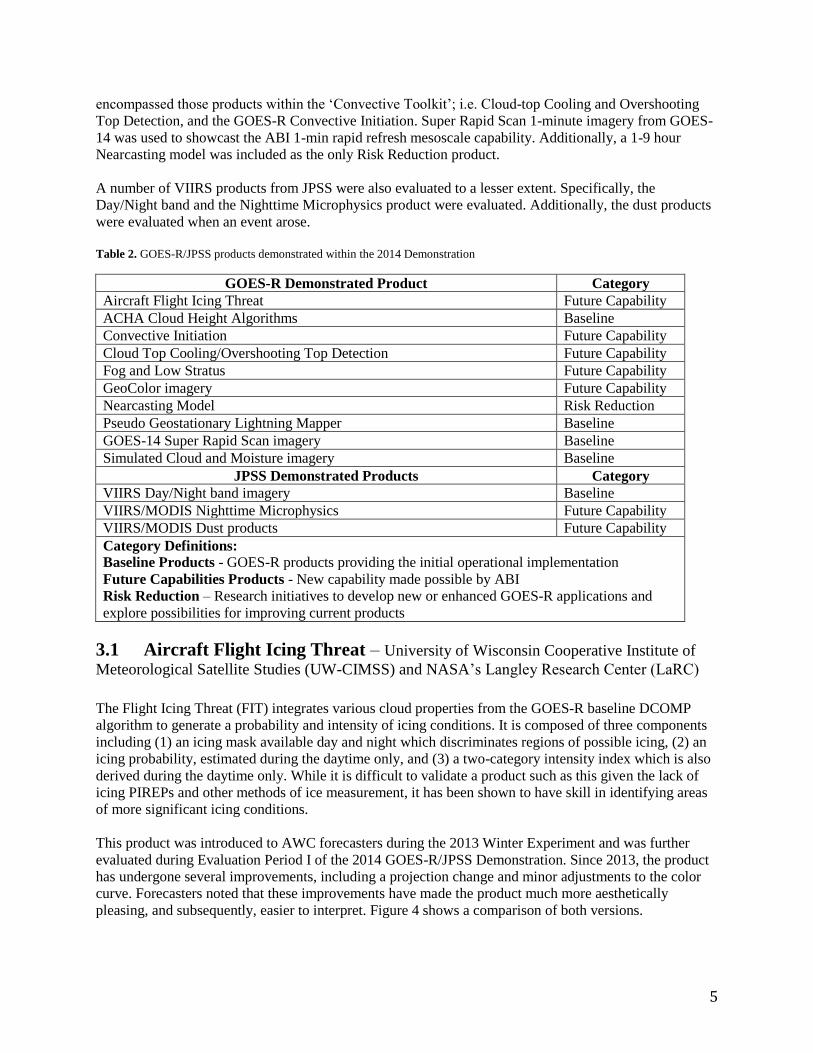
This product was introduced to AWC forecasters during the 2013 Winter Experiment and was further
evaluated during Evaluation Period I of the 2014 GOES-R/JPSS Demonstration. Since 2013, the product
has undergone several improvements, including a projection change and minor adjustments to the color
curve. Forecasters noted that these improvements have made the product much more aesthetically
pleasing, and subsequently, easier to interpret. Figure 4 shows a comparison of both versions.
6
Figure 4. The old version of the FIT (left) compared to the new version with the improved projection and color curve (right).
In general, the FIT has been used a situational awareness tool for the issuance of icing AIRMETS,
providing forecasters an at-a-glance overview of cloud layers that may contain moderate or greater icing.
However, as the icing intensity is only available during the day, forecasters found little use of the product
at night, when only a ‘yes/no’ mask is available. Furthermore, the current inputs only allow for icing
intensity solutions to be available given that there are no higher ice clouds obscuring the lower layers. In
the case of larger scale synoptic systems, where large areas of high ice clouds often do exist, the product
is also found to be of little use.
During the 2013 evaluation, NASA LaRC added additional inputs to a very similar algorithm, which
dramatically increased the solutions in the presence of higher clouds. Additionally, it allowed the
estimation of the base and top of the icing layer. AWC forecasters viewed this algorithm and noted that
the addition of those inputs to the GOES-R FIT made the product much more useful. They believe that if
these inputs could be combined with the GOES-R DCOMP version of the algorithm (perhaps in a
collaborative effort between CIMSS and LaRC), it would provide a much more robust and useable
version of the FIT.
3.2 ACHA Cloud Height Algorithms - University of Wisconsin Cooperative Institute
of Meteorological Satellite Studies (UW-CIMSS)
The Algorithm Working Group’s Cloud Height Algorithms (ACHA), including the Cloud Top Height,
Cloud Top Temperature, and Cloud Emissivity products, were provided to the AWC in 2012. Cloud Top
Heights saw the most use, and as a result of forecaster feedback over the past two years, a Cloud Top
Altitude product was developed for the 2014 demonstration. This product provides cloud tops in feet
instead of meters, as feet (or flight levels) are the common unit in aviation forecasting. Additionally, the
domain of this product not only included the CONUS, but also hemispheric and global. This extension
was designed to supplement the IOB branch of AWC operations, where large data void areas across the
globe result in forecasters becoming completely reliant on satellite imagery to issue their products. The
cloud altitudes were evaluated within the Summer Experiment on a CONUS and international scale.
AWC, CWSU, and WFO aviation focal points alike showed an immediate interest in the cloud altitudes,
as cloud bases and cloud heights are required variables for the issuance of the vast majority of aviation
related forecast products. During the experiment, they were particularly interested in the product for
convection forecasting. In aviation operations it is imperative that traffic flow managers know exactly
where tops are and how high. Ideally, traffic is directed over thunderstorms as long as possible. Once
7
aircraft began to shoot gaps and divert around thunderstorms, fuel costs and delays begin to increase
significantly. With an accurate and real-time analysis of tops, these effects can be minimized. It was in
this way that the cloud altitudes were explored.
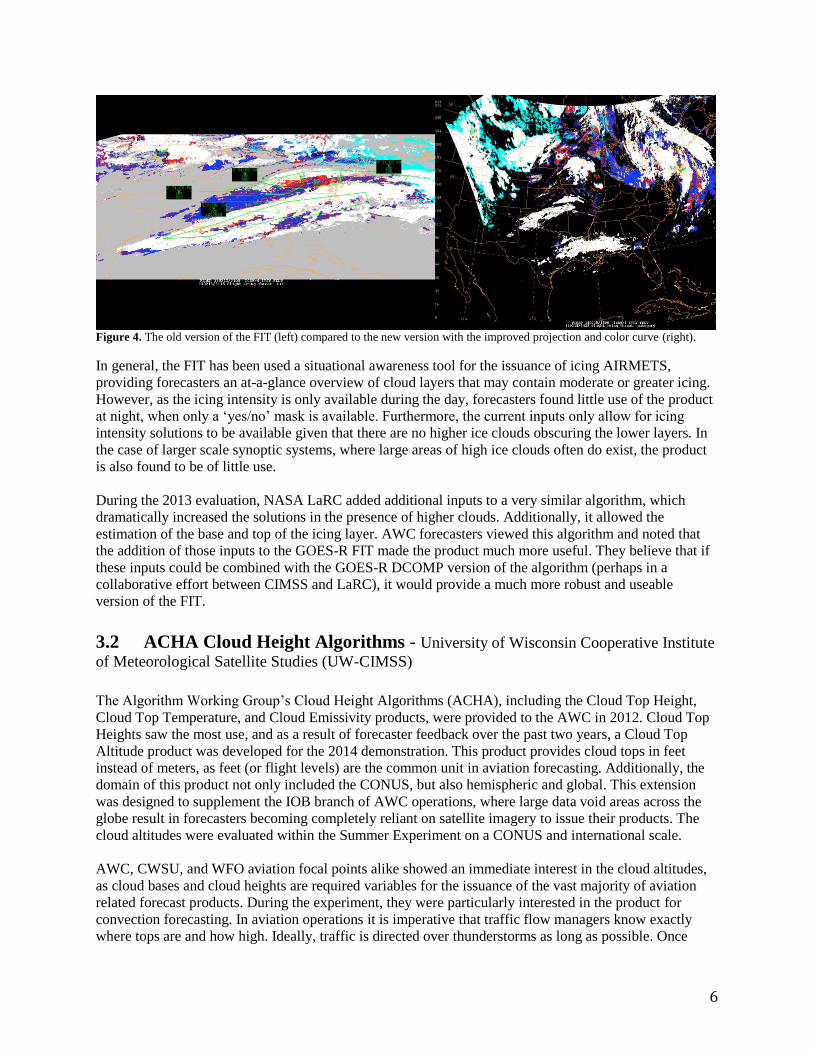
Previously, the generic color curve of the cloud altitudes was split into two separate versions. One version
highlights low clouds (< FL180) while the other highlights high cloud tops (> FL180), the threshold based
on the National Airspace System (NAS) classifications (Fig. 5). This allows forecasters to utilize the
imagery for ceiling and visibility purposes, as well as convection forecasting. However, during the
experiment a third version was developed. This version highlights tops of FL300 and above (also Fig. 5),
following the generic NAS rule of thumb that once tops are above FL300, planes can no longer safely fly
above them.
Figure 5. 20140827 1745 UTC cloud altitudes in Hurricane Marie below FL180 (top left), above FL180 (top right), and above
FL300 (bottom left), with visible imagery from GW (bottom right).
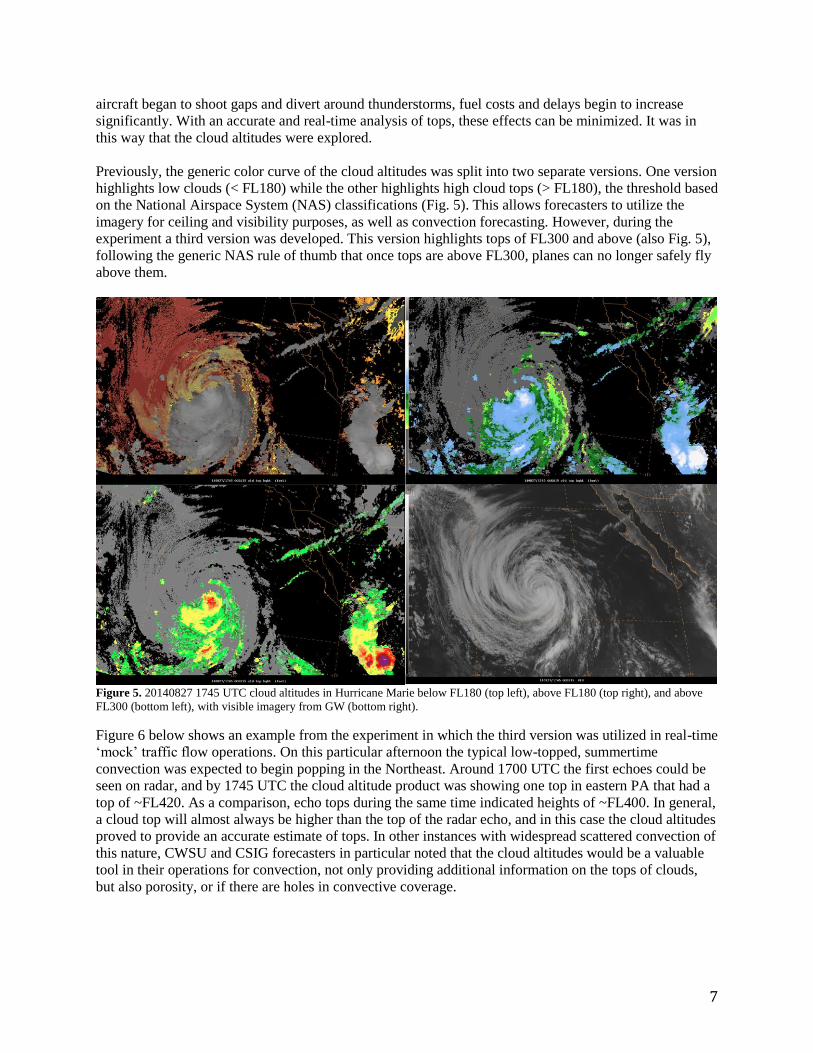
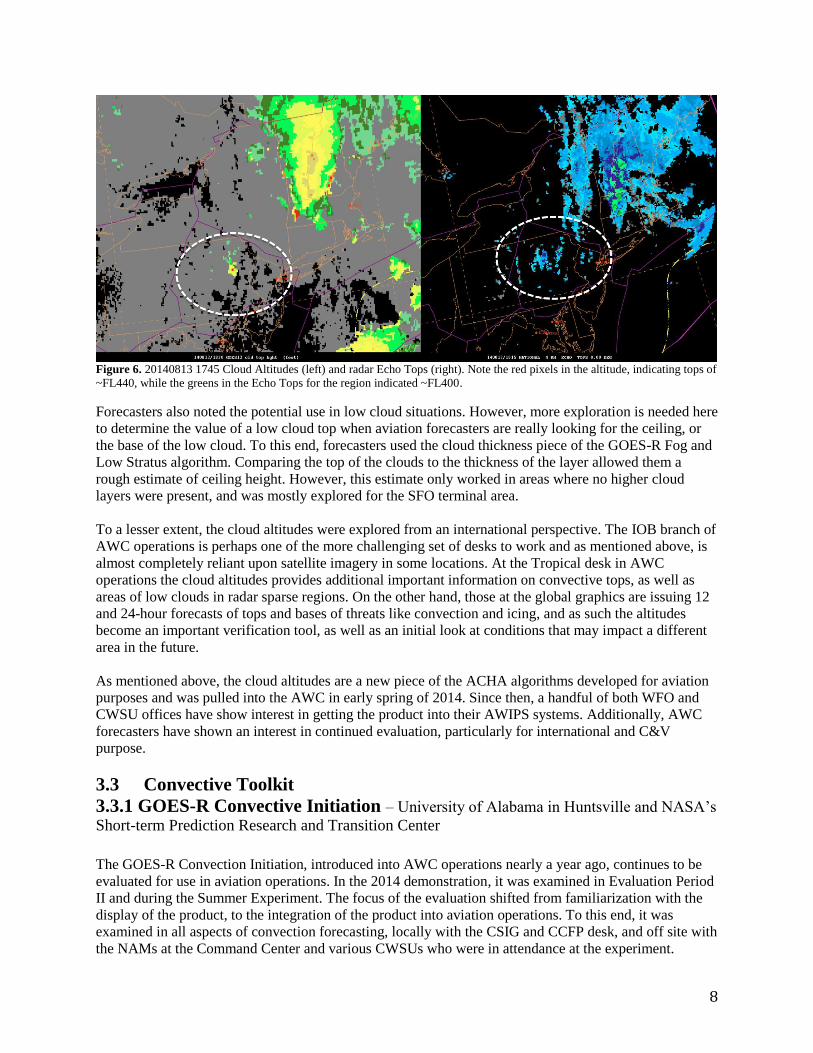
Figure 6 below shows an example from the experiment in which the third version was utilized in real-time
‘mock’ traffic flow operations. On this particular afternoon the typical low-topped, summertime
convection was expected to begin popping in the Northeast. Around 1700 UTC the first echoes could be
seen on radar, and by 1745 UTC the cloud altitude product was showing one top in eastern PA that had a
top of ~FL420. As a comparison, echo tops during the same time indicated heights of ~FL400. In general,
a cloud top will almost always be higher than the top of the radar echo, and in this case the cloud altitudes
proved to provide an accurate estimate of tops. In other instances with widespread scattered convection of
this nature, CWSU and CSIG forecasters in particular noted that the cloud altitudes would be a valuable
tool in their operations for convection, not only providing additional information on the tops of clouds,
but also porosity, or if there are holes in convective coverage.
8
Figure 6. 20140813 1745 Cloud Altitudes (left) and radar Echo Tops (right). Note the red pixels in the altitude, indicating tops of
~FL440, while the greens in the Echo Tops for the region indicated ~FL400.
Forecasters also noted the potential use in low cloud situations. However, more exploration is needed here
to determine the value of a low cloud top when aviation forecasters are really looking for the ceiling, or
the base of the low cloud. To this end, forecasters used the cloud thickness piece of the GOES-R Fog and
Low Stratus algorithm. Comparing the top of the clouds to the thickness of the layer allowed them a
rough estimate of ceiling height. However, this estimate only worked in areas where no higher cloud
layers were present, and was mostly explored for the SFO terminal area.
To a lesser extent, the cloud altitudes were explored from an international perspective. The IOB branch of
AWC operations is perhaps one of the more challenging set of desks to work and as mentioned above, is
almost completely reliant upon satellite imagery in some locations. At the Tropical desk in AWC
operations the cloud altitudes provides additional important information on convective tops, as well as
areas of low clouds in radar sparse regions. On the other hand, those at the global graphics are issuing 12
and 24-hour forecasts of tops and bases of threats like convection and icing, and as such the altitudes
become an important verification tool, as well as an initial look at conditions that may impact a different
area in the future.
As mentioned above, the cloud altitudes are a new piece of the ACHA algorithms developed for aviation
purposes and was pulled into the AWC in early spring of 2014. Since then, a handful of both WFO and
CWSU offices have show interest in getting the product into their AWIPS systems. Additionally, AWC
forecasters have shown an interest in continued evaluation, particularly for international and C&V
purpose.
3.3 Convective Toolkit
3.3.1 GOES-R Convective Initiation – University of Alabama in Huntsville and NASA’s
Short-term Prediction Research and Transition Center
The GOES-R Convection Initiation, introduced into AWC operations nearly a year ago, continues to be
evaluated for use in aviation operations. In the 2014 demonstration, it was examined in Evaluation Period
II and during the Summer Experiment. The focus of the evaluation shifted from familiarization with the
display of the product, to the integration of the product into aviation operations. To this end, it was
examined in all aspects of convection forecasting, locally with the CSIG and CCFP desk, and off site with
the NAMs at the Command Center and various CWSUs who were in attendance at the experiment.
9
The Convective SIGMET is focused on any convection that reaches at least 30dBZ intensity. As the
GOES-R CI is a probabilistic 0-2 hour forecast of convection that will initiate to >30dBZ, the product
was noted to be potentially useful in the outlook portion of their forecast. However, the fast-paced nature
of this particular desk, especially on active convection days, has these forecasters going into triage mode
once convection begins developing. At this point, they no longer care about what’s going to happen in the
short term as their focus has shifted entirely to ongoing activity.
On the other hand, CCFP is focused on the longer term. Currently the FAA requirements have them
issuing forecasts beginning at 4-hours out. This is a bit of a stretch for the GOES-R CI product, and as
such it has been determined that the algorithm would be of little use at this particular desk. However, it is
important to note that the FAA is working towards the transition of CCFP into the Aviation Weather
Statement (AWS). The AWS would potentially cover not only longer-term concerns, but focus heavily on
the 4-hour time period as well. The GOES-R CI product has been evaluated with respect to the AWS in
past experiments and could potentially have some value here.
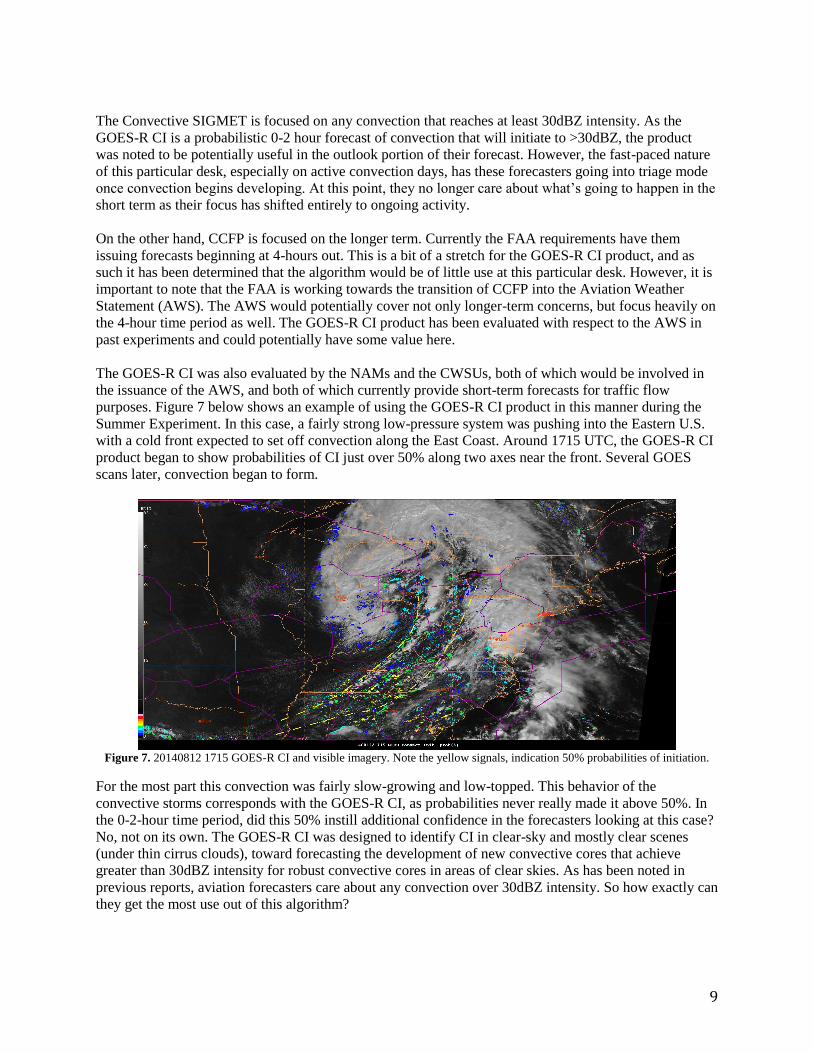
The GOES-R CI was also evaluated by the NAMs and the CWSUs, both of which would be involved in
the issuance of the AWS, and both of which currently provide short-term forecasts for traffic flow
purposes. Figure 7 below shows an example of using the GOES-R CI product in this manner during the
Summer Experiment. In this case, a fairly strong low-pressure system was pushing into the Eastern U.S.
with a cold front expected to set off convection along the East Coast. Around 1715 UTC, the GOES-R CI
product began to show probabilities of CI just over 50% along two axes near the front. Several GOES
scans later, convection began to form.
Figure 7. 20140812 1715 GOES-R CI and visible imagery. Note the yellow signals, indication 50% probabilities of initiation.
For the most part this convection was fairly slow-growing and low-topped. This behavior of the
convective storms corresponds with the GOES-R CI, as probabilities never really made it above 50%. In
the 0-2-hour time period, did this 50% instill additional confidence in the forecasters looking at this case?
No, not on its own. The GOES-R CI was designed to identify CI in clear-sky and mostly clear scenes
(under thin cirrus clouds), toward forecasting the development of new convective cores that achieve
greater than 30dBZ intensity for robust convective cores in areas of clear skies. As has been noted in
previous reports, aviation forecasters care about any convection over 30dBZ intensity. So how exactly can
they get the most use out of this algorithm?
10
In this case, forecasters were able to use the Nearcasting Model in tandem with the GOES-R CI. The
yellow dashed lines in the images above indicated areas where the Nearcast had previously been showing
some weak instability. This, along with experience in forecasting in this region during the late summer,
increased confidence in the fact that the nature of the convection would be weaker and low-topped. So,
when forecasters began to see those 50% probabilities lining up in generally the same area, they didn’t
ignore them as they may have otherwise. Instead, they monitored the area.
In summary, both CWSU and NAM forecasters agreed that the CI product does show value. However, it
is a challenge to adapt an algorithm designed for robust convection to aviation forecasting. For example,
the CI product has been shown to do extremely well with robust cores that fire along the dryline in the
Plains. While it certainly is helpful for an aviation forecaster to know that these cores will be strong, the
abundance of open airspace in this region allows airplanes plenty of room to maneuver. However, in the
case of developing low-topped cells over the New York TRACON (traffic control), where every little bit
of airspace is vital, signals from the CI product, as expected, probably wouldn’t reach above 50% and
might not result in convective storm initiation. This was noted several times during the experiment, and
while storms didn’t necessarily fire off of those weaker signals, it did provide additional confidence in the
type of convection to expect when those signals occurred consistently over a number of scans.
Forecasters would like to continue to evaluate this product towards this end. They would like to
determine: 1) if areas of consistent marginal signals (i.e. ~50%) by-in-large result in low-topped and
weaker cores, and 2) how much extra confidence this would provide when used with other tools like the
Nearcast.
3.3.2 Cloud-Top Cooling – University of Wisconsin’s Cooperative Institute for
Meteorological Satellite Studies
The University of Wisconsin’s Cloud-Top Cooling (CTC) Algorithm was designed to provide a satellite-
based tool for diagnosing convective cloud growth. Using IR brightness temperatures and AWG cloud
phase information, the algorithm (Sieglaff et al. 2011) identifies immature convective clouds that are
growing vertically, and hence cooling (K/15 minutes). Additionally, the UW-CTC utilizes GOES visible
optical depth retrievals (Sieglaff et al. 2014), which enables detection of growing convection beneath
areas of thin cirrus clouds during daytime and allows for better detection of the strongest cooling rates
with developing convection. It has been evaluated at the AWC for the past several years, and like the CI,
the focused shifted to integration into operations. In the 2014 demonstration it was evaluated at CSIG,
CCFP, and also by the NAMs and CWSUs.
While the GOES-R CI tends to lose its value at the CSIG desk once convection has begun, the Cloud Top
Cooling remains a useful at-a-glance too1. Not only is it simple and easy to interpret, but it also provides
forecasters with something to quickly key in on in the fast-paced nature of their operations. It can also be
used in tandem with radar to provide further confidence in the issued CSIG area. This is especially
important over busy terminals.
As previously mentioned, CCFP is a longer term forecast in its current state, but forecasters at this desk
tend to have the CTC product at hand as a means of verification. Additionally, once the CCFP transitions
to the AWS, the short-term (within 4 hours) will become the focus of the forecast, potentially making the
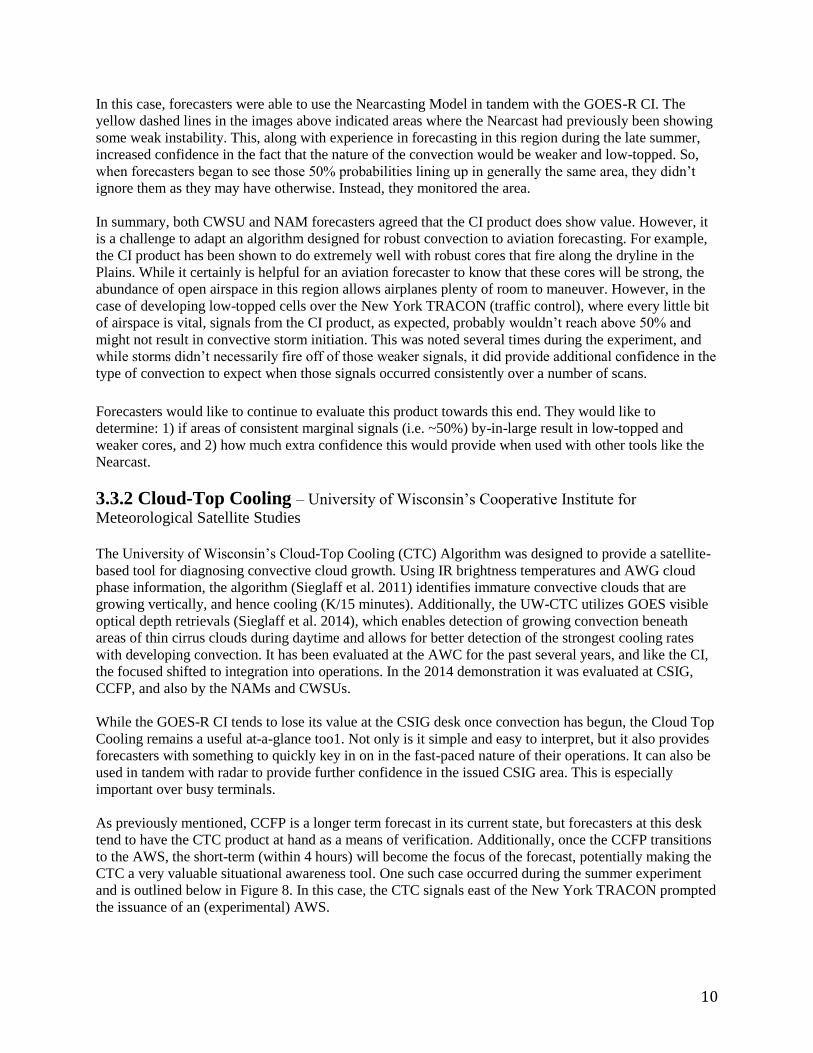
CTC a very valuable situational awareness tool. One such case occurred during the summer experiment
and is outlined below in Figure 8. In this case, the CTC signals east of the New York TRACON prompted
the issuance of an (experimental) AWS.
11
Figure 8. 20140813 1745 UTC Cloud Top Cooling and subsequently issued 1845 UTC Aviation Weather Statement
Like the CI, the CTC is designed to best identify robust cores, and while forecasters did find use in this
tool, it was once again a challenge to adapt it to an aviation perspective. In the case shown above, signals
were fairly weak, but some low-topped convection did initiate and not all of it resulted in a CTC signal.
Similar to the CI, forecasters questioned whether the presence of weak signals could improve confidence
in the forecast of weak, scattered convection, and if this would provide any economic benefit, particularly
in the Northeast corridor where even this type of convective setup can have a significant impact on
aviation operations.
3.3.3 Overshooting Top Detection – NASA’s Langley Research Center
The Overshooting Top Detection (OTD) algorithm (Bedka et al. 2010) was designed as a means to
identify anomalously cold groups of cloud pixels within an anvil cloud that are associated with
overshooting tops, and subsequently, very strong updrafts. It contains not only a simple binary yes/no
detection but also a magnitude of the overshooting tops. This year, the OTD magnitude product was
evaluated for use by the NAMs in FAA traffic flow operations over the CONUS where near-continuous
NEXRAD coverage is present.
The majority of forecast products issued by the NAMs at the FAA’s Command Center are completed
before 1500 UTC with the purpose of identifying problem areas for the remainder of the day. Traffic flow
managers then use this information to outline the necessary traffic flow programs for the day, including
potential diverts, delays, or ground stops. By the time there are overshooting top signals occurring, these
programs are generally already in effect. Additionally, while the OTD magnitude can be used to
differentiate between weaker and stronger tops, the general rule of thumb, as mentioned previously, is for
pilots to begin diverting around storms once they reach FL300, typically well below the average height of
an overshooting top. As such, the OTD algorithm was found to be of little use to the NAMs in forecasting
for FAA traffic flow operations over the CONUS. Separate evaluations will be done in future
demonstrations for offshore traffic flow operations, where the OTD product has previously proven to be
useful in areas where there is no radar coverage.
However, it does have value in the validation of products, specifically of the CCFP product. The CCFP
product was designed based on FAA requirements and as with every human issued product, can be
inaccurate at times. As such, the FAA as well as FAA customers like the airlines conduct a validation
after each day, looking at the weather that actually occurred and the accuracy of the forecast, and
subsequently the programs issued. The OTD has been useful in this validation application.
12
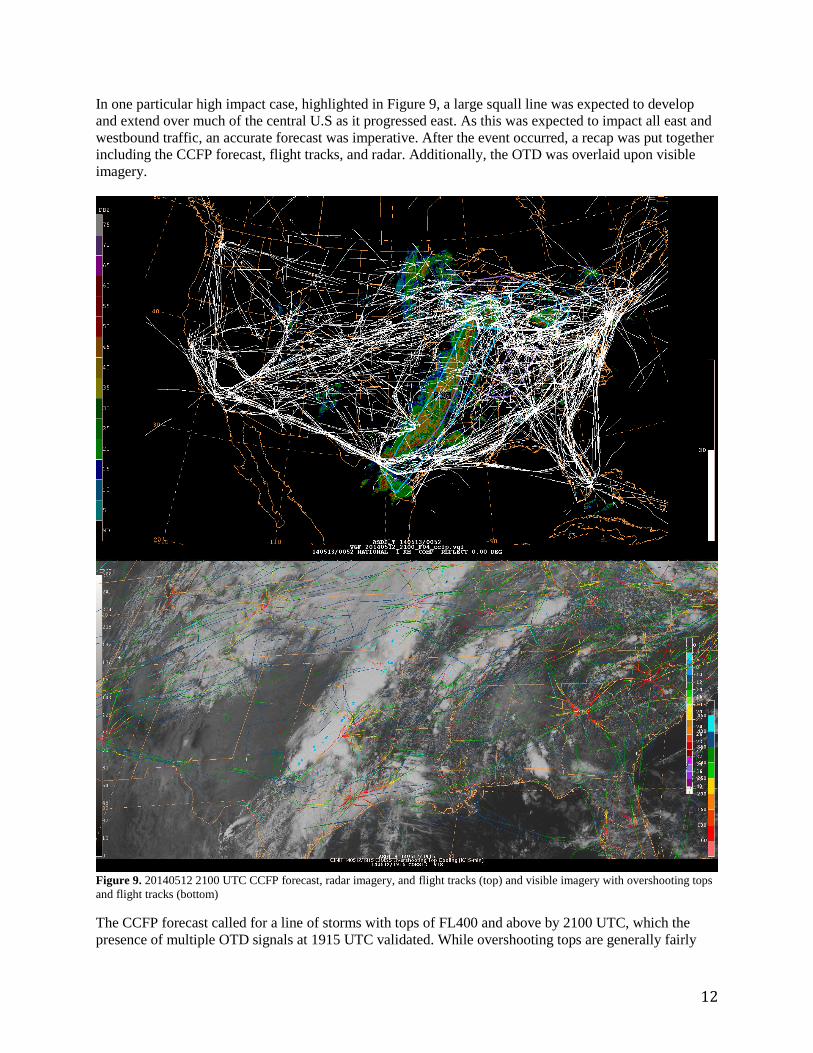
In one particular high impact case, highlighted in Figure 9, a large squall line was expected to develop
and extend over much of the central U.S as it progressed east. As this was expected to impact all east and
westbound traffic, an accurate forecast was imperative. After the event occurred, a recap was put together
including the CCFP forecast, flight tracks, and radar. Additionally, the OTD was overlaid upon visible
imagery.
Figure 9. 20140512 2100 UTC CCFP forecast, radar imagery, and flight tracks (top) and visible imagery with overshooting tops
and flight tracks (bottom)
The CCFP forecast called for a line of storms with tops of FL400 and above by 2100 UTC, which the
presence of multiple OTD signals at 1915 UTC validated. While overshooting tops are generally fairly
13
easy to pick out in visible imagery when zoomed, the signals from the OTD product provided an easy, at-
a-glance confirmation of the forecast over a broad geographic region.
It is likely that the OTD will continue to be used in this manner, as a validation tool for convective
weather forecasts. Additionally, exploration will also continue into applications of the OTD in offshore
flight routing where radar coverage is sparse. In particular, forecasters at the Tropical desk have shown
interest in utilizing the OTD for the routing of helicopter operations in the Gulf of Mexico. Helicopters
generally remain at a much lower altitude than commercial airlines, and if caught in bad weather
generally try to set down if possible. However, when flying over the Gulf for oil-rig operations, there is
no land to set down upon. As such, knowing exactly where and how severe the convection is becomes
imperative.
3.4 Lightning Detection
3.4.1 Pseudo Geostationary Lightning Mapper (PGLM) – NASA’s Short Term
Prediction Research and Transition Center
In an effort to create a proxy dataset to represent total lightning data from the Geostationary Lightning
Mapper (GLM; Goodman et al. 2013), the Lightning Mapper Array (LMA) networks were utilized as a
pseudo-GLM (PGLM) product. The PGLM is generated from seven LMA networks: Northern Colorado,
New Mexico Tech, West Texas, Oklahoma (central and southwest), Houston, TX, Northern Alabama, and
Washington DC. Before being translated into an AREA file and ingested into N-AWIPS, VHF data from
these networks are sorted into flashes and the number of flashes are counted in each 8x8 km grid box.
This creates the PGLM flash extent density and is given at a resolution to match the expected GOES-R
GLM resolution. In Evaluation Period II, the PGLM was evaluated for use by the NAMs in FAA traffic
flow operations.
After last year’s evaluations and forecaster feedback, it was intended that the AREA version of the PGLM
be reformatted as a grid file. This would allow the product to be overlaid on visible or radar imagery as an
additional tool for convection forecasting. However, because of a number of delays, the new format was
not completed in time for the 2014 demonstrations at the AWC. Additionally, due to some maintenance
issues and upgrades with various networks, there was some instability with the data in those networks. As
such, the PGLM was not evaluated until the end of Evaluation Period II, and in FAA operations only.
Diverting an aircraft around a storm requires extra fuel and depending on the size and areal coverage of
storms, it can require a significant amount. This need for extra fuel has to be taken into account at
whichever terminal an aircraft originates from. For longer flights, it’s necessary to make that decision
well ahead of any impending weather, which often causes a headache all on its own. Adding extra fuel
also makes an aircraft much heavier, subsequently resulting in fuel being burned at a faster rate. However,
taking the chance and not adding fuel and running into convection that results in an unplanned divert into
a different terminal would be even more costly than simply adding extra fuel.
Because of this, traffic flow managers attempt to prevent diverts until absolutely necessary. Typically, it
is only when they start seeing lightning in the echoes that they will begin to consider changing traffic
patterns en route, and it is for this reason that the NAMs believe the PGLM will be of great use. With
both intra-cloud (IC) and cloud-to-ground (CG), they will be able to identify lightning activity much more
accurately, particularly in the vicinity of Gulf of Mexico and Atlantic flight routes where there may only
be intra-cloud lightning. While traffic flow managers would not necessarily begin diverting traffic right
away, it would potentially provide them with more lead-time to reroute traffic more efficiently later in the
event.
14
3.5 Fog and Low Stratus - University of Wisconsin’s Cooperative Institute for
Meteorological Satellite Studies
The GOES-R Fog and Low Stratus, a fused product using both satellite and model data to produce a
probability of Instrument Flight Rule conditions, has been a part of the Aviation Weather Testbed since
2012. It continues to be one of the most commonly used products at the AWC. Locally, forecasters in the
domestic branch keep the analysis handy when issuing C&V Area Forecasts and G-AIRMETs. The
analysis provides great situational awareness and in certain situations can be used to identify when fog
may be dissipating or expanding.
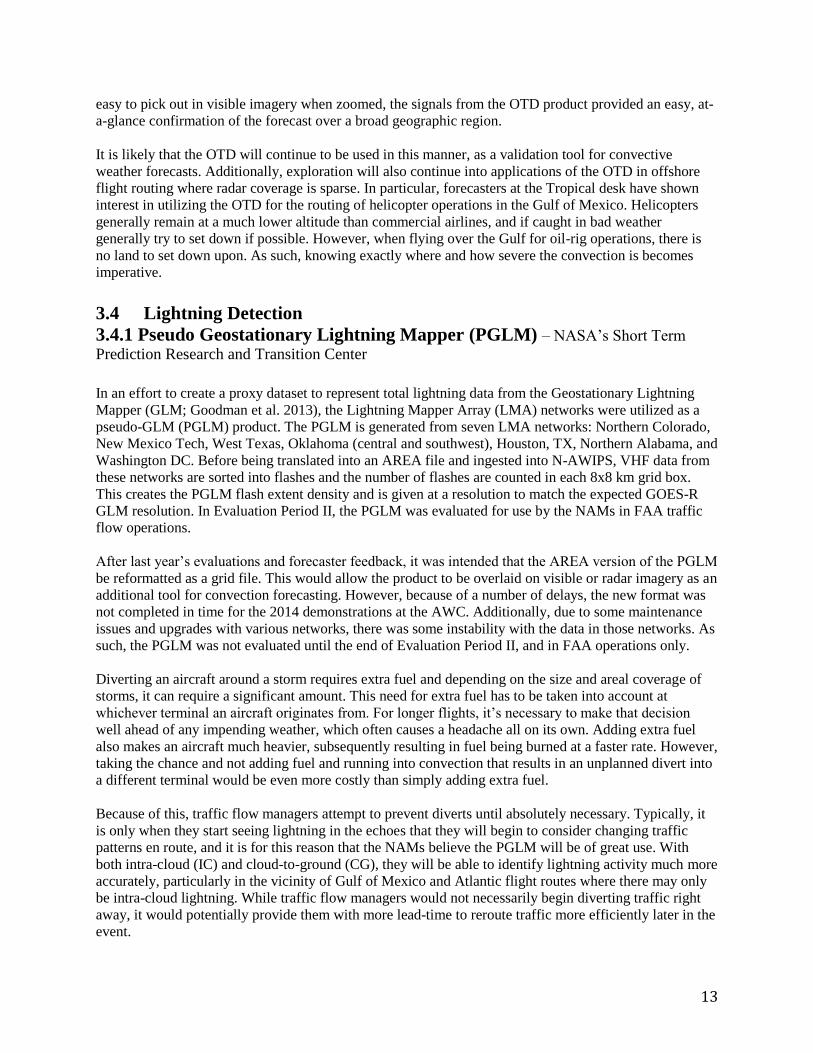
However, it is by far the most useful in FAA operations at the ATCSCC. The AWC’s NAMs utilize this
product often to provide TFMs a real-time update of ceiling conditions across the country, particularly at
busy terminals. One example of this took place in late December of 2013 in Colorado (Figure 10). Early
in the morning of the 29rd
, Eagle County Airport in Colorado was placed into a ground stop due to low
ceilings. At 1800 UTC, the FLS was continuing to indicate a high probability of IFR directly over the
airport. However, at 1830 UTC, the probability dropped to zero. After noting this, the NAM on duty
notified the TFMs, who subsequently cancelled the ground stop. By 1900 UTC, skies over the airport
were completely cleared. Ending the ground stop early saved both money and customer time. Since then
the FLS has been used in many similar cases and has become a regular part of NAM operations.
Figure 10. 20131229 1800 UTC FLS probs and sky cam (left), and 1830 UTC FLS probs and 1900 UTC sky cam (right).
Forecasters would like to keep this product in operations and also focus more on LIFR probabilities.
Additionally, it is possible that an Aviation Weather Statement for C&V will be developed. During the
Summer Experiment this was explored and the FLS was found to be a valuable tool here as well. It was
requested that evaluation to this end be continued in future experiments.
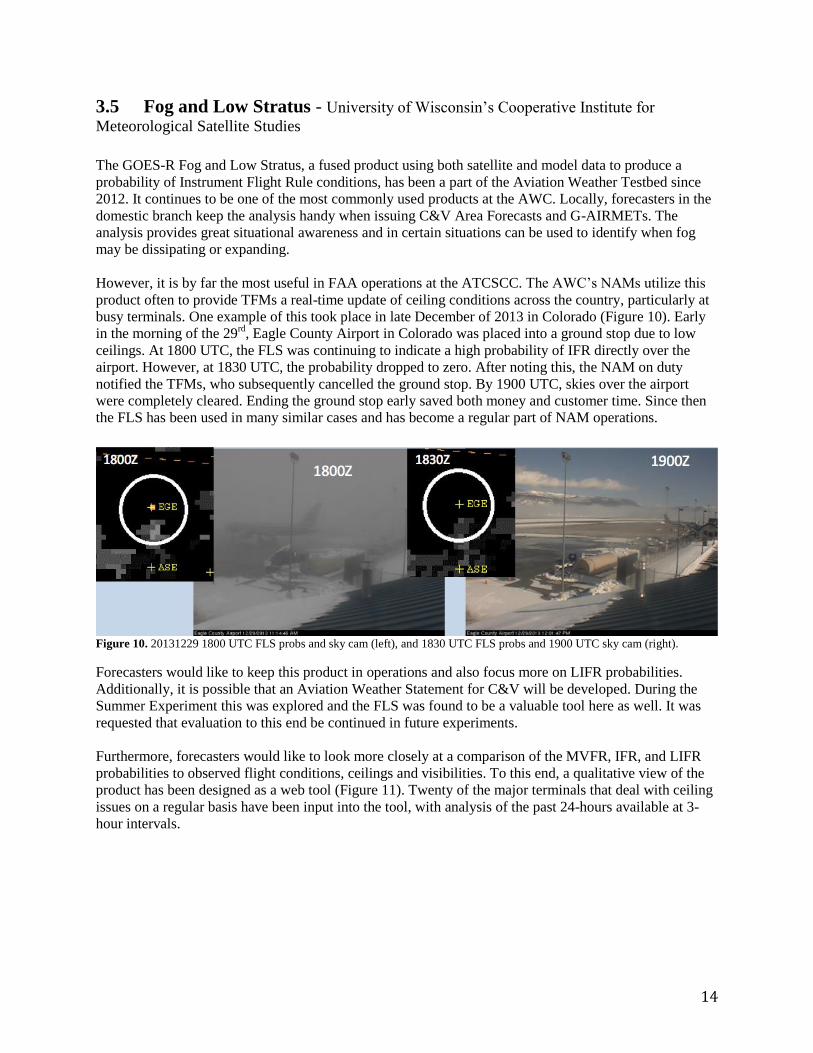
Furthermore, forecasters would like to look more closely at a comparison of the MVFR, IFR, and LIFR
probabilities to observed flight conditions, ceilings and visibilities. To this end, a qualitative view of the
product has been designed as a web tool (Figure 11). Twenty of the major terminals that deal with ceiling
issues on a regular basis have been input into the tool, with analysis of the past 24-hours available at 3-
hour intervals.
15
Figure 11. GOES-R MVFR/IFR/LIFR (blue, red, and pink respectively) vs. observed flight rule, visiblity, and ceiling (black
solid line) for SFO.
In the Summer Experiment, this assessment was exploratory for the most part. Forecasters were able to
get a feel for the data and begin to identify when the FLS did or did not perform well as compared to
observations. Eventually, the goal is to also use this information as a verification tool for various C&V
models currently running at the AWC.
3.6 Geocolor Imagery - The Cooperative Institute for Research in the Atmosphere
The GeoColor imagery was introduced to the AWC early this summer and represents some of the
potential for GEO/LEO image combination that will be available in the GOES-R era. Not only does it
provide a seamless transition between day and night, it also adds features like a natural color background,
low clouds highlighted in pink during the day, and city lights at night. The product has been available for
some time in AWIPS, but was generated in an N-AWIPS friendly format for the AWC and demonstrated
during the Summer Experiment.
One case in which it was utilized occurred on August 12th. IFR and LIFR conditions stretched across a
large portion of the Eastern U.S., while a smaller area centered over CLT. Despite the observed LIFR and
IFR conditions in that region, the corresponding IFR and LIFR probabilities from the FLS were fairly low
(Figure 12)
16
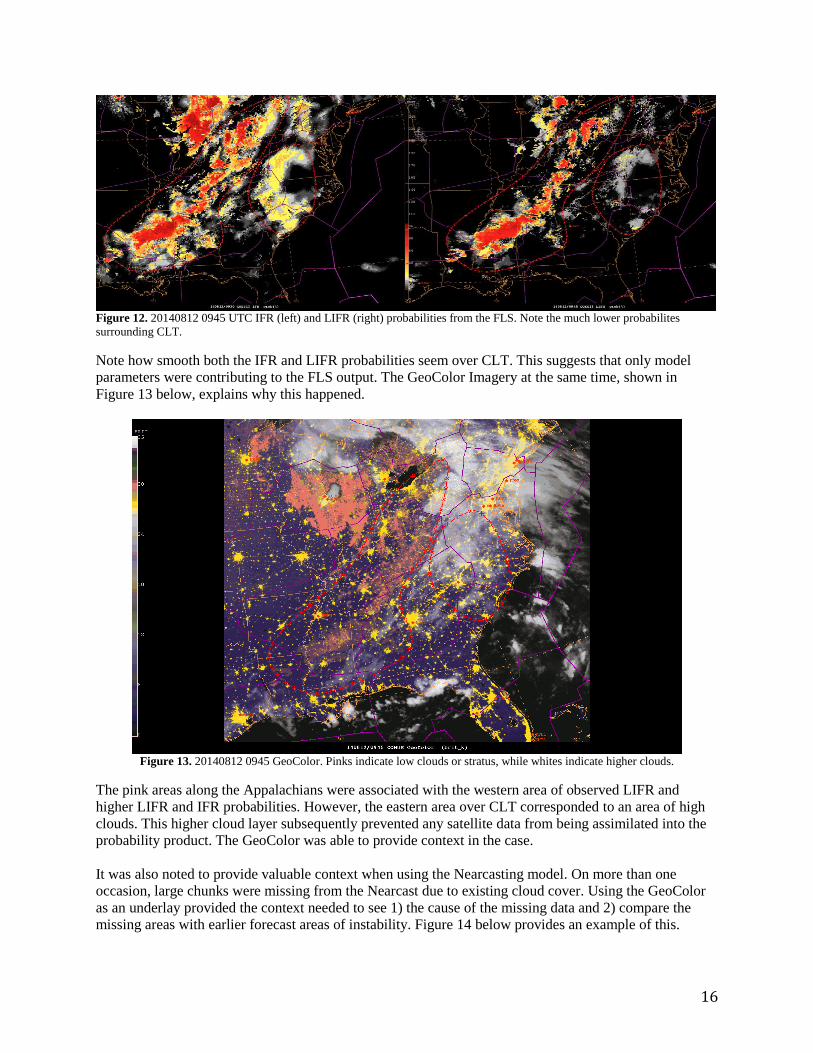
Figure 12. 20140812 0945 UTC IFR (left) and LIFR (right) probabilities from the FLS. Note the much lower probabilites
surrounding CLT.
Note how smooth both the IFR and LIFR probabilities seem over CLT. This suggests that only model
parameters were contributing to the FLS output. The GeoColor Imagery at the same time, shown in
Figure 13 below, explains why this happened.
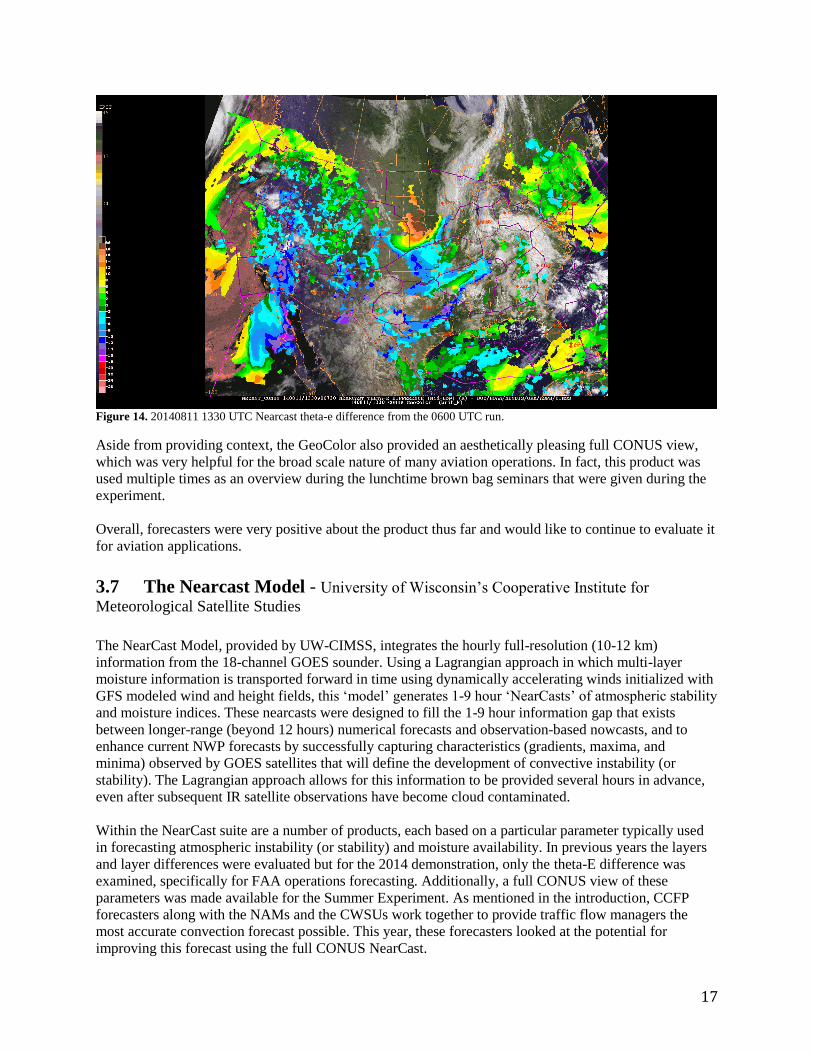
Figure 13. 20140812 0945 GeoColor. Pinks indicate low clouds or stratus, while whites indicate higher clouds.
The pink areas along the Appalachians were associated with the western area of observed LIFR and
higher LIFR and IFR probabilities. However, the eastern area over CLT corresponded to an area of high
clouds. This higher cloud layer subsequently prevented any satellite data from being assimilated into the
probability product. The GeoColor was able to provide context in the case.
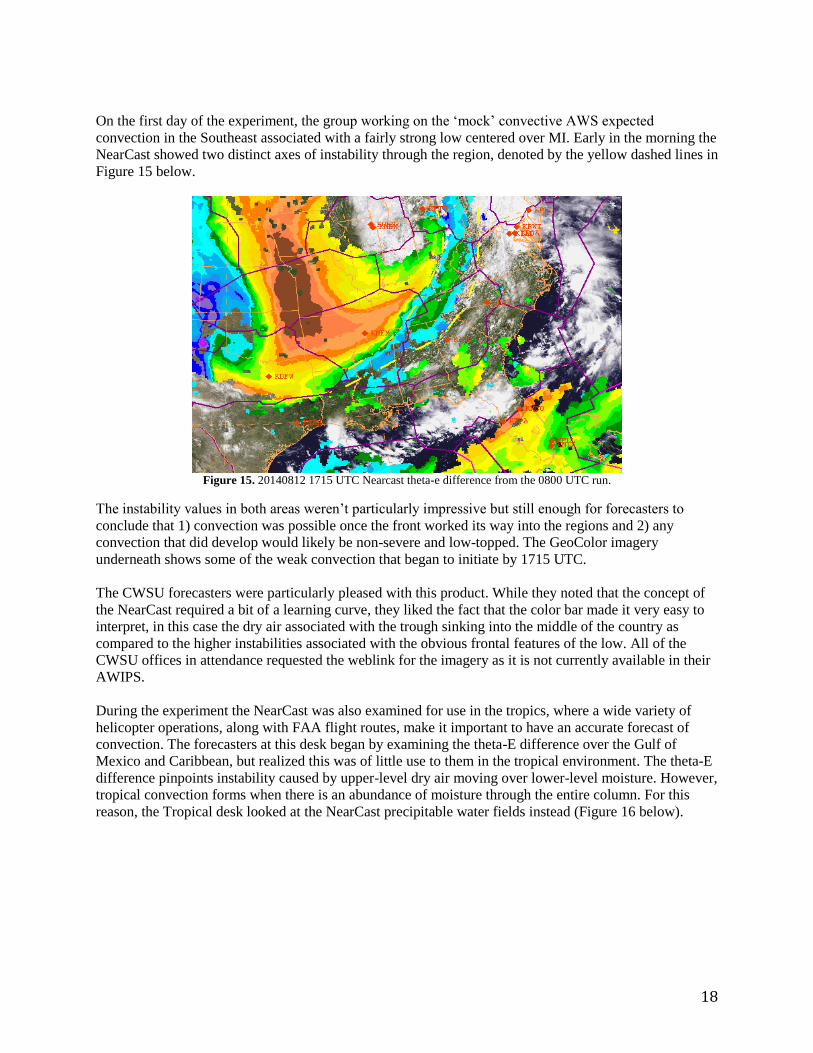
It was also noted to provide valuable context when using the Nearcasting model. On more than one
occasion, large chunks were missing from the Nearcast due to existing cloud cover. Using the GeoColor
as an underlay provided the context needed to see 1) the cause of the missing data and 2) compare the
missing areas with earlier forecast areas of instability. Figure 14 below provides an example of this.
17
Figure 14. 20140811 1330 UTC Nearcast theta-e difference from the 0600 UTC run.
Aside from providing context, the GeoColor also provided an aesthetically pleasing full CONUS view,
which was very helpful for the broad scale nature of many aviation operations. In fact, this product was
used multiple times as an overview during the lunchtime brown bag seminars that were given during the
experiment.
Overall, forecasters were very positive about the product thus far and would like to continue to evaluate it
for aviation applications.
3.7 The Nearcast Model - University of Wisconsin’s Cooperative Institute for
Meteorological Satellite Studies
The NearCast Model, provided by UW-CIMSS, integrates the hourly full-resolution (10-12 km)
information from the 18-channel GOES sounder. Using a Lagrangian approach in which multi-layer
moisture information is transported forward in time using dynamically accelerating winds initialized with
GFS modeled wind and height fields, this ‘model’ generates 1-9 hour ‘NearCasts’ of atmospheric stability
and moisture indices. These nearcasts were designed to fill the 1-9 hour information gap that exists
between longer-range (beyond 12 hours) numerical forecasts and observation-based nowcasts, and to
enhance current NWP forecasts by successfully capturing characteristics (gradients, maxima, and
minima) observed by GOES satellites that will define the development of convective instability (or
stability). The Lagrangian approach allows for this information to be provided several hours in advance,
even after subsequent IR satellite observations have become cloud contaminated.
Within the NearCast suite are a number of products, each based on a particular parameter typically used
in forecasting atmospheric instability (or stability) and moisture availability. In previous years the layers
and layer differences were evaluated but for the 2014 demonstration, only the theta-E difference was
examined, specifically for FAA operations forecasting. Additionally, a full CONUS view of these
parameters was made available for the Summer Experiment. As mentioned in the introduction, CCFP
forecasters along with the NAMs and the CWSUs work together to provide traffic flow managers the
most accurate convection forecast possible. This year, these forecasters looked at the potential for
improving this forecast using the full CONUS NearCast.
18
On the first day of the experiment, the group working on the ‘mock’ convective AWS expected
convection in the Southeast associated with a fairly strong low centered over MI. Early in the morning the
NearCast showed two distinct axes of instability through the region, denoted by the yellow dashed lines in
Figure 15 below.
Figure 15. 20140812 1715 UTC Nearcast theta-e difference from the 0800 UTC run.
The instability values in both areas weren’t particularly impressive but still enough for forecasters to
conclude that 1) convection was possible once the front worked its way into the regions and 2) any
convection that did develop would likely be non-severe and low-topped. The GeoColor imagery
underneath shows some of the weak convection that began to initiate by 1715 UTC.
The CWSU forecasters were particularly pleased with this product. While they noted that the concept of
the NearCast required a bit of a learning curve, they liked the fact that the color bar made it very easy to
interpret, in this case the dry air associated with the trough sinking into the middle of the country as
compared to the higher instabilities associated with the obvious frontal features of the low. All of the
CWSU offices in attendance requested the weblink for the imagery as it is not currently available in their
AWIPS.
During the experiment the NearCast was also examined for use in the tropics, where a wide variety of
helicopter operations, along with FAA flight routes, make it important to have an accurate forecast of
convection. The forecasters at this desk began by examining the theta-E difference over the Gulf of
Mexico and Caribbean, but realized this was of little use to them in the tropical environment. The theta-E
difference pinpoints instability caused by upper-level dry air moving over lower-level moisture. However,
tropical convection forms when there is an abundance of moisture through the entire column. For this
reason, the Tropical desk looked at the NearCast precipitable water fields instead (Figure 16 below).

19
Figure 16. 20140815 1400 UTC 3-hour Nearcast of precipitable water in the low levels (top left) and upper-levels (top right), as
well as the precipitable water difference (bottom). Areas of zero difference and high moisture values in both levels are indicated
by the dashed yellow lines.
By comparing where there were areas of zero difference to areas of higher moisture in both layers, they
were able to pinpoint several locations where moisture extended all the way through the atmosphere. As
noted from the GeoColor underlay, these areas did correspond to convective activity.
The NearCast theta-E parameter is currently available in AWC operations, and both the NAM and CWSU
forecasters would like to continue to evaluate it. Specifically, they would like to explore whether the
values and/or areas of instability can be in any way related to the porosity of convection. Forecasting
porosity, or how filled in an area or line of convection becomes, is one aspect that models struggle with
the most and any additional tools to this end would be valuable. Also, after the feedback from the
Tropical desk, forecasters would like to continue to explore the preciptable water fields.
3.8 GOES-R 14 Super Rapid Scan 1-minute Imagery - University of Wisconsin’s
Cooperative Institute for Meteorological Satellite Studies
Two periods of 1-minute Super Rapid Scan imagery (SRSOR) occurred during the 2014 demonstration,
the first in May and then second in August. This data was made available in AWC operations via an LDM
feed from SSEC. In previous years, the goal of the GOES-14 rapid scan experiments was to familiarize
forecasters with the rapid temporal refresh expected with GOES-R ABI and how it benefits operations.
This continues to be important, but this year’s focus was on how rapid the temporal refresh should be.
Given the ability of N-AWIPS to manually choose a refresh rate, forecasters specifically explored if the
benefits of 1-minute imagery outweigh a 2 or even 5-minute refresh. In other words, 1-minute imagery is
very, very aesthetically pleasing, but is it really necessary? Could we improve forecasts just as well using
20
2 or 5-minute imagery? Below in Figure 17 is a sample image from an examination of 1-minute imagery
during the Summer Experiment.
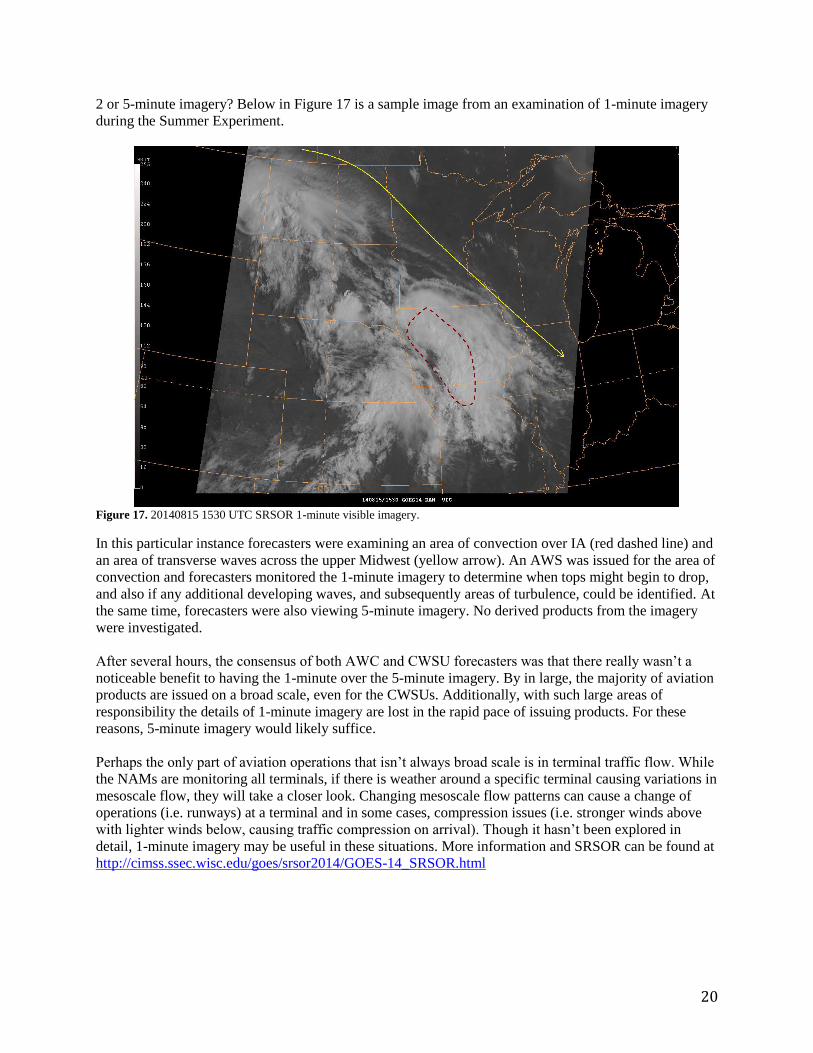
Figure 17. 20140815 1530 UTC SRSOR 1-minute visible imagery.
In this particular instance forecasters were examining an area of convection over IA (red dashed line) and
an area of transverse waves across the upper Midwest (yellow arrow). An AWS was issued for the area of
convection and forecasters monitored the 1-minute imagery to determine when tops might begin to drop,
and also if any additional developing waves, and subsequently areas of turbulence, could be identified. At
the same time, forecasters were also viewing 5-minute imagery. No derived products from the imagery
were investigated.
After several hours, the consensus of both AWC and CWSU forecasters was that there really wasn’t a
noticeable benefit to having the 1-minute over the 5-minute imagery. By in large, the majority of aviation
products are issued on a broad scale, even for the CWSUs. Additionally, with such large areas of
responsibility the details of 1-minute imagery are lost in the rapid pace of issuing products. For these
reasons, 5-minute imagery would likely suffice.
Perhaps the only part of aviation operations that isn’t always broad scale is in terminal traffic flow. While
the NAMs are monitoring all terminals, if there is weather around a specific terminal causing variations in
mesoscale flow, they will take a closer look. Changing mesoscale flow patterns can cause a change of
operations (i.e. runways) at a terminal and in some cases, compression issues (i.e. stronger winds above
with lighter winds below, causing traffic compression on arrival). Though it hasn’t been explored in
detail, 1-minute imagery may be useful in these situations. More information and SRSOR can be found at
http://cimss.ssec.wisc.edu/goes/srsor2014/GOES-14_SRSOR.html
21
3.9 Simulated Cloud and Moisture Imagery - University of Wisconsin Cooperative
Institute of Meteorological Satellite Studies (UW-CIMSS) and the Cooperative Institute for
Research in the Atmosphere (CIRA)
Various forecast fields are collected from the 00 UTC run of both the NSSL-WRF and the NAM Nest,
including pressure, temperature, water vapor, heights, canopy temperature, cloud water, cloud ice, snow,
graupel, and rain, all of which are processed as inputs for a radiative transfer model. Synthetic radiances
and brightness temperatures are generated through this model and displayed as simulated satellite imagery
meant to represent the capabilities of the Advanced Baseline Imagery (ABI) on GOES-R. The focus of
the 2014 demonstration was on the visible channel (band1; 0.65 μm), low through mid/high-level water
vapor levels (bands 8 – 10; 6.19, 6.95, and 7.34 μm), the clean infrared channel (band 14; 10.35 μm), and
the simulated band difference for fog (band 14 – 3; 10.35 μm – 3.65 μm).
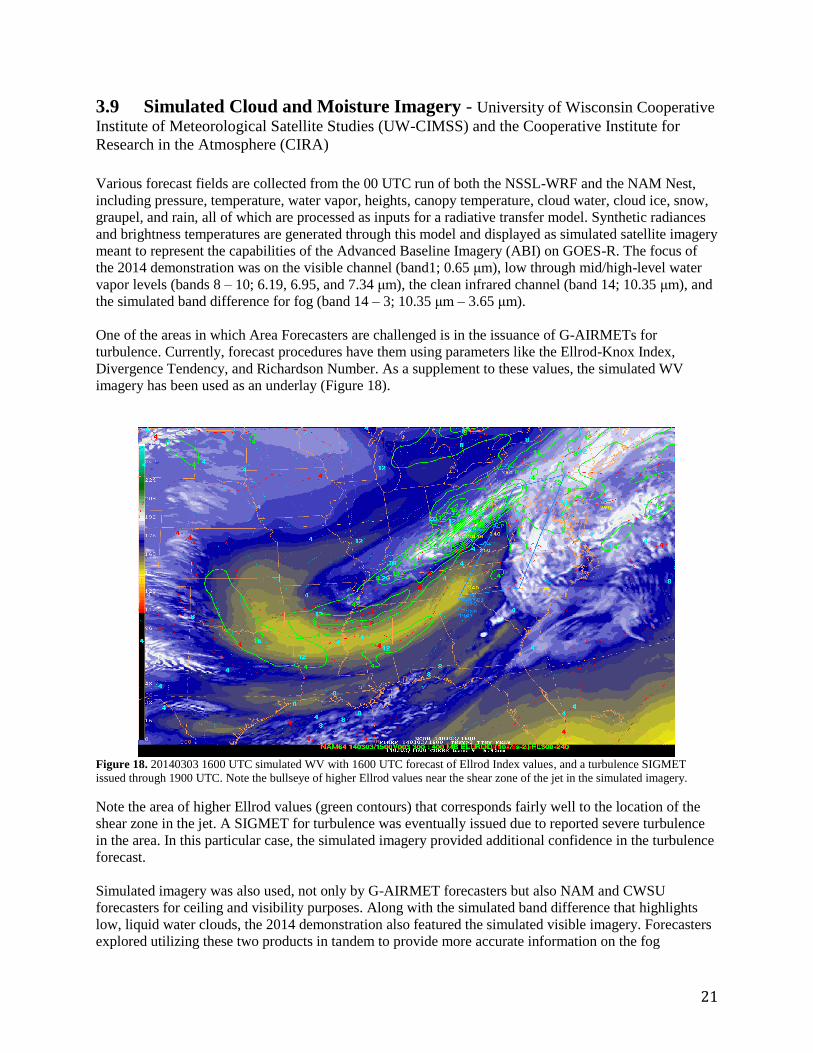
One of the areas in which Area Forecasters are challenged is in the issuance of G-AIRMETs for
turbulence. Currently, forecast procedures have them using parameters like the Ellrod-Knox Index,
Divergence Tendency, and Richardson Number. As a supplement to these values, the simulated WV
imagery has been used as an underlay (Figure 18).
Figure 18. 20140303 1600 UTC simulated WV with 1600 UTC forecast of Ellrod Index values, and a turbulence SIGMET
issued through 1900 UTC. Note the bullseye of higher Ellrod values near the shear zone of the jet in the simulated imagery.
Note the area of higher Ellrod values (green contours) that corresponds fairly well to the location of the
shear zone in the jet. A SIGMET for turbulence was eventually issued due to reported severe turbulence
in the area. In this particular case, the simulated imagery provided additional confidence in the turbulence
forecast.
Simulated imagery was also used, not only by G-AIRMET forecasters but also NAM and CWSU
forecasters for ceiling and visibility purposes. Along with the simulated band difference that highlights
low, liquid water clouds, the 2014 demonstration also featured the simulated visible imagery. Forecasters
explored utilizing these two products in tandem to provide more accurate information on the fog
22
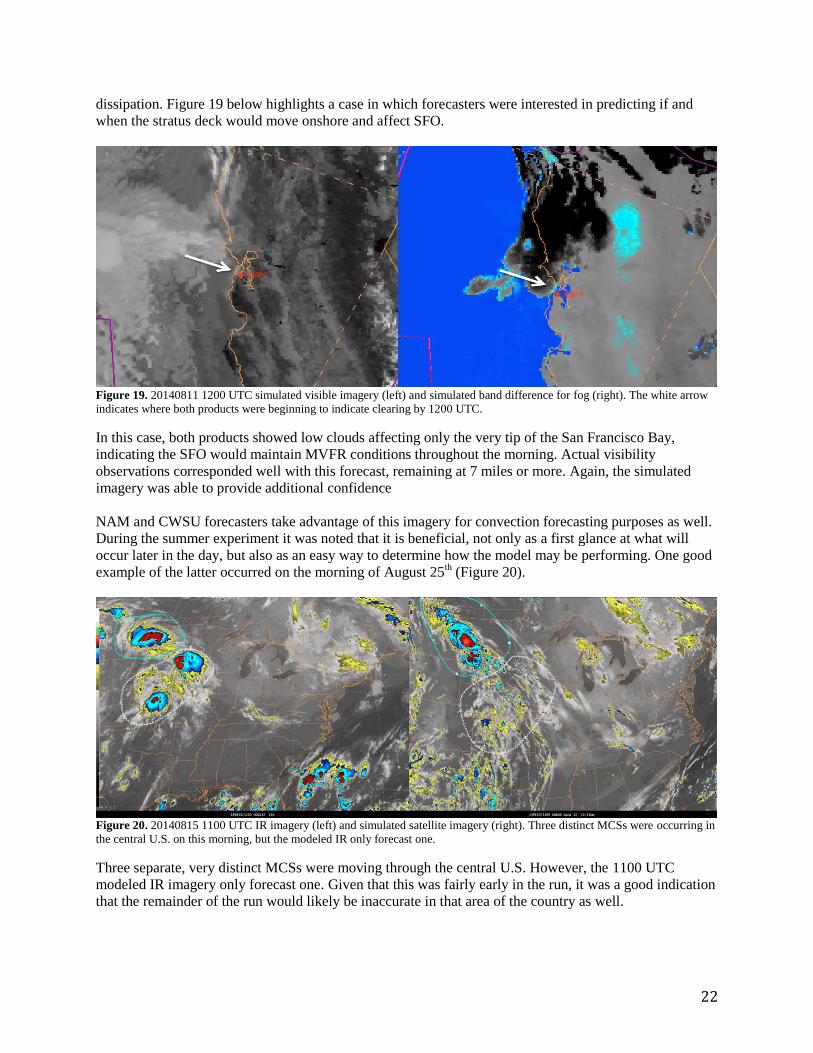
dissipation. Figure 19 below highlights a case in which forecasters were interested in predicting if and
when the stratus deck would move onshore and affect SFO.
Figure 19. 20140811 1200 UTC simulated visible imagery (left) and simulated band difference for fog (right). The white arrow
indicates where both products were beginning to indicate clearing by 1200 UTC.
In this case, both products showed low clouds affecting only the very tip of the San Francisco Bay,
indicating the SFO would maintain MVFR conditions throughout the morning. Actual visibility
observations corresponded well with this forecast, remaining at 7 miles or more. Again, the simulated
imagery was able to provide additional confidence
NAM and CWSU forecasters take advantage of this imagery for convection forecasting purposes as well.
During the summer experiment it was noted that it is beneficial, not only as a first glance at what will
occur later in the day, but also as an easy way to determine how the model may be performing. One good
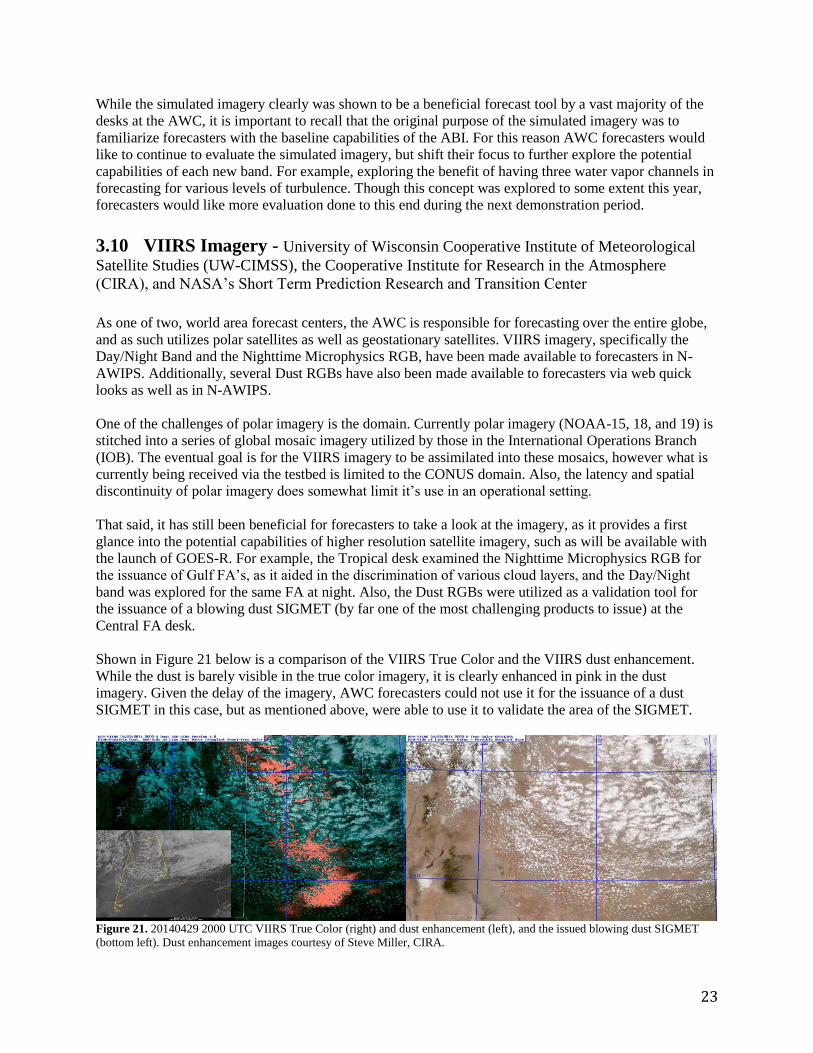
example of the latter occurred on the morning of August 25th (Figure 20).
Figure 20. 20140815 1100 UTC IR imagery (left) and simulated satellite imagery (right). Three distinct MCSs were occurring in
the central U.S. on this morning, but the modeled IR only forecast one.
Three separate, very distinct MCSs were moving through the central U.S. However, the 1100 UTC
modeled IR imagery only forecast one. Given that this was fairly early in the run, it was a good indication
that the remainder of the run would likely be inaccurate in that area of the country as well.
23
While the simulated imagery clearly was shown to be a beneficial forecast tool by a vast majority of the
desks at the AWC, it is important to recall that the original purpose of the simulated imagery was to
familiarize forecasters with the baseline capabilities of the ABI. For this reason AWC forecasters would
like to continue to evaluate the simulated imagery, but shift their focus to further explore the potential
capabilities of each new band. For example, exploring the benefit of having three water vapor channels in
forecasting for various levels of turbulence. Though this concept was explored to some extent this year,
forecasters would like more evaluation done to this end during the next demonstration period.
3.10 VIIRS Imagery - University of Wisconsin Cooperative Institute of Meteorological
Satellite Studies (UW-CIMSS), the Cooperative Institute for Research in the Atmosphere
(CIRA), and NASA’s Short Term Prediction Research and Transition Center
As one of two, world area forecast centers, the AWC is responsible for forecasting over the entire globe,
and as such utilizes polar satellites as well as geostationary satellites. VIIRS imagery, specifically the
Day/Night Band and the Nighttime Microphysics RGB, have been made available to forecasters in N-
AWIPS. Additionally, several Dust RGBs have also been made available to forecasters via web quick
looks as well as in N-AWIPS.
One of the challenges of polar imagery is the domain. Currently polar imagery (NOAA-15, 18, and 19) is
stitched into a series of global mosaic imagery utilized by those in the International Operations Branch
(IOB). The eventual goal is for the VIIRS imagery to be assimilated into these mosaics, however what is
currently being received via the testbed is limited to the CONUS domain. Also, the latency and spatial
discontinuity of polar imagery does somewhat limit it’s use in an operational setting.
That said, it has still been beneficial for forecasters to take a look at the imagery, as it provides a first
glance into the potential capabilities of higher resolution satellite imagery, such as will be available with
the launch of GOES-R. For example, the Tropical desk examined the Nighttime Microphysics RGB for
the issuance of Gulf FA’s, as it aided in the discrimination of various cloud layers, and the Day/Night
band was explored for the same FA at night. Also, the Dust RGBs were utilized as a validation tool for
the issuance of a blowing dust SIGMET (by far one of the most challenging products to issue) at the
Central FA desk.
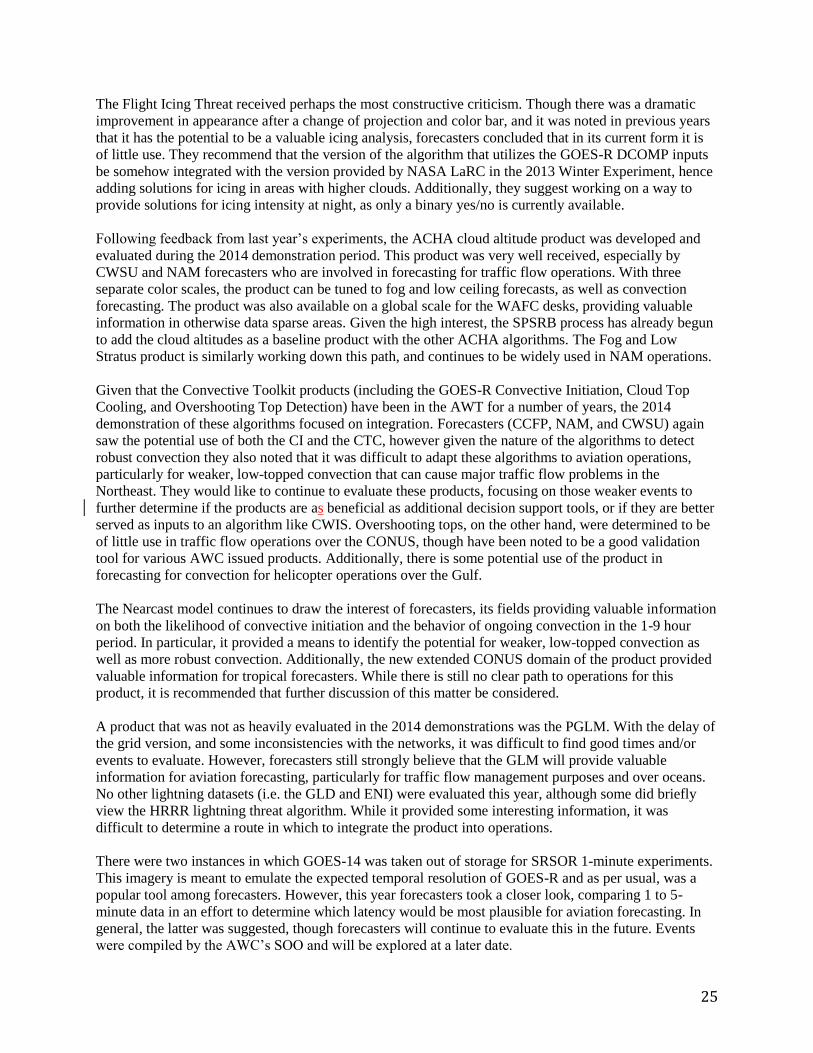
Shown in Figure 21 below is a comparison of the VIIRS True Color and the VIIRS dust enhancement.
While the dust is barely visible in the true color imagery, it is clearly enhanced in pink in the dust
imagery. Given the delay of the imagery, AWC forecasters could not use it for the issuance of a dust
SIGMET in this case, but as mentioned above, were able to use it to validate the area of the SIGMET.
Figure 21. 20140429 2000 UTC VIIRS True Color (right) and dust enhancement (left), and the issued blowing dust SIGMET
(bottom left). Dust enhancement images courtesy of Steve Miller, CIRA.

24
A similar dust RGB (one created by EUMETSAT for use with SEVIRI) was explored in which dust is
highlighted in pink and other clouds layers are assigned various other reds and oranges. This tool also did
well in highlighting dust in this case. However, the forecaster on shift using these tools suffered from
color blindness, and the pink-red contrast of the EUMETSAT dust RGB colors made it difficult to
identify the area of dust; whereas, the dust enhancement shown above was designed with color-blindness
in mind. Additionally, for the purposes of blowing dust SIGMETS, forecasters are only looking to
identify the blowing dust. While the EUMETSAT RGB does provide beneficial information on other
cloud layers, forecasters preferred the single-feature enhancement. When this type of imagery becomes
available at a higher temporal resolution it will be of huge benefit to aviation forecasters.
Again, polar imagery is difficult to evaluate in real time operations when trying to determine if it provides
any value in improving forecasts. However, like the simulated imagery, it can be used to provide some
insight into the baseline capabilities of the GOES-R ABI. In the future, forecasters would like to explore
these (dust and nighttime microphysics) and other potential capabilities for use in aviation operations.
4. Summary and Conclusions
The Aviation Weather Center has a wide variety of forecast concerns for very distinct groups of
customers including general aviation, commercial airlines and the FAA, and also helicopter operations.
The 2014 GOES-R/JPSS demonstration was designed, in part, by these forecasters, and structured so that
the focus was on integrating the chosen next generation satellite tools into the above-mentioned
operations. It was separated into two long-term evaluations, Evaluation Period I and II, and concluded
with a one-week, intensive experiment.
Unlike in previous years, no formal training seminars were conducted during the 2014 demonstration due
to staffing shortages.. Instead training was conducted via one-on-one verbal discussion with forecasters
out on various shifts. To supplement this one-on-one discussion, forecasters also had one page ‘quick
guides’ for each product available in various forms (several electronic training folders and a hard copy
binder in operations), as well as ‘2-minute case studies’. These cases are based on operational examples
from the AWC and designed to be readable in the short periods of time between product issuances. This
allowed for flexibility around forecaster shifts and heavy workloads, while also providing ample time to
hear the thoughts of as many as possible out on the operations floor. In the future, forecasters have
suggested providing audio for the ‘2-minute case studies’ by using the AWC’s Camtasia software,
resulting in a short, recorded presentation similar to the articulate formats currently used for other GOES-
R training modules. Additionally, with the new staffing hires at the AWC, it is expected that formal
training sessions may become a possibility again for next year’s demonstration. However, forecasters
suggested keeping the current training design and using the formal training seminars as an additional
supplement.
Feedback for the 2014 demonstration period was received via in-depth discussion with forecasters and
blog posts. Survey questions were omitted based on a handful of initial meetings with forecasters during
the planning stages of the demonstration. In general, it was noted that forecasters need exposure to a
product being used in their real-time operations, especially if it is fairly new. Unless someone is out on
the operations floor, encouraging them to take a look at a specific product (like a satellite tool), they
won’t often take time to pull it up, let alone answer a survey question. Admittedly it is a slow process, but
once a few forecasters begin looking at a product regularly, that information begins to spread through the
rest of the operations floor. As a product becomes more widely used and is discussed more frequently, the
resulting feedback becomes much more detailed and constructive.
25
The Flight Icing Threat received perhaps the most constructive criticism. Though there was a dramatic
improvement in appearance after a change of projection and color bar, and it was noted in previous years
that it has the potential to be a valuable icing analysis, forecasters concluded that in its current form it is
of little use. They recommend that the version of the algorithm that utilizes the GOES-R DCOMP inputs
be somehow integrated with the version provided by NASA LaRC in the 2013 Winter Experiment, hence
adding solutions for icing in areas with higher clouds. Additionally, they suggest working on a way to
provide solutions for icing intensity at night, as only a binary yes/no is currently available.
Following feedback from last year’s experiments, the ACHA cloud altitude product was developed and
evaluated during the 2014 demonstration period. This product was very well received, especially by
CWSU and NAM forecasters who are involved in forecasting for traffic flow operations. With three
separate color scales, the product can be tuned to fog and low ceiling forecasts, as well as convection
forecasting. The product was also available on a global scale for the WAFC desks, providing valuable
information in otherwise data sparse areas. Given the high interest, the SPSRB process has already begun
to add the cloud altitudes as a baseline product with the other ACHA algorithms. The Fog and Low
Stratus product is similarly working down this path, and continues to be widely used in NAM operations.
Given that the Convective Toolkit products (including the GOES-R Convective Initiation, Cloud Top
Cooling, and Overshooting Top Detection) have been in the AWT for a number of years, the 2014
demonstration of these algorithms focused on integration. Forecasters (CCFP, NAM, and CWSU) again
saw the potential use of both the CI and the CTC, however given the nature of the algorithms to detect
robust convection they also noted that it was difficult to adapt these algorithms to aviation operations,
particularly for weaker, low-topped convection that can cause major traffic flow problems in the
Northeast. They would like to continue to evaluate these products, focusing on those weaker events to
further determine if the products are as beneficial as additional decision support tools, or if they are better
served as inputs to an algorithm like CWIS. Overshooting tops, on the other hand, were determined to be
of little use in traffic flow operations over the CONUS, though have been noted to be a good validation
tool for various AWC issued products. Additionally, there is some potential use of the product in
forecasting for convection for helicopter operations over the Gulf.
The Nearcast model continues to draw the interest of forecasters, its fields providing valuable information
on both the likelihood of convective initiation and the behavior of ongoing convection in the 1-9 hour
period. In particular, it provided a means to identify the potential for weaker, low-topped convection as
well as more robust convection. Additionally, the new extended CONUS domain of the product provided
valuable information for tropical forecasters. While there is still no clear path to operations for this
product, it is recommended that further discussion of this matter be considered.
A product that was not as heavily evaluated in the 2014 demonstrations was the PGLM. With the delay of
the grid version, and some inconsistencies with the networks, it was difficult to find good times and/or
events to evaluate. However, forecasters still strongly believe that the GLM will provide valuable
information for aviation forecasting, particularly for traffic flow management purposes and over oceans.
No other lightning datasets (i.e. the GLD and ENI) were evaluated this year, although some did briefly
view the HRRR lightning threat algorithm. While it provided some interesting information, it was
difficult to determine a route in which to integrate the product into operations.
There were two instances in which GOES-14 was taken out of storage for SRSOR 1-minute experiments.
This imagery is meant to emulate the expected temporal resolution of GOES-R and as per usual, was a
popular tool among forecasters. However, this year forecasters took a closer look, comparing 1 to 5-
minute data in an effort to determine which latency would be most plausible for aviation forecasting. In
general, the latter was suggested, though forecasters will continue to evaluate this in the future. Events
were compiled by the AWC’s SOO and will be explored at a later date.
26
Another tool meant to emulate GEO/LEO integration capabilities was the GeoColor imagery, a new
display developed by CIRA. Forecasters responded well to the aesthetically pleasing nature and CONUS
scale of the display and found it to be a valuable context for other products such as the Nearcasting Model
and the Fog and Low Stratus. They will continue to explore this product for further uses in aviation
operations. Additionally, it is expected that new, extended Atlantic and Pacific domains will be available
in the near future.
Perhaps one of the most popular tools among forecasters is the simulated imagery. This imagery was
again noted as a valuable forecast tool for icing, turbulence, ceiling and visibility, and convection, and is
used frequently by AWC and NAM forecasters, and also by a number of CWSU forecasters. These
forecasters would like to continue to have this imagery as forecast tool, but believe it is important that it
also be explored as a way in which to familiarize them with the capabilities of the ABI. This was pursued
somewhat by turbulence forecasters viewing the three water vapor channels, and will be likely be more of
a focus in upcoming evaluations.
Lastly, several VIIRS products were evaluated throughout the 2014 demonstration period. Given the
global forecast responsibilities at the AWC, high latitude polar imagery is continuously utilized in the
local generation of the global mosaics used in operations. Currently the VIIRS imagery that the AWC has
access to is either CONUS or Alaska centric. For this reason, forecasters found it of little use for real-time
forecasting. However, they were able to use it as a means to explore future capability displays, such as the
dust enhancement and the nighttime microphysics, both potential possibilities with the GOES-R ABI.
Overall, feedback from the forecasters was very constructive, and by in large positive. Perhaps one of the
biggest requests related to all of these products was the availability to the CWSU forecasters. Given the
constant collaboration between the AWC and CWSUs for FAA operations, it is vital that both groups
have access to the same satellite tools. This is somewhat difficult given the N-AWIPS at the AWC vs. the
AWIPS-1 display at the CWSU’s, and continuous bandwidth issues experienced by the CWSUs. This
matter will be pursued within the next several months. Furthermore, additional meetings are in the works
to provide the FAA research team with various GOES-R tools for eventual integration into their weather
display systems.
More detailed feedback and case examples from the 2014 Demonstration can be found on the GOES-R
Proving Ground AWT blog at:
http://goesrawt.blogspot.com/
General information about the 2014 Summer Experiment, all included datasets, the testbed blog, training
material, etc., can be found at the AWT testbed home page:
http://testbed.aviationweather.gov/page/public?name=2014_Summer_Experiment
Details on the baseline algorithms and optional future capabilities can be found at:
http://www.goes-r.gov/resources/docs.html
5. References Baum, B. A., P. Yang, A. Heymsfield, S. Platnick, M. King, Y-X. Hu, S. Bedka, 2005: Bulk Scattering
Properties for the Remote Sensing of Ice Clouds. Part II: Narrowband Models. J. Appl. Meteor., 44,
1896–1911.
27
Bedka, K., J. Brunner, R. Dworak, W. Feltz, J. Otkin, T. Greenwald, 2010: Objective Satellite-Based
Detection of Overshooting Tops Using Infrared Window Channel Brightness Temperature Gradients. J.
Appl. Meteor. Climatol., 49, 181–202.
Bedka, K., R. Dworak, J. Brunner ,and W. Feltz, 2012: Validation of Satellite-Based Objective,
Overshooting Cloud Top Detection Methods Using Cloudsat Cloud Profiling Radar Observations. J.
Appl. Meteor. and Climatol., In Press.
Han, Q., R. Welch, J. Chou, W. Rossow, A. White, 1995: Validation of Satellite Retrievals of Cloud
Microphysics and Liquid Water Path Using Observations from FIRE. J. Atmos. Sci., 52, 4183–4195.
Hartung, D. C., J. M. Sieglaff, L. M. Cronce, and W. F. Feltz, 2012: An Inter-Comparison of UWCI-CTC
Algorithm Cloud-Top Cooling Rates with WSR-88D Radar Data. Submitted to Wea. Forecasting.
Heymsfield, A. J., S. Matrosov, B. Baum, 2003: Ice Water Path–Optical Depth Relationships for Cirrus
and Deep Stratiform Ice Cloud Layers. J. Appl. Meteor., 42, 1369–1390.
Mecikalski, J. R. and K. M. Bedka, 2006: Forecasting Convective Initiation by Monitoring the Evolution
of Moving Cumulus in Daytime GOES Imagery. Mon. Wea. Rev., 134, 49-78.
Mecikalski, J. R., J. K. Williams, D. Ahijevych, A. LeRoy, J. R. Walker, and C. P. Jewett, 2013:
Optimizing the use of geostationary satellite data for nowcasting convective initiation. J. Appl. Meteorol.
Climatol., In preparation.
Monette, S. A. and Velden, C. S. 2012: Examining Trends in Satellite-Detected Tropical Overshooting
Tops as a Potential Predictor of Tropical Cyclone Rapid Intensification. J. Appl. Meteor. Climatol., 51,
1917-1930
Seemann, S. W., E. Borbas, R. Knuteson, G. Stephenson, H. Huang, 2008: Development of a Global
Infrared Land Surface Emissivity Database for Application to Clear Sky Sounding Retrievals from
Multispectral Satellite Radiance Measurements. J. Appl. Meteor. Climatol., 47, 108–123.
Schmit, T. J., and co-authors, 2013: GOES-14 Super Rapid Operations to Prepare for GOES-R,
Conditionally accepted J. Applied Remote Sensing.
Sieglaff, J. M., L. M. Cronce, W. F. Feltz, K. M. Bedka, M. J. Pavolonis, and A. K. Heidinger,
2011: Nowcasting convective storm initiation using satellite-based box-averaged cloud-top cooling and
cloud-type trends. J. Appl. Meteor. Climatol., 50, 110–126.
Sieglaff, J. M., L. M. Cronce, W. F. Feltz, 2014: Improving Satellite-Based Convective Cloud Growth
Monitoring with Visible Optical Depth Retrievals. J. Applied Meteor. Climatol., 53, 506-520
Smith Jr., William L., et al., 2012: Determining the Flight Icing Threat to Aircraft with Single-Layer
Cloud Parameters Derived from Operational Satellite Data. J Appl. Meteor. Climatol., Vol. not yet printed
Walker, J.R., W.M. MacKenzie, Jr., J.R. Mecikalski, and C.P. Jewett, 2012:An Enhanced Geostationary
Satellite-based Convective Initiation Algorithm for 0-2 Hour Nowcasting with Object Tracking.
J.Appl.Meteor.Climatol. 51. 1931-1949