Embed Size (px)
Citation preview
AVISTA UTILITIES
POWER COST ADJUSTMENT REPORT
MONTH OF JULY 2020
ID PCA July 2020
1 of 23

Avista Corporation PCAJuly 2020 through June 2021IPUC Deferral Analysis
Jul-20 thruDeferral for 2020-21 Deferral Period Jul-20 Aug-20 Sep-20 Oct-20 Nov-20 Dec-20 Jan-21 Feb-21 Mar-21 Apr-21 May-21 Jun-21 Jun-21
BASE RATE RECOVERY - LOAD CHANGE ADJUSTMENTIdaho Actual Sales MWh 260,747 260,747Idaho Base Sales MWh 248,508 267,545 222,188 233,573 258,867 300,596 291,519 255,432 263,479 232,405 217,175 214,774 3,006,061Actual - Base Sales MWh 12,239 (267,545) (222,188) (233,573) (258,867) (300,596) (291,519) (255,432) (263,479) (232,405) (217,175) (214,774) (2,745,314)LCAR $/MWh 22.00 22.00 22.00 22.00 22.00 22.00 22.00 22.00 22.00 22.00 22.00 22.00 Retail Revenue Adjustment - Under(+)/Over(-) $ (269,258) 5,885,990 4,888,136 5,138,606 5,695,074 6,613,112 6,413,418 5,619,504 5,796,538 5,112,910 4,777,850 4,725,028 60,396,908
Base-to-Actual Percent Difference % 4.92% -100.00% -100.00% -100.00% -100.00% -100.00% -100.00% -100.00% -100.00% -100.00% -100.00% -100.00% -91.33%
NET POWER SUPPLY EXPENSEActual Expense555 Purchased Power $ 9,869,695 9,869,695447 Sales for Resale $ (6,841,567) (6,841,567)501 Thermal Fuel $ 2,120,045 2,120,045547 CT Fuel $ 3,030,971 3,030,971456 Transmission Revenue $ (2,088,798) (2,088,798)565 Transmission Expense $ 1,407,838 1,407,838557 Resource Optimization $ 699,050 699,050537 MT. Invasive Species Expe $ 134,176 134,176557 Expense $ 19,631 19,631Adjusted Actual Net Expense $ 8,351,041 0 0 0 0 0 0 0 0 0 0 0 8,351,041Idaho Allocation Factor $ 34.61% 34.61% 34.61% 34.61% 34.61% 34.61% 34.61% 34.61% 34.61% 34.61% 34.61% 34.61%Idaho Actual Net Expense $ 2,890,295 0 1 1 0 0 0 0 0 0 0 0 2,890,297
Authorized Net Expense555 Purchased Power $ 6,873,649 7,493,752 5,812,287 5,858,969 6,095,603 6,285,056 6,656,472 6,714,560 6,376,335 6,174,902 6,066,290 5,885,835 76,293,710447 Sales for Resale $ (4,383,497) (3,207,858) (5,796,167) (4,809,854) (3,282,986) (4,385,610) (3,058,364) (3,072,028) (4,566,884) (5,980,611) (3,814,582) (3,585,099) (49,943,540)501 Thermal Fuel $ 2,296,839 2,529,061 2,596,434 2,643,241 2,568,771 2,658,469 2,626,073 2,508,793 2,598,458 2,294,629 1,616,919 1,641,106 28,578,793547 CT Fuel $ 3,622,194 6,001,181 6,718,588 6,093,306 5,933,976 7,575,488 7,913,114 6,814,051 6,109,768 3,778,713 1,270,638 1,329,074 63,160,091456 Transmission Revenue $ (1,893,836) (1,745,852) (1,207,426) (1,243,178) (1,250,663) (1,271,088) (1,350,696) (1,404,488) (1,090,019) (1,075,655) (1,442,603) (1,667,688) (16,643,192)565 Transmission Expense $ 1,382,417 1,382,417 1,382,417 1,382,417 1,382,417 1,382,417 1,382,417 1,382,417 1,382,417 1,382,417 1,382,417 1,382,417 16,589,004Gas Liquids Revenue $ (43,583) (43,583) (43,583) (43,583) (43,583) (43,583) (43,583) (43,583) (43,583) (43,583) (43,583) (43,583) (522,996)Montana Invasive Species Expense $ 134,167 134,167 134,167 134,167 134,167 134,167 134,167 134,167 134,167 134,167 134,167 134,167 1,610,004Settlement Adjustments $ 36,545 52,387 (17,283) 17,595 88,374 156,333 229,921 (71,932) (7,545) 2,378 (164,615) (122,794) 199,364Authorized Net Expense $ 8,024,895 12,452,700 9,506,133 9,924,901 11,447,118 12,491,649 14,489,521 12,961,958 10,893,114 6,667,357 5,005,048 4,953,435 118,817,829Idaho Allocation Factor $ 34.61% 34.61% 34.61% 34.61% 34.61% 34.61% 34.61% 34.61% 34.61% 34.61% 34.61% 34.61%Idaho Authorized Net Expense $ 2,777,416 4,309,879 3,290,073 3,435,008 3,961,848 4,323,360 5,014,823 4,486,134 3,770,107 2,307,572 1,732,247 1,714,384 41,122,851
RENEWABLE ENERGY CREDIT REVENUEActual REC Revenue $ (216,916) (216,916)Authorized REC Revenue $ (101,917) (101,917) (101,917) (101,917) (101,917) (101,917) (101,917) (101,917) (101,917) (101,917) (101,917) (101,917) (1,223,004)Actual - Authorized REC Revenue $ (114,999) 101,917 101,917 101,917 101,917 101,917 101,917 101,917 101,917 101,917 101,917 101,917 1,006,088Idaho Allocation Factor $ 34.61% 34.61% 34.61% 34.61% 34.61% 34.61% 34.61% 34.61% 34.61% 34.61% 34.61% 34.61%Actual - Authorized Idaho REC Revenue $ (39,801) 35,273 35,273 35,273 35,273 35,273 35,273 35,273 35,273 35,273 35,273 35,273 348,202
COST RECOVERY SUBJECT TO SHARINGActual - Authorized Net Expense (Idaho share) $ 112,879 (4,309,879) (3,290,072) (3,435,007) (3,961,848) (4,323,360) (5,014,823) (4,486,134) (3,770,107) (2,307,572) (1,732,247) (1,714,384) (38,232,554)Retail Revenue Adjustment $ (269,258) 5,885,990 4,888,136 5,138,606 5,695,074 6,613,112 6,413,418 5,619,504 5,796,538 5,112,910 4,777,850 4,725,028 60,396,908REC Revenue $ (39,801) 35,273 35,273 35,273 35,273 35,273 35,273 35,273 35,273 35,273 35,273 35,273 348,202
456030 ED ID - Sch 25P Transmission $ 10,000 10,000456380 ED ID - Sch 25P REC Revenue $ (20,706) (20,706)Sch 25P Net Cost (10,706) 0 0 0 0 0 0 0 0 0 0 0 (10,706)
Total Cost (Subject to Sharing) $ (206,886) 1,611,384 1,633,337 1,738,872 1,768,499 2,325,025 1,433,868 1,168,643 2,061,704 2,840,611 3,080,876 3,045,917 22,501,850Sharing Percentage % 90% 90% 90% 90% 90% 90% 90% 90% 90% 90% 90% 90%Total Cost Recovery Subject to Sharing $ (186,197) 1,450,246 1,470,003 1,564,985 1,591,649 2,092,523 1,290,481 1,051,779 1,855,534 2,556,550 2,772,788 2,741,325 20,251,666
Total Power Cost Deferral with Adjustments $ (186,197) 1,450,246 1,470,003 1,564,985 1,591,649 2,092,523 1,290,481 1,051,779 1,855,534 2,556,550 2,772,788 2,741,325 20,251,666
AVU-E-19-04
2020-2021 ID PCA - Brandon Workpapers Updated and Act-Auth- Proposed Page: 1 of 2
ID PCA July 2020
2 of 23
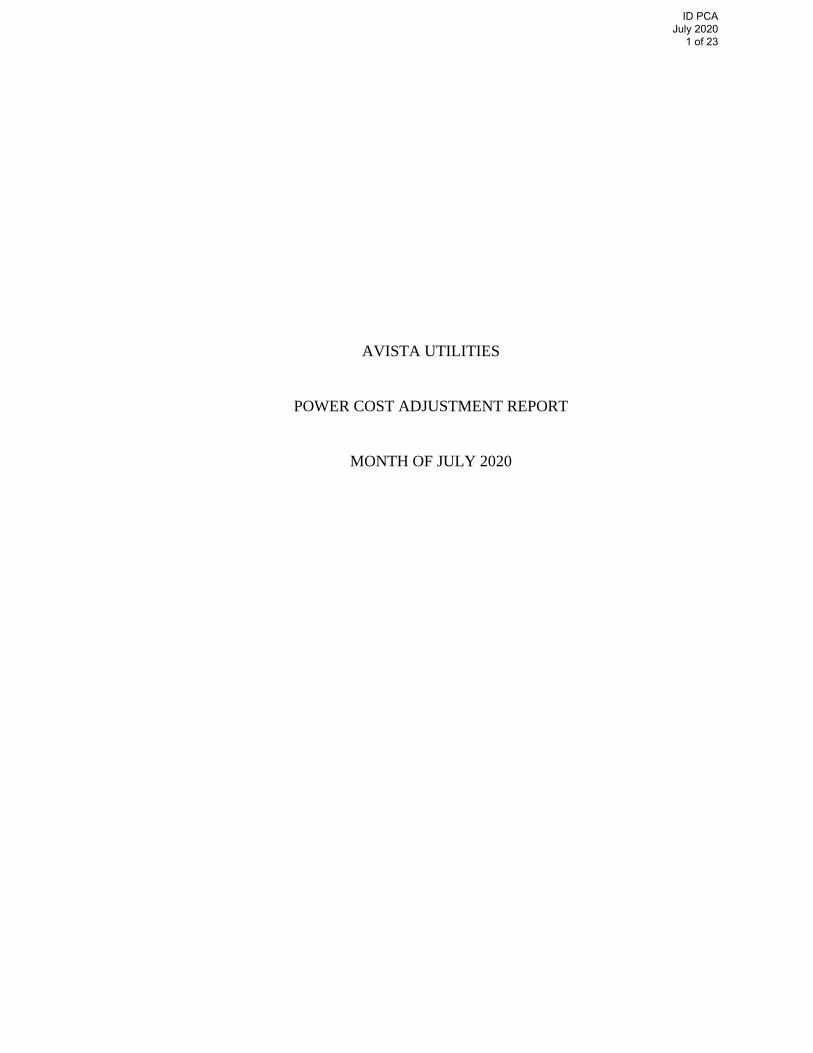
Jul-20 thruPCA Deferral Balance Jul-20 Aug-20 Sep-20 Oct-20 Nov-20 Dec-20 Jan-21 Feb-21 Mar-21 Apr-21 May-21 Jun-21 Jun-21Monthly Interest Rate % 0.1667% 0.1667% 0.1667% 0.1667% 0.1667% 0.1667% 0.1667% 0.1667% 0.1667% 0.1667% 0.1667% 0.1667%
PCA Ending BalancesBeginning Balance (June 2020 Ending Balance) $ 46,080 46,080
2019-2020 Deferral Balance $ 46,080 (450,302) 999,194 2,470,163 4,039,266 5,637,648 7,739,569 9,042,952 10,109,806 11,982,193 14,558,717 17,355,774 17,355,7742020-2021 Incremental Deferral $ (186,197) 1,450,246 1,470,003 1,564,985 1,591,649 2,092,523 1,290,481 1,051,779 1,855,534 2,556,550 2,772,788 2,741,325 20,251,666RPS Compliance Adjustment* $ (446,075) (446,075)Amortization - Account 182385 $ 135,813 135,813Amortization - Account 182386 $ 0Amortization - Projected $ 0
2020-21 Ending Deferral Balance w/out Current Month Int. $ (450,379) 999,944 2,469,197 4,035,148 5,630,915 7,730,171 9,030,050 10,094,731 11,965,340 14,538,743 17,331,505 20,097,099 20,097,099Interest $ 77 (750) 966 4,118 6,733 9,398 12,902 15,075 16,853 19,974 24,269 28,932 138,547
2020-21 Final Ending Deferral Balance $ (450,302) 999,194 2,470,163 4,039,266 5,637,648 7,739,569 9,042,952 10,109,806 11,982,193 14,558,717 17,355,774 20,126,031 20,126,031
* See page 17 of the July 2020 Power Cost Adjustment Report for more information.
2020-2021 ID PCA - Brandon Workpapers Updated and Act-Auth- Proposed Page: 2 of 2
ID PCA July 2020
3 of 23
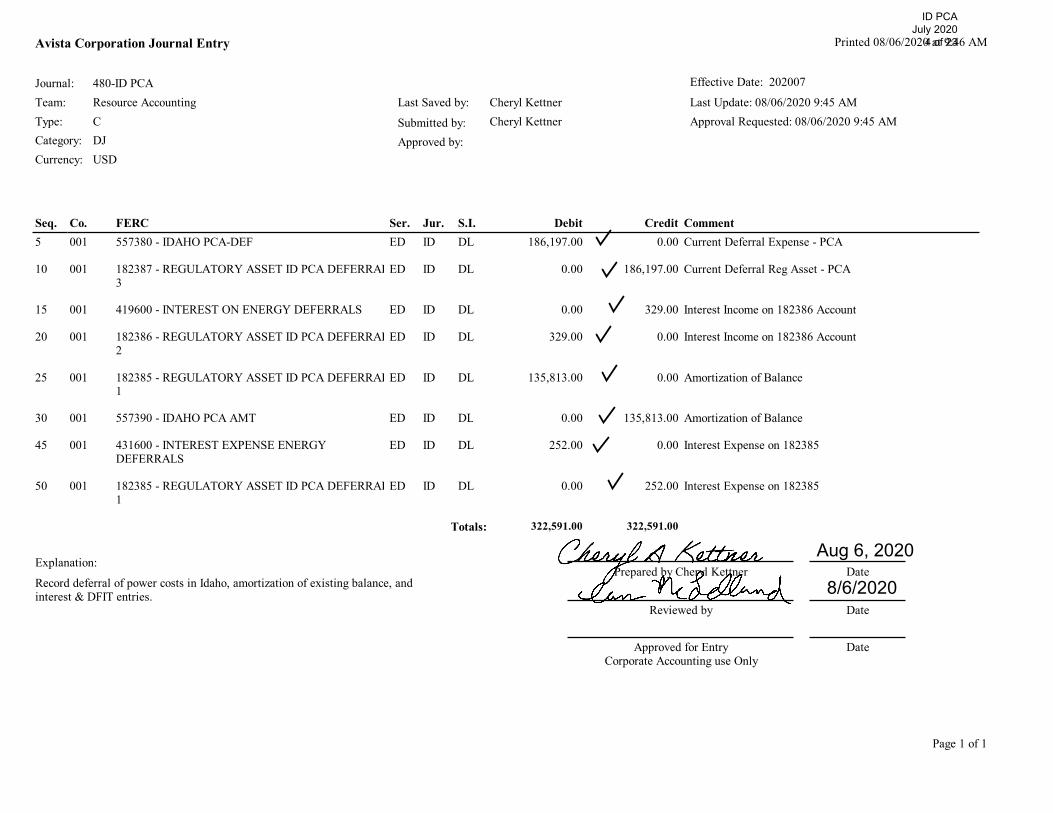
Explanation:
Record deferral of power costs in Idaho, amortization of existing balance, and interest & DFIT entries.
Seq. Co. FERC Ser. Jur. S.I. Debit Credit Comment5 001 557380 - IDAHO PCA-DEF ED ID DL 186,197.00 0.00 Current Deferral Expense - PCA
10 001 182387 - REGULATORY ASSET ID PCA DEFERRAL3
ED ID DL 0.00 186,197.00 Current Deferral Reg Asset - PCA
15 001 419600 - INTEREST ON ENERGY DEFERRALS ED ID DL 0.00 329.00 Interest Income on 182386 Account
20 001 182386 - REGULATORY ASSET ID PCA DEFERRAL2
ED ID DL 329.00 0.00 Interest Income on 182386 Account
25 001 182385 - REGULATORY ASSET ID PCA DEFERRAL1
ED ID DL 135,813.00 0.00 Amortization of Balance
30 001 557390 - IDAHO PCA AMT ED ID DL 0.00 135,813.00 Amortization of Balance
45 001 431600 - INTEREST EXPENSE ENERGY DEFERRALS
ED ID DL 252.00 0.00 Interest Expense on 182385
50 001 182385 - REGULATORY ASSET ID PCA DEFERRAL1
ED ID DL 0.00 252.00 Interest Expense on 182385
Totals: 322,591.00 322,591.00
Prepared by Cheryl Kettner
Reviewed by
Approved for EntryCorporate Accounting use Only
Date
Date
Date
Page 1 of 1
Avista Corporation Journal Entry
Journal:Team:Type:Category:Currency:
480-ID PCALast Saved by:
Submitted by:Approved by:
Cheryl KettnerCheryl Kettner
Printed 08/06/2020 at 9:46 AM
Last Update: 08/06/2020 9:45 AMApproval Requested: 08/06/2020 9:45 AM
Resource AccountingCDJUSD
Effective Date: 202007
Aug 6, 2020
8/6/2020
ID PCA July 2020
4 of 23
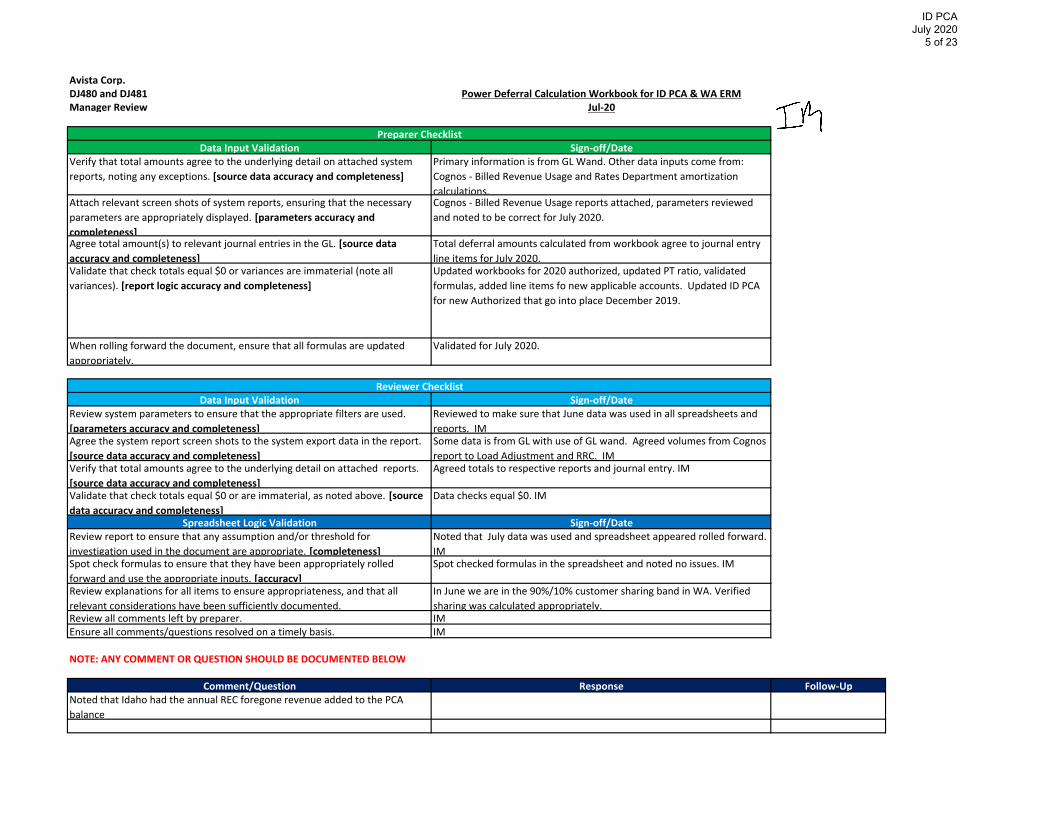
Avista Corp.DJ480 and DJ481 Power Deferral Calculation Workbook for ID PCA & WA ERMManager Review Jul‐20
Data Input Validation Sign‐off/DateVerify that total amounts agree to the underlying detail on attached system reports, noting any exceptions. [source data accuracy and completeness]
Primary information is from GL Wand. Other data inputs come from: Cognos ‐ Billed Revenue Usage and Rates Department amortization calculations.
Attach relevant screen shots of system reports, ensuring that the necessary parameters are appropriately displayed. [parameters accuracy and completeness]
Cognos ‐ Billed Revenue Usage reports attached, parameters reviewed and noted to be correct for July 2020.
Agree total amount(s) to relevant journal entries in the GL. [source data accuracy and completeness]
Total deferral amounts calculated from workbook agree to journal entry line items for July 2020.
Validate that check totals equal $0 or variances are immaterial (note all variances). [report logic accuracy and completeness]
Updated workbooks for 2020 authorized, updated PT ratio, validated formulas, added line items fo new applicable accounts. Updated ID PCA for new Authorized that go into place December 2019.
When rolling forward the document, ensure that all formulas are updated appropriately.
Validated for July 2020.
Data Input Validation Sign‐off/DateReview system parameters to ensure that the appropriate filters are used. [parameters accuracy and completeness]
Reviewed to make sure that June data was used in all spreadsheets and reports. IM
Agree the system report screen shots to the system export data in the report. [source data accuracy and completeness]
Some data is from GL with use of GL wand. Agreed volumes from Cognos report to Load Adjustment and RRC. IM
Verify that total amounts agree to the underlying detail on attached reports. [source data accuracy and completeness]
Agreed totals to respective reports and journal entry. IM
Validate that check totals equal $0 or are immaterial, as noted above. [source data accuracy and completeness]
Data checks equal $0. IM
Spreadsheet Logic Validation Sign‐off/DateReview report to ensure that any assumption and/or threshold for investigation used in the document are appropriate. [completeness]
Noted that July data was used and spreadsheet appeared rolled forward. IM
Spot check formulas to ensure that they have been appropriately rolled forward and use the appropriate inputs. [accuracy]
Spot checked formulas in the spreadsheet and noted no issues. IM
Review explanations for all items to ensure appropriateness, and that all relevant considerations have been sufficiently documented.
In June we are in the 90%/10% customer sharing band in WA. Verified sharing was calculated appropriately.
Review all comments left by preparer. IMEnsure all comments/questions resolved on a timely basis. IM
NOTE: ANY COMMENT OR QUESTION SHOULD BE DOCUMENTED BELOW
Comment/Question Response Follow‐UpNoted that Idaho had the annual REC foregone revenue added to the PCA balance
Preparer Checklist
Reviewer Checklist
ID PCA July 2020
5 of 23
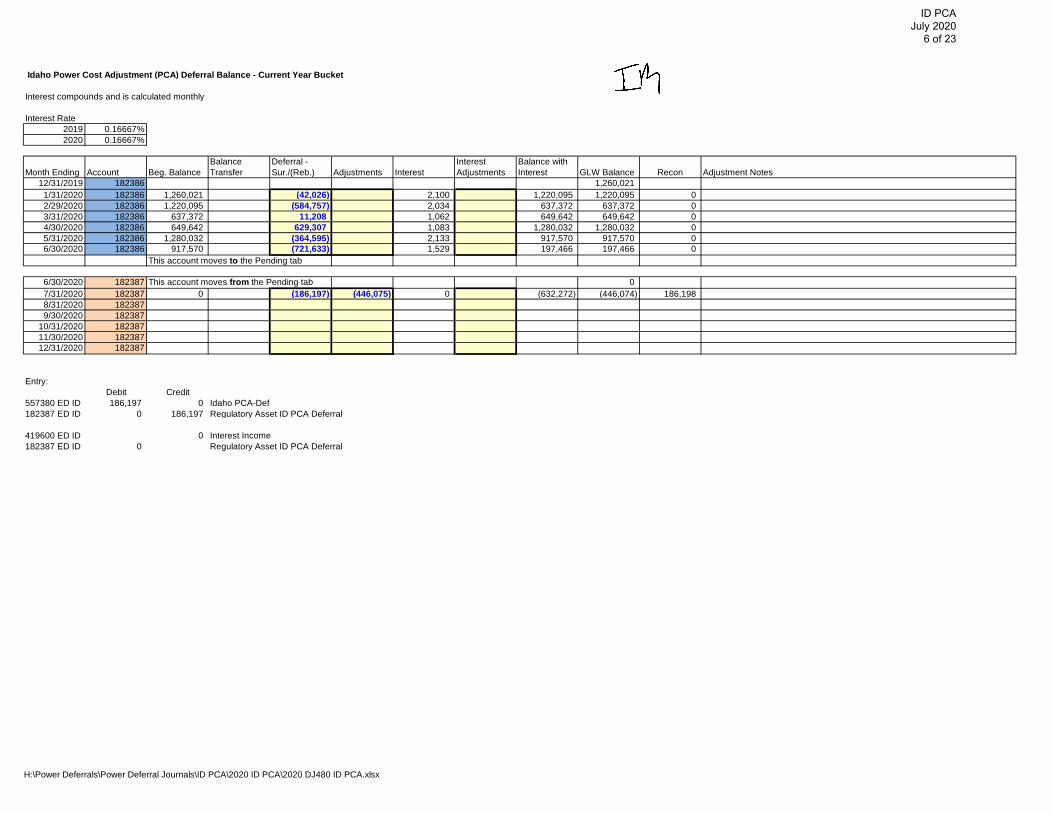
Idaho Power Cost Adjustment (PCA) Deferral Balance - Current Year Bucket
Interest compounds and is calculated monthly
Interest Rate2019 0.16667%2020 0.16667%
Month Ending Account Beg. BalanceBalance Transfer
Deferral - Sur./(Reb.) Adjustments Interest
Interest Adjustments
Balance with Interest GLW Balance Recon Adjustment Notes
12/31/2019 182386 1,260,0211/31/2020 182386 1,260,021 (42,026) 2,100 1,220,095 1,220,095 02/29/2020 182386 1,220,095 (584,757) 2,034 637,372 637,372 03/31/2020 182386 637,372 11,208 1,062 649,642 649,642 04/30/2020 182386 649,642 629,307 1,083 1,280,032 1,280,032 05/31/2020 182386 1,280,032 (364,595) 2,133 917,570 917,570 06/30/2020 182386 917,570 (721,633) 1,529 197,466 197,466 0
6/30/2020 182387 07/31/2020 182387 0 (186,197) (446,075) 0 (632,272) (446,074) 186,1988/31/2020 1823879/30/2020 182387
10/31/2020 18238711/30/2020 18238712/31/2020 182387
Entry:Debit Credit
557380 ED ID 186,197 0 Idaho PCA-Def182387 ED ID 0 186,197 Regulatory Asset ID PCA Deferral
419600 ED ID 0 Interest Income182387 ED ID 0 Regulatory Asset ID PCA Deferral
This account moves to the Pending tab
This account moves from the Pending tab
H:\Power Deferrals\Power Deferral Journals\ID PCA\2020 ID PCA\2020 DJ480 ID PCA.xlsx
ID PCA July 2020
6 of 23

Idaho Power Cost Adjustment (PCA) Deferral Balance - Pending Bucket
Interest compounds and is calculated monthly
Interest Rate2019 0.16667%2020 0.16667%
Month Ending Account Beg. BalanceBalance Transfer Activity Adjustments Interest
Interest Adjustments
Balance with Interest GLW Balance Recon Adjustment Notes
12/31/2019 182387 01/31/2020 182387 0 0 0 0 02/29/2020 182387 0 0 0 0 03/31/2020 182387 0 0 0 0 04/30/2020 182387 0 0 0 0 05/31/2020 182387 0 0 0 0 06/30/2020 182387 0 0 0 0 0
6/30/2020 182386 197,4667/31/2020 182386 197,466 329 197,795 197,466 (329)8/31/2020 1823869/30/2020 182386
10/31/2020 182386
10/31/2020 18238511/30/2020 18238512/31/2020 182385
Entry:Debit Credit
419600 ED ID 0 329 Interest Income182386 ED ID 329 0 Regulatory Asset ID PCA Deferral
This account moves to the Current Year tab
This account moves from the Current Year tab
This account moves to the Amortizing tab
This account moves from the Amortizing tab
H:\Power Deferrals\Power Deferral Journals\ID PCA\2020 ID PCA\2020 DJ480 ID PCA.xlsx
ID PCA July 2020
7 of 23
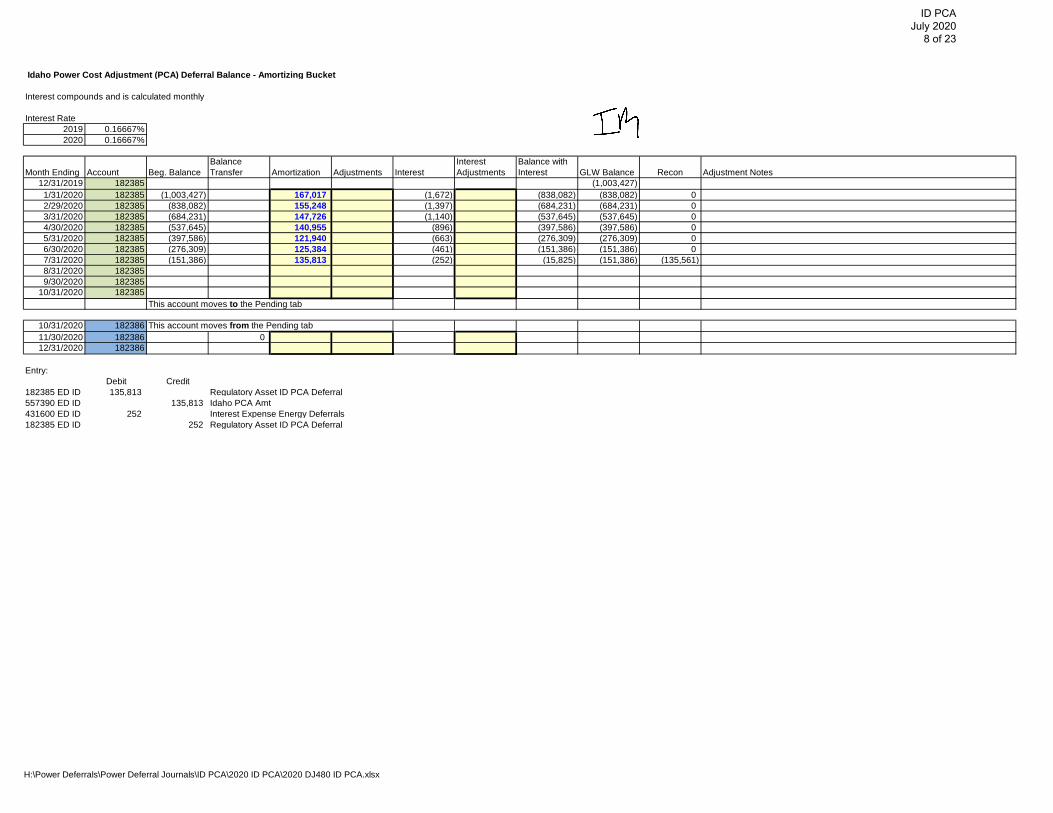
Idaho Power Cost Adjustment (PCA) Deferral Balance - Amortizing Bucket
Interest compounds and is calculated monthly
Interest Rate2019 0.16667%2020 0.16667%
Month Ending Account Beg. BalanceBalance Transfer Amortization Adjustments Interest
Interest Adjustments
Balance with Interest GLW Balance Recon Adjustment Notes
12/31/2019 182385 (1,003,427)1/31/2020 182385 (1,003,427) 167,017 (1,672) (838,082) (838,082) 02/29/2020 182385 (838,082) 155,248 (1,397) (684,231) (684,231) 03/31/2020 182385 (684,231) 147,726 (1,140) (537,645) (537,645) 04/30/2020 182385 (537,645) 140,955 (896) (397,586) (397,586) 05/31/2020 182385 (397,586) 121,940 (663) (276,309) (276,309) 06/30/2020 182385 (276,309) 125,384 (461) (151,386) (151,386) 07/31/2020 182385 (151,386) 135,813 (252) (15,825) (151,386) (135,561)8/31/2020 1823859/30/2020 182385
10/31/2020 182385
10/31/2020 18238611/30/2020 182386 012/31/2020 182386
Entry:Debit Credit
182385 ED ID 135,813 Regulatory Asset ID PCA Deferral557390 ED ID 135,813 Idaho PCA Amt431600 ED ID 252 Interest Expense Energy Deferrals182385 ED ID 252 Regulatory Asset ID PCA Deferral
This account moves to the Pending tab
This account moves from the Pending tab
H:\Power Deferrals\Power Deferral Journals\ID PCA\2020 ID PCA\2020 DJ480 ID PCA.xlsx
ID PCA July 2020
8 of 23
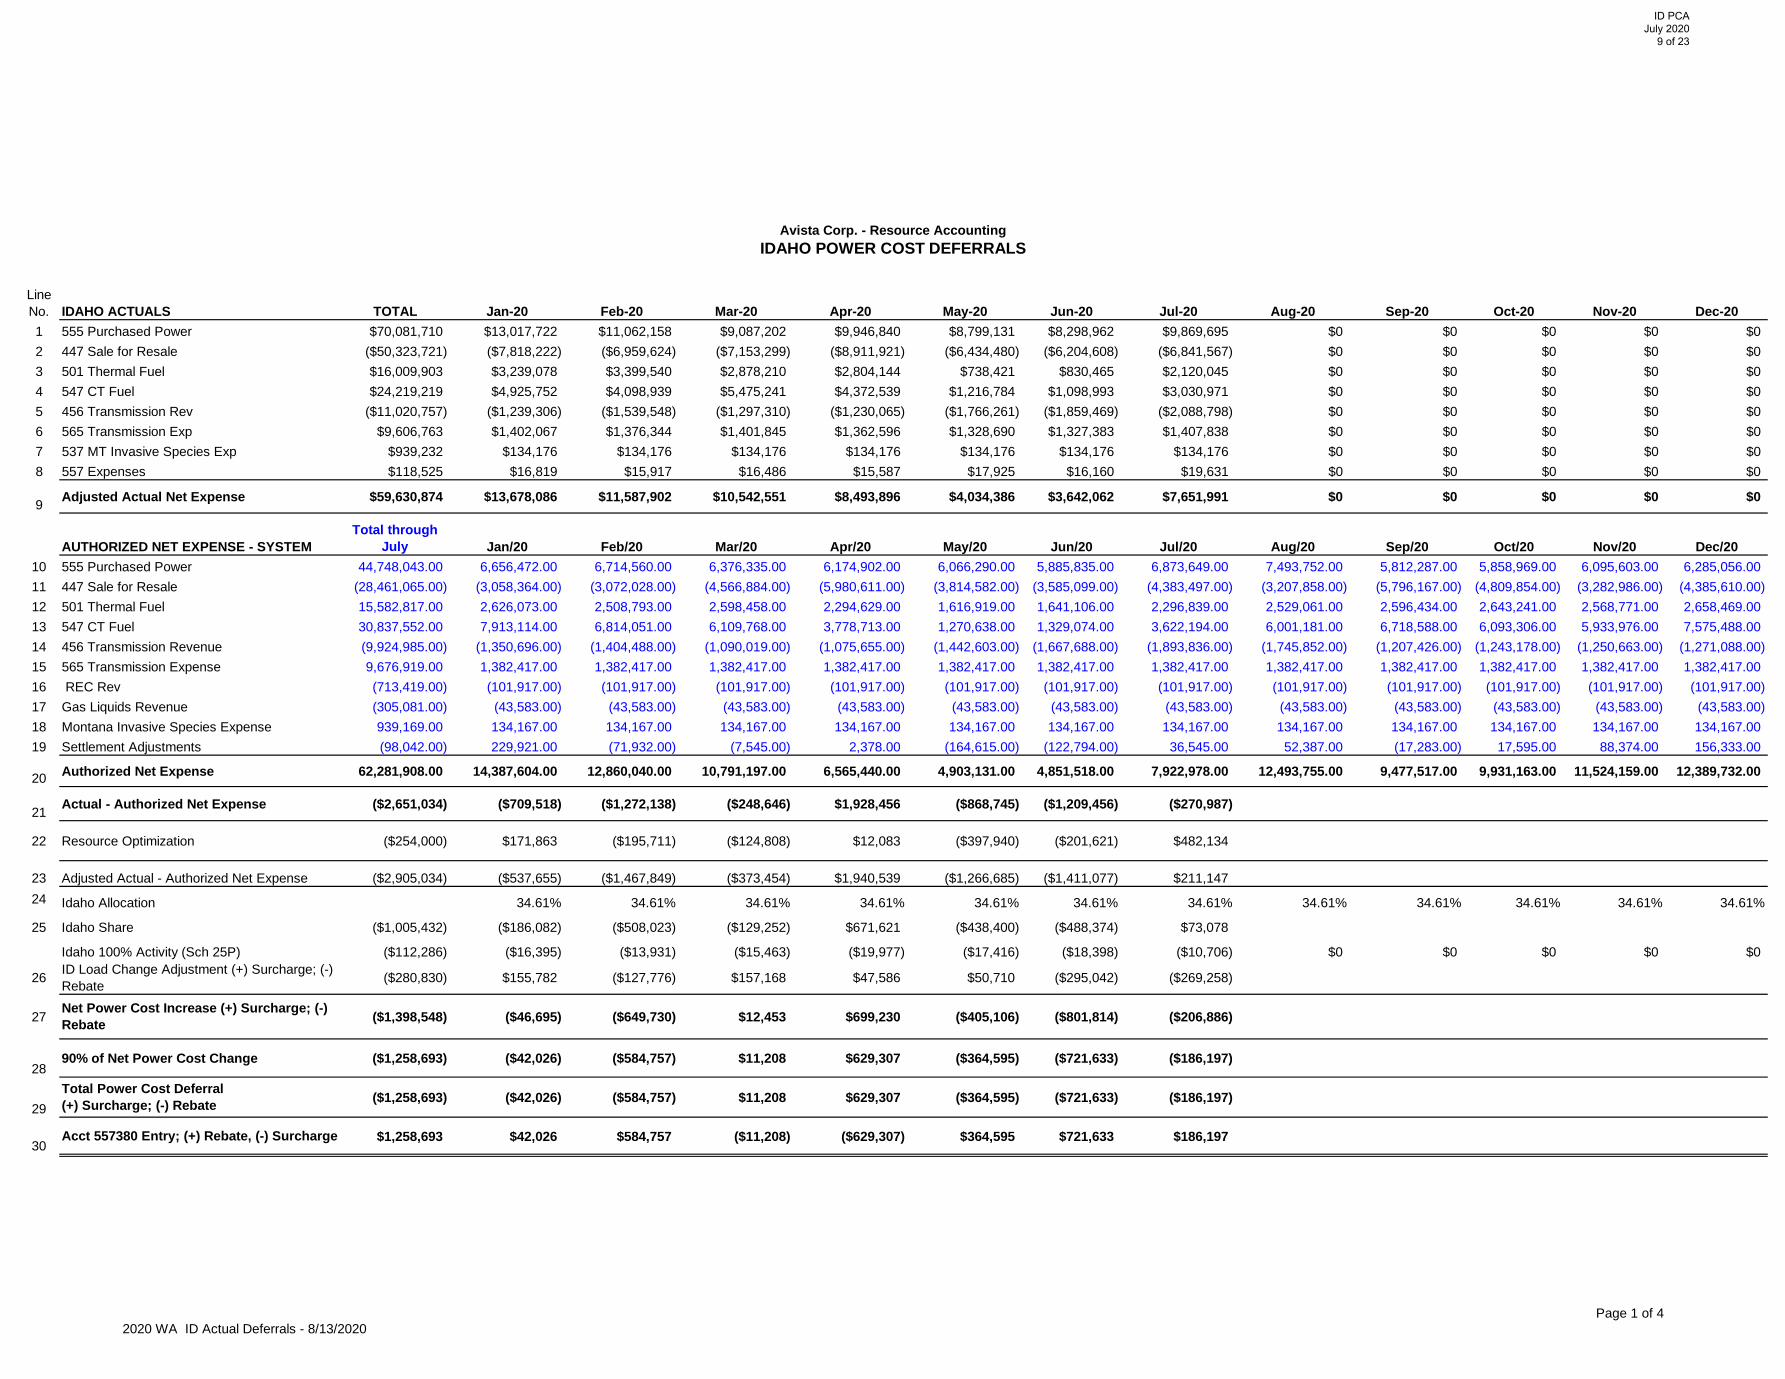
LineNo. IDAHO ACTUALS TOTAL Jan-20 Feb-20 Mar-20 Apr-20 May-20 Jun-20 Jul-20 Aug-20 Sep-20 Oct-20 Nov-20 Dec-201 555 Purchased Power $70,081,710 $13,017,722 $11,062,158 $9,087,202 $9,946,840 $8,799,131 $8,298,962 $9,869,695 $0 $0 $0 $0 $02 447 Sale for Resale ($50,323,721) ($7,818,222) ($6,959,624) ($7,153,299) ($8,911,921) ($6,434,480) ($6,204,608) ($6,841,567) $0 $0 $0 $0 $03 501 Thermal Fuel $16,009,903 $3,239,078 $3,399,540 $2,878,210 $2,804,144 $738,421 $830,465 $2,120,045 $0 $0 $0 $0 $04 547 CT Fuel $24,219,219 $4,925,752 $4,098,939 $5,475,241 $4,372,539 $1,216,784 $1,098,993 $3,030,971 $0 $0 $0 $0 $05 456 Transmission Rev ($11,020,757) ($1,239,306) ($1,539,548) ($1,297,310) ($1,230,065) ($1,766,261) ($1,859,469) ($2,088,798) $0 $0 $0 $0 $06 565 Transmission Exp $9,606,763 $1,402,067 $1,376,344 $1,401,845 $1,362,596 $1,328,690 $1,327,383 $1,407,838 $0 $0 $0 $0 $07 537 MT Invasive Species Exp $939,232 $134,176 $134,176 $134,176 $134,176 $134,176 $134,176 $134,176 $0 $0 $0 $0 $08 557 Expenses $118,525 $16,819 $15,917 $16,486 $15,587 $17,925 $16,160 $19,631 $0 $0 $0 $0 $0
9 Adjusted Actual Net Expense $59,630,874 $13,678,086 $11,587,902 $10,542,551 $8,493,896 $4,034,386 $3,642,062 $7,651,991 $0 $0 $0 $0 $0
AUTHORIZED NET EXPENSE - SYSTEMTotal through
July Jan/20 Feb/20 Mar/20 Apr/20 May/20 Jun/20 Jul/20 Aug/20 Sep/20 Oct/20 Nov/20 Dec/2010 555 Purchased Power 44,748,043.00 6,656,472.00 6,714,560.00 6,376,335.00 6,174,902.00 6,066,290.00 5,885,835.00 6,873,649.00 7,493,752.00 5,812,287.00 5,858,969.00 6,095,603.00 6,285,056.00 11 447 Sale for Resale (28,461,065.00) (3,058,364.00) (3,072,028.00) (4,566,884.00) (5,980,611.00) (3,814,582.00) (3,585,099.00) (4,383,497.00) (3,207,858.00) (5,796,167.00) (4,809,854.00) (3,282,986.00) (4,385,610.00) 12 501 Thermal Fuel 15,582,817.00 2,626,073.00 2,508,793.00 2,598,458.00 2,294,629.00 1,616,919.00 1,641,106.00 2,296,839.00 2,529,061.00 2,596,434.00 2,643,241.00 2,568,771.00 2,658,469.00 13 547 CT Fuel 30,837,552.00 7,913,114.00 6,814,051.00 6,109,768.00 3,778,713.00 1,270,638.00 1,329,074.00 3,622,194.00 6,001,181.00 6,718,588.00 6,093,306.00 5,933,976.00 7,575,488.00 14 456 Transmission Revenue (9,924,985.00) (1,350,696.00) (1,404,488.00) (1,090,019.00) (1,075,655.00) (1,442,603.00) (1,667,688.00) (1,893,836.00) (1,745,852.00) (1,207,426.00) (1,243,178.00) (1,250,663.00) (1,271,088.00) 15 565 Transmission Expense 9,676,919.00 1,382,417.00 1,382,417.00 1,382,417.00 1,382,417.00 1,382,417.00 1,382,417.00 1,382,417.00 1,382,417.00 1,382,417.00 1,382,417.00 1,382,417.00 1,382,417.00 16 REC Rev (713,419.00) (101,917.00) (101,917.00) (101,917.00) (101,917.00) (101,917.00) (101,917.00) (101,917.00) (101,917.00) (101,917.00) (101,917.00) (101,917.00) (101,917.00) 17 Gas Liquids Revenue (305,081.00) (43,583.00) (43,583.00) (43,583.00) (43,583.00) (43,583.00) (43,583.00) (43,583.00) (43,583.00) (43,583.00) (43,583.00) (43,583.00) (43,583.00) 18 Montana Invasive Species Expense 939,169.00 134,167.00 134,167.00 134,167.00 134,167.00 134,167.00 134,167.00 134,167.00 134,167.00 134,167.00 134,167.00 134,167.00 134,167.00 19 Settlement Adjustments (98,042.00) 229,921.00 (71,932.00) (7,545.00) 2,378.00 (164,615.00) (122,794.00) 36,545.00 52,387.00 (17,283.00) 17,595.00 88,374.00 156,333.00
20 Authorized Net Expense 62,281,908.00 14,387,604.00 12,860,040.00 10,791,197.00 6,565,440.00 4,903,131.00 4,851,518.00 7,922,978.00 12,493,755.00 9,477,517.00 9,931,163.00 11,524,159.00 12,389,732.00
21 Actual - Authorized Net Expense ($2,651,034) ($709,518) ($1,272,138) ($248,646) $1,928,456 ($868,745) ($1,209,456) ($270,987)
22 Resource Optimization ($254,000) $171,863 ($195,711) ($124,808) $12,083 ($397,940) ($201,621) $482,134
23 Adjusted Actual - Authorized Net Expense ($2,905,034) ($537,655) ($1,467,849) ($373,454) $1,940,539 ($1,266,685) ($1,411,077) $211,147 24 Idaho Allocation 34.61% 34.61% 34.61% 34.61% 34.61% 34.61% 34.61% 34.61% 34.61% 34.61% 34.61% 34.61%
25 Idaho Share ($1,005,432) ($186,082) ($508,023) ($129,252) $671,621 ($438,400) ($488,374) $73,078
Idaho 100% Activity (Sch 25P) ($112,286) ($16,395) ($13,931) ($15,463) ($19,977) ($17,416) ($18,398) ($10,706) $0 $0 $0 $0 $0
26 ($280,830) $155,782 ($127,776) $157,168 $47,586 $50,710 ($295,042) ($269,258)
27 ($1,398,548) ($46,695) ($649,730) $12,453 $699,230 ($405,106) ($801,814) ($206,886)
2890% of Net Power Cost Change ($1,258,693) ($42,026) ($584,757) $11,208 $629,307 ($364,595) ($721,633) ($186,197)
29($1,258,693) ($42,026) ($584,757) $11,208 $629,307 ($364,595) ($721,633) ($186,197)
30$1,258,693 $42,026 $584,757 ($11,208) ($629,307) $364,595 $721,633 $186,197 Acct 557380 Entry; (+) Rebate, (-) Surcharge
Avista Corp. - Resource AccountingIDAHO POWER COST DEFERRALS
ID Load Change Adjustment (+) Surcharge; (-) Rebate
Total Power Cost Deferral (+) Surcharge; (-) Rebate
Net Power Cost Increase (+) Surcharge; (-) Rebate
2020 WA ID Actual Deferrals - 8/13/2020Page 1 of 4
ID PCA July 2020
9 of 23
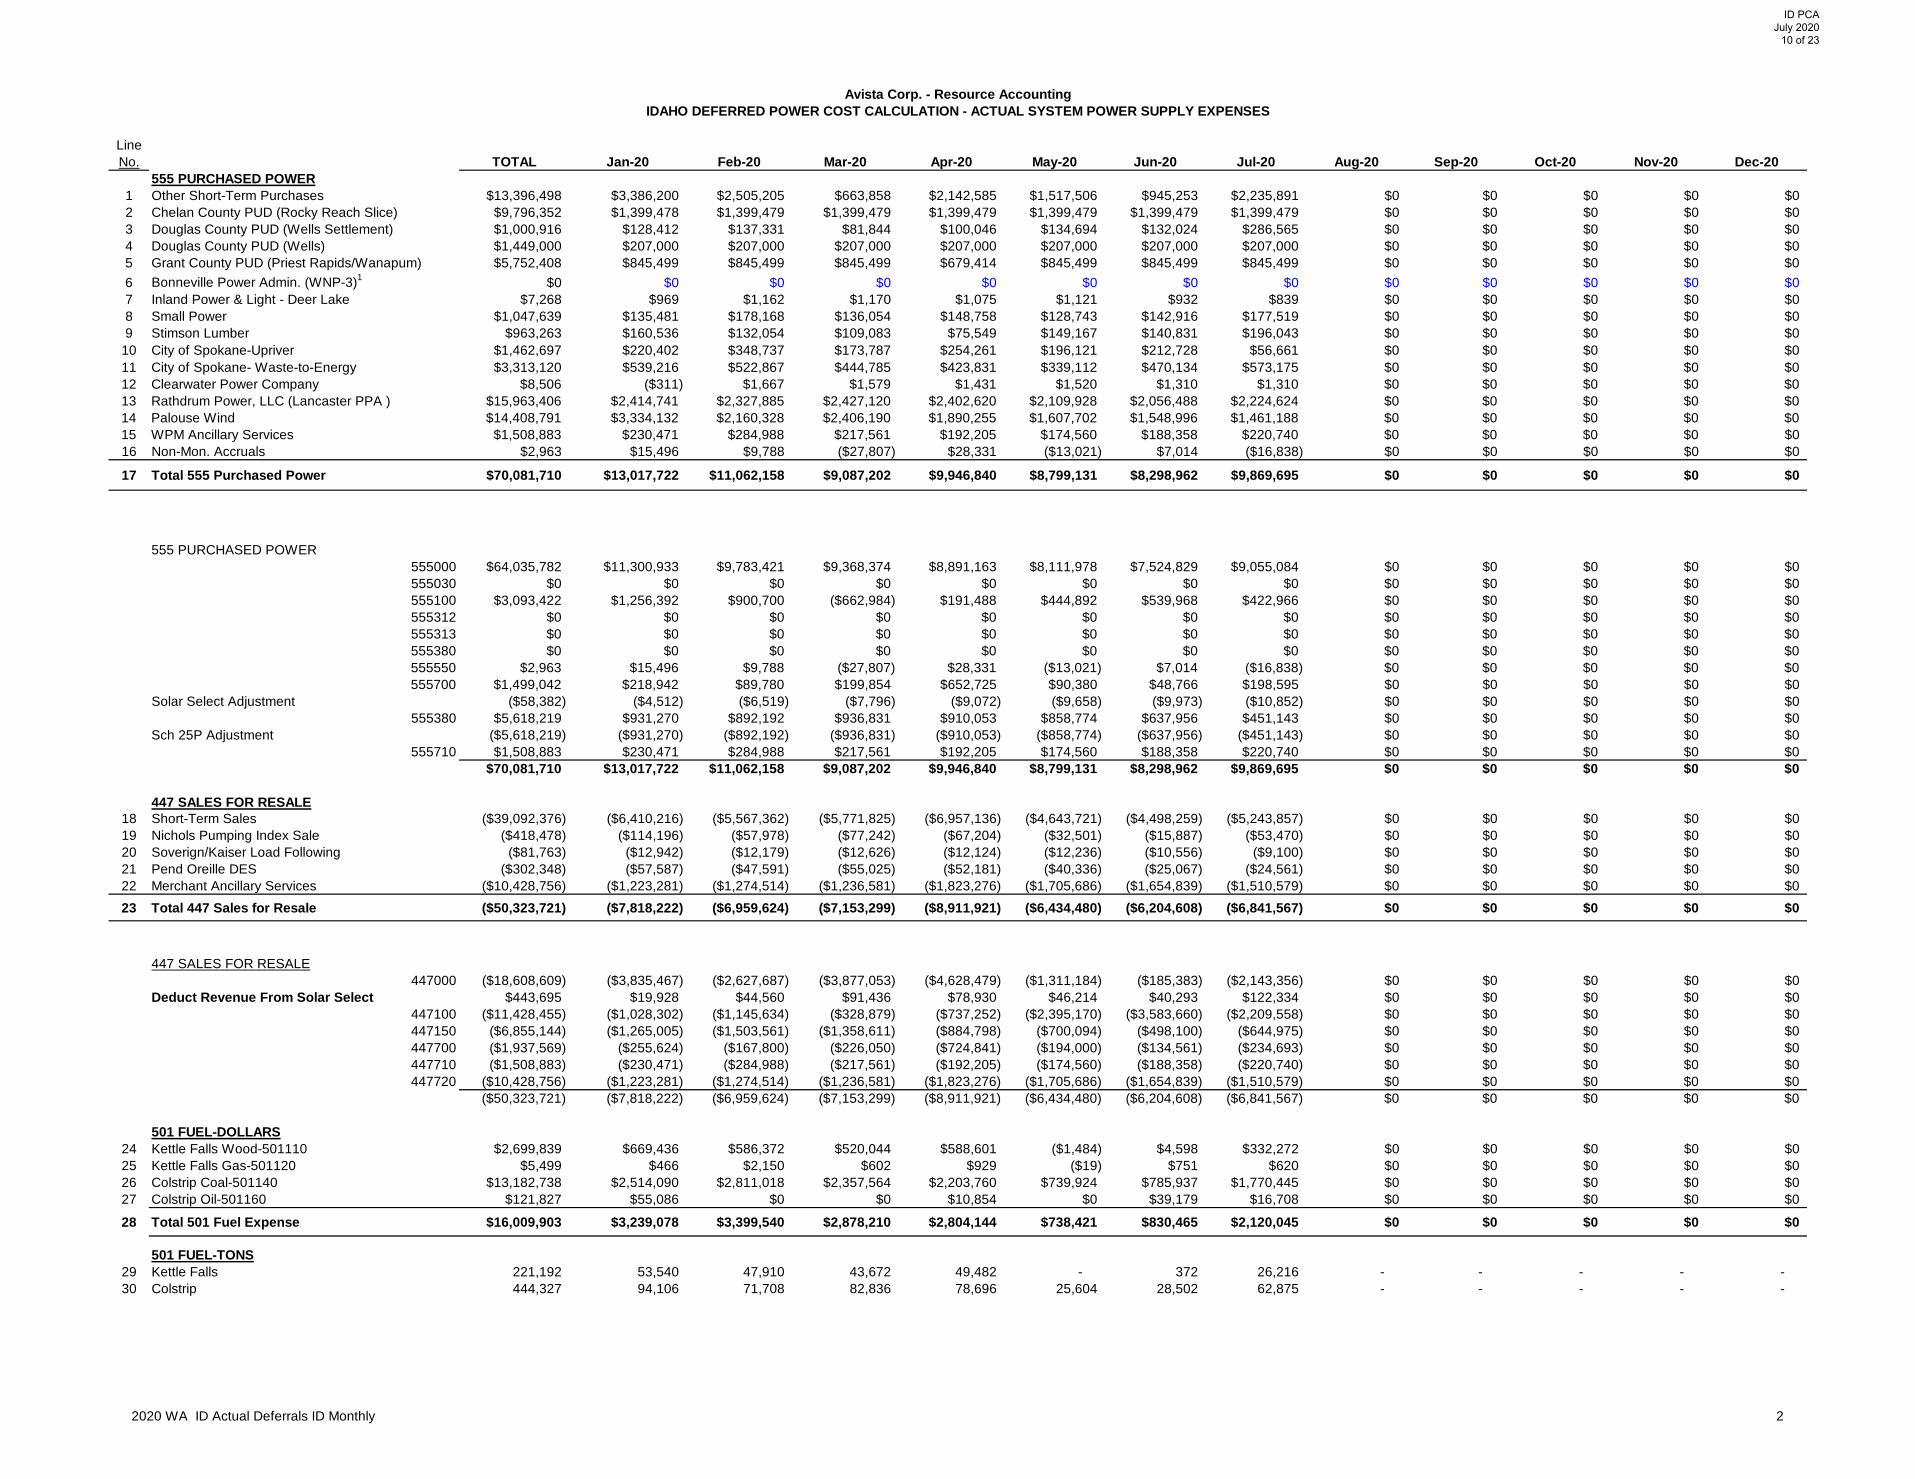
LineNo. TOTAL Jan-20 Feb-20 Mar-20 Apr-20 May-20 Jun-20 Jul-20 Aug-20 Sep-20 Oct-20 Nov-20 Dec-20
555 PURCHASED POWER1 Other Short-Term Purchases $13,396,498 $3,386,200 $2,505,205 $663,858 $2,142,585 $1,517,506 $945,253 $2,235,891 $0 $0 $0 $0 $02 Chelan County PUD (Rocky Reach Slice) $9,796,352 $1,399,478 $1,399,479 $1,399,479 $1,399,479 $1,399,479 $1,399,479 $1,399,479 $0 $0 $0 $0 $03 Douglas County PUD (Wells Settlement) $1,000,916 $128,412 $137,331 $81,844 $100,046 $134,694 $132,024 $286,565 $0 $0 $0 $0 $04 Douglas County PUD (Wells) $1,449,000 $207,000 $207,000 $207,000 $207,000 $207,000 $207,000 $207,000 $0 $0 $0 $0 $05 Grant County PUD (Priest Rapids/Wanapum) $5,752,408 $845,499 $845,499 $845,499 $679,414 $845,499 $845,499 $845,499 $0 $0 $0 $0 $06 Bonneville Power Admin. (WNP-3)1 $0 $0 $0 $0 $0 $0 $0 $0 $0 $0 $0 $0 $07 Inland Power & Light - Deer Lake $7,268 $969 $1,162 $1,170 $1,075 $1,121 $932 $839 $0 $0 $0 $0 $08 Small Power $1,047,639 $135,481 $178,168 $136,054 $148,758 $128,743 $142,916 $177,519 $0 $0 $0 $0 $09 Stimson Lumber $963,263 $160,536 $132,054 $109,083 $75,549 $149,167 $140,831 $196,043 $0 $0 $0 $0 $0
10 City of Spokane-Upriver $1,462,697 $220,402 $348,737 $173,787 $254,261 $196,121 $212,728 $56,661 $0 $0 $0 $0 $011 City of Spokane- Waste-to-Energy $3,313,120 $539,216 $522,867 $444,785 $423,831 $339,112 $470,134 $573,175 $0 $0 $0 $0 $012 Clearwater Power Company $8,506 ($311) $1,667 $1,579 $1,431 $1,520 $1,310 $1,310 $0 $0 $0 $0 $013 Rathdrum Power, LLC (Lancaster PPA ) $15,963,406 $2,414,741 $2,327,885 $2,427,120 $2,402,620 $2,109,928 $2,056,488 $2,224,624 $0 $0 $0 $0 $014 Palouse Wind $14,408,791 $3,334,132 $2,160,328 $2,406,190 $1,890,255 $1,607,702 $1,548,996 $1,461,188 $0 $0 $0 $0 $015 WPM Ancillary Services $1,508,883 $230,471 $284,988 $217,561 $192,205 $174,560 $188,358 $220,740 $0 $0 $0 $0 $016 Non-Mon. Accruals $2,963 $15,496 $9,788 ($27,807) $28,331 ($13,021) $7,014 ($16,838) $0 $0 $0 $0 $0
17 Total 555 Purchased Power $70,081,710 $13,017,722 $11,062,158 $9,087,202 $9,946,840 $8,799,131 $8,298,962 $9,869,695 $0 $0 $0 $0 $0
555 PURCHASED POWER555000 $64,035,782 $11,300,933 $9,783,421 $9,368,374 $8,891,163 $8,111,978 $7,524,829 $9,055,084 $0 $0 $0 $0 $0555030 $0 $0 $0 $0 $0 $0 $0 $0 $0 $0 $0 $0 $0555100 $3,093,422 $1,256,392 $900,700 ($662,984) $191,488 $444,892 $539,968 $422,966 $0 $0 $0 $0 $0555312 $0 $0 $0 $0 $0 $0 $0 $0 $0 $0 $0 $0 $0555313 $0 $0 $0 $0 $0 $0 $0 $0 $0 $0 $0 $0 $0555380 $0 $0 $0 $0 $0 $0 $0 $0 $0 $0 $0 $0 $0555550 $2,963 $15,496 $9,788 ($27,807) $28,331 ($13,021) $7,014 ($16,838) $0 $0 $0 $0 $0555700 $1,499,042 $218,942 $89,780 $199,854 $652,725 $90,380 $48,766 $198,595 $0 $0 $0 $0 $0
Solar Select Adjustment ($58,382) ($4,512) ($6,519) ($7,796) ($9,072) ($9,658) ($9,973) ($10,852) $0 $0 $0 $0 $0555380 $5,618,219 $931,270 $892,192 $936,831 $910,053 $858,774 $637,956 $451,143 $0 $0 $0 $0 $0
Sch 25P Adjustment ($5,618,219) ($931,270) ($892,192) ($936,831) ($910,053) ($858,774) ($637,956) ($451,143) $0 $0 $0 $0 $0555710 $1,508,883 $230,471 $284,988 $217,561 $192,205 $174,560 $188,358 $220,740 $0 $0 $0 $0 $0
$70,081,710 $13,017,722 $11,062,158 $9,087,202 $9,946,840 $8,799,131 $8,298,962 $9,869,695 $0 $0 $0 $0 $0
447 SALES FOR RESALE18 Short-Term Sales ($39,092,376) ($6,410,216) ($5,567,362) ($5,771,825) ($6,957,136) ($4,643,721) ($4,498,259) ($5,243,857) $0 $0 $0 $0 $019 Nichols Pumping Index Sale ($418,478) ($114,196) ($57,978) ($77,242) ($67,204) ($32,501) ($15,887) ($53,470) $0 $0 $0 $0 $020 Soverign/Kaiser Load Following ($81,763) ($12,942) ($12,179) ($12,626) ($12,124) ($12,236) ($10,556) ($9,100) $0 $0 $0 $0 $021 Pend Oreille DES ($302,348) ($57,587) ($47,591) ($55,025) ($52,181) ($40,336) ($25,067) ($24,561) $0 $0 $0 $0 $022 Merchant Ancillary Services ($10,428,756) ($1,223,281) ($1,274,514) ($1,236,581) ($1,823,276) ($1,705,686) ($1,654,839) ($1,510,579) $0 $0 $0 $0 $023 Total 447 Sales for Resale ($50,323,721) ($7,818,222) ($6,959,624) ($7,153,299) ($8,911,921) ($6,434,480) ($6,204,608) ($6,841,567) $0 $0 $0 $0 $0
447 SALES FOR RESALE447000 ($18,608,609) ($3,835,467) ($2,627,687) ($3,877,053) ($4,628,479) ($1,311,184) ($185,383) ($2,143,356) $0 $0 $0 $0 $0
Deduct Revenue From Solar Select $443,695 $19,928 $44,560 $91,436 $78,930 $46,214 $40,293 $122,334 $0 $0 $0 $0 $0447100 ($11,428,455) ($1,028,302) ($1,145,634) ($328,879) ($737,252) ($2,395,170) ($3,583,660) ($2,209,558) $0 $0 $0 $0 $0447150 ($6,855,144) ($1,265,005) ($1,503,561) ($1,358,611) ($884,798) ($700,094) ($498,100) ($644,975) $0 $0 $0 $0 $0447700 ($1,937,569) ($255,624) ($167,800) ($226,050) ($724,841) ($194,000) ($134,561) ($234,693) $0 $0 $0 $0 $0447710 ($1,508,883) ($230,471) ($284,988) ($217,561) ($192,205) ($174,560) ($188,358) ($220,740) $0 $0 $0 $0 $0447720 ($10,428,756) ($1,223,281) ($1,274,514) ($1,236,581) ($1,823,276) ($1,705,686) ($1,654,839) ($1,510,579) $0 $0 $0 $0 $0
($50,323,721) ($7,818,222) ($6,959,624) ($7,153,299) ($8,911,921) ($6,434,480) ($6,204,608) ($6,841,567) $0 $0 $0 $0 $0
501 FUEL-DOLLARS24 Kettle Falls Wood-501110 $2,699,839 $669,436 $586,372 $520,044 $588,601 ($1,484) $4,598 $332,272 $0 $0 $0 $0 $025 Kettle Falls Gas-501120 $5,499 $466 $2,150 $602 $929 ($19) $751 $620 $0 $0 $0 $0 $026 Colstrip Coal-501140 $13,182,738 $2,514,090 $2,811,018 $2,357,564 $2,203,760 $739,924 $785,937 $1,770,445 $0 $0 $0 $0 $027 Colstrip Oil-501160 $121,827 $55,086 $0 $0 $10,854 $0 $39,179 $16,708 $0 $0 $0 $0 $0
28 Total 501 Fuel Expense $16,009,903 $3,239,078 $3,399,540 $2,878,210 $2,804,144 $738,421 $830,465 $2,120,045 $0 $0 $0 $0 $0
501 FUEL-TONS29 Kettle Falls 221,192 53,540 47,910 43,672 49,482 - 372 26,216 - - - - - 30 Colstrip 444,327 94,106 71,708 82,836 78,696 25,604 28,502 62,875 - - - - -
Avista Corp. - Resource AccountingIDAHO DEFERRED POWER COST CALCULATION - ACTUAL SYSTEM POWER SUPPLY EXPENSES
2020 WA ID Actual Deferrals ID Monthly 2
ID PCA July 2020
10 of 23
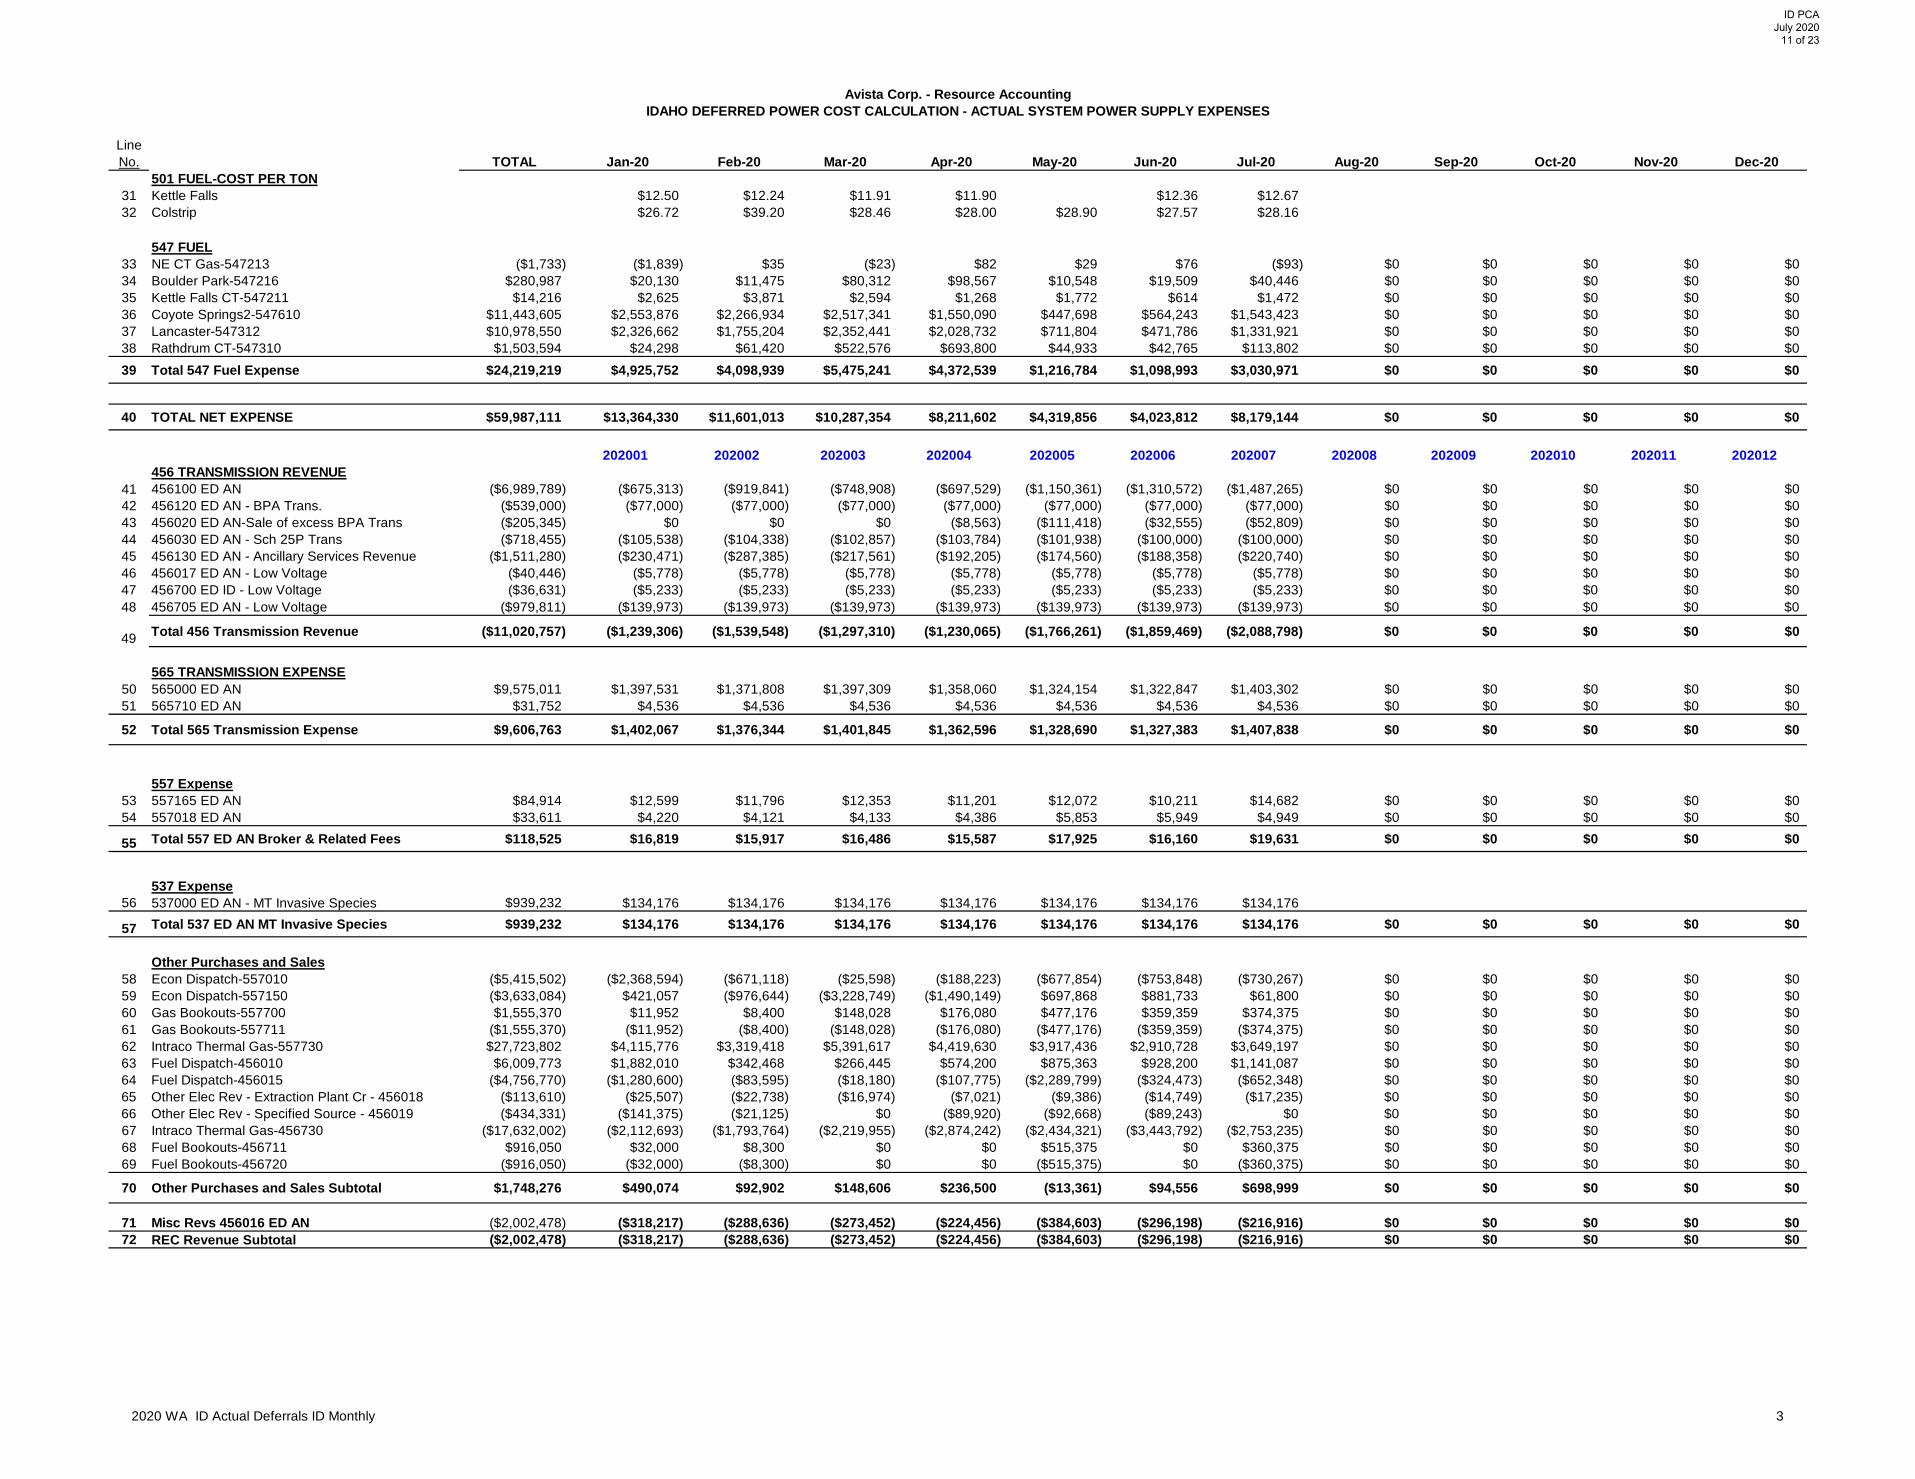
LineNo. TOTAL Jan-20 Feb-20 Mar-20 Apr-20 May-20 Jun-20 Jul-20 Aug-20 Sep-20 Oct-20 Nov-20 Dec-20
Avista Corp. - Resource AccountingIDAHO DEFERRED POWER COST CALCULATION - ACTUAL SYSTEM POWER SUPPLY EXPENSES
501 FUEL-COST PER TON31 Kettle Falls $12.50 $12.24 $11.91 $11.90 $12.36 $12.67 32 Colstrip $26.72 $39.20 $28.46 $28.00 $28.90 $27.57 $28.16
547 FUEL33 NE CT Gas-547213 ($1,733) ($1,839) $35 ($23) $82 $29 $76 ($93) $0 $0 $0 $0 $034 Boulder Park-547216 $280,987 $20,130 $11,475 $80,312 $98,567 $10,548 $19,509 $40,446 $0 $0 $0 $0 $035 Kettle Falls CT-547211 $14,216 $2,625 $3,871 $2,594 $1,268 $1,772 $614 $1,472 $0 $0 $0 $0 $036 Coyote Springs2-547610 $11,443,605 $2,553,876 $2,266,934 $2,517,341 $1,550,090 $447,698 $564,243 $1,543,423 $0 $0 $0 $0 $037 Lancaster-547312 $10,978,550 $2,326,662 $1,755,204 $2,352,441 $2,028,732 $711,804 $471,786 $1,331,921 $0 $0 $0 $0 $038 Rathdrum CT-547310 $1,503,594 $24,298 $61,420 $522,576 $693,800 $44,933 $42,765 $113,802 $0 $0 $0 $0 $039 Total 547 Fuel Expense $24,219,219 $4,925,752 $4,098,939 $5,475,241 $4,372,539 $1,216,784 $1,098,993 $3,030,971 $0 $0 $0 $0 $0
40 TOTAL NET EXPENSE $59,987,111 $13,364,330 $11,601,013 $10,287,354 $8,211,602 $4,319,856 $4,023,812 $8,179,144 $0 $0 $0 $0 $0
202001 202002 202003 202004 202005 202006 202007 202008 202009 202010 202011 202012456 TRANSMISSION REVENUE
41 456100 ED AN ($6,989,789) ($675,313) ($919,841) ($748,908) ($697,529) ($1,150,361) ($1,310,572) ($1,487,265) $0 $0 $0 $0 $042 456120 ED AN - BPA Trans. ($539,000) ($77,000) ($77,000) ($77,000) ($77,000) ($77,000) ($77,000) ($77,000) $0 $0 $0 $0 $043 456020 ED AN-Sale of excess BPA Trans ($205,345) $0 $0 $0 ($8,563) ($111,418) ($32,555) ($52,809) $0 $0 $0 $0 $044 456030 ED AN - Sch 25P Trans ($718,455) ($105,538) ($104,338) ($102,857) ($103,784) ($101,938) ($100,000) ($100,000) $0 $0 $0 $0 $045 456130 ED AN - Ancillary Services Revenue ($1,511,280) ($230,471) ($287,385) ($217,561) ($192,205) ($174,560) ($188,358) ($220,740) $0 $0 $0 $0 $046 456017 ED AN - Low Voltage ($40,446) ($5,778) ($5,778) ($5,778) ($5,778) ($5,778) ($5,778) ($5,778) $0 $0 $0 $0 $047 456700 ED ID - Low Voltage ($36,631) ($5,233) ($5,233) ($5,233) ($5,233) ($5,233) ($5,233) ($5,233) $0 $0 $0 $0 $048 456705 ED AN - Low Voltage ($979,811) ($139,973) ($139,973) ($139,973) ($139,973) ($139,973) ($139,973) ($139,973) $0 $0 $0 $0 $0
49 Total 456 Transmission Revenue ($11,020,757) ($1,239,306) ($1,539,548) ($1,297,310) ($1,230,065) ($1,766,261) ($1,859,469) ($2,088,798) $0 $0 $0 $0 $0
565 TRANSMISSION EXPENSE50 565000 ED AN $9,575,011 $1,397,531 $1,371,808 $1,397,309 $1,358,060 $1,324,154 $1,322,847 $1,403,302 $0 $0 $0 $0 $051 565710 ED AN $31,752 $4,536 $4,536 $4,536 $4,536 $4,536 $4,536 $4,536 $0 $0 $0 $0 $0
52 Total 565 Transmission Expense $9,606,763 $1,402,067 $1,376,344 $1,401,845 $1,362,596 $1,328,690 $1,327,383 $1,407,838 $0 $0 $0 $0 $0
557 Expense53 557165 ED AN $84,914 $12,599 $11,796 $12,353 $11,201 $12,072 $10,211 $14,682 $0 $0 $0 $0 $054 557018 ED AN $33,611 $4,220 $4,121 $4,133 $4,386 $5,853 $5,949 $4,949 $0 $0 $0 $0 $0
55 Total 557 ED AN Broker & Related Fees $118,525 $16,819 $15,917 $16,486 $15,587 $17,925 $16,160 $19,631 $0 $0 $0 $0 $0
537 Expense56 537000 ED AN - MT Invasive Species $939,232 $134,176 $134,176 $134,176 $134,176 $134,176 $134,176 $134,176
57 Total 537 ED AN MT Invasive Species $939,232 $134,176 $134,176 $134,176 $134,176 $134,176 $134,176 $134,176 $0 $0 $0 $0 $0
Other Purchases and Sales58 Econ Dispatch-557010 ($5,415,502) ($2,368,594) ($671,118) ($25,598) ($188,223) ($677,854) ($753,848) ($730,267) $0 $0 $0 $0 $059 Econ Dispatch-557150 ($3,633,084) $421,057 ($976,644) ($3,228,749) ($1,490,149) $697,868 $881,733 $61,800 $0 $0 $0 $0 $060 Gas Bookouts-557700 $1,555,370 $11,952 $8,400 $148,028 $176,080 $477,176 $359,359 $374,375 $0 $0 $0 $0 $061 Gas Bookouts-557711 ($1,555,370) ($11,952) ($8,400) ($148,028) ($176,080) ($477,176) ($359,359) ($374,375) $0 $0 $0 $0 $062 Intraco Thermal Gas-557730 $27,723,802 $4,115,776 $3,319,418 $5,391,617 $4,419,630 $3,917,436 $2,910,728 $3,649,197 $0 $0 $0 $0 $063 Fuel Dispatch-456010 $6,009,773 $1,882,010 $342,468 $266,445 $574,200 $875,363 $928,200 $1,141,087 $0 $0 $0 $0 $064 Fuel Dispatch-456015 ($4,756,770) ($1,280,600) ($83,595) ($18,180) ($107,775) ($2,289,799) ($324,473) ($652,348) $0 $0 $0 $0 $065 Other Elec Rev - Extraction Plant Cr - 456018 ($113,610) ($25,507) ($22,738) ($16,974) ($7,021) ($9,386) ($14,749) ($17,235) $0 $0 $0 $0 $066 Other Elec Rev - Specified Source - 456019 ($434,331) ($141,375) ($21,125) $0 ($89,920) ($92,668) ($89,243) $0 $0 $0 $0 $0 $067 Intraco Thermal Gas-456730 ($17,632,002) ($2,112,693) ($1,793,764) ($2,219,955) ($2,874,242) ($2,434,321) ($3,443,792) ($2,753,235) $0 $0 $0 $0 $068 Fuel Bookouts-456711 $916,050 $32,000 $8,300 $0 $0 $515,375 $0 $360,375 $0 $0 $0 $0 $069 Fuel Bookouts-456720 ($916,050) ($32,000) ($8,300) $0 $0 ($515,375) $0 ($360,375) $0 $0 $0 $0 $0
70 Other Purchases and Sales Subtotal $1,748,276 $490,074 $92,902 $148,606 $236,500 ($13,361) $94,556 $698,999 $0 $0 $0 $0 $0
71 Misc Revs 456016 ED AN ($2,002,478) ($318,217) ($288,636) ($273,452) ($224,456) ($384,603) ($296,198) ($216,916) $0 $0 $0 $0 $072 REC Revenue Subtotal ($2,002,478) ($318,217) ($288,636) ($273,452) ($224,456) ($384,603) ($296,198) ($216,916) $0 $0 $0 $0 $0
2020 WA ID Actual Deferrals ID Monthly 3
ID PCA July 2020
11 of 23
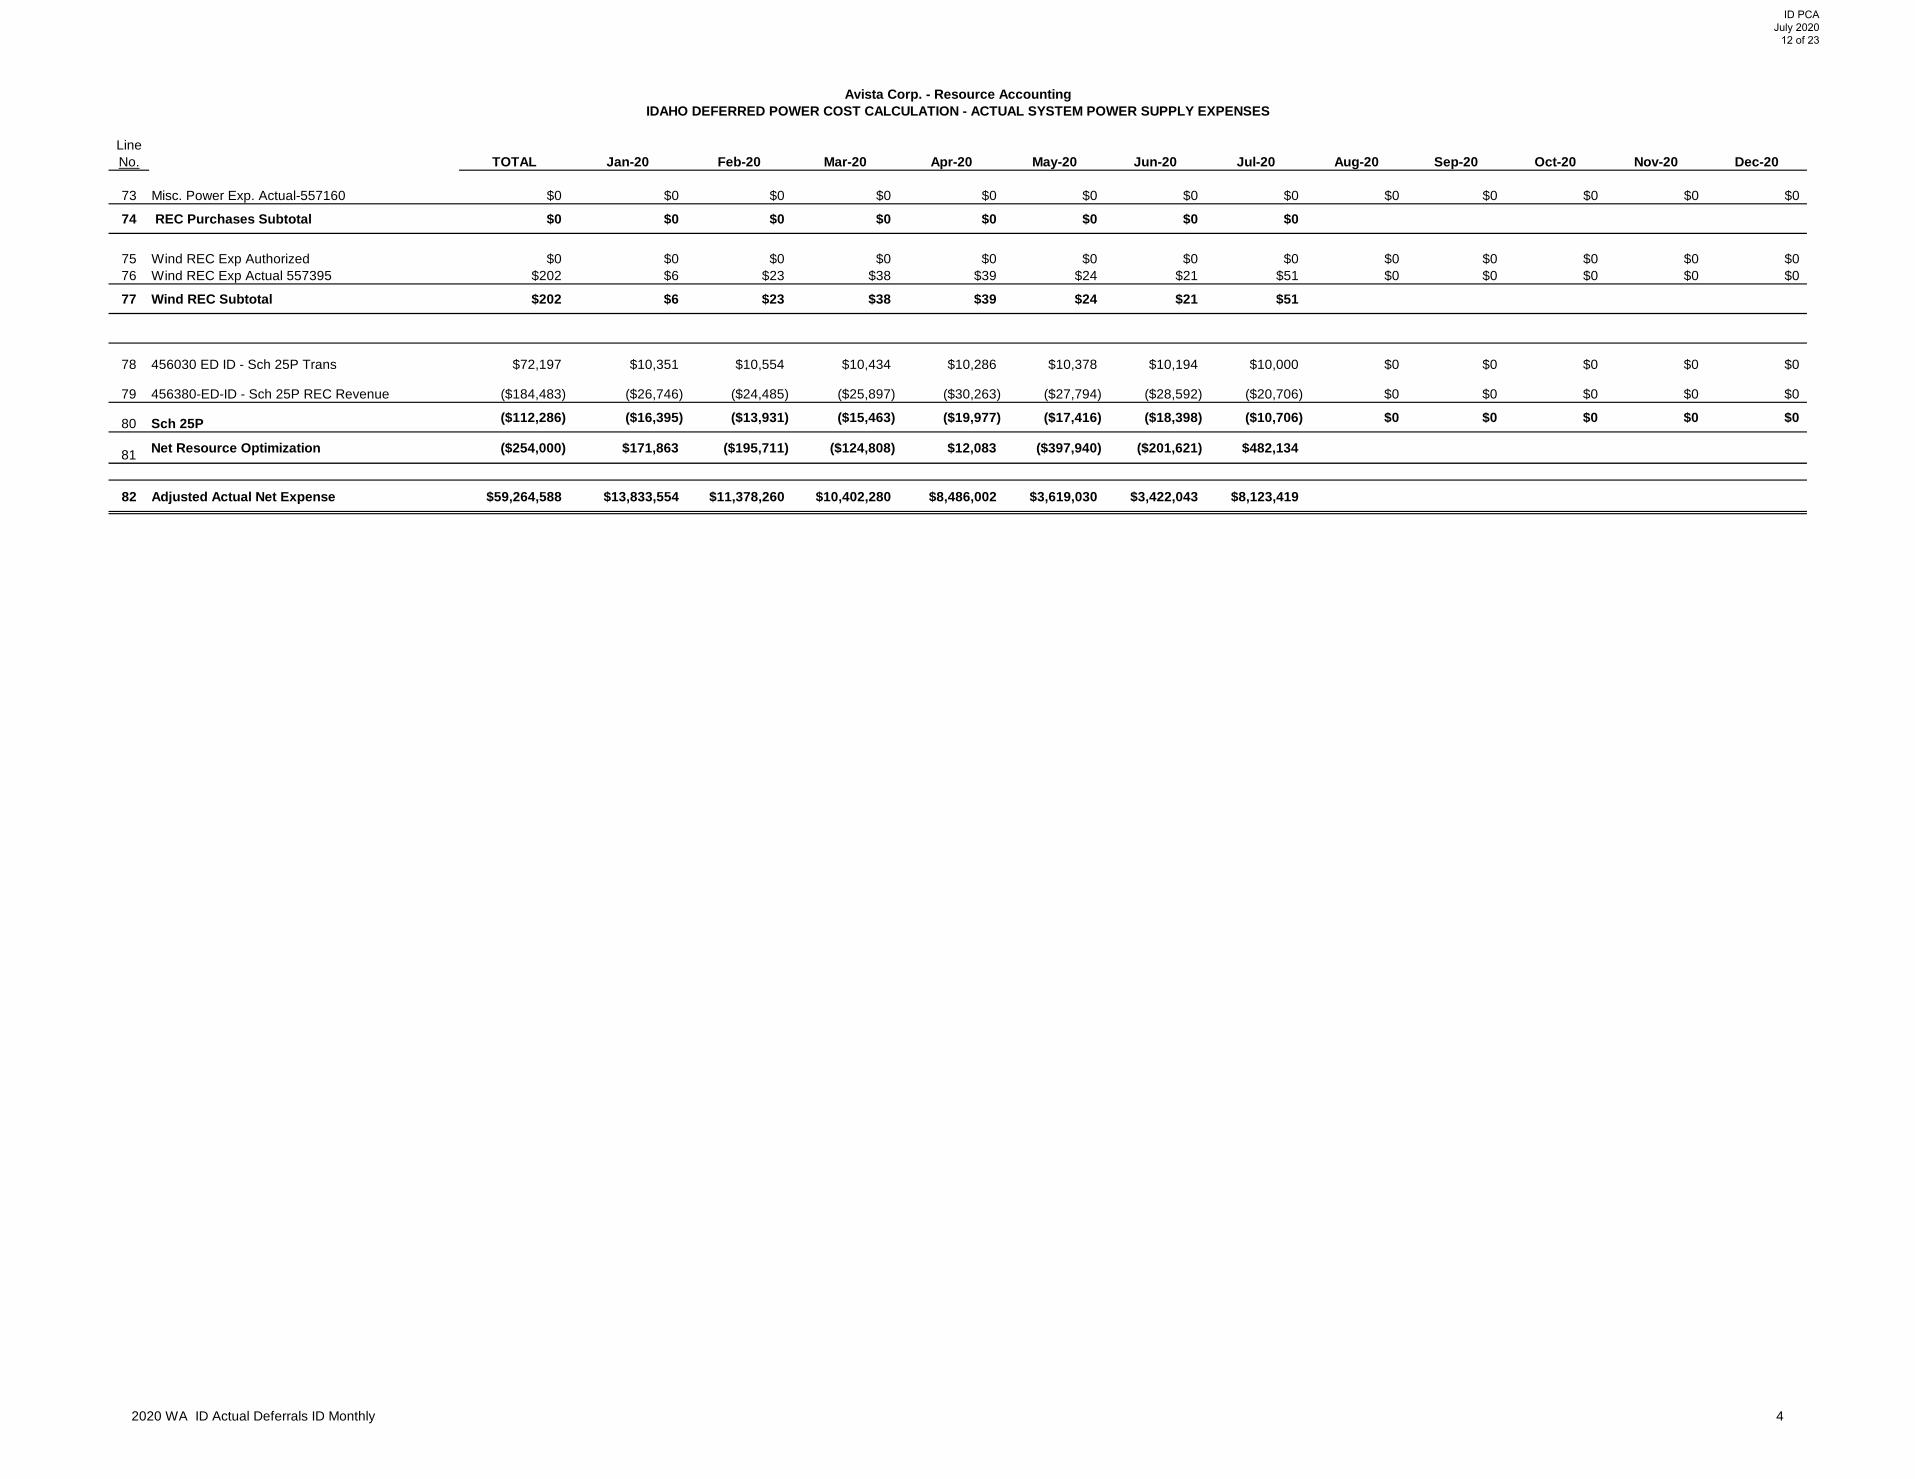
LineNo. TOTAL Jan-20 Feb-20 Mar-20 Apr-20 May-20 Jun-20 Jul-20 Aug-20 Sep-20 Oct-20 Nov-20 Dec-20
Avista Corp. - Resource AccountingIDAHO DEFERRED POWER COST CALCULATION - ACTUAL SYSTEM POWER SUPPLY EXPENSES
73 Misc. Power Exp. Actual-557160 $0 $0 $0 $0 $0 $0 $0 $0 $0 $0 $0 $0 $0
74 REC Purchases Subtotal $0 $0 $0 $0 $0 $0 $0 $0
75 Wind REC Exp Authorized $0 $0 $0 $0 $0 $0 $0 $0 $0 $0 $0 $0 $076 Wind REC Exp Actual 557395 $202 $6 $23 $38 $39 $24 $21 $51 $0 $0 $0 $0 $0
77 Wind REC Subtotal $202 $6 $23 $38 $39 $24 $21 $51
78 456030 ED ID - Sch 25P Trans $72,197 $10,351 $10,554 $10,434 $10,286 $10,378 $10,194 $10,000 $0 $0 $0 $0 $0
79 456380-ED-ID - Sch 25P REC Revenue ($184,483) ($26,746) ($24,485) ($25,897) ($30,263) ($27,794) ($28,592) ($20,706) $0 $0 $0 $0 $0
80 Sch 25P ($112,286) ($16,395) ($13,931) ($15,463) ($19,977) ($17,416) ($18,398) ($10,706) $0 $0 $0 $0 $0
81 Net Resource Optimization ($254,000) $171,863 ($195,711) ($124,808) $12,083 ($397,940) ($201,621) $482,134
82 Adjusted Actual Net Expense $59,264,588 $13,833,554 $11,378,260 $10,402,280 $8,486,002 $3,619,030 $3,422,043 $8,123,419
2020 WA ID Actual Deferrals ID Monthly 4
ID PCA July 2020
12 of 23
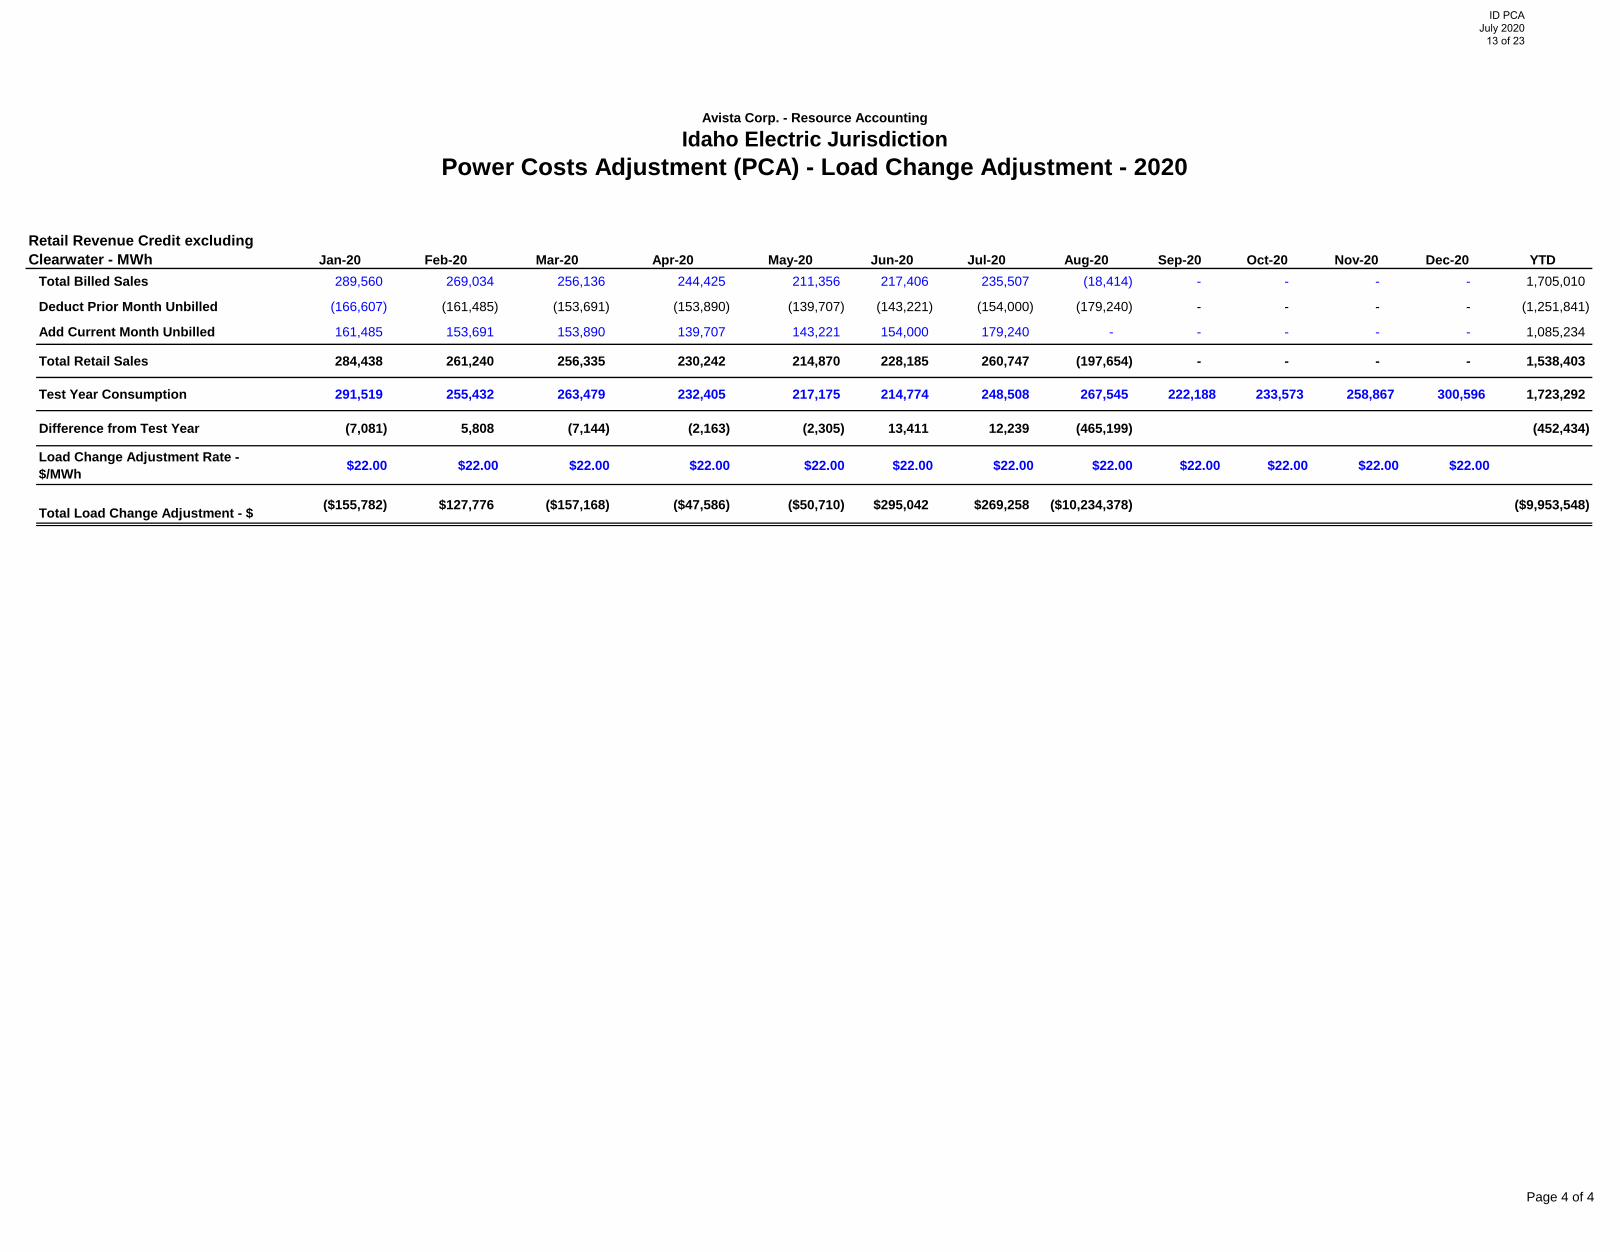
Jan-20 Feb-20 Mar-20 Apr-20 May-20 Jun-20 Jul-20 Aug-20 Sep-20 Oct-20 Nov-20 Dec-20 YTDTotal Billed Sales 289,560 269,034 256,136 244,425 211,356 217,406 235,507 (18,414) - - - - 1,705,010
Deduct Prior Month Unbilled (166,607) (161,485) (153,691) (153,890) (139,707) (143,221) (154,000) (179,240) - - - - (1,251,841)
Add Current Month Unbilled 161,485 153,691 153,890 139,707 143,221 154,000 179,240 - - - - - 1,085,234
Total Retail Sales 284,438 261,240 256,335 230,242 214,870 228,185 260,747 (197,654) - - - - 1,538,403
Test Year Consumption 291,519 255,432 263,479 232,405 217,175 214,774 248,508 267,545 222,188 233,573 258,867 300,596 1,723,292
Difference from Test Year (7,081) 5,808 (7,144) (2,163) (2,305) 13,411 12,239 (465,199) (452,434)
Load Change Adjustment Rate - $/MWh $22.00 $22.00 $22.00 $22.00 $22.00 $22.00 $22.00 $22.00 $22.00 $22.00 $22.00 $22.00
Total Load Change Adjustment - $ ($155,782) $127,776 ($157,168) ($47,586) ($50,710) $295,042 $269,258 ($10,234,378) ($9,953,548)
Avista Corp. - Resource Accounting
Idaho Electric JurisdictionPower Costs Adjustment (PCA) - Load Change Adjustment - 2020
Retail Revenue Credit excluding Clearwater - MWh
Page 4 of 4
ID PCA July 2020
13 of 23
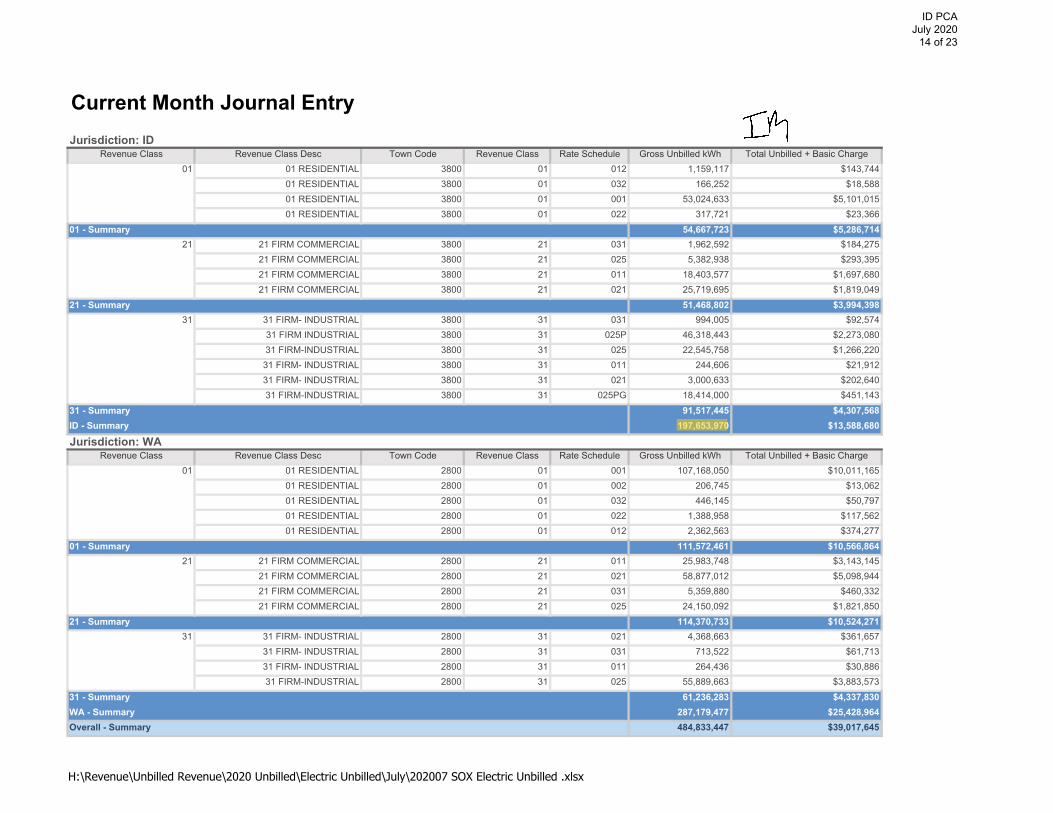
Revenue Class Revenue Class Desc Town Code Revenue Class Rate Schedule Gross Unbilled kWh Total Unbilled + Basic Charge01 RESIDENTIAL 3800 01 012 1,159,117 $143,74401 RESIDENTIAL 3800 01 032 166,252 $18,58801 RESIDENTIAL 3800 01 001 53,024,633 $5,101,01501 RESIDENTIAL 3800 01 022 317,721 $23,366
54,667,723 $5,286,71421 FIRM COMMERCIAL 3800 21 031 1,962,592 $184,27521 FIRM COMMERCIAL 3800 21 025 5,382,938 $293,39521 FIRM COMMERCIAL 3800 21 011 18,403,577 $1,697,68021 FIRM COMMERCIAL 3800 21 021 25,719,695 $1,819,049
51,468,802 $3,994,39831 FIRM- INDUSTRIAL 3800 31 031 994,005 $92,57431 FIRM INDUSTRIAL 3800 31 025P 46,318,443 $2,273,08031 FIRM-INDUSTRIAL 3800 31 025 22,545,758 $1,266,22031 FIRM- INDUSTRIAL 3800 31 011 244,606 $21,91231 FIRM- INDUSTRIAL 3800 31 021 3,000,633 $202,64031 FIRM-INDUSTRIAL 3800 31 025PG 18,414,000 $451,143
91,517,445 $4,307,568197,653,970 $13,588,680
Revenue Class Revenue Class Desc Town Code Revenue Class Rate Schedule Gross Unbilled kWh Total Unbilled + Basic Charge01 RESIDENTIAL 2800 01 001 107,168,050 $10,011,16501 RESIDENTIAL 2800 01 002 206,745 $13,06201 RESIDENTIAL 2800 01 032 446,145 $50,79701 RESIDENTIAL 2800 01 022 1,388,958 $117,56201 RESIDENTIAL 2800 01 012 2,362,563 $374,277
111,572,461 $10,566,86421 FIRM COMMERCIAL 2800 21 011 25,983,748 $3,143,14521 FIRM COMMERCIAL 2800 21 021 58,877,012 $5,098,94421 FIRM COMMERCIAL 2800 21 031 5,359,880 $460,33221 FIRM COMMERCIAL 2800 21 025 24,150,092 $1,821,850
114,370,733 $10,524,27131 FIRM- INDUSTRIAL 2800 31 021 4,368,663 $361,65731 FIRM- INDUSTRIAL 2800 31 031 713,522 $61,71331 FIRM- INDUSTRIAL 2800 31 011 264,436 $30,88631 FIRM-INDUSTRIAL 2800 31 025 55,889,663 $3,883,573
61,236,283 $4,337,830287,179,477 $25,428,964484,833,447 $39,017,645
21 - Summary31
31 - SummaryWA - SummaryOverall - Summary
ID - Summary
Jurisdiction: WA
01
01 - Summary21
01 - Summary21
21 - Summary31
31 - Summary
Jurisdiction: ID
01
Current Month Journal Entry
H:\Revenue\Unbilled Revenue\2020 Unbilled\Electric Unbilled\July\202007 SOX Electric Unbilled .xlsx
ID PCA July 2020
14 of 23
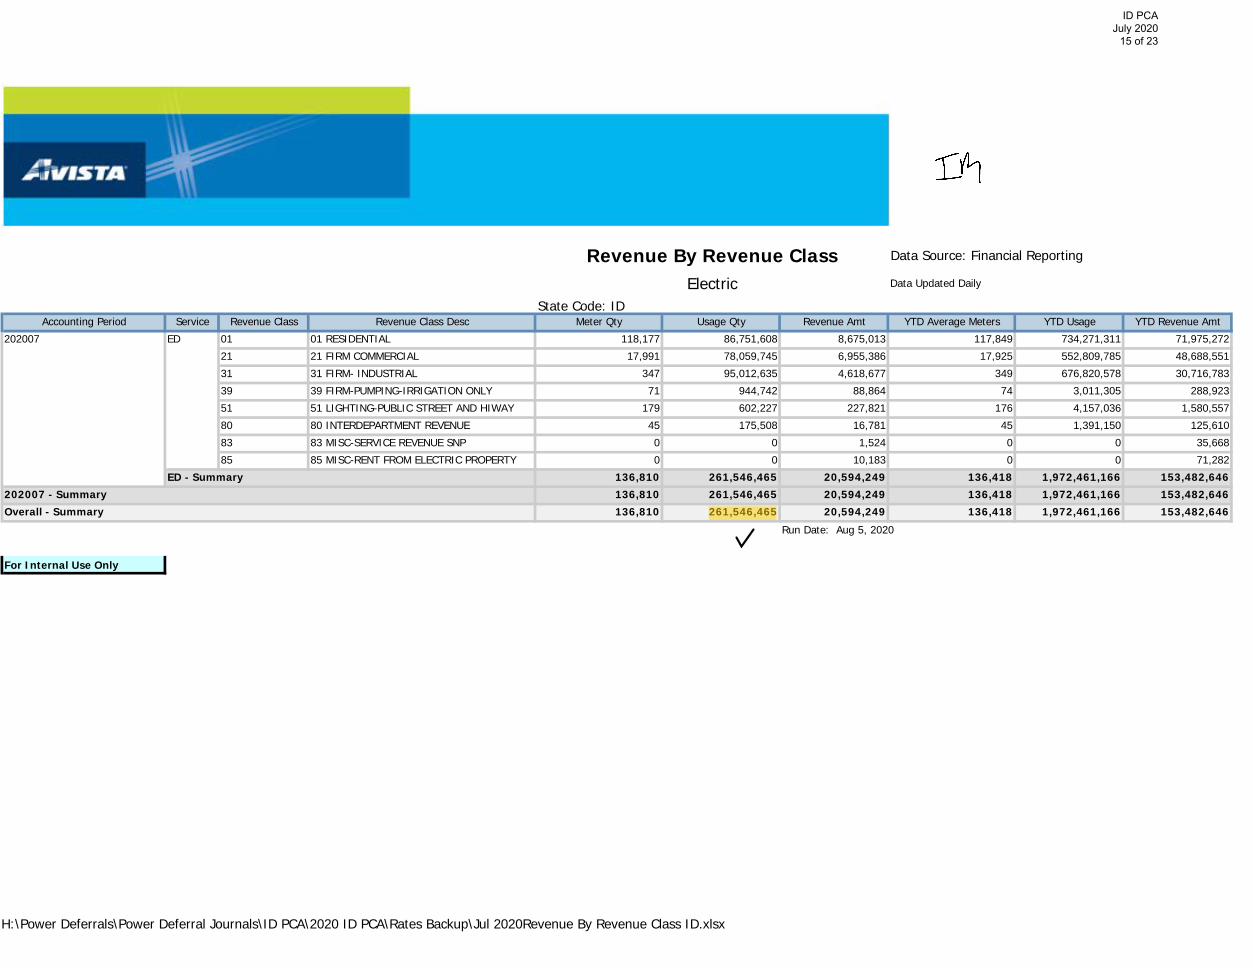
State Code: IDAccounting Period Service Revenue Class Revenue Class Desc Meter Qty Usage Qty Revenue Amt YTD Average Meters YTD Usage YTD Revenue Amt
01 01 RESIDENTIAL 118,177 86,751,608 8,675,013 117,849 734,271,311 71,975,27221 21 FIRM COMMERCIAL 17,991 78,059,745 6,955,386 17,925 552,809,785 48,688,55131 31 FIRM- INDUSTRIAL 347 95,012,635 4,618,677 349 676,820,578 30,716,78339 39 FIRM-PUMPING-IRRIGATION ONLY 71 944,742 88,864 74 3,011,305 288,92351 51 LIGHTING-PUBLIC STREET AND HIWAY 179 602,227 227,821 176 4,157,036 1,580,55780 80 INTERDEPARTMENT REVENUE 45 175,508 16,781 45 1,391,150 125,61083 83 MISC-SERVICE REVENUE SNP 0 0 1,524 0 0 35,66885 85 MISC-RENT FROM ELECTRIC PROPERTY 0 0 10,183 0 0 71,282
136,810 261,546,465 20,594,249 136,418 1,972,461,166 153,482,646136,810 261,546,465 20,594,249 136,418 1,972,461,166 153,482,646136,810 261,546,465 20,594,249 136,418 1,972,461,166 153,482,646
For Internal Use Only
202007 - SummaryOverall - Summary
Run Date: Aug 5, 2020
202007 ED
ED - Summary
Revenue By Revenue Class Data Source: Financial Reporting
Electric Data Updated Daily
H:\Power Deferrals\Power Deferral Journals\ID PCA\2020 ID PCA\Rates Backup\Jul 2020Revenue By Revenue Class ID.xlsx
ID PCA July 2020
15 of 23
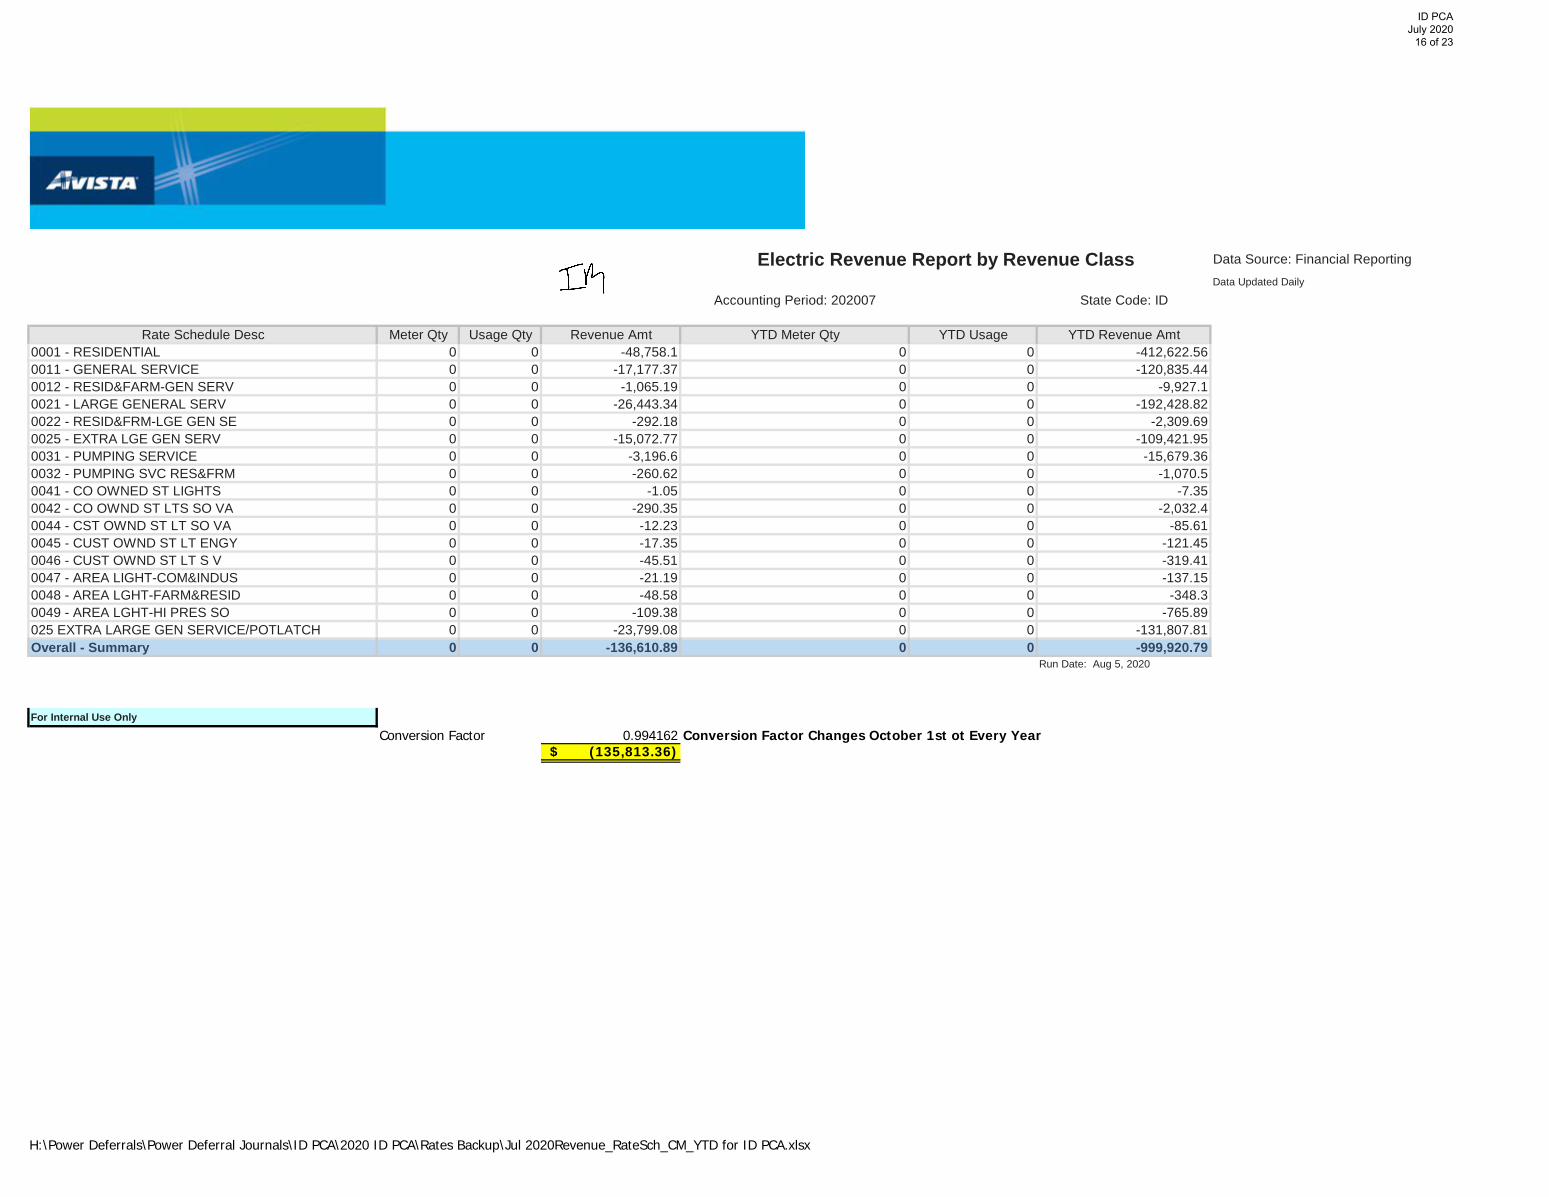
Accounting Period: 202007 State Code: ID
Rate Schedule Desc Meter Qty Usage Qty Revenue Amt YTD Meter Qty YTD Usage YTD Revenue Amt0001 - RESIDENTIAL 0 0 -48,758.1 0 0 -412,622.560011 - GENERAL SERVICE 0 0 -17,177.37 0 0 -120,835.440012 - RESID&FARM-GEN SERV 0 0 -1,065.19 0 0 -9,927.10021 - LARGE GENERAL SERV 0 0 -26,443.34 0 0 -192,428.820022 - RESID&FRM-LGE GEN SE 0 0 -292.18 0 0 -2,309.690025 - EXTRA LGE GEN SERV 0 0 -15,072.77 0 0 -109,421.950031 - PUMPING SERVICE 0 0 -3,196.6 0 0 -15,679.360032 - PUMPING SVC RES&FRM 0 0 -260.62 0 0 -1,070.50041 - CO OWNED ST LIGHTS 0 0 -1.05 0 0 -7.350042 - CO OWND ST LTS SO VA 0 0 -290.35 0 0 -2,032.40044 - CST OWND ST LT SO VA 0 0 -12.23 0 0 -85.610045 - CUST OWND ST LT ENGY 0 0 -17.35 0 0 -121.450046 - CUST OWND ST LT S V 0 0 -45.51 0 0 -319.410047 - AREA LIGHT-COM&INDUS 0 0 -21.19 0 0 -137.150048 - AREA LGHT-FARM&RESID 0 0 -48.58 0 0 -348.30049 - AREA LGHT-HI PRES SO 0 0 -109.38 0 0 -765.89025 EXTRA LARGE GEN SERVICE/POTLATCH 0 0 -23,799.08 0 0 -131,807.81Overall - Summary 0 0 -136,610.89 0 0 -999,920.79
For Internal Use Only
Conversion Factor 0.994162 Conversion Factor Changes October 1st ot Every Year(135,813.36)$
Electric Revenue Report by Revenue Class Data Source: Financial Reporting
Data Updated Daily
Run Date: Aug 5, 2020
H:\Power Deferrals\Power Deferral Journals\ID PCA\2020 ID PCA\Rates Backup\Jul 2020Revenue_RateSch_CM_YTD for ID PCA.xlsx
ID PCA July 2020
16 of 23
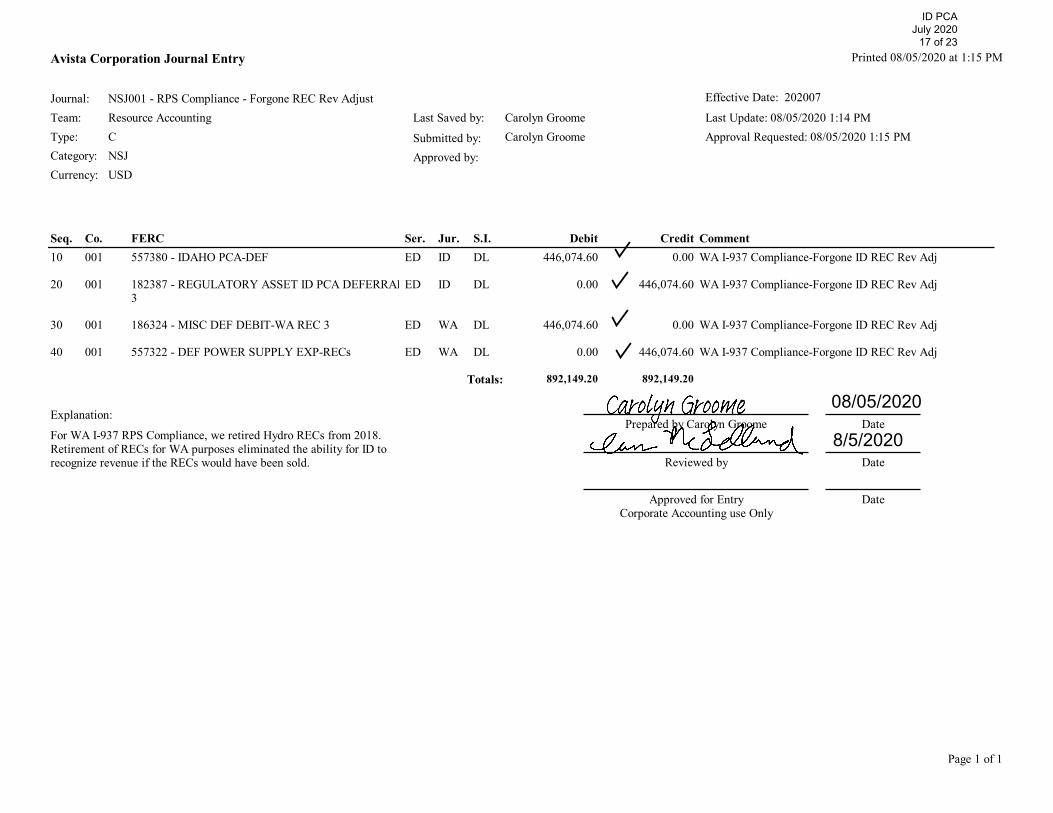
Explanation:
For WA I-937 RPS Compliance, we retired Hydro RECs from 2018. Retirement of RECs for WA purposes eliminated the ability for ID to recognize revenue if the RECs would have been sold.
Seq. Co. FERC Ser. Jur. S.I. Debit Credit Comment10 001 557380 - IDAHO PCA-DEF ED ID DL 446,074.60 0.00 WA I-937 Compliance-Forgone ID REC Rev Adj
20 001 182387 - REGULATORY ASSET ID PCA DEFERRAL3
ED ID DL 0.00 446,074.60 WA I-937 Compliance-Forgone ID REC Rev Adj
30 001 186324 - MISC DEF DEBIT-WA REC 3 ED WA DL 446,074.60 0.00 WA I-937 Compliance-Forgone ID REC Rev Adj
40 001 557322 - DEF POWER SUPPLY EXP-RECs ED WA DL 0.00 446,074.60 WA I-937 Compliance-Forgone ID REC Rev Adj
Totals: 892,149.20 892,149.20
Prepared by Carolyn Groome
Reviewed by
Approved for EntryCorporate Accounting use Only
Date
Date
Date
Page 1 of 1
Avista Corporation Journal Entry
Journal:Team:Type:Category:Currency:
NSJ001 - RPS Compliance - Forgone REC Rev AdjustLast Saved by:
Submitted by:Approved by:
Carolyn GroomeCarolyn Groome
Printed 08/05/2020 at 1:15 PM
Last Update: 08/05/2020 1:14 PMApproval Requested: 08/05/2020 1:15 PM
Resource AccountingCNSJUSD
Effective Date: 202007
08/05/2020
8/5/2020
ID PCA July 2020
17 of 23
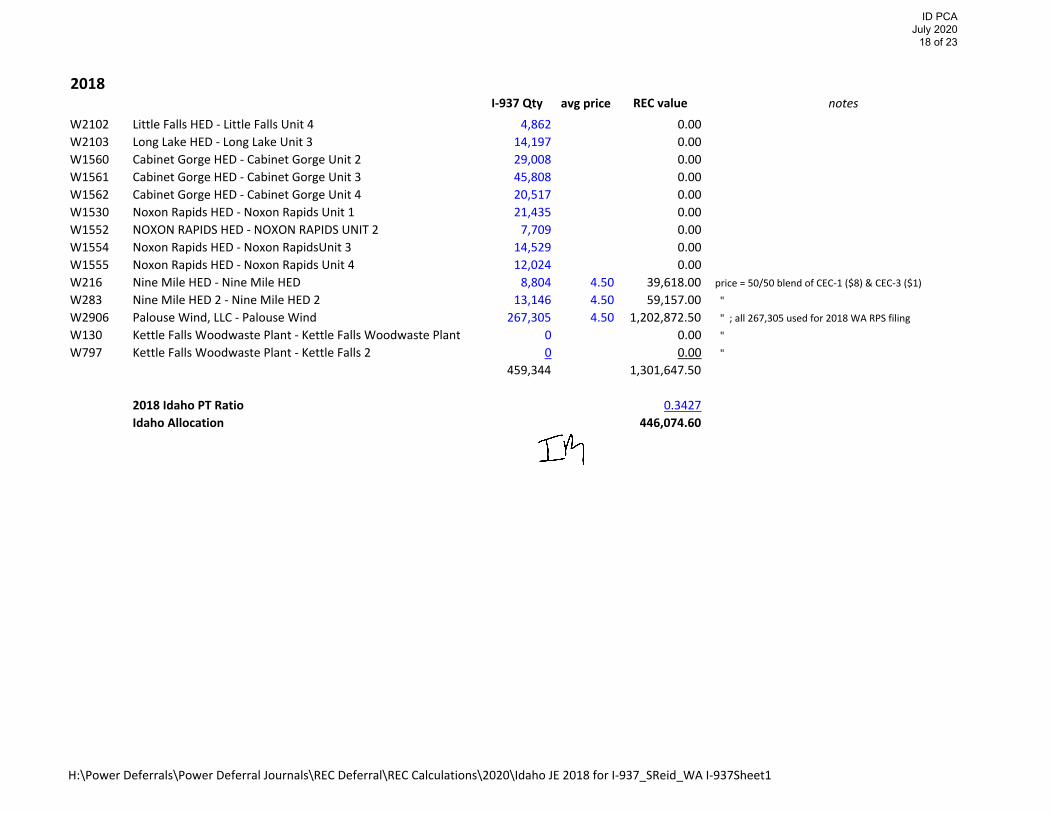
2018I‐937 Qty avg price REC value notes
W2102 Little Falls HED ‐ Little Falls Unit 4 4,862 0.00W2103 Long Lake HED ‐ Long Lake Unit 3 14,197 0.00W1560 Cabinet Gorge HED ‐ Cabinet Gorge Unit 2 29,008 0.00W1561 Cabinet Gorge HED ‐ Cabinet Gorge Unit 3 45,808 0.00W1562 Cabinet Gorge HED ‐ Cabinet Gorge Unit 4 20,517 0.00W1530 Noxon Rapids HED ‐ Noxon Rapids Unit 1 21,435 0.00W1552 NOXON RAPIDS HED ‐ NOXON RAPIDS UNIT 2 7,709 0.00W1554 Noxon Rapids HED ‐ Noxon RapidsUnit 3 14,529 0.00W1555 Noxon Rapids HED ‐ Noxon Rapids Unit 4 12,024 0.00W216 Nine Mile HED ‐ Nine Mile HED 8,804 4.50 39,618.00 price = 50/50 blend of CEC‐1 ($8) & CEC‐3 ($1)
W283 Nine Mile HED 2 ‐ Nine Mile HED 2 13,146 4.50 59,157.00 "
W2906 Palouse Wind, LLC ‐ Palouse Wind 267,305 4.50 1,202,872.50 " ; all 267,305 used for 2018 WA RPS filing
W130 Kettle Falls Woodwaste Plant ‐ Kettle Falls Woodwaste Plant 0 0.00 "
W797 Kettle Falls Woodwaste Plant ‐ Kettle Falls 2 0 0.00 "
459,344 1,301,647.50
2018 Idaho PT Ratio 0.3427Idaho Allocation 446,074.60
H:\Power Deferrals\Power Deferral Journals\REC Deferral\REC Calculations\2020\Idaho JE 2018 for I‐937_SReid_WA I‐937Sheet1
ID PCA July 2020
18 of 23
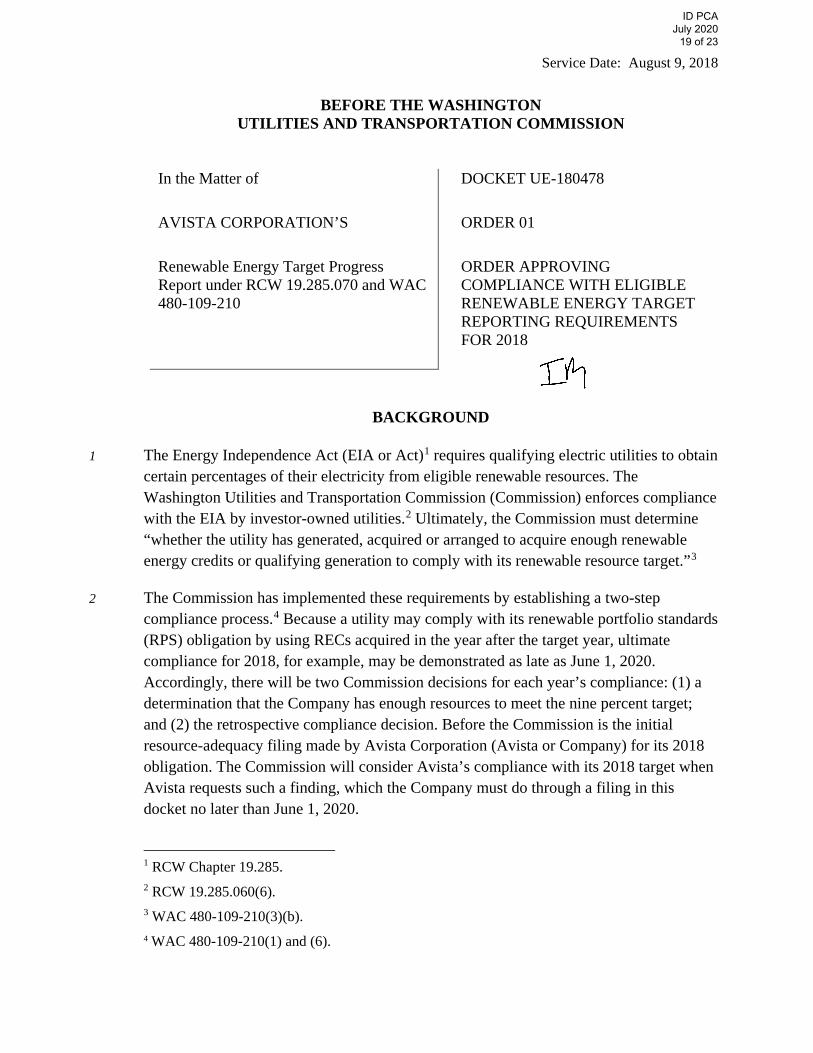
Service Date: August 9, 2018
BEFORE THE WASHINGTON UTILITIES AND TRANSPORTATION COMMISSION
In the Matter of AVISTA CORPORATION’S Renewable Energy Target Progress Report under RCW 19.285.070 and WAC 480-109-210
DOCKET UE-180478 ORDER 01
ORDER APPROVING COMPLIANCE WITH ELIGIBLE RENEWABLE ENERGY TARGET REPORTING REQUIREMENTS FOR 2018
BACKGROUND
1 The Energy Independence Act (EIA or Act)1 requires qualifying electric utilities to obtain certain percentages of their electricity from eligible renewable resources. The Washington Utilities and Transportation Commission (Commission) enforces compliance with the EIA by investor-owned utilities.2 Ultimately, the Commission must determine “whether the utility has generated, acquired or arranged to acquire enough renewable energy credits or qualifying generation to comply with its renewable resource target.”3
2 The Commission has implemented these requirements by establishing a two-step compliance process.4 Because a utility may comply with its renewable portfolio standards (RPS) obligation by using RECs acquired in the year after the target year, ultimate compliance for 2018, for example, may be demonstrated as late as June 1, 2020. Accordingly, there will be two Commission decisions for each year’s compliance: (1) a determination that the Company has enough resources to meet the nine percent target; and (2) the retrospective compliance decision. Before the Commission is the initial resource-adequacy filing made by Avista Corporation (Avista or Company) for its 2018 obligation. The Commission will consider Avista’s compliance with its 2018 target when Avista requests such a finding, which the Company must do through a filing in this docket no later than June 1, 2020.
1 RCW Chapter 19.285. 2 RCW 19.285.060(6). 3 WAC 480-109-210(3)(b). 4 WAC 480-109-210(1) and (6).
ID PCA July 2020
19 of 23
DOCKET UE-180478 PAGE 2 ORDER 01
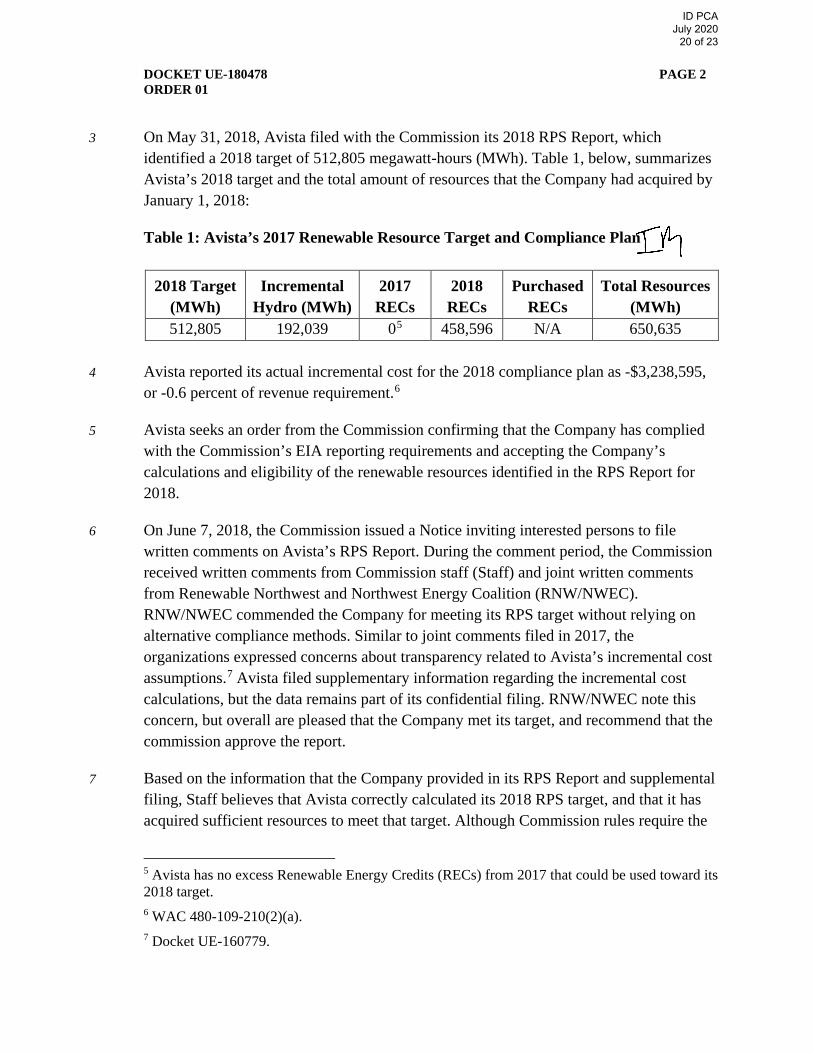
3 On May 31, 2018, Avista filed with the Commission its 2018 RPS Report, which identified a 2018 target of 512,805 megawatt-hours (MWh). Table 1, below, summarizes Avista’s 2018 target and the total amount of resources that the Company had acquired by January 1, 2018:
Table 1: Avista’s 2017 Renewable Resource Target and Compliance Plan
2018 Target (MWh)
Incremental Hydro (MWh)
2017 RECs
2018 RECs
Purchased RECs
Total Resources (MWh)
512,805 192,039 05 458,596 N/A 650,635
4 Avista reported its actual incremental cost for the 2018 compliance plan as -$3,238,595, or -0.6 percent of revenue requirement.6
5 Avista seeks an order from the Commission confirming that the Company has complied with the Commission’s EIA reporting requirements and accepting the Company’s calculations and eligibility of the renewable resources identified in the RPS Report for 2018.
6 On June 7, 2018, the Commission issued a Notice inviting interested persons to file written comments on Avista’s RPS Report. During the comment period, the Commission received written comments from Commission staff (Staff) and joint written comments from Renewable Northwest and Northwest Energy Coalition (RNW/NWEC). RNW/NWEC commended the Company for meeting its RPS target without relying on alternative compliance methods. Similar to joint comments filed in 2017, the organizations expressed concerns about transparency related to Avista’s incremental cost assumptions.7 Avista filed supplementary information regarding the incremental cost calculations, but the data remains part of its confidential filing. RNW/NWEC note this concern, but overall are pleased that the Company met its target, and recommend that the commission approve the report.
7 Based on the information that the Company provided in its RPS Report and supplemental filing, Staff believes that Avista correctly calculated its 2018 RPS target, and that it has acquired sufficient resources to meet that target. Although Commission rules require the
5 Avista has no excess Renewable Energy Credits (RECs) from 2017 that could be used toward its 2018 target. 6 WAC 480-109-210(2)(a). 7 Docket UE-160779.
ID PCA July 2020
20 of 23
DOCKET UE-180478 PAGE 3 ORDER 01 Company to document its use of renewable resources under various renewable energy programs in its annual report, Staff requests the Commission require Avista to include that information in its final compliance report, which will allow Staff to determine whether its resources meet EIA requirements.
8 Staff recommends that the Commission issue an order in this docket determining that: (1) the 2018 renewable energy target for Avista is 512,805 MWh; (2) Avista has demonstrated that, by January 1, 2018, the Company acquired at least 512,805 MWh of eligible renewable resources, equivalent RECs, or a combination of the two, sufficient to supply at least 9 percent of its load for 2018; (3) Avista has complied with the June 1, 2018, reporting requirements pursuant to WAC 480-109-210; (4) in its final compliance report for 2018 required by WAC 480-109-210(6), Avista must provide details about which certificates were used for its various renewable energy programs.
DISCUSSION
9 The Commission accepts Avista’s calculation of 512,805 megawatt-hours as the Company’s renewable energy target for 2018 and determines that Avista has identified sufficient resources to be able to meet that target. The Commission will make its final determination about whether Avista has met its 2018 target when the Company requests such a finding, no later than June 1, 2020. To assist Staff with determining whether Avista’s resources meet EIA eligibility requirements, Avista must provide details about which certificates were used for its various renewable energy programs, as required by WAC 480-109-210(2)(d)(i), in its final compliance report for 2018.
FINDINGS AND CONCLUSIONS
10 (1) The Commission is an agency of the state of Washington vested by statute with the authority to regulate the rates, regulations, practices, and accounts of public service companies, including electric companies.
11 (2) Avista is an electrical company and a public service company subject to Commission jurisdiction.
12 (3) Avista serves more than 25,000 customers within the State of Washington and is a “qualifying utility” within the meaning of RCW 19.285.030(18).
13 (4) Avista has properly calculated its renewable energy target for 2018 to be 512,805 megawatt-hours.
ID PCA July 2020
21 of 23
DOCKET UE-180478 PAGE 4 ORDER 01
14 (5) By January 1, 2018, Avista had acquired sufficient eligible renewable resources to supply at least 9 percent of its load for the remainder of 2018.
15 (6) Avista has met the reporting requirements of RCW 19.285.070 and WAC 480-109-210. These reporting requirements include Avista’s plan for meeting its RPS obligation for the remainder of 2018.
16 (7) Pursuant to WAC 480-109-210(4), Avista must provide a summary of its RPS Report to its customers, by bill insert or other suitable method, within 30 days of the date of this Order.
17 (8) Pursuant to WAC 480-109-200(3), Avista must register in Western Renewable Energy Generation Information System (WREGIS) all Company-owned incremental hydropower facilities on which the Company intends to rely for compliance with RPS requirements.
18 (9) Pursuant to WAC 480-109-210(6), Avista must file a report no later than June 1, 2020, that lists the certificate numbers in WREGIS the for every megawatt-hour and renewable energy credit that Avista retired to meet the January 1, 2018, target.
ORDER
THE COMMISSION ORDERS:
19 (1) The Commission accepts the calculation of 512,805 megawatt-hours as the 2018 renewable energy target for Avista Corporation.
20 (2) Avista Corporation has identified eligible renewable resources sufficient to supply at least 9 percent of its load for 2018.
21 (3) Avista Corporation has complied with the June 1, 2018, reporting requirements pursuant to WAC 480-109-210.
22 (4) Avista Corporation’s final compliance report must list certificate numbers for every renewable energy credit that Avista Corporation retired in the Western Renewable Energy Generation Information System and details about which certificates were used for its voluntary renewable energy programs in 2018.
23 (5) The Commission Secretary is authorized to accept or approve a filing that complies with the requirements of this Order.
ID PCA July 2020
22 of 23
DOCKET UE-180478 PAGE 5 ORDER 01 DATED at Olympia, Washington, and effective August 9, 2018.
WASHINGTON UTILITIES AND TRANSPORTATION COMMISSION
DAVID W. DANNER, Chairman
ANN E. RENDAHL, Commissioner JAY M. BALASBAS, Commissioner
ID PCA July 2020
23 of 23


![Power System Operations 2016.pptx [Read-Only] - etouches · PDF filePower System Operations Hands On Relay School March 18, 2016 Rich Hydzik Avista Utilities](https://img.pdfslide.net/doc/110x75/5abeb2027f8b9aa15e8d26a0/power-system-operations-2016pptx-read-only-etouches-system-operations-hands.jpg)