Embed Size (px)
Citation preview
D:\Documents and Settings\les04rl\Local Settings\Temporary Internet Files\OLK63\SpadavecchiaPaper.doc29/08/2006
1
SURVIVING UNDER THE SHELTER OF GOVERNMENT SUBSIDIES OR
‘AVOIDING DISASTER’? NEW EVIDENCE FRON THE ITALIAN INDUSTRIAL
DISTRICTS, 1971-1991 1
Anna Spadavecchia
University of Reading
Introduction
Overcoming regional economic divides has been a major aspect of economic policies
within Europe since the Second World War. By the beginning of the 1960s ‘regional
policy’ had become a distinct area of state intervention in several Western European
countries, including Britain, France, Germany and the Netherlands (Artobolevskiy,
1997, pp. 32-36). Considerable resources have been channelled into policies to
promote regional development. It might suffice to think that the European Union
provided some 149.9 billion Euros to finance regional development projects in the
1958-1998 period, amounting to an estimated 63.9% of all activities in the Union
(Vanhove, 1999, p. 460).2 After 50 years of such efforts regional economic divides
still persist. Although this persistence cannot be interpreted as an outright failure, it
indicates the limited effectiveness of such policies.
This paper aims to enhance our understanding of the factors hampering the
effectiveness of regional policies, focussing on the specific case of financial subsidies
to small and medium-sized firms (henceforth SMEs) in Italy, from 1971-1991. A
common criticism of the Italian regional policy is that its financial subsidies enabled 1 Work in progress, not to be quoted without permission of the author. 2 The figures include low interest rate loans extended by the European Investment Bank and grants by the European Regional Development Fund.

D:\Documents and Settings\les04rl\Local Settings\Temporary Internet Files\OLK63\SpadavecchiaPaper.doc29/08/2006
2
Southern entrepreneurs to maximise their profits by reaping benefits from institutions
rather than from the market (Trigiglia, 1992, pp. 93-94). This paper tests this criticism
for financial subsidies to SMEs in the South and in the more prosperous North-East,
where smaller subsidies were available as part of the national industrial policy. It
argues that although Southern entrepreneurs did benefit from institutions, the rationale
behind their behaviour was the avoidance of risk rather than the maximising of
profits.
This paper is structured in five sections. The first illustrates the system of subsidies
available to SMEs in the South and compares them to subsidies available in the rest of
the country. The second presents the samples of firms on which the analysis is based.
As a first assessment of the comparative importance of subsidies, section III discusses
the capital structure of firms in the two samples. Section IV analyses the effectiveness
of companies in promoting the growth of recipient firms and section V discusses the
implications of the findings.
I Regional and national financial subsidies for small firms, 1970s - 1990s
Subsidised medium-term loans were available to small and medium-sized firms3
throughout Italy from the early 1950s, via the network of the newly-established
Special Credit Institutions (SCIs) - the Regional Medium-Term Credit Institutions
(RMTCIs) and the Departments of Industrial Credit (DICs),4 and their refinancing
3 In the 1950s small and medium-sized firms were defined as those employing no more than 500 workers and having net assets below 1.5 bn lire. For Southern firms the upper limit on assets was twice as much, 3 bn lire. 4 From the Bank Reform Law of 1936 until the early 1990s, when Italy conformed to the second EU Banking Directive, the banking system was specialised in market terms, meaning that banks could collect and lend money on the short-term market only and SCIs could collect and lend money on the

D:\Documents and Settings\les04rl\Local Settings\Temporary Internet Files\OLK63\SpadavecchiaPaper.doc29/08/2006
3
institution, the Mediocredito Centrale (MCC). RMTCIs were banks operating on the
medium-term credit5 market and specialised in lending to SMEs. The reason for their
specialisation lay in the fact that the Bank of Italy (BoI) and the Association of
Industrialists (Confindustria) felt that smaller industrial concerns were disadvantaged
in accessing finance and at the same time important for the country's economy (Asso
and Raitano, 1999). The provision of financial subsidies (soft loans and grants) to
Southern SMEs was part of the much wider framework of the regional policy
managed by the Cassa per il Mezzogiorno (Cassa) established in 1950. Political and
economic considerations led to the implementation of the so-called ‘Extraordinary
intervention for the South’ supported by various parties, the brains trust Svimez, the
International Bank for Reconstruction and Development (IBRD) and the government
(D’Antone, 1997; Weiss, 1984).
Table1 below shows the main guidelines for the allocation of soft loans and grants,
the main financial subsidies for Southern firms, at the beginning of the period under
analysis.
Table 1 around here
medium-term market only. The two markets are closely connected: banks being among the establishing partners of the SCIs, as establishing SCIs represented the path to access the medium-term credit market, and could finance them by purchasing their bonds. The banking system was also fragmented geographically, as banks and SCIs could operate on a smaller or wider territory according to the size of their deposits. 5 Until the end of the 1940s, the Bank of Italy (BoI) defined short-term loans as those repayable within one year, medium-term from one year to five years and long-term above five years. In 1952, with the establishment of the MCC, the definitions were changed: short-term credit up to one year, medium-term credit from one year up to ten years, except in Southern Italy (up to 15 years). Short-term finance aimed to provide working capital and medium-term finance provided capital for investment (Pontolillo, 1971).

D:\Documents and Settings\les04rl\Local Settings\Temporary Internet Files\OLK63\SpadavecchiaPaper.doc29/08/2006
4
Table 1 shows the varying percentage of subsidies to which Southern firms were
entitled on the basis of their size in terms of fixed assets. From 1971 the Cassa was
operating according to policy guidelines established every five years by the
Interministerial Committee for Economic Policy (Comitato interministeriale per la
politica economica). The guidelines passed in 1971 intended to encourage investment
in depopulated areas, rather than in the ‘nuclei and areas of industrial growth’ as it
had been from 1957 to 1970. It appeared that the South was experiencing internal
migration from the rural hinterland to industrial agglomerations within the South, in
addition to migration towards the industrial cities of the North and international
migration (Ronzani, 1980).
Financial subsidies to large firms followed a procedure called ‘contrattazione
programmata’ (planned bargaining procedures), which ensured consultations between
large firms planning investment and a restricted group of Ministries (Budget and
Economic Planning, Treasury, Labour and Industry). The aim of this procedure was to
ensure that investment projects were compatible with the directives of the national
economic planning to limit new investment in areas suffering from congestion and
labour shortages; moreover, the aim of the consultations was to make firms aware of
the public investment so that they could be exploited to the fullest and conversely to
adjust public investment to large companies’ needs (Annesi, 1973).
Table 1 above displays the criteria to allocate soft loans and grants to Southern firms
under the main schemes. However, since the beginning of the 1950s a number of
regional and national subsidy schemes had been introduced. Their proliferation,
leading to a ‘jungle of incentives’, in which the same firm could benefit from various

D:\Documents and Settings\les04rl\Local Settings\Temporary Internet Files\OLK63\SpadavecchiaPaper.doc29/08/2006
5
schemes, has been regarded as a consequence of the lack of a coherent industrial
policy. The absence of an all-embracing approach left room for pressure from
economic interest groups, which often led to the formulation of schemes addressing
specific or sectoral problems (Barca and Manghetti, 1976).
The awareness of the need to simplify the loan system led to the harmonisation of
regional and national schemes in 1976-77. By that time, subsidised credit was
regarded as particularly important, as the Bank of Italy’s tight monetary policy had
made borrowing more expensive (Vassalli and Visentini, 1978). For subsidised credit,
Italy was subdivided into 4 areas, 1) South; 2) underdeveloped areas in the Centre; 3)
underdeveloped areas in the North; 4) the Centre and North. The details for each
region are given in table 2.
Table 2 around here
A new soft loan scheme was introduced in the following year. This was considered
particularly important as it placed emphasis on the restructuring of existing plants,
rather than on the establishment of new ones (Pent Formengo, 1986).
Table 3 around here
In addition the Cassa amended its grant scheme in 1976. As table 3 demonstrates,
after 1979 large investments were entitled to larger grants than originally envisaged.
Table 4 around here

D:\Documents and Settings\les04rl\Local Settings\Temporary Internet Files\OLK63\SpadavecchiaPaper.doc29/08/2006
6
The Cassa had been established in 1950 as a temporary institution supposed to last
until 1980, but between 1980 and 1986, 11 ministerial decrees were passed to prolong
its activities, sometime for such a short period of time as a year or even six or three
months. All political parties agreed to keep an additional flow of resources going to
the South, but there were disagreement concerning the institutional framework for the
management of these funds (Cafiero and Marciani, 1991)
The uncertainty of the 1980-1986 period was ended by law 64/1986, which refinanced
and reorganised the extraordinary intervention for the South until 1993. The system of
soft loans and grants created in 1986 is given in table 5.
Table 5 around here
As 1993 approached, attempts to prolong funding failed because of domestic and
external pressures. The Parliamentary debate coincided with growing resentment in
the North about the levels of public expenditure in the South, and its harmful effects
on Northern employment. Furthermore, critics pointed out that few tangible results
had been achieved in 40 years of the Southern policies, which had been a drain on the
economy of the North. In addition, there was growing antipathy towards the role of
the public administration in the Italian economy and to the institutional structure
operating the Mezzogiorno policy. These tensions were reflected in calls for a
referendum on the Southern policy and in the considerable success of the Northern
separatists. Apart from domestic pressures, the European Commission also influenced
the course of events, by refusing to approve the 1992 bill to refinance the Agency.

D:\Documents and Settings\les04rl\Local Settings\Temporary Internet Files\OLK63\SpadavecchiaPaper.doc29/08/2006
7
Taking into account the Commission’s opposition, in December 1992 the Italian
Parliament decided to abolish the ‘Extraordinary intervention’ and its institutions,
with the Southern policy to be replaced by a national programme of assistance for
depressed areas (Yuill et al., 1989).
II The dataset
The impact of state subsidies on recipient firms is analysed using two case studies –
the industrial districts (henceforth IDs) of Barletta located in the South and San
Mauro Pascoli located in the North-East, the ‘classic’ area of IDs (see map in
Appendix A). The two IDs specialise in the production of footwear and clothing and
were chosen from a survey that identified 99 IDs across the whole country at the end
of the 1980s (Garavini et al., 1988).
The analysis is performed on two relatively small samples of companies (54 overall),
the records of which are held at the Chambers of Commerce in Forlì (for the San
Mauro ID) and Bari (for the Barletta ID). The samples consist of limited liability and
public share companies alone, as these are the only ones legally obliged to deposit
their balance sheets at the local Chamber of Commerce. The analysis presented is
based on raw balance sheets, reclassified according to financial criteria. Therefore,
this dataset allows the isolation of subsidies from other components of liabilities, e.g.
soft loans from long-term borrowed funds and grants from reserves. This was not
possible in previous works, which were based on the reclassified balance sheets made
available by the institutions.

D:\Documents and Settings\les04rl\Local Settings\Temporary Internet Files\OLK63\SpadavecchiaPaper.doc29/08/2006
8
At various points in time, the first sample includes 32 manufacturing companies
located in Barletta and the second sample includes 21 manufacturing companies
located in San Mauro. The two samples provide 681 observations – annual balance
sheets – over time, 460 for Southern companies and 221 for the North-Eastern
samples. The smaller number of companies in the North-Eastern sample is related to
the smaller size of the manufacturing sector in the SMP ID. The smaller number of
annual observations was also determined by the fact that these companies did not
have public status or were not trading during the whole 1971-91 period; most were
established as public companies or went public in the 1980s in the San Mauro sample,
whereas most companies in the Barletta sample did so in the second half of the 1970s.
More information about companies in the samples is provided in Appendix B.
The initial intention was to collect a random sample of at least 30 companies for each
ID, in the sectors of specialisation. If 30 such companies could not be found, the
samples would have been expanded to include companies in other manufacturing
sectors (henceforth man1).6 However, the scarcity of data was such that the two
samples were compiled by collecting all available records of public companies in the
manufacturing sectors mentioned, with records starting before 1984 in the case of
Barletta, and before 1988 for San Mauro, to provide a sufficiently long period of
analysis.7 Table 6 compares the number of companies in the two samples with the
number of companies in the two IDs; it also presents information on the size of public
companies.
6 Including food processing, wood, furniture, paper, publishing, photography and rubber. Sectors such as metal and mineral processing, oil refining and construction have not been included. 7 The different closing dates for the collection of data are due to the availability of records. Having collected records of 32 companies in the Barletta ID, it seemed unnecessary to collect records starting after 1984, as these would offer only seven years of analysis. The smaller number of records available for the San Mauro ID suggested the extension of the closing date to 1988.
D:\Documents and Settings\les04rl\Local Settings\Temporary Internet Files\OLK63\SpadavecchiaPaper.doc29/08/2006
9
Table 6 around here
A precise comparison based on the number of employees is not feasible, as companies
in the sample give only occasional information about their workforce. From census
data, it emerges that both IDs contain a large number of companies, most of which are
very small, and that the average size of public companies is higher than the average
company size in the sectors of specialisation. Thus, companies in the samples should
also capture a larger portion of the ID workforce than their sheer number suggests.
The inclusion of public companies alone introduces some biases into the sample,
particularly as regards capital structure. Their larger size and their legal status might
give them easier access to market capital and access to a wider range of types of
finance, such as bonds, which can only be issued by public companies. Thus, market
finance is likely to be higher for the sample companies than for small and medium-
sized companies as a whole in the two IDs. This bias can be magnified by the
computation of weighted averages, rather than a simple average. Nevertheless,
weighted averages have been preferred in the analysis of the capital structure (tables 8
and 9) as the purpose of the capital structure analysis is to offer a broader picture of
the IDs. It thus seemed correct to allocate greater weight to the sources of finance of
larger companies than, for instance, to those of a small start-up company.
The samples contain a further bias. Far more records in the Southern sample date back
to the 1970s than in the North-Eastern counterpart. Considering that the 1980s saw
more stable economic growth than the 1970s, this might affect the differences

D:\Documents and Settings\les04rl\Local Settings\Temporary Internet Files\OLK63\SpadavecchiaPaper.doc29/08/2006
10
emerging from the comparison of the two samples. This bias does not affect the
comparison of the capital structure and performance of the two samples in tables 8
and 9, as in those tables the overall period of analysis is broken into sub-periods, e.g.
1971-75, 1976-80. Table 7 below shows the size, in terms of net capital stock and the
turnover of the companies in the two samples.
Table 7 around here
Despite the larger dimension of the Southern companies in terms of fixed net capital,
they are considerably smaller in terms of turnover. The largest Southern company, in
terms of assets, also determines the upper limit of turnover. Without this company, the
upper limit of turnover for Southern companies would be 8.5bn lire. The lower limit
of turnover in the San Mauro sample derives from one company that traded for four
years, after which it went bankrupt. Excluding this company, the lower limit would be
236m lire.
III Capital structure
This section assesses the relative importance of subsidies as a source of finance of the
companies in the two samples. The analysis covers the 1971-91 period. It has been
broken into sub-periods in the attempt to identify possible changes in the capital
structure of these companies. Moreover, as not all 54 companies in the two samples
traded or remained public from 1971 to 1991, this choice allows a clear identification
of the number of company records available in each sub-period.

D:\Documents and Settings\les04rl\Local Settings\Temporary Internet Files\OLK63\SpadavecchiaPaper.doc29/08/2006
11
The components of liabilities have been calculated as a weighted average. The share
in total liability of each source of finance (short-term bank loans, commercial debts,
long-term borrowed capital, equity, loans and contributions by partners, paid-up
capital) has been computed for each district in each sub-period using the following
formula (Edwards and Fisher, 1994):
t=1975 t=1975
e.g. 1971-75: Σ iJ t / Σ It
t=1971 t= 1971
n
Where iJ t denotes the amount of finance of type j in year t, It= Σ iJ
t
J=1
(there are n different types of finance).
Table 8 displays the greater reliance of companies in the Barletta sample on subsidies.
Not only do subsidised loans represent a higher percentage of total liabilities, but also
the implicit subsidy8 within soft loans was much higher for Southern firms. This
reflects the fact that the differential between the medium-term non-subsidised interest
rate and the average subsidised interest rate was higher in the South than in the Centre
and North, and the redemption period was longer. The variation in the implicit
subsidy within each sample and across sub-periods is not affected by the redemption
period, which remained constant throughout the whole period of analysis, but rather
reflects the fluctuations in the differential between non-subsidised and average
subsidised interest rates in the South and in the Centre and North.
8The implicit subsidy in a subsidised loan has been calculated using the following formula S= L {1- [rA(1+rA)N/ (1+rA)N-1] [(1+rM)N-1/ rM(1+rM)N] } where: L = loan; rM = non-subsidised long-term interest rate; rA = subsidised interest rate; N =length of the loan (Faini, 1985).

D:\Documents and Settings\les04rl\Local Settings\Temporary Internet Files\OLK63\SpadavecchiaPaper.doc29/08/2006
12
Southern firms display higher shares of long-term debts, mostly consisting of
subsidised loans, whereas non-subsidised long-term credit is a more important source
of finance for companies in the North-Eastern sample. Therefore, it seems clear that
companies in the Southern sample reach shares of long-term capital comparable to the
North-Eastern sample only with the substantial help of subsidies, consistent with
regional policy’s aim of increasing the availability of long-term capital in the South.
Moreover, subsidies seem to have also a crowding-in effect, suggested by the higher
value of market long-term capital (total LTBC minus subsidies in brackets) presented
by subsidised firms in both samples.
Reserves are a key element in this analysis for two reasons. First, reserves include
grants, and secondly, they are built up with undistributed profits, hence reserves
represent the company’s ability to self-finance. For the 1971-75 and 1976-80 periods,
companies in the North-Eastern sample show a low weight of reserves. This is due to
the presence of start-up companies in these periods (two in 1971-75 and two in 1976-
80). Moreover, the reserves of the largest company in each period were sharply
decreasing while their fixed net assets were increasing, indicating that both were
using reserves to finance investment. For the later periods, the higher percentage of
reserves and the higher rates of return in the North-Eastern sample demonstrate a
greater ability to self-finance by reinvesting profits, whereas Southern companies
reached comparable percentages of reserves only with the considerable help of grants.
Commercial debts represent the single largest component of companies’ liabilities.
This is not surprising considering the long period over which companies can pay their

D:\Documents and Settings\les04rl\Local Settings\Temporary Internet Files\OLK63\SpadavecchiaPaper.doc29/08/2006
13
suppliers. Between 1985 and 1987 Southern firms paid their suppliers after a period
varying from a minimum of 60 days for the food-processing sector, to 150 and 200
days respectively in clothing/textiles and the engineering sectors. In the same years,
firms in the same sectors in the Centre and North paid their suppliers after 62, 130 and
190 days (Siracusano and Tresoldi, 1990). Therefore, the balance sheets of companies
in the clothing/textile sector, which are relatively numerous in the Southern sample,
include goods and services bought in the last five months.
The rate of return on long-term capital clearly shows the lower profitability of
Southern companies in the sample (particularly low during 1971-75, mainly due to a
large number of start-up companies), which can be explained in both micro- and
macroeconomic terms. Southern small firms (20-100 employees) show a slower
turnover of inventories (for the textile and footwear sectors - 108 days in the South
and 68 in the rest of the country) and a lower utilisation of production capacity - a
consequence of the more limited market in the South and smaller export opportunities
(Siracusano and Tresoldi, 1990, pp. 113-119 and pp. 125-127). Southern industry was
less able to exploit scale economies internal and external to the firm, than firms
located in more developed areas of the country (Rossi and Toniolo, 1995). In addition,
Southern companies did not exploit economies of specialisation, as the Southern
manufacturing sector relied far less on vertical specialisation (Giannola, 1990).
Furthermore, it is possible that the lower productivity of Southern companies could
also be due to the use of more obsolete equipment. A study of depreciation rates for
companies within the sample reveals that in the 1980s North-Eastern companies -

D:\Documents and Settings\les04rl\Local Settings\Temporary Internet Files\OLK63\SpadavecchiaPaper.doc29/08/2006
14
which were then enjoying particularly high rates of return - were replacing their
equipment more quickly than their Southern counterparts (Spadavecchia, 2003).9
Comparing the rate of return of subsidised and non-subsidised companies in the two
samples in the 1980s (when the North-Eastern sample includes a good number of
observations), it seems clear that subsidised firms are more profitable in the Southern
sample, whereas the opposite applies to North-Eastern firms. However, the
observation of financial indicators offers no firm ground to make inferences about the
effectiveness of the policy. If subsidised firms seem to enjoy no particular benefits in
comparison with non-subsidised firms, as in the North-Eastern sample, it could be
inferred that the policy was ineffective. In the case of better financial indicators
displayed by subsidised Southern firms, it might be argued that the policy generated
dependency and that firms could perform well only when subsidised. This would be
an undesirable outcome, resulting from subsidies breaking the nexus between the
firms’ performance and efficiency, which in turn entails the permanent capture of
government funds and in extreme cases the bailing out of troubled firms (Calomiris
and Himmelberg, 1995). Moreover, dividing the companies into just two groups -
subsidised and non-subsidised - can hide some interesting differences. After all, the
non-subsidised group includes companies that were not subsidised in the specific sub-
period but were subsidised a few years later, companies that had been subsidised in
previous years, and companies that were never subsidised.
IV The effectiveness of subsidies for the Barletta and San Mauro samples.
9 For a more extensive discussion of the importance of subsidies as a source of finance for companies within Italian industrial districts see Spadavecchia (2005).

D:\Documents and Settings\les04rl\Local Settings\Temporary Internet Files\OLK63\SpadavecchiaPaper.doc29/08/2006
15
This section assesses the effectiveness of subsidies by analysing companies at various
stages of their life cycle, i.e. before receiving subsidies, while being subsidised and
after receiving subsidies, and comparing them to companies that were never
subsidised. This methodology has been designed by Bagella and Caggese (1995), but
it has never been applied. Their study is based on balance sheet indicators and
qualitative information on 3,852 manufacturing firms, trading between 1989 and
1991. However, the only information about subsidies is whether or not the company
has been subsidised in the period, and from which scheme it benefited (Mediocredito
Centrale, 1995). Therefore, they could only compare the profitability and risk of
subsidised and non-subsidised companies in the country as a whole and by regions,
but admittedly they left open another issue, namely whether subsidies had a positive
effect on the recipient firms' ability to stay on the market, once they were no longer
subsidised.
Subsidies should increase the profitability of the recipient firms, meaning moving the
recipient company from position (1) in the graph below, characterised by low and
highly variable profit, to position (2), with higher and less variable profit. Subsidised
companies should move from positions (1) to position (2) in the graph as subsidies
increase the recipient companies’ profits and decrease the variability of profits, by
providing an additional fixed component to their profits. However, in order to assess
the effectiveness of subsidies it is crucial to study the position occupied by the
company in the post-subsidy stage (Bagella and Caggese, 1995).
Graph 1 around here

D:\Documents and Settings\les04rl\Local Settings\Temporary Internet Files\OLK63\SpadavecchiaPaper.doc29/08/2006
16
For companies in the post-subsidy stage to return to position 1 would mean that their
profitability could be improved only by constant subsidies, which would entail a
permanent capture of government funds, the breaking of the link between firms’
performance and their efficiency, and in extreme cases the bailing out of troubled
firms. Moreover, if the profitability of a company in the post-subsidy stage goes back
to position 1, the company will be perceived by banks as a ‘bad company’ and
therefore will be credit rationed, whereas if it remains in position 2 or moves to the
‘competitive firm’ position it should not experience credit rationing again (Bagella
and Caggese, 1995). Therefore, for subsidies to be considered effective, it is crucial
that companies not only move from position 1 to position 2 when subsidised, but also
that companies in the post-subsidy stage at least remain in position 2, or preferably,
move even further to the right on the graph, closer to the ideal position of
‘competitive firm’. This should happen because as the firm is a learning organisation
(Lamoureaux, Raff and Temin, 1999) the recipient company should learn how to
conduct its business better while in the subsidised stage.
The two small samples used in this analysis allow the assessment of the positions
occupied by companies in the post-subsidy stage in the graph above. The samples
have been constructed with companies’ raw records, therefore it has been possible to
identify the subsidies and their timing, and divide accordingly the companies’ life into
stages, i.e. before receiving subsidies, while subsidised and after receiving subsidies,
and separate them from companies that were never subsidised. This subdivision
reduces considerably the number of observations available for each group, and
therefore the division of observations into sub-periods, applied in tables 8 and 9, has
been abandoned and the observations have been aggregated for the whole 1971-91

D:\Documents and Settings\les04rl\Local Settings\Temporary Internet Files\OLK63\SpadavecchiaPaper.doc29/08/2006
17
period. Due to the small size of the samples, the results of this analysis should be
considered as indicative, nevertheless it seemed worthwhile to throw some light on a
hitherto unexplored issue.
Table 10 around here
The three sub-samples - pre-subsidy, subsidised and post-subsidy - portray a
hypothetical life cycle of companies in the two samples, from smaller and younger
when unsubsidised to larger and older in the subsidised stage. However, while
companies in the North-Eastern sample continue to grow, as measured by the balance
sheet size, in the post-subsidy stage, companies in the Southern samples become
smaller. As table 11 below shows, this is due to two factors: Southern companies in
the post-subsidy stage were only slightly larger than the average while in the
subsidised group, in terms of balance sheet size. In addition to this, the size of their
balance sheets decreases considerably in the post-subsidy stage also due to the rapid
decrease in size of the two companies that are failing while in this stage. In contrast,
three out of the four North-Eastern companies in the post-subsidy stage were not only
well above the average for the subsidy-stage companies, but also the size of their
balance sheet kept increasing in the post-subsidy stage. The fourth North-Eastern
company follows a pattern closer to that described for the Southern post-subsidy
companies.
Table 11 around here
D:\Documents and Settings\les04rl\Local Settings\Temporary Internet Files\OLK63\SpadavecchiaPaper.doc29/08/2006
18
The three North-eastern companies that saw continued balance-sheet growth left the
subsidised stage because they exceeded the upper limit of eligibility for subsidies (2bn
lire). Two of these started issuing bonds and managed to secure sums far larger than
the soft loans received by companies in the same sample at an interest rate slightly
lower than the market one.
As for explaining the reason why other companies in the sample abandoned the
system of subsidies or never entered it, it was not possible to make inferences in
specific cases. It is possible that these companies’ applications for soft loans were
rejected; on the basis of unpublished sources provided by the Ministry of Industry it
has been estimated that the percentage of rejected applications in the North-East
varied between 10% and 20%. Moreover, according to a 1989-91 survey of 5,000
manufacturing companies in the whole country, 35% did not apply for subsidies
despite being aware of them. Firms were discouraged by the delays in the extension of
subsidies, the limited availability of funds and the complexity of the application
procedure, with the last reason being particularly discouraging for small firms
(Ministero dell’Industria and Mediocredito Centrale, 1994).
The younger age of companies in the pre-subsidy stage is supported by previous
research. Using interviews and questionnaires, this demonstrated that out of 124
enterprises located in the South only 34 received subsidies in the start-up stage,
whereas nearly all were subsidised during their trading life (Del Monte, 1984). The
difficulty of securing subsidies in the early stage has been explained by the
involvement of the credit institutions, which are much more cautious in extending

D:\Documents and Settings\les04rl\Local Settings\Temporary Internet Files\OLK63\SpadavecchiaPaper.doc29/08/2006
19
loans to new businesses rather than to companies with a proven track record (Del
Monte and Luzenberger, 1989).
'Never subsidised' companies are the smallest group within the Southern sample and
in both samples, they are the group with the highest rate of failures, thus suggesting
that subsidies may have reduced the probability of failure.
As shown in section I, the direct aim of national and regional subsidies was to
promote firms’ investment activity. Therefore, the Bagella and Caggese methodology
has been adopted to assess whether subsidies were effective in this respect. Table 12
displays the results.
Table 12 around here
Table 12 shows that Southern companies reach the highest level of investment when
they are subsidised, particularly when looking at investment in absolute terms. The
investment activity declines sharply in the post-subsidy period. This can be due either
to the high level of fixed assets previously reached, which would reduce the scope for
further profitable investment, or else to the sharp decline of the companies’
profitability (see table 14) and increasing financial constraints (table 18). North-
Eastern companies behave in the ‘ideal’ way, as their investment activity increases in
the post-subsidy period.
In a graph similar to graph 1 above, with investment instead of profits on the X axis,
both Southern and North-Eastern companies move from position 1 to position 2 when
D:\Documents and Settings\les04rl\Local Settings\Temporary Internet Files\OLK63\SpadavecchiaPaper.doc29/08/2006
20
they receive subsidies. However, when Southern companies are no longer subsidised
they return to position 1, whereas North-Eastern companies would move further to the
right towards the ‘competitive firm’ position. This implies that in order to promote the
investment activity of Southern firms these should be subsidised constantly, which in
turn indicates the ‘dependence’ of recipient firms on subsidies and a permanent
capture of government funds.
In order to investigate whether there is an association between increases in subsidies
and increases in investment, the coefficient of correlation between these two variables
has been calculated. These calculations rely on a limited number of observations,
particularly for grants and fiscal subsidies in the North-Eastern sample, which were
much less frequent in the San Mauro sample than in the Barletta sample.
Table 13 around here
The results indicate clearly that there is a positive correlation between subsidies and
investment. The strength of the correlation varies with the types of subsidy, but can be
considered satisfactorily strong, particularly when taking into account that these
coefficients of correlation focus on one specific type of long-term capital, whereas a
multiplicity of factors influence the investment decision of the firms.
The lower coefficient presented by subsidised loans can be attributed to the difficulty
of pointing out the exact time lag between the receipt of such subsidies and
investment or vice versa. The Cassa was legally permitted to undertake financial
commitment in excess to its current financial means, which entailed the possibility

D:\Documents and Settings\les04rl\Local Settings\Temporary Internet Files\OLK63\SpadavecchiaPaper.doc29/08/2006
21
that firms would receive the secured grant or subsidised loan after undertaking the
investment. The Barletta sample displays positive coefficients between implicit
subsidies and investment when lagging both investment and subsidies (with values
between 0.15 and 0.21), indicating that companies undertook investment both before
and after receiving the subsidy. Therefore, any type of time lag will capture only part
of the investment.
The explanation of the low coefficient displayed by the North-Eastern samples lies in
two observations, the exclusion of which would change the coefficient to 0.88,
keeping the same time lag. In both cases, considerable investment was undertaken in
the same year in which the subsidised loan was received, and therefore the correlation
between subsidies and investment in these two cases is not captured by lagging
subsidies by one year.
Table 14 around here
Table 14 presents two measures of profitability: return on equity and return on long-
term capital. Southern companies shift from low profitability and high risk before
subsidies to higher profitability and similar risk when subsidised. In the post-subsidy
stage they become much less profitable and less risky, therefore they do not remain in
position 2. Return on equities and return on long-term capital reach negative values in
the post-subsidy stage, for two out of the six companies are in the process of failing
and are consistently making losses.

D:\Documents and Settings\les04rl\Local Settings\Temporary Internet Files\OLK63\SpadavecchiaPaper.doc29/08/2006
22
North-Eastern companies display the ‘ideal’ behaviour, as far as their profitability is
concerned. They move from position 1 before subsidies to position 2 when subsidised,
and in the post-subsidy stage they move closer to the ‘competitive firm’ position.
Companies never subsidised in both samples seem to opt for a high-profit and high-
risk strategy, which entails a higher probability of failures, as shown in table 10.
Southern companies with access to subsidies seem to pursue a ‘survival’ strategy,
whereas unsubsidised ones pursue a ‘profit maximising’ strategy, or in the words of
the sociological literature subsidised entrepreneurs prefer to reap benefits from
institutions and abandon the economic rationale (Trigiglia, 1992). However, this
might not be the case and Southern subsidised firms might also be pursuing an
economic rationale.
Tables 8 and 9 indicated the different conditions in which companies in the two ID
samples cease their activity. Southern firms fold after a long period of losses and
when they are financially distressed, while North-Eastern firms close down as soon as
their turnover and profits are decreasing and their level of capitalisation (in term of
finance) is very high. This indicates that the priority of Southern firms is to continue
trading, whereas the priority of the North-Eastern firms is making profits. Moreover,
the low capitalisation of Southern companies, particularly the scarcity of company-
owned capital (see indicator E/FNA in tables 8 and 9) suggests that Southern
companies would have very little capital, if any, to cover possible losses, which is not
the case for their North-Eastern counterparts.
D:\Documents and Settings\les04rl\Local Settings\Temporary Internet Files\OLK63\SpadavecchiaPaper.doc29/08/2006
23
With the obvious historical differences, the low-profit low-risk strategy of Southern
subsidised firms can be compared to the behaviour of medieval English peasants as
explained by McCloskey (1976). Before the enclosures (consolidated holdings) of the
seventeenth and eighteenth centuries, farmers opted for scattered plots, despite the
fact that the former provided them with a higher average income. McCloskey explains
that this happened because the farmers’ priority was avoiding disaster, where disaster
means falling below the subsistence level. Scattered plots produced a lower but less
variable income than consolidated land, therefore by choosing the former peasants
reduced their chances of incurring disaster.
The scenario in which companies in the two ID samples operate, as far profitability is
concerned, is represented in the following graph, where net profit is defined as total
revenues minus total costs.
Graph 2 around here
In this case the disaster is the failure of the firm and the decision rule is minimising
the probability of failure. If the failure threat were in position F1 neither high-profit
high-risk (I2) nor low-profit low-risk (I1) investment endanger the company, therefore
an economically rational company would chose I2. If the failure threat were in
position F2, it would choose I1, as this would minimise its possibility of failure. If the
failure threat were in position F3 the company has no choice: it needs high profits to
continue trading, and has to undertake I2.

D:\Documents and Settings\les04rl\Local Settings\Temporary Internet Files\OLK63\SpadavecchiaPaper.doc29/08/2006
24
Therefore, if F1 represents the failure threat for North-Eastern companies and F3 for
Southern companies, both groups should choose I2: North-eastern companies to
maximise their profits, and Southern companies to survive. However, there is another
element to be taken into account, namely subsidies. The following graph shows what
happens when subsidies are introduced in this scenario.
Graph 3 around here
Subsidies decrease the cost of the investment and therefore increase the net profit,
moving it from P1 to P1s. Similarly, subsidies move P2 to P2s but I2s entails a higher
probability of falling behind F3, therefore the subsidised company will choose I1s.
However, in the long term, choosing I1s is economically rational only if the scenario
in graph 3 is permanent - after all, English peasants chose scattered plots for centuries
- meaning if there is the possibility of receiving subsidies frequently. If a company
knew that after its current subsidy ended it had to undertake a high-risk high-profit
investment to survive, it would perceive that undertaking this investment while still
being subsidised would reduce the risk of such investment. In graph 3, the area behind
F3 in the case of I2s is smaller than in the case of I2. In this case, the company would
reap higher profits, which would make its financial situation sounder (for instance
increasing its reserves and thus increasing its credit worthiness) and therefore push its
own F3 to the left. Moreover, Southern subsidised companies will keep undertaking I1s
because frequent subsidies increase the potential loss that partners would face in case
of the company failure, as it would mean losing the company income plus frequent

D:\Documents and Settings\les04rl\Local Settings\Temporary Internet Files\OLK63\SpadavecchiaPaper.doc29/08/2006
25
and considerable subsidies. In other words, the access to frequent subsidies increases
the opportunity cost of a company's failure.
Therefore, the different levels of the failure threat and the frequency of the subsidies
can explain the differences in the behaviour of companies in the two ID samples.
Companies in the North-Eastern sample have a failure threat level so low (see for
instance their level of overcapitalisation in terms of finance in tables 9 and 15) that
whether non-subsidised or subsidised they choose a high-profit and high-risk
investment. Companies in the Southern ID sample, having a higher level of failure
threat (see for instance their financial capitalisation) choose a high-profit and high-
risk strategy if that is the only possibility to survive, i.e. if they belong to the
unsubsidised group.
Table 15 around here
Considering the sharp decrease in the profitability of Southern companies in the post-
subsidy stage (table 14), it is not surprising that these companies return to a situation
of financial constraint, both in the long and short term. In contrast, North-Eastern
companies, the profitability of which increases further in the post-subsidy stage,
become even less financially constrained (Bagella and Caggese, 1995). Low profits
do not allow Southern companies, whether in the subsidised or in the post-subsidy
stage, to build high levels of reserves and their financial under-capitalisation does not
make these companies creditworthy. The situation is exacerbated in the case of 'post-
subsidy' companies, by the lack of subsidies themselves and their crowding-in effect
shown in tables 8 and 9.

D:\Documents and Settings\les04rl\Local Settings\Temporary Internet Files\OLK63\SpadavecchiaPaper.doc29/08/2006
26
V Conclusions
V. 1 Risk and the effectiveness of subsidies
The analysis conducted in this paper pointed out that although subsidies represented a
smaller source of finance for North-Eastern companies, they were more effective than
for Southern firms. North-Eastern companies not only invest more and are more
profitable during their subsidised period than in the pre-subsidy period, but also their
investment activity and profitability increase in their post-subsidy period. Moreover,
they become increasingly less risky through the various stages. Therefore, the lower
profitability of non-subsidised companies in the North-Eastern sample (table 9),
which would suggest the failure of the subsidies, conceals their real effectiveness.
The misleading results of the North-Eastern sample in table 9 are therefore due to the
aggregation of pre-subsidy, post-subsidy and ‘never subsidised’ firms in the non-
subsidised group, among which the post-subsidy group presents the highest return and
lowest risk.
The higher rates of return displayed by subsidised companies in the Barletta sample
(table 8) conceal the limited effectiveness of the regional subsidies. Southern
companies’ investment activity and profitability increase during the subsidy stage, but
profitability in particular fell when they were no longer subsidised. Moreover, it is
clear that subsidised and post-subsidy companies opt for low-profit and low-risk
investment, as opposed to the high-profit and high-risk strategy followed by ‘never
subsidised’ companies. The interpretation put forward in this paper singles out three
D:\Documents and Settings\les04rl\Local Settings\Temporary Internet Files\OLK63\SpadavecchiaPaper.doc29/08/2006
27
factors that determined such an outcome: the riskier economic environment in which
Southern firms operate, and the amount and frequency of subsidies. Under these
conditions, the choice of a low-profit and low-risk strategy of Southern firms in the
sample becomes the most rational. Therefore, the analysis does not support the
sociological interpretation according to which Southern entrepreneurs abandon the
economic rationale and reap benefits from institutions and/or the political
environment. Southern entrepreneurs in the sample indeed benefit from institutions
but the rationale remains purely economic.
V.2 Wider implications
The policy for the South has been criticised on several accounts. In particular,
subsidised credit and capital grants have been criticized as affected by an inefficient
bureaucracy, in turn affected by bribery; it is also claimed that financial subsidies did
not always translate into productive investment but may have been used to fuel
liquidity or undertake financial speculation. Various works stress that large
investments in capital-intensive sectors were the main beneficiary of subsidies and
that since the lifting of the size limit of eligible companies, in 1962, the system of
subsidies in the South was diverted from its original purpose of developing an organic
network of small and medium-sized firms. Conversely, subsidies did not favour the
development of small local firms and the industrial policy for the South has failed to
promote a self-sustaining industrial development similar to that which took place in
the North-East. However, a study by Faini (1985), based on subsidies extended by the
Cassa by company size between 1970 and 1983, found no evidence of small firms
having less access to subsidies than large firms.

D:\Documents and Settings\les04rl\Local Settings\Temporary Internet Files\OLK63\SpadavecchiaPaper.doc29/08/2006
28
The analysis of the two ID samples supports only part of the criticisms mentioned
above. Consistently with the Faini study, the large number of subsidised companies in
the Southern sample (26 out of 32, the corresponding figure for the North-Eastern
sample being 11 out of 21) does not indicate that small firms were at a disadvantage
in accessing subsidies. As for the way Southern companies used subsidies, both the
Bagella and Caggese method and the coefficients of correlation indicate an
association between subsidies and investment. Moreover, subsidies were extremely
important for the capitalisation (in financial terms) of such firms. Only when
companies in the Southern sample were subsidised did they cover their fixed assets
with long-term capital. Therefore, it seems unlikely that companies in the Southern
sample were using subsidies for purposes other than financing investment.
However, some of the criticisms are confirmed by the analysis of the two samples.
The deterioration of the economic performance of Southern firms in the post-subsidy
stage sharply contrasts with the improved performance of the North-Eastern
counterparts. This clearly indicates the dependence of companies in the Southern
sample on subsidies, whereas the North-Eastern firms show autonomy from subsidies,
as their performance improves even in the absence of subsidies. Therefore, although
Southern firms in the sample indicate an association between subsidies and
investment, the growth promoted by subsidies cannot be considered ‘self-sustaining'
as in the North-East.
Yet another point on which the effectiveness of a policy can be tested is whether it
can be an effective mechanism for correcting capital market failures. Echoing the
D:\Documents and Settings\les04rl\Local Settings\Temporary Internet Files\OLK63\SpadavecchiaPaper.doc29/08/2006
29
Gerschenkronian argument, the World Bank stresses that government credit can be an
effective mechanism for correcting capital market failures in less developed regions
where the capital shortage renders private banking unviable (Calomiris and
Himmelberg, 1994). However, even in developed and industrialised regions,
government credit can correct capital market imperfections, such as those due to
asymmetric information, by assuming the cost of monitoring and providing a senior
status to private credit. In this respect North-Eastern subsidies also seem to be more
effective. Subsidised companies in both samples display a higher percentage of long-
term market borrowed funds as compared to non-subsidised companies, and therefore
subsidies seem to have a crowding-in effect. However, while companies in the
Southern sample return to a situation of financial constraints in the post-subsidy stage,
similar to financial constraints already experienced in the pre-subsidy stage, North-
Eastern companies enjoy higher levels of liquidity in their post-subsidy stage. This
result is not surprising considering that the profitability of companies in the Southern
sample decreases in the post-subsidy stage whereas it increases in the North-Eastern
sample.

D:\Documents and Settings\les04rl\Local Settings\Temporary Internet Files\OLK63\SpadavecchiaPaper.doc29/08/2006
30
Appendix A: The regions of Italy
Figure 1 here
Appendix B: List of companies and records available
Companies are designated with three letters, of which the first refers to the area
(North or South), while the following two are the initials of the company’s name. The
first date corresponds to the year of establishment, the following dates to the period
for which records are available. When dates of establishment or change of public
status specify the month, it means that the relevant record (i.e. deed of incorporation
or the official document recording the change in the company’s legal status) was
available in the company’s folder. When the month it is not specified it means that the
relevant record was not available, but the year was mentioned in one of the reports
available.
D:\Documents and Settings\les04rl\Local Settings\Temporary Internet Files\OLK63\SpadavecchiaPaper.doc29/08/2006
31
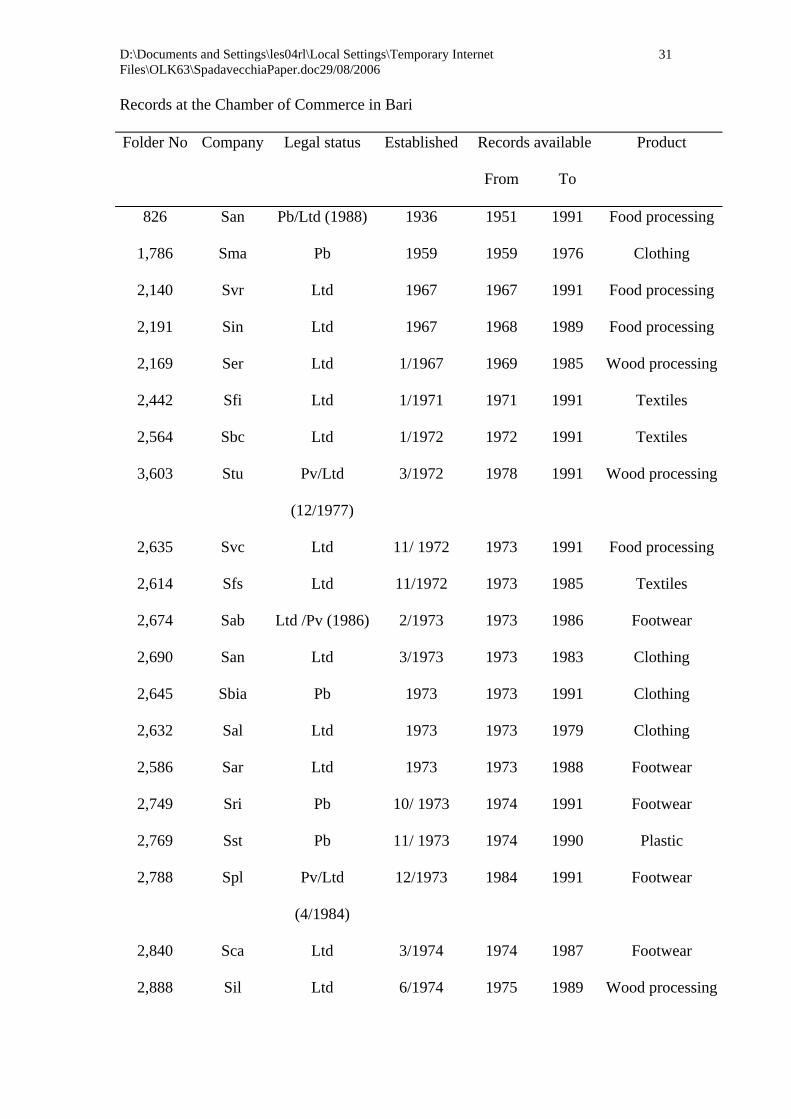
Records at the Chamber of Commerce in Bari
Folder No Company Legal status Established Records available Product
From To
826 San Pb/Ltd (1988) 1936 1951 1991 Food processing
1,786 Sma Pb 1959 1959 1976 Clothing
2,140 Svr Ltd 1967 1967 1991 Food processing
2,191 Sin Ltd 1967 1968 1989 Food processing
2,169 Ser Ltd 1/1967 1969 1985 Wood processing
2,442 Sfi Ltd 1/1971 1971 1991 Textiles
2,564 Sbc Ltd 1/1972 1972 1991 Textiles
3,603 Stu Pv/Ltd
(12/1977)
3/1972 1978 1991 Wood processing
2,635 Svc Ltd 11/ 1972 1973 1991 Food processing
2,614 Sfs Ltd 11/1972 1973 1985 Textiles
2,674 Sab Ltd /Pv (1986) 2/1973 1973 1986 Footwear
2,690 San Ltd 3/1973 1973 1983 Clothing
2,645 Sbia Pb 1973 1973 1991 Clothing
2,632 Sal Ltd 1973 1973 1979 Clothing
2,586 Sar Ltd 1973 1973 1988 Footwear
2,749 Sri Pb 10/ 1973 1974 1991 Footwear
2,769 Sst Pb 11/ 1973 1974 1990 Plastic
2,788 Spl Pv/Ltd
(4/1984)
12/1973 1984 1991 Footwear
2,840 Sca Ltd 3/1974 1974 1987 Footwear
2,888 Sil Ltd 6/1974 1975 1989 Wood processing
D:\Documents and Settings\les04rl\Local Settings\Temporary Internet Files\OLK63\SpadavecchiaPaper.doc29/08/2006
32
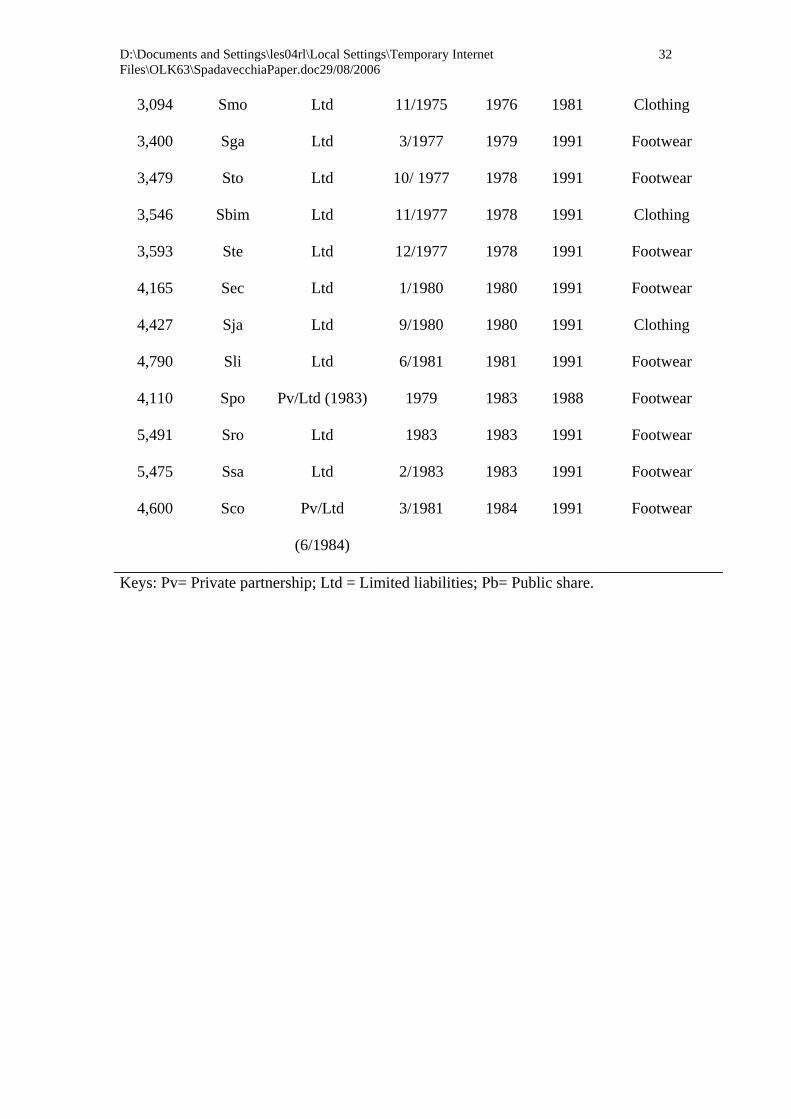
3,094 Smo Ltd 11/1975 1976 1981 Clothing
3,400 Sga Ltd 3/1977 1979 1991 Footwear
3,479 Sto Ltd 10/ 1977 1978 1991 Footwear
3,546 Sbim Ltd 11/1977 1978 1991 Clothing
3,593 Ste Ltd 12/1977 1978 1991 Footwear
4,165 Sec Ltd 1/1980 1980 1991 Footwear
4,427 Sja Ltd 9/1980 1980 1991 Clothing
4,790 Sli Ltd 6/1981 1981 1991 Footwear
4,110 Spo Pv/Ltd (1983) 1979 1983 1988 Footwear
5,491 Sro Ltd 1983 1983 1991 Footwear
5,475 Ssa Ltd 2/1983 1983 1991 Footwear
4,600 Sco Pv/Ltd
(6/1984)
3/1981 1984 1991 Footwear
Keys: Pv= Private partnership; Ltd = Limited liabilities; Pb= Public share.

D:\Documents and Settings\les04rl\Local Settings\Temporary Internet Files\OLK63\SpadavecchiaPaper.doc29/08/2006
33
Records at the Chamber of Commerce in Forlì
Folder n. Company Legal status Established Records available Product
from to
2,996 Nla Ltd/Pv (1966-71) 1955 1956 1991* Footwear
3,751 Nde Pb 1962 1963 1967 Footwear
4,442 Nci Pv/Ltd (10/1974) 7/1968 1974 1991 Metal chairs
5,676 Neu Ltd 3/1974 1974 1991 Footwear
equipment
5,212 Nrs Pv/Pb (12/1975) 4/1967 1976 1991 Footwear
5,581 Nwi Ltd 12/1973 1974 1979 Footwear
7,280 Nma Ltd 2/1978 1978 1987 Footwear
8,146 Nal Pb 9/1979 1979 1991 Clothing
8,367 Nca Pv/Pb (2/ 1980) 9/1966 1981 1991 Footwear
4,935 Npo Pv/Pb (12/1980) 2/1972 1981 1991 Footwear
3,484 Nfa Pv/Pb (4/ 1981) 1/1961 1981 1991 Footwear
4,662 Nfr Pv/Pb (6/ 1982) 2/1970 1982 1991 Clothing
10,471 Nri Ltd 6/1982 1982 1991 Footwear
10,417 Nrf Ltd 5/1982 1982 1991 Leather items
4,351 Nvi Pv/Ltd (11/1982) 8/1967 1983 1985 Footwear
6,934 Nrm Pv/Ltd (2/1983) 6/1969 1983 1987 Clothing
11,850 Npn Ltd 4/1984 1984 1991 Footwear
5,325 Nrt Pv/Ltd (9/1985) 4/1973 1985 1991 Paper/card
boxes
12,904 Nti Ltd 4/1985 1985 1991 Footwear
11,263 Nip Pv/Ltd (5/1989) 9/1983 1989 1991 Packaging

D:\Documents and Settings\les04rl\Local Settings\Temporary Internet Files\OLK63\SpadavecchiaPaper.doc29/08/2006
34
13,580 Npl Pv/Ltd (7/1989) 12/1985 1989 1991 Leather items
Keys as above; * excluding 1966-71 and 1973.
REFERENCES
Allen, K. and M.C. MacLennan (1970), Regional Problems and Policies in Italy and
France (Allen & Unwin).
Annesi, M. (1973), Nuove Tendenze dell’Intervento Pubblico nel Mezzogiorno
(Giuffrè).
Artobolevskiy, S.S. (1997), Regional Policy in Europe (J. Kingsley).
Asso, P.F and G. Raitano (1999), ‘Trasformazione e sviluppo del credito mobiliare
negli anni del governatorato Menichella’, in F. Cotula (ed.), Stabilità e sviluppo negli
anni cinquanta , vol. 3 Politica bancaria e struttura del sistema finanziario (Laterza),
pp. 309-589.
Bagella, M. and A. Caggese (1995), ‘Struttura del capitale, finanziamenti agevolati e
redditività delle imprese manifatturiere italiane’, Rassegna Economica, Vol. 59, No.
4, pp. 813-837.
Bagella, M., L. Becchetti and A. Caggese (1996), ‘Financial constraints on
investments: evidence from the direct revelation of Italian firms’, Rivista di Politica
Economica, vol. 86, Nos 11-12, pp. 35-62.
D:\Documents and Settings\les04rl\Local Settings\Temporary Internet Files\OLK63\SpadavecchiaPaper.doc29/08/2006
35
Banca d’Italia (1978), Relazione Annuale (Banca d’Italia).
Barca, L. and G. Manghetti (1976), L’Italia delle Banche (Editori Riuniti).
Cafiero, S. and G.E. Marciani (1991), ‘Quarant’anni di intervento straordinario (1950-
1989)’, Rivista Economica del Mezzogiorno, Vol. 5, No. 2, pp. 249-273.
Calomiris, C.W. and C.P. Himmelberg (1994), ‘Directed Credit Programs for
Agriculture and Industry. Arguments from Theory and Facts’, in Proceedings of the
World Bank Annual Conference on Development Economics, 1993 (World Bank), pp.
113-137.
Calomiris, C.W. and C. P. Himmelberg (1995), Government Credit Policy and
Industrial Performance: Japanese Machine Tool Producers, 1963-1991, World Bank
Policy Research Working Paper, no 1434 (World Bank).
Castronuovo, S. A. (1992), ‘Mezzogiorno: the Theory of Growth and the Labour
Market’ p. 346, Journal of Regional Policy, Vol. 12, No.2, pp. 333-365.
Confederazione General dell’Industria Italiana (CGIL) (1970), La Politica di Sviluppo
Economico del Mezzogiorno (CGIL).
D’Amico, N., G. Parigi and M. Trifilidis (1990), ‘I tassi d’interesse e la rischiosità
degli impieghi bancari nel Mezzogiorno’, in Banca d’Italia, Il sistema finanziario nel

D:\Documents and Settings\les04rl\Local Settings\Temporary Internet Files\OLK63\SpadavecchiaPaper.doc29/08/2006
36
Mezzogiorno, Numero speciale dei Contributi all’analisi economica (Banca d’Italia),
pp. 305-343.
D’Antone L. (1997), ‘<< Straordinarietà>> e Stato ordinario’, in F. Barca (ed.), Storia
del Capitalismo Italiano dal Dopoguerra ad Oggi (Donzelli), pp. 579-625.
Del Monte, A. (1984), ‘The Effects of Regional Policy on the Industrial Development
of the South of Italy’, Mezzogiorno d’Europa, Vol. 4, No. 4, pp. 563-583.
Del Monte, A. and R. De Luzenberger (1989), ‘The Effect of Regional Policy on New
Firm Formation in Southern Italy’, Regional Studies, Vol. 23, No. 3, pp. 219-230.
Edwards, J. and K. Fisher (1994), Banks, Finance and Investment in Germany
(Cambridge University Press).
Faini, R. (1985), ‘Incentivi e piccole e medie imprese nel Mezzogiorno’, Ricerche
Economiche, Vol. 39, No. 3, pp. 318-336.
Faini, R., G. Galli and C. Giannini (1992), ‘Finance and Development: the Case of
Southern Italy’, in A. Giovannini (ed.), Finance and Development: Issues and
Experience (Cambridge University Press), pp. 158-214.
Federico, G. and R. Giannetti (1999), ‘Italy: Stalling and Surpassing’ in J. Foreman-
Peck and G. Federico (eds.), European Industrial Policy. The Twentieth-Century
Experience (Oxford University Press), pp.124-151.

D:\Documents and Settings\les04rl\Local Settings\Temporary Internet Files\OLK63\SpadavecchiaPaper.doc29/08/2006
37
Garavini, R., F. Calistri and O. Cilona (1988), La Quarta Italia (Ediesse).
Gerschenkron, A. (1962), Economic Backwardness in Historical Perspective, Harvard
University Press.
Giannola, A. (1990), ‘Mezzogiorno, Industrializzazione e Imprese’, in Banca d’Italia,
Il Sistema Finanziario nel Mezzogiorno, Numero speciale dei Contributi all’Analisi
Economica (Banca d’Italia), pp. 169-206.
Istat (1971, 1981, 1991), Censimento dell’ Industria.
Istat (1996), Rapporto Annuale. La situazione economica del Pease nel 1995 (Istat).
Lamoureaux, N.R., D.M.G. Raff and P. Temin (1999), Learning by Doing in Markets,
Firms and Countries (University of Chicago Press).
McCloskey, D.N. (1976), ‘English Open Fields as a Behaviour towards Risk’,
Research in Economic History, Vol. 1, No. 1, pp. 124-170.
Mediocredito Centrale Osservatorio sulle Piccole e Medie Imprese (1995), Indagine
sulle Imprese Manifatturiere (Mediocredito Centrale).
Ministero dell’Industria and Mediocredito Centrale (1994), Indagine sulle Imprese
Manifatturiere (Mediocredito Centrale).

D:\Documents and Settings\les04rl\Local Settings\Temporary Internet Files\OLK63\SpadavecchiaPaper.doc29/08/2006
38
Organization for Economic Co-operation and Development (OECD), Latest Results
and New Features of Official Action in the Mezzogiorno (Italy) (Paris, 1973).
Pent Formengo G. (1986), ‘Le politiche di ristrutturazione e salvataggio’, in
Momigliano F. (ed.) Le Leggi della Politica Industriale in Italia (Il Mulino), pp. 33-
90.
Pergolesi S. (1988), Il Credito Agevolato alle Imprese Industriali. Le Incentivazioni
Gestite dal Ministero dell’ Industria, 1962-1984 (Franco Angeli).
Petriccione, S. (1976), Politica industriale e Mezzogiorno (Laterza).
Ronzani, S. (1980), ‘Regional incentives in Italy’, in Yuill, D., Allen K. and Hull C.
(eds.) Regional Policy in the European Community. The Role of Regional Incentives
(Croom Helm), pp. 134-156.
Rossi, N. and G. Toniolo (1995), ‘Italy’, in N.F.R. Crafts and G. Toniolo, Economic
Growth in Europe since 1945 (Cambridge University Press), pp. 427-454.
Saraceno, P. (1953), ‘Lo Sviluppo Industriale delle Regioni Meridionali e l’Attivita’
della Cassa per il Mezzogiorno’, L’Industria, Rivista di Economia Politica, Vol. 4,
pp. 651-679.

D:\Documents and Settings\les04rl\Local Settings\Temporary Internet Files\OLK63\SpadavecchiaPaper.doc29/08/2006
39
Saraceno, P. (1967), ‘Rapporto del vicepresidente della Commissione nazionale per la
Programmazione Economica’ in Ministero del Bilancio, La programmazione
economica in Italia, vol. 2 (Ministero del Bilancio), pp. 141-411.
Siracusano F. and C. Tresoldi (1990), ‘Le piccole imprese manifatturiere nel
Mezzogiorno: diseconomie esterne, incentivi, equilibri gestionali e finanziari’, in
Banca d’Italia, Il sistema finanziario nel Mezzogiorno, Numero Speciale dei
Contributi all’analisi economica (Banca d’Italia), pp. 103-143.
Spadavecchia, A. (2005), ‘Financing Industrial Districts in Italy, 1971-1991. A
Private Venture?’, Business History, Vol. 47, No. 4, pp. 569-593.
Trigiglia, C. (1992), Sviluppo senza Autonomia (Il Mulino).
Vanhove, N. (1999), Regional Policy: A European Approach (Ashgate).
Vassalli, F. and G. Visentini (1978), La Legislazione Economica, Settembre 1976-
Agosto 1977: Rassegne e Problemi (Giuffrè).
Yuill, D., K. Allen and C. Hull (1980), Regional Policy in the European Community
(London).
Yuill, D., K. Allen, J. Batchtler and F. Wishlade (1989), European Regional
Incentives (London).

D:\Documents and Settings\les04rl\Local Settings\Temporary Internet Files\OLK63\SpadavecchiaPaper.doc29/08/2006
40
Weiss, L. (1984), ‘Small Firms and the Christian Democratic Party’ (Unpublished
Ph.D. Thesis, University of London).