Embed Size (px)
Citation preview
LICENTIATE T H E S I S
Department of Chemical Engineering and GeosciencesDivision of Extractive Metallurgy
Avoiding Slopping in Top-Blown BOS Vessels
Mats Brämming
ISSN: 1402-1757 ISBN 978-91-7439-173-2
Luleå University of Technology 2010
Mats B
rämm
ing Avoiding Slopping in Top-B
lown B
OS Vessels
ISSN: 1402-1757 ISBN 978-91-7439-XXX-X Se i listan och fyll i siffror där kryssen är


Avoiding Slopping in Top-blown BOS Vessels
Mats Brämming
Licentiate Thesis
Luleå University of Technology Department of Chemical Engineering and Geosciences
Division of Extractive Metallurgy SE-971 87 Luleå
Sweden
2010

Printed by Universitetstryckeriet, Luleå 2010
ISSN: 1402-1757 ISBN 978-91-7439-173-2
Luleå 2010
www.ltu.se

To my fellow researchers:
“Half a league half a league,
Half a league onward,
All in the valley of Death
Rode the six hundred:
'Forward, the Light Brigade!
Charge for the guns' he said:
Into the valley of Death
Rode the six hundred.
'Forward, the Light Brigade!'
Was there a man dismay'd ?
Not tho' the soldier knew
Some one had blunder'd:
Theirs not to make reply,
Theirs not to reason why,
Theirs but to do & die,
Into the valley of Death
Rode the six hundred.”
opening verses of the poem “The Charge Of The Light Brigade”
by Alfred, Lord Tennyson

I
PREFACE
Slopping* is the technical term used in steelmaking to describe the event when the
slag foam cannot be contained within the process vessel, but is forced out through its
opening. This phenomenon is especially frequent in a top-blown Basic Oxygen
Steelmaking (BOS) vessel, i.e. in the LD-process. Slopping reduces process yields
and may lead to discharge of pollutants to the surrounding environment.
This thesis presents a study of the basics of the slopping phenomena in a top-blown
BOS vessel and an investigation into local conditions causing slopping at SSAB
EMEA Metallurgy Luleå’s BOS plant.
An additional part of the thesis involves an investigation into utilizing vessel vibration
measurement as a means of foam height estimation and slopping control. This part
of the thesis work was carried out within an RFCS funded project called IMPHOS
(Improved phosphorous refining). Partners in this project were SSAB EMEA
Metallurgy Luleå, Tata (formerly Corus) Research D & T (IJmuiden, NL and
Teesside, UK) and Swerea MEFOS AB, Luleå, Sweden.
The thesis work, as a whole, has been carried out as a project within the Centre for
Process Integration in Steelmaking, PRISMA, at Swerea MEFOS, Luleå, a centre
supported by the Scandinavian mining and metallurgical industries and by VINNOVA
(The Swedish Governmental Agency for Innovation Systems), SSF (The Swedish
Foundation for Strategic Research) and KK-stiftelsen (The Knowledge Foundation, a
research financier of Swedish institutions of higher education).
* Slopping: to slop = to spill (something) from a container, or to splash
(someone or something) with a liquid……. from Webster’s Third New International Dictionary, ISBN 3-8290-5292-8.

II
III
LIST OF PAPERS
The thesis is based on the following papers, which are given in Appendices I-III:
I. Mats Brämming and Bo Björkman: Avoiding Sloppy BOS Process Behavior,
Iron & Steel Technology, Vol. 7, No. 11, November 2010, pp. 66-75.
Co-author has contributed in a supervisory capacity.
II. Mats Brämming, Stuart Millman1), Aart Overbosch1), Abha Kapilashrami1),
Donald Malmberg2) and Bo Björkman: BOS Vessel Vibration Measurement for
Foam Level Detection, to be published in ISIJ International, Vol.51 (2011),
No.1, January 2011. 1) Tata Research D & T, 2) Swerea MEFOS AB
III. Mats Brämming, Stuart Millman1), Gareth Parker1), Abha Kapilashrami1),
Donald Malmberg2) and Bo Björkman: Comparison between Vessel Vibration
and Audio Measurement for Foam Height Estimation and Slopping Control in
the Top-blown BOS Process, submitted for publication in Steel Research
International. 1) Tata Research D & T, 2) Swerea MEFOS AB
The work presented in the last two papers was part of the RFCS-funded IMPHOS
project. M Brämming has with general support from the project partners from Tata
and Swerea/MEFOS planned, carried out and evaluated the industrial trials
described in the paper. Co-authors have contributed in a technical supportive/
supervisory capacity.

IV
V
ABSTRACT
Slag formation plays a decisive role in all steelmaking processes. In top-blowing
Basic Oxygen Steelmaking (BOS), i.e. in the LD process, an emulsion consisting of
liquid slag, dispersed metal droplets and solid particles will, together with process
gases, form an expanding foam. Extensive research has defined the parameters that
govern the foaming characteristics of BOS slag emulsions.
It is a well known fact that certain process conditions will lead to an excessive foam
growth, forcing the foam out through the vessel opening (mouth). This process event
is commonly known as slopping. Slopping results in loss of valuable metal,
equipment damage, lost production time and pollution.
A literature survey covering the slopping phenomena has been carried out, as well as
a deeper investigation into the causes behind slopping on the BOS vessels, type
LD/LBE, at SSAB EMEA Metallurgy Luleå, equipped with an automatic system for
slopping registration using image analysis.
Good slag formation and foam-growth control in order to avoid slopping is primarily
accomplished by taking preventive “static” measures. Improved slopping control has
been achieved by developing a new oxygen lance control scheme, featuring
adjustment of the distance between the lance tip and the metal bath according to
scrap quality and ore additions.
If “static” measures cannot be effectuated, in-blow control measures are needed. For
such “dynamic” measures to be effective, it is necessary to have a system for
slopping prediction.
In the early-1980s a system for foam level and slopping control, based on BOS
vessel vibration, was temporarily installed and tested on one of the vessels in Luleå.
Based on the experiences from these tests it was decided to re-investigate the vessel
vibration measurement technique. Trials on industrial scale BOS vessels of type
LD/LBE have been carried out. FFT spectrum analysis has been applied in order to

VI
find the frequency band with best correlation to an estimated foam height. The results
show that there is a correlation between vessel vibration and foam height which can
be used for dynamic foam level and slopping control.
The vessel vibration results have been tested against perhaps the most common
implemented technique for dynamic foam height estimation and slopping control, the
audiometric system. Parallel vibration and audio measurements have been carried
out on a 130-tonne as well as on 300-tonne BOS vessels. The results show that
during stable process conditions there is good agreement between the two methods
with regard to foam height estimation and that combining the two methods will
provide a powerful slopping prediction and control system.

VII
ACKNOWLEDGEMENTS
First of all I would like to express my sincere thanks to my supervisors Professors Bo
Björkman, Jan-Olov Wikström and Carl-Erik Grip for their patience, support and
guidance during the course of this work.
I also wish to thank my employer SSAB for the opportunity to carry out this thesis
work, and especially Margareta Rönnqvist, Lotta Jakobsson and Agneta Ekman for
their personal support and for creating a balanced working environment. Thanks also
to the all BOS operators, especially Fredrik Westin and his colleagues on team 1,
and the technical staff at the Luleå steel plant for their assistance during the trials.
Special thanks to my colleagues and co-authors in the IMPHOS project for their
technical support and guidance, especially to Stuart Millman for taking extra time for
the grammatical review the publications and also to Gareth Parker, Tata Steel Corus,
Scunthorpe Works for his help with the UK industrial trials.
Thanks to Bror Tingvall and Roger Jonsson at the Department of Human Work
Science, Divisions of Sound and Vibration, Luleå University of Technology (LTU), for
their valuable technical support on vibration measurements, and also to Niklas Grip
at the Department of Mathematics, at LTU, for providing the signal analysis software.
Further thanks to Professor Rob Boom, Tata Research, IJmuiden & Delft University
of Technology, as well as Professors Pär Jönsson and Seshadri Seetharaman at the
Royal Institute of Technology, Stockholm, for their kind advice.
Finally, the financial support from RFCS and from VINNOVA, SSF and KK-stiftelsen
(supporting the Centre for Process Integration in Iron and Steelmaking, PRISMA) is
gratefully acknowledged.

VIII
IX
CONTENTS
1 INTRODUCTION .......................................................................................... 1
1.1 BACKGROUND ..................................................................................... 1
1.2 THE LD PROCESS ................................................................................ 1
1.3 FOAMING IN THE LD PROCESS ......................................................... 4
1.3.1 Theory ......................................................................................................... 4
1.3.2 Gas generation ............................................................................................ 6
1.3.3 Blowing regimes – “hard” versus “soft” blowing ............................................ 8
1.3.4 The slopping phenomena ............................................................................ 9
1.3.5 The basic slag formation trajectory ............................................................ 11
1.3.6 Earlier slag trajectory investigation at SSAB in Luleå ................................. 12
1.4 AIM AND SCOPE OF WORK .............................................................. 14
2 PRESENT STATUS ON SLOPPING PREVENTION ................................. 15
2.1 AUTOMATIC SLOPPING REGISTRATION TECHNIQUES ................ 15
2.2 SLOPPING CAUSES ........................................................................... 16
2.2.1 Most common slopping causes .................................................................. 17
2.2.2 Dry type slopping causes ........................................................................... 18
2.2.3 Volcano type slopping causes.................................................................... 19
2.2.4 Earlier slopping experiences at SSAB Luleå .............................................. 19
2.3 SLOPPING PREVENTIVE MEASURES .............................................. 21
2.3.1 Fundamental vessel, equipment and raw material measures ..................... 21
2.3.2 Static slopping control – pre-blow preventive measures............................. 21
2.3.3 Dynamic slopping prediction and foam height estimation methods ............ 23
2.3.3.1 Vessel weight monitoring ................................................................................. 23
2.3.3.2 Slopping prediction based on vessel flaring .................................................... 24
2.3.3.3 Slopping prediction by modelling ..................................................................... 24
2.3.3.4 Slopping prediction based on off-gas data ...................................................... 24
2.3.3.5 Foam height estimation via vessel side entry .................................................. 25
2.3.3.6 Foam height estimation by lance vibration measurement ............................... 26
2.3.3.7 Foam height estimation by audiometry ........................................................... 27
2.3.3.8 Foam level detection by RWI ........................................................................... 27
2.3.3.9 Slopping prediction by combined methods ...................................................... 28
2.3.4 Dynamic slopping control – in-blow measures ........................................... 29
2.3.4.1 Oxygen lance, O2 flow rate and bath agitation measures ............................... 29
2.3.4.2 Addition of slopping suppressant materials ..................................................... 31
2.3.4.3 Controlling foam height with soundwaves ....................................................... 33
X
2.4 EVALUATION OF SLOPPING PREDICTION METHODS ................... 33
2.4.1 External vessel measurements .................................................................. 34
2.4.2 Indirect vessel measurements ................................................................... 34
2.4.3 “Visual” methods ........................................................................................ 35
2.4.4 Evaluation summary .................................................................................. 36
3 METHODOLOGY ....................................................................................... 37
3.1 DESCRIPTION OF LULEÅ BOS OPERATION ................................... 37
3.2 SLOPPING REGISTRATION AND CAUSE ANALYSIS ...................... 38
3.2.1 Slopping registration method ..................................................................... 38
3.2.2 Slopping causes investigation method ....................................................... 38
3.3 VESSEL VIBRATION FOR FOAM HEIGHT ESTIMATION ................. 40
3.3.1 Earlier experiences .................................................................................... 40
3.3.2 Reinvestigation into sensors and positioning ............................................. 42
3.4 AUDIO MEASUREMENT ..................................................................... 44
3.5 SIGNAL ANALYSIS ............................................................................. 45
3.6 TRIAL DESCRIPTION ......................................................................... 46
3.6.1 Trials on SSAB Luleå 114 (130) tonne BOS vessels .................................. 47
3.6.2 Trials on Tata Scunthorpe 300 tonne vessels ............................................ 48
3.6.3 Single trial on Tata Teesside (Lackenby) 240 tonne vessel ....................... 49
4 RESULTS ................................................................................................... 50
4.1 BOS VESSEL SLOPPING, SSAB LULEÅ (Appendix I) ....................... 50
4.1.1 Slopping registration .................................................................................. 50
4.1.2 Slopping development Luleå BOS vessel LD1 ........................................... 51
4.1.3 Investigation into slopping causes ............................................................. 51
4.1.4 Development of new lance profiles ............................................................ 56
4.2 VESSEL VIBRATION MEASUREMENTS (Appendix II-III) .................. 59
4.2.1 SSAB EMEA Luleå 114/130 tonne vessel .................................................. 59
4.2.2 Tata Steel Scunthorpe 300 tonne vessels .................................................. 60
4.2.3 Tata Steel Teesside (Lackenby) 240 tonne vessel ..................................... 60
4.3 AUDIO MEASUREMENTS AT LULEÅ (Appendix III) .......................... 61
5 DISCUSSION ............................................................................................. 62
5.1 SLOPPING .......................................................................................... 62
5.1.1 Slopping causes ........................................................................................ 62
5.1.2 Slopping period .......................................................................................... 63
5.1.3 Slopping preventive actions ....................................................................... 64
XI
5.1.3.1 Static slopping preventive measures ............................................................... 64
5.1.3.2 Slopping prediction .......................................................................................... 65
5.1.3.3 Dynamic slopping preventive measures .......................................................... 65
5.2 VESSEL VIBRATION FOR FOAM HEIGHT ESTIMATION ................. 66
5.2.1 Vessel vibration direction ........................................................................... 66
5.2.2 Heat size and optimum vibration mid-frequency ........................................ 67
5.2.3 Stability of optimum mid-frequency ............................................................ 68
5.2.4 Slopping prediction and control system development ................................ 68
5.3 COMPARING VESSEL VIBRATION TO AUDIOMETRY ..................... 70
6 CONCLUSIONS ......................................................................................... 73
6.1 BOS SLOPPING BEHAVIOUR ............................................................ 73
6.2 VESSEL VIBRATION FOR FOAM HEIGHT ESTIMATION ................. 74
7 FUTURE WORK ......................................................................................... 76
8 REFERENCES ........................................................................................... 77

XII
1
1 INTRODUCTION
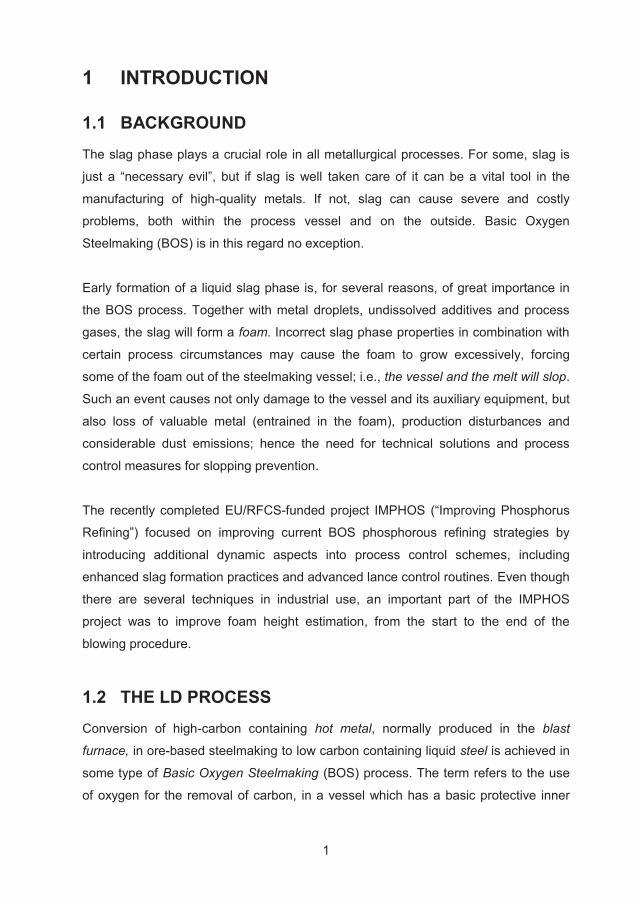
1.1 BACKGROUND
The slag phase plays a crucial role in all metallurgical processes. For some, slag is
just a “necessary evil”, but if slag is well taken care of it can be a vital tool in the
manufacturing of high-quality metals. If not, slag can cause severe and costly
problems, both within the process vessel and on the outside. Basic Oxygen
Steelmaking (BOS) is in this regard no exception.
Early formation of a liquid slag phase is, for several reasons, of great importance in
the BOS process. Together with metal droplets, undissolved additives and process
gases, the slag will form a foam. Incorrect slag phase properties in combination with
certain process circumstances may cause the foam to grow excessively, forcing
some of the foam out of the steelmaking vessel; i.e., the vessel and the melt will slop.
Such an event causes not only damage to the vessel and its auxiliary equipment, but
also loss of valuable metal (entrained in the foam), production disturbances and
considerable dust emissions; hence the need for technical solutions and process
control measures for slopping prevention.
The recently completed EU/RFCS-funded project IMPHOS (“Improving Phosphorus
Refining”) focused on improving current BOS phosphorous refining strategies by
introducing additional dynamic aspects into process control schemes, including
enhanced slag formation practices and advanced lance control routines. Even though
there are several techniques in industrial use, an important part of the IMPHOS
project was to improve foam height estimation, from the start to the end of the
blowing procedure.
1.2 THE LD PROCESS
Conversion of high-carbon containing hot metal, normally produced in the blast
furnace, in ore-based steelmaking to low carbon containing liquid steel is achieved in
some type of Basic Oxygen Steelmaking (BOS) process. The term refers to the use
of oxygen for the removal of carbon, in a vessel which has a basic protective inner
2
lining. The oxygen can be supplied through bottom tuyeres and or via a top-lance
blowing against the metal surface. In the latter case, improved mixing of the bath can
be achieved by bottom injecting of inert gases (N2 and or Ar). Table 1 lists the most
common BOS processes in use today.
Table 1. Example of common BOS processes.
Type Abbreviation Name Process principals Top- blown
LD Linz & Donawitz Oxygen blown against metal surface via top-lance lowered into the steelmaking vessel
LD-BAP LD – Bottom Agitation Process LD, with bottom injection of inert gas via tuyeres (LD-)TBM Thyssen Blowing Metallurgy
LD-KG LD – Kawasaki Gate LDS LD – Spüler LD, with bottom injection
of inert gas via permeable elements
LD-LBE LD – Lance Brassage Équilibre LD – Lance Bubbling Equilibrium
Bottom- blown
OBM or Q-BOP (Am.)
Oxygen Boden Maxhütte Quick Basic Oxygen Process
Oxygen via concentric bottom tuyeres, with cooling hydro carbon (gas/liquid) in outer slit
LWS Creusot Loire, Wendel Sidelor, Etablissements Sprunck
Combined K-BOP Kawasaki Basic Oxygen Process Oxygen via top-lance and bottom tuyeres
As the iron-bearing charge materials (i.e. hot metal, scrap and coolants) used in the
BOS process all contain high levels of elements (e.g. silicon), which will form acid
liquid oxidation products (e.g. silica), basic slag formers need to be added in order to
create a slag phase with appropriate basicity. Burnt lime, alone or in combination with
burnt dolomitic lime, is in this case the norm.
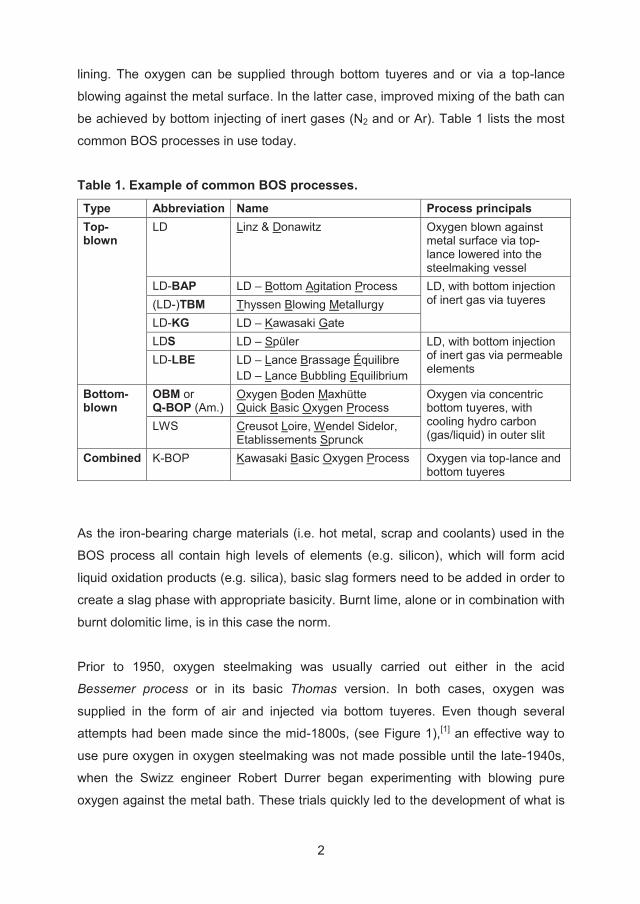
Prior to 1950, oxygen steelmaking was usually carried out either in the acid
Bessemer process or in its basic Thomas version. In both cases, oxygen was
supplied in the form of air and injected via bottom tuyeres. Even though several
attempts had been made since the mid-1800s, (see Figure 1),[1] an effective way to
use pure oxygen in oxygen steelmaking was not made possible until the late-1940s,
when the Swizz engineer Robert Durrer began experimenting with blowing pure
oxygen against the metal bath. These trials quickly led to the development of what is
3
today recognized as the LD process. The two steel plants where the LD process was
first put into operation were Linz (in 1952) and Donawitz (in 1953), hence the
acronym “LD”.
Bessemer Patent 1856
Fonderia Milanesede Acciaio, Patent 1902
Lellep trial: 1t converterOberhausen 1936-1939
Schwarz Patent 1939
Durrer, Hellbrügge trials:2t converter, Gerlaf ingen 1948
LD trials: 2t converter, Linz 1949
LD start of operation: 30t converterLinz 1952, Donawitz 1953
Figure 1. The long way of the LD process.[1]
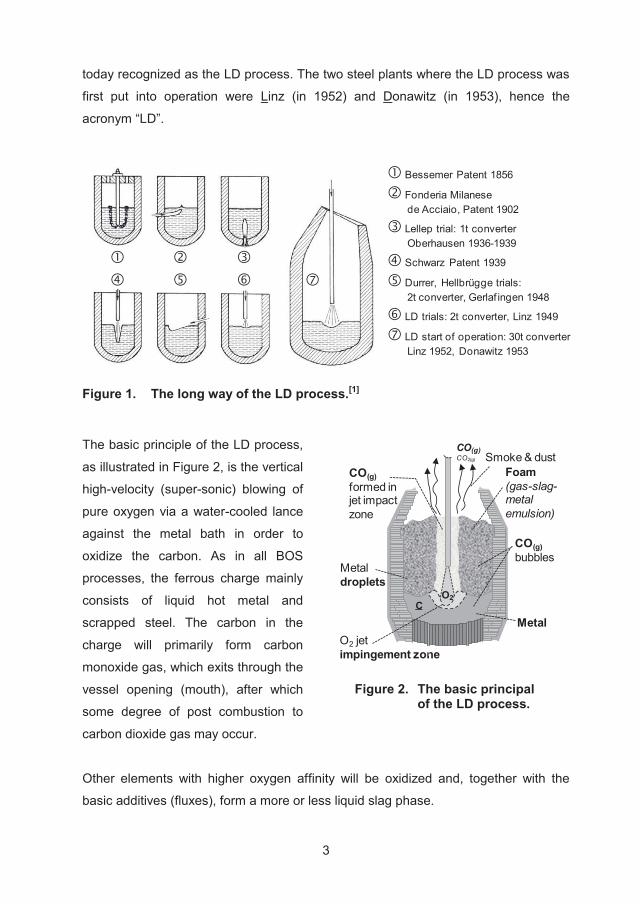
The basic principle of the LD process,
as illustrated in Figure 2, is the vertical
high-velocity (super-sonic) blowing of
pure oxygen via a water-cooled lance
against the metal bath in order to
oxidize the carbon. As in all BOS
processes, the ferrous charge mainly
consists of liquid hot metal and
scrapped steel. The carbon in the
charge will primarily form carbon
monoxide gas, which exits through the
vessel opening (mouth), after which
some degree of post combustion to
carbon dioxide gas may occur.
CO(g)formed injet impact zone
O2 jetimpingement zone
CO(g)CO2(g)
Foam(gas-slag-metal emulsion)
Smoke & dust
CO(g)bubbles
Metal
Metal droplets
O2C
Figure 2. The basic principal of the LD process.
Other elements with higher oxygen affinity will be oxidized and, together with the
basic additives (fluxes), form a more or less liquid slag phase.
4
Of the world’s total crude steel production in 2008, 67.1% was produced via some
BOS process.[2] The LD process is by far the dominant BOS process in use today,
accounting for an estimated share of about 60% of world steel production.[3,4]
With the original process concept, only the impinging oxygen jet will provide mixing of
the metal bath, a drawback compared with the bottom-blown Bessemer and Thomas
processes. But in the 1970s bottom stirring with inert gas was introduced on the LD
vessel in order to improve process efficiency. Today, over 80% of the world’s LD
vessels are equipped with a system for bath agitation by inert gas injection.[1]
1.3 FOAMING IN THE LD PROCESS
1.3.1 Theory
A distinctive characteristic of the LD process is the formation of a multi-phased foam,
consisting of liquid slag, metal droplets, solid “second phase” particles such as
undissolved fluxes and process gases. This is because:
i. the high-velocity oxygen jet impinges the melt, ejecting a
considerable part of the melt in the form of metal droplets into the
upper part of the vessel;
ii. the lumpy fluxes are added in batches, resulting in a slow flux
dissolution, and hence a slow liquid slag formation;
iii. the liquid slag, undissolved fluxes and metal droplets form a more
or less viscous emulsion, intercepting the process gases on the
way up towards the vessel mouth;
iv. a large portion of the process gases is formed within the emulsion
itself due to the reaction between the carbon in metal droplets and
iron oxide in the liquid slag.
This mechanism is in great contrast to bottom-blown BOS processes such as OBM.
Here, the fluxes are injected in powder form together with the oxygen, allowing the
fluxes to fully dissolve before reaching the surface of the melt. Also, with a
considerably lower entry velocity of the oxygen, less metal is ejected from the melt.
5
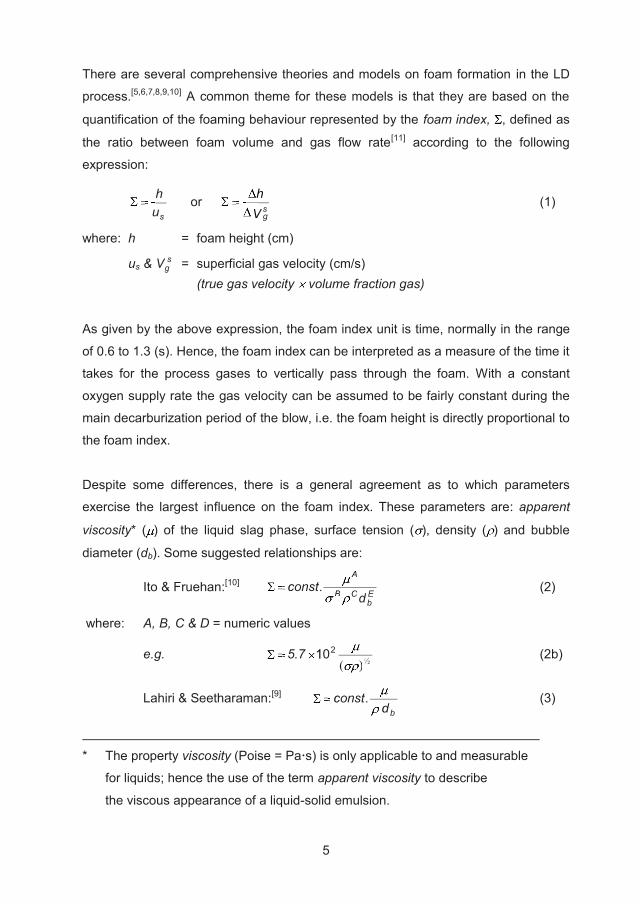
There are several comprehensive theories and models on foam formation in the LD
process.[5,6,7,8,9,10] A common theme for these models is that they are based on the
quantification of the foaming behaviour represented by the foam index, , defined as
the ratio between foam volume and gas flow rate[11] according to the following
expression:
su
h or Vh
sgV
h (1)
where: h = foam height (cm)
us & sgV = superficial gas velocity (cm/s)
(true gas velocity volume fraction gas)
As given by the above expression, the foam index unit is time, normally in the range
of 0.6 to 1.3 (s). Hence, the foam index can be interpreted as a measure of the time it
takes for the process gases to vertically pass through the foam. With a constant
oxygen supply rate the gas velocity can be assumed to be fairly constant during the
main decarburization period of the blow, i.e. the foam height is directly proportional to
the foam index.
Despite some differences, there is a general agreement as to which parameters
exercise the largest influence on the foam index. These parameters are: apparent
viscosity* ( ) of the liquid slag phase, surface tension ( ), density ( ) and bubble
diameter (db). Some suggested relationships are:
Ito & Fruehan:[10] Eb
CB
A
dconst
CB
A.c (2)
where: A, B, C & D = numeric values
e.g. ½)( ½)(21015.7 (2b)
Lahiri & Seetharaman:[9] bd
const d
.c (3)
* The property viscosity (Poise = Pa s) is only applicable to and measurable
for liquids; hence the use of the term apparent viscosity to describe
the viscous appearance of a liquid-solid emulsion.
6
A very important property in regard to the foam index is the apparent viscosity of the
emulsion; the higher the apparent viscosity, the higher the foam index. The obvious
consequence is that an increased apparent viscosity will automatically lead to an
increased foam height, and with a sufficiently high apparent viscosity, the foam will
eventually begin to exit the vessel, i.e. slopping will occur.
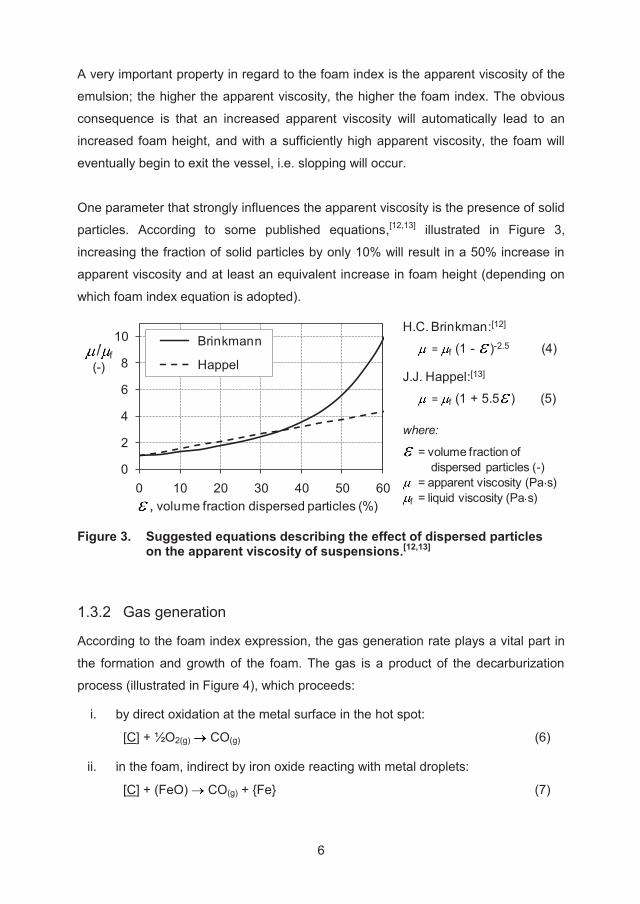
One parameter that strongly influences the apparent viscosity is the presence of solid
particles. According to some published equations,[12,13] illustrated in Figure 3,
increasing the fraction of solid particles by only 10% will result in a 50% increase in
apparent viscosity and at least an equivalent increase in foam height (depending on
which foam index equation is adopted).
0
2
4
6
8
10
0 10 20 30 40 50 60
Brinkmann
Happel
0, volume fraction dispersed particles (%)
H.C. Brinkman:[12]
= f (1 - )-2.5 (4)
J.J. Happel:[13]
= f (1 + 5.5 ) (5)
where:
= volume fraction of dispersed particles (-)
= apparent viscosity (Pa s)f = liquid viscosity (Pa s)
/1
/ f(-)
Figure 3. Suggested equations describing the effect of dispersed particles
on the apparent viscosity of suspensions.[12,13]
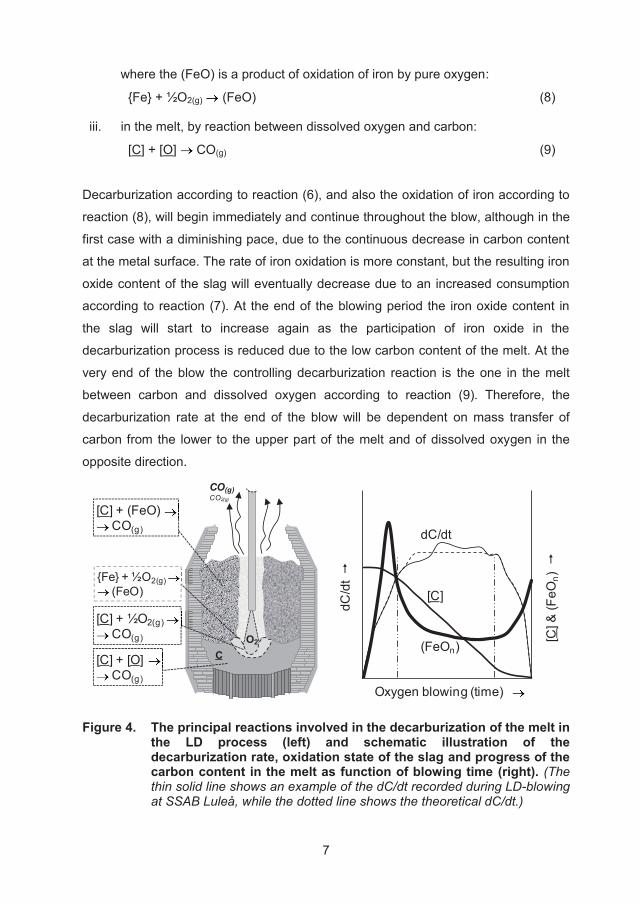
1.3.2 Gas generation
According to the foam index expression, the gas generation rate plays a vital part in
the formation and growth of the foam. The gas is a product of the decarburization
process (illustrated in Figure 4), which proceeds:
i. by direct oxidation at the metal surface in the hot spot:
[C] + ½O2(g) CO(g) (6)
ii. in the foam, indirect by iron oxide reacting with metal droplets:
[C] + (FeO) CO(g) + {Fe} (7)
7
where the (FeO) is a product of oxidation of iron by pure oxygen:
{Fe} + ½O2(g) (FeO) (8)
iii. in the melt, by reaction between dissolved oxygen and carbon:
[C] + [O] CO(g) (9)
Decarburization according to reaction (6), and also the oxidation of iron according to
reaction (8), will begin immediately and continue throughout the blow, although in the
first case with a diminishing pace, due to the continuous decrease in carbon content
at the metal surface. The rate of iron oxidation is more constant, but the resulting iron
oxide content of the slag will eventually decrease due to an increased consumption
according to reaction (7). At the end of the blowing period the iron oxide content in
the slag will start to increase again as the participation of iron oxide in the
decarburization process is reduced due to the low carbon content of the melt. At the
very end of the blow the controlling decarburization reaction is the one in the melt
between carbon and dissolved oxygen according to reaction (9). Therefore, the
decarburization rate at the end of the blow will be dependent on mass transfer of
carbon from the lower to the upper part of the melt and of dissolved oxygen in the
opposite direction.
CO(g)CO2(g)
[C] + ½O2(g)CO(g)
[C] + (FeO) CO(g)
[C] + [O] CO(g)
{Fe} + ½O2(g){ }(FeO)
0
0
0
0
0
0
0
0
0
0
1
0
1
2
3
4
5
6
7
8
0 20 40 60 80 100Oxygen blowing (time) 100
[C] &
(FeO
n)
dC/d
t
dC/dt
[C]
(FeOn)C
O2
Figure 4. The principal reactions involved in the decarburization of the melt in
the LD process (left) and schematic illustration of the decarburization rate, oxidation state of the slag and progress of the carbon content in the melt as function of blowing time (right). (The thin solid line shows an example of the dC/dt recorded during LD-blowing at SSAB Luleå, while the dotted line shows the theoretical dC/dt.)
8
As illustrated to the right in Figure 4, the maximum decarburization rate, and hence
the maximum gas generation rate, is reached 25-30% into the blow, and proceeds to
a great extent within the foam according to reaction (7), the rate fairly constant, the
level depending on the availability of iron oxide and the supply of metal droplets
ejected from the oxygen impingement zone.
At about 80% of the blow the gas generation rate will quickly drop off due to a low
carbon content in the melt. Deviation from the theoretical decarburization curve, as
illustrated in Figure 4, should always be expected for several reasons; for instance,
when adding coolants such as limestone, dolostone (raw dolomite) or iron oxide
materials such as ore.
1.3.3 Blowing regimes – “hard” versus “soft” blowing
In practical operation of a top-blown steelmaking vessel, achieving perfect balance of
oxygen supplied to the bath and slag respectively is not an easy task. Two terms are
used to describe a deviation from a balanced oxygen state in the vessel:
1. “hard blowing” (harder impact of the oxygen jet on the metal surface)
stands for the case when the oxygen lance is closer to the bath,
promoting decarburization in the hot spot according to reaction (6)
and later in the bath according to reaction (9), resulting in an under-
oxidized slag
2. “soft blowing” (softer impact of the oxygen jet on the metal surface)
stands for the case when the oxygen lance is farther from the bath,
increasing the supply of oxygen to the slag according to reaction (8),
resulting in reduced decarburization rate and an over-oxidized slag
In an ideal process situation with the lance at an optimum position above the metal
surface, the fresh oxygen supplied to the slag balances the consumption of iron oxide
for the decarburization of ejected metal droplets. The decarburization rate will be high
but controlled, creating a stable foam which fills a large portion of the vessel volume
above the bath, minimizing lining wear and skulling. Yield as well as blowing result
will be good.
9
If the lance is positioned too deep, the supply of oxygen to the slag will not be
enough to balance the consumption of iron oxide for the decarburization of ejected
metal droplets; the slag will be starved of oxygen. The decarburization will still be
high due to a more intense harder contact between the oxygen jet and the bath.
At lower FeO content the slag may not foam at all; instead, the emulsion will become
viscous and shrink. A reduced emulsion height will not only lead to an easy passage
of process gases by channelling but also an intensified spitting, sending droplets high
up in and out of the vessel. More spitting leads to reduced yields and skulling of the
lance as well as of the vessel cone and mouth. Another effect of hard blowing is an
increased rate of bottom wear.
If the lance is too high, the oxygen level in the slag will be elevated, not only due to a
softer contact between oxygen and metal bath, but also due to a slower consumption
of iron oxide in the slag as less metal droplets are ejected from the bath. Hence, the
decarburization rate will be lower, reducing the foam height and promoting lining
wear. A shallower impact of the oxygen jet will reduce bath mixing, creating dead
zones and causing bottom build-up.
1.3.4 The slopping phenomena
The combination of a low decarburization rate and an over-oxidized slag can be
compared to a time-bomb. Chukwulebe et al.,[14] have introduced the descriptive term
“hyper-reactive conditions” with excess oxygen and carbon not reacting due to poor
mixing. In this state, any minor change in conditions will trigger a drastic increase in
gas generation and foam growth, leading to violent slopping.
Slopping is the general term used when, due to excessive foam growth, the foam
cannot be contained within the steelmaking vessel. The foam will flow down the outer
side of the vessel (as illustrated in Figure 5), the pace depending on the oxidizing
state of the slag; slowly in case of a thick under-oxidized slag, quickly in the case of a
runny over-oxidized slag.
10
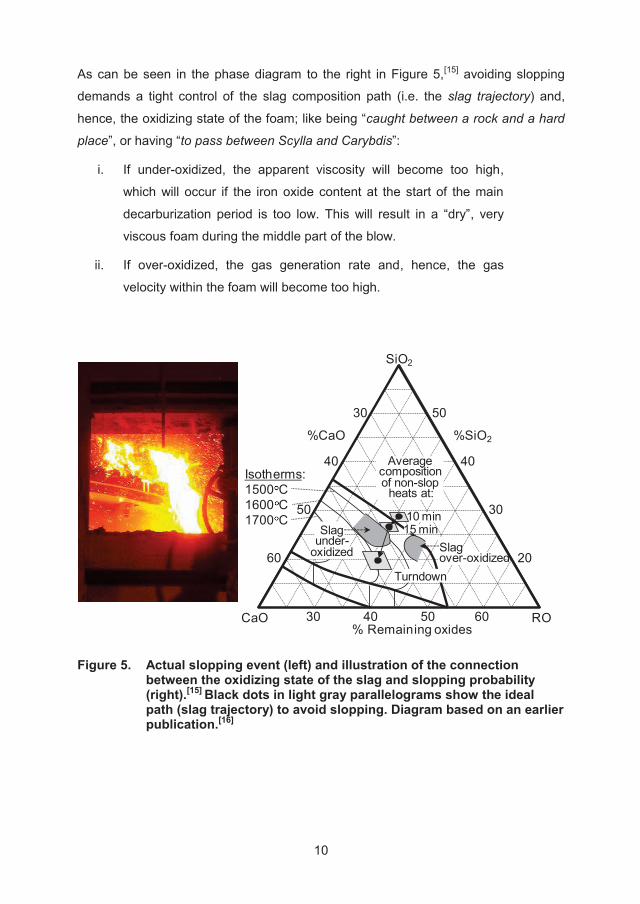
As can be seen in the phase diagram to the right in Figure 5,[15] avoiding slopping
demands a tight control of the slag composition path (i.e. the slag trajectory) and,
hence, the oxidizing state of the foam; like being “caught between a rock and a hard
place”, or having “to pass between Scylla and Carybdis”:
i. If under-oxidized, the apparent viscosity will become too high,
which will occur if the iron oxide content at the start of the main
decarburization period is too low. This will result in a “dry”, very
viscous foam during the middle part of the blow.
ii. If over-oxidized, the gas generation rate and, hence, the gas
velocity within the foam will become too high.
SiO2
30 40 50 60% Remaining oxides
CaO RO
30 50
%CaO %SiO2
40 40
50 30
60 20Turndown
15 min 10 min
Slagover-oxidized
Average composition of non-slop
heats at:
Slagunder-
oxidized
Isotherms:1500 C1600 C1700 C
Figure 5. Actual slopping event (left) and illustration of the connection between the oxidizing state of the slag and slopping probability (right).[15] Black dots in light gray parallelograms show the ideal path (slag trajectory) to avoid slopping. Diagram based on an earlier publication.[16]
11
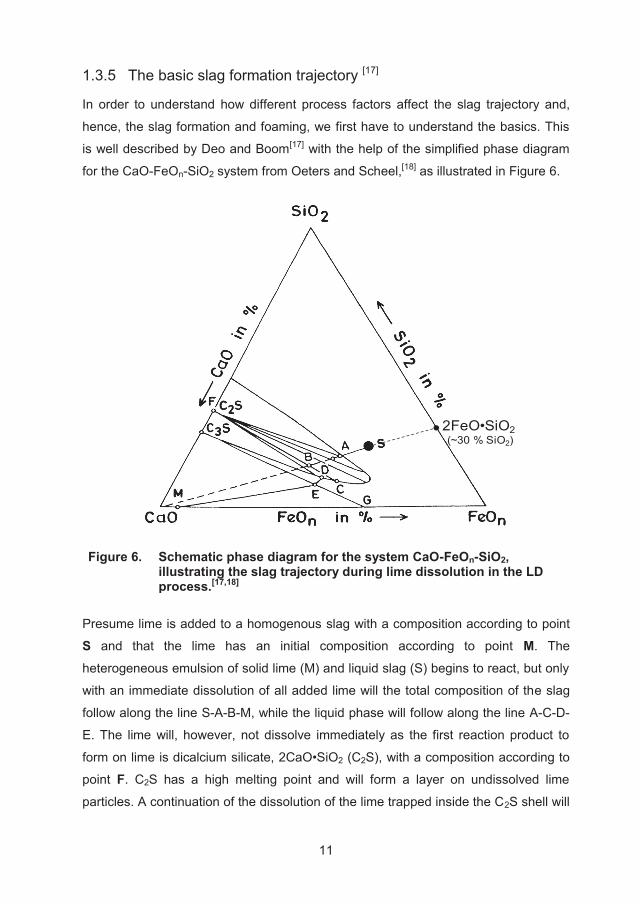
1.3.5 The basic slag formation trajectory [17]
In order to understand how different process factors affect the slag trajectory and,
hence, the slag formation and foaming, we first have to understand the basics. This
is well described by Deo and Boom[17] with the help of the simplified phase diagram
for the CaO-FeOn-SiO2 system from Oeters and Scheel,[18] as illustrated in Figure 6.
2FeO•SiO2(~30 % SiO2)
Figure 6. Schematic phase diagram for the system CaO-FeOn-SiO2,
illustrating the slag trajectory during lime dissolution in the LD process.[17,18]
Presume lime is added to a homogenous slag with a composition according to point
S and that the lime has an initial composition according to point M. The
heterogeneous emulsion of solid lime (M) and liquid slag (S) begins to react, but only
with an immediate dissolution of all added lime will the total composition of the slag
follow along the line S-A-B-M, while the liquid phase will follow along the line A-C-D-
E. The lime will, however, not dissolve immediately as the first reaction product to
form on lime is dicalcium silicate, 2CaO•SiO2 (C2S), with a composition according to
point F. C2S has a high melting point and will form a layer on undissolved lime
particles. A continuation of the dissolution of the lime trapped inside the C2S shell will
12
be obstructed until favourable conditions for dissolution are reached, or until a crack
in the C2S shell has formed. Along the surface DE the liquid slag is saturated with
tricalcium silicate, 3CaO•SiO2 (C3S), and along the surface GE it is in equilibrium with
a solid solution of CaO-FeO-SiO2. If the initial composition of the liquid slag was
closer to the surface DE, C3S should be formed first, but the kinetics for precipitation
of C3S is quite sluggish. The result is an initial formation of C2S, followed by
precipitation of C3S, within or underneath the C2S layer, at a much later time.
The lime dissolution will follow another path in the presence of MgO, e.g. with early
additions of dolomitic lime. Studies have shown that 5% MgO or more in the slag will
cause a considerable change in the progress of lime dissolution in such a way that
the rate of lime dissolution is reduced due to early precipitation of tricalcium silicate.
1.3.6 Earlier slag trajectory investigation at SSAB in Luleå
A Master’s thesis[19] on slag formation and dephosphorization carried out at SSAB
Luleå in 2005 give some interesting information on the slag trajectory for different
process conditions. Slag and metal sampling was carried out with a special sampling
device lowered into the BOS vessel using the sublance. Two process cases were
studied: standard blowing applied for mild steel grades (as reference cases) and
special blowing applied for high strength steel grades with demand on low final
phosphorous content (De-P cases).
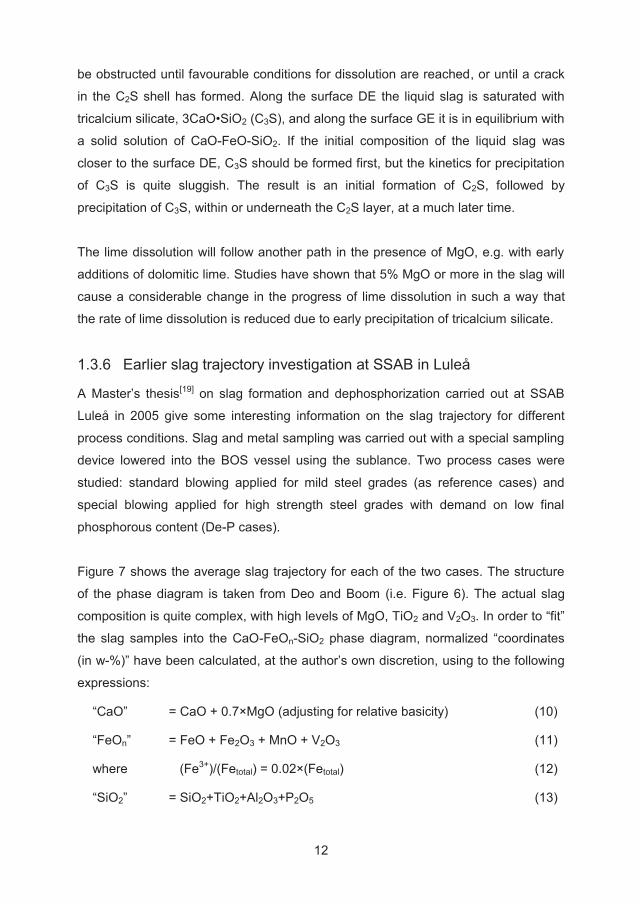
Figure 7 shows the average slag trajectory for each of the two cases. The structure
of the phase diagram is taken from Deo and Boom (i.e. Figure 6). The actual slag
composition is quite complex, with high levels of MgO, TiO2 and V2O3. In order to “fit”
the slag samples into the CaO-FeOn-SiO2 phase diagram, normalized “coordinates
(in w-%)” have been calculated, at the author’s own discretion, using to the following
expressions:
“CaO” = CaO + 0.7×MgO (adjusting for relative basicity) (10)
“FeOn” = FeO + Fe2O3 + MnO + V2O3 (11)
where (Fe3+)/(Fetotal) = 0.02×(Fetotal) (12)
“SiO2” = SiO2+TiO2+Al2O3+P2O5 (13)
13
2
3
HS regime
MS regime
SiO2+TiO2+P2O5+Al2O3
FeO’+Fe2O3
’
+MnO+V2O3
CaO+0.7 MgO
0
F3
F3
1212
0
HM (%):Si / Mn0.41 / 0.370.31 / 0.33
%MgO 10-13%TiO2 2-4%V2O3 4-9
Figure 7. Slag trajectories in a modified CaO-FeOn-SiO2 phase diagram, for: - “MS regime” type of blowing (red) and for - “HS regime” type blowing (blue). Slag samples used for trajectories from reference.[19]
Supported by process conditions and blowing result it can be concluded that the
reference case is a typical soft blowing, most likely passing through the over-oxidized
area connected with volcano-type slopping (slopping recording not possible at the
time). In spite of the operator effort’s to enhance dephosphorization, the slag
trajectory in the De-P case followed a rather dry path typical for harder blowing.
14
1.4 AIM AND SCOPE OF WORK
Even in the case of a well-controlled BOS process, certain extreme conditions will
cause excessive slag foaming and slopping, resulting in equipment damage,
environmental disturbances and low process yields. At SSAB EMEA Metallurgy’s
BOS plant in Luleå, slopping has been a matter of concern for some time, even more
so since the heat size was increased from 114 to 130 tonnes in late-2008.
In order to reduce the occurrence of slopping, a need for a deeper study into the
main slopping causes has been realized, as well as the need for a reliable system for
in-blow slopping prediction. Such a system is currently not available on the Luleå
BOS vessels, but there are slopping prediction systems commercially available, the
most common being audiometry and oxygen lance vibration monitoring.
Audiometry normally involves the measurement of process sound from within the
vessel hood via a sound duct entering through the cooling panel, which is not
possible in Luleå without a complete redesign of the hood section in question. Other
issues with audiometry are the requirement of continuous maintenance and the fact
that usable sonic readings are not obtained until 4 to 5 minutes into the blow.
Lance vibration has been tested in Luleå, but deemed unreliable due to local
conditions and the fact that the apparatus demanded a high degree of maintenance.
The purpose of this work was twofold:
i. to establish which process conditions will lead to slopping, with a special
emphasis on the local conditions at SSAB EMEA Luleå. The outcome will be
used when prioritizing the measures that should be taken in order to achieve
the pre- and in-blow process conditions needed to avoid slopping. The result
of this study is presented in Appendix I;
ii. to develop a reliable, easy-to-install, low-maintenance technique for foam
height estimation throughout the whole blowing, which can be utilized for in-
blow slopping prediction. The result of this development work, carried out
within the RFCS project IMPHOS, is presented in Appendices II and III.
15
2 PRESENT STATUS ON SLOPPING PREVENTION
2.1 AUTOMATIC SLOPPING REGISTRATION TECHNIQUES
As in many other areas, lack of measurement techniques and adequate signal
analysis systems in iron and steelmaking has prevented automatic and unbiased
registration of critical process events. However, in the last two to three decades,
development of advanced sensors and powerful signal analysis software and, of
course, a rapid improvement in computer capacity, has opened the door to the
development of more and more intricate process control systems. In the effort to find
the causes behind slopping and to support the development of automated dynamic
slopping prevention and suppression systems, it is necessary to have some means
of recording and grading slopping events.
One of the earliest reported methods for automatic slopping registration (tracing) is
the use of photodiodes.[20] A photodiode is a light-sensitive semiconductor which may
be used as a light sensor. The photodiodes were in this case positioned beneath the
steelmaking vessel, registering sparks as well as liquid and semi-liquid material
leaving through the vessel mouth and passing in front of the sensor on the way down
onto the shop floor.
In the very early-1990s, improved computing capacities and increased availability of
advanced software for image analysis enabled automatic registration and recognition
of events filmed by cameras with a large field of vision.
Slopping registration today is principally based on image analysis of pictures
recorded by cameras covering the area beneath the vessel and/or the converter
mouth.[21,22,23]
In the case of monitoring the area beneath the vessel, the system scans each
camera image (25 per second) and counts the number of light pixels above a set
threshold within a designated area of the camera frame. Both the threshold and the
designated image area should be set in such a way that additional lighting by
sources such as indoor lighting and vehicle headlights is prevented.
16
A slopping value is continuously calculated as the percentage of light pixels relative
to the total number of pixels in the designated scanning area. For long-term data
storage a heat slopping index can be created by accumulating the calculated
slopping level value over the complete blow. For any type of camera set-up, and
especially in the case of cameras covering the taphole and vessel mouth area, it is
necessary to apply some pattern or image recognition system that can distinguish
between slopping, sparking and flames.
2.2 SLOPPING CAUSES
Slopping causes are divided into two groups depending on their nature; static or
dynamic. Static factors are related to pre-blow operational conditions that can be
taken care of prior to blowing, such as vessel design, especially size in relation to
heat size and slag volume, the quality of charge materials, especially hot metal and
scrap, and standardized blowing schemes controlling oxygen lance positioning,
timing of additions and flow rates. Dynamic factors are related to in-blow factors,
such as deviation from blowing schemes and the extent of bottom stirring.
Slopping is a relatively common BOS process problem, incomparably worse in the
case of top blowing and batch addition of coarse flux materials. As the LD process
accounts for around 60% of the world’s total steel production, it is easy to find
publications reporting findings and conclusions with regard to slopping causes.
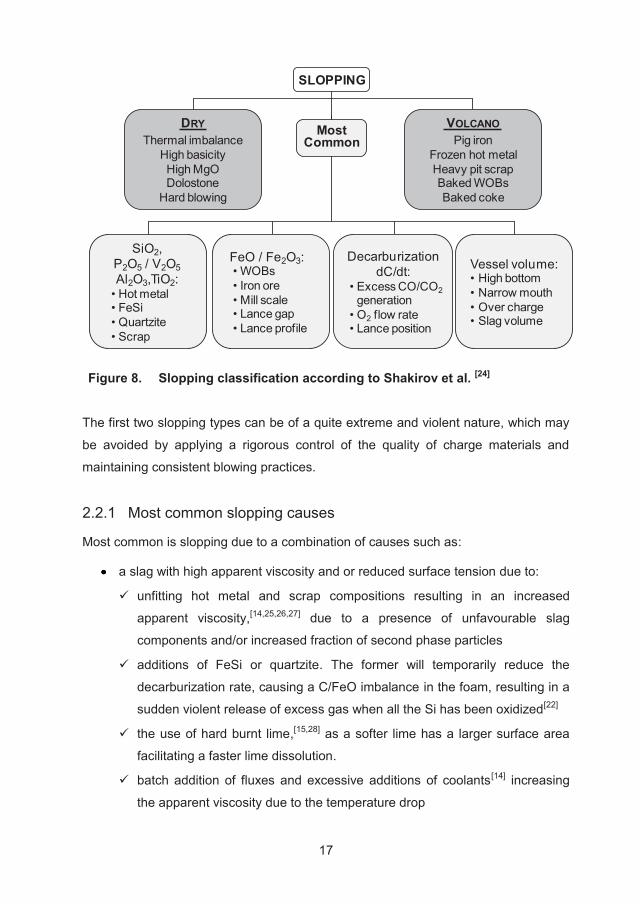
One of the most descriptive and comprehensive summaries on slopping causes has
been given by Shakirov, Boutchenkov, Galperine and Shrader.[24] The authors
defines three types of slopping, as shown in Figure 8:
dry; a result of thermal imbalance, hard blowing, high slag basicity
and large additions of dolomitic fluxes
volcano; related to hot metal quality and large additions of slag foaming
enhancers, e.g. pig iron, oxide containing recycled scrap and
waste-oxide briquettes (WOBs)
“most common”; a combination of causes such as soft blowing, slag
composition, smaller in-blow ore additions, disturbances
in decarburization rate and reduced vessel volume.
17
SLOPPING
MostCommon
DRYThermal imbalance
High basicityHigh MgODolostone
Hard blowing
VOLCANOPig iron
Frozen hot metalHeavy pit scrapBaked WOBsBaked coke
SiO2,P2O5 / V2O5Al2O3,TiO2:
• Hot metal• FeSi• Quartzite• Scrap
Decarburization dC/dt:
• Excess CO/CO2generation
• O2 flow rate• Lance position
Vessel volume:• High bottom• Narrow mouth• Over charge• Slag volume
FeO / Fe2O3:• WOBs• Iron ore• Mill scale• Lance gap • Lance profile
Figure 8. Slopping classification according to Shakirov et al. [24]
The first two slopping types can be of a quite extreme and violent nature, which may
be avoided by applying a rigorous control of the quality of charge materials and
maintaining consistent blowing practices.
2.2.1 Most common slopping causes
Most common is slopping due to a combination of causes such as:
a slag with high apparent viscosity and or reduced surface tension due to:
unfitting hot metal and scrap compositions resulting in an increased
apparent viscosity,[14,25,26,27] due to a presence of unfavourable slag
components and/or increased fraction of second phase particles
additions of FeSi or quartzite. The former will temporarily reduce the
decarburization rate, causing a C/FeO imbalance in the foam, resulting in a
sudden violent release of excess gas when all the Si has been oxidized[22]
the use of hard burnt lime,[15,28] as a softer lime has a larger surface area
facilitating a faster lime dissolution.
batch addition of fluxes and excessive additions of coolants[14] increasing
the apparent viscosity due to the temperature drop
18
high fines content in additions,[14] raising the volume fraction of dispersed
particles in the foam leading to an higher apparent viscosity (Figure 3)
a raised iron oxide content in the slag due to:
soft blowing due to improper lance positioning [14,15,29]
additions of iron oxide containing materials,[14,30,31] such as iron ore, mill
scale and WOBs, especially initial large additions maintaining a raised iron
oxide level throughout the whole blowing
lance wear, leading to softer blowing [15,29,30,32]
sudden increase in decarburization rate due to:
excess gas generation rate from the addition of oxides
poor bath mixing, creating “hyper-reactive conditions” (see 1.3.4)
reduced vessel to charge volume ratio due to:
bottom build-up,[29,30,33] e.g. due to the practice of slag splashing [27,34,35]
reducing the available volume for handling an excessive foam growth
metal over-charging [14,22,29,30,32] and high slag volume
2.2.2 Dry type slopping causes
Dry slopping is a result of more serious process deficiencies, such as:
thermal imbalance due to:
large volumes of undissolved fluxes and batch additions of ore/WOBs, and
of unmelted scrap,[36] creating temperature gradients in melt and slag
high slag basicity:
increasing slag emulsion apparent viscosity and promoting slag reduction,
foremost of FeO and MnO[25]
large additions of dolomitic fluxes and raw lime/dolomite [14,17,33,35] as:
it increases slag emulsion apparent viscosity
MgO blocks lime dissolution
raw fluxes introduce solid particles, increasing the apparent viscosity
the calcinations of raw fluxes cools the slag emulsion and increases the
apparent viscosity even more as well as producing extra process gas
19
hard blowing:
as it increases the decarburization rate and, without proper bath stirring,
hard blowing will deprive the slag of oxygen, creating “hyper-reactive
conditions” [14,25]
unfavourable hot metal Mn/Si ratio,[15,30,32,37,38] as:
higher Si will lead the slag trajectory towards the area representing an
under-oxidized state (see Figure 5), a condition which is worsened by
a low hot metal Mn content
2.2.3 Volcano type slopping causes
Volcano type slopping is related to conditions already described, primarily:
late melting of large amounts of pig iron, oxide containing recycled pit scrap,
mill scale and waste-oxide briquettes [14,29,30,32]
extreme soft blowing conditions
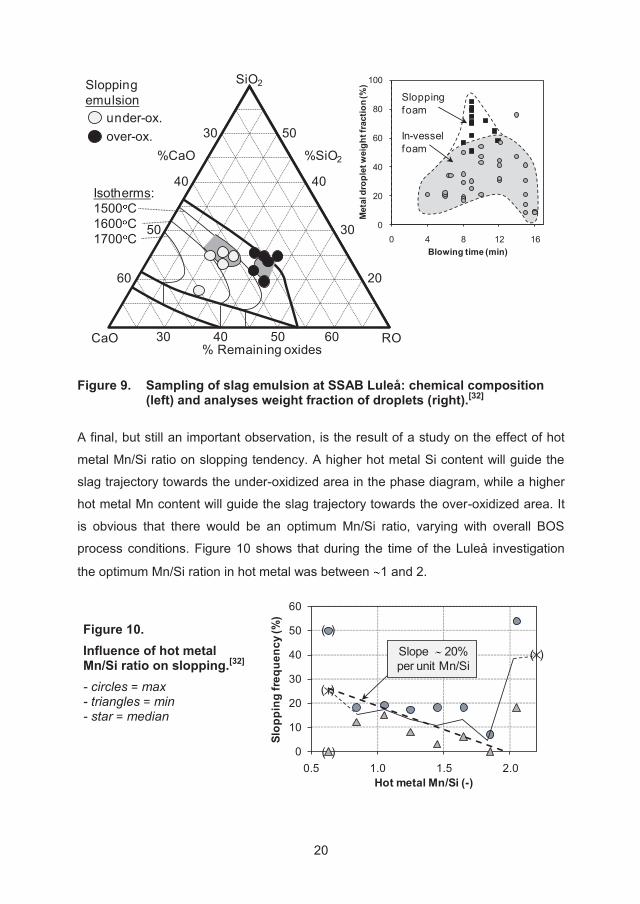
2.2.4 Earlier slopping experiences at SSAB Luleå
Results from an earlier SSAB investigation at Luleå[32] can exemplify some of the
slopping related factors given. The most common slopping causes were identified as:
reduced vessel volume, highly over-oxidized slag, poor lime dissolution, late melting
of cold iron and worn oxygen lance nozzles. Samples of slopping foam and foam
from within the LD vessel gave interesting information regarding the make-up of the
foam. The samples are plotted in Figure 9 (left).
The right diagram in Figure 9 shows the weight fraction of metal droplets suspended
in the foam at different times during the blow, the highest amount reached during the
period of the blow when apparent viscosity and decarburization rate are at maximum.
A 50-80% weight fraction of metal droplets in the foam means that:
10-20% of the total amount of metal bulk is suspended in the foam
at slag rate of 100 kg per tonne of metal, the amount of suspended metal
droplets would be 100-200 kg/tonne. Hence, slopping causes substantial
metallic losses.
20
SiO2
30 40 50 60% Remaining oxides
CaO RO
30 50
%CaO %SiO2
40 40
50 30
60 20
Isotherms:1500 C1600 C1700 C
Sloppingemulsion
under-ox. over-ox.
0
20
40
60
80
100
0 4 8 12 16
Met
al d
ropl
et w
eigh
t fra
ctio
n (%
)
Blowing time (min)
Slopping foam
In-vessel foam
Figure 9. Sampling of slag emulsion at SSAB Luleå: chemical composition (left) and analyses weight fraction of droplets (right).[32]
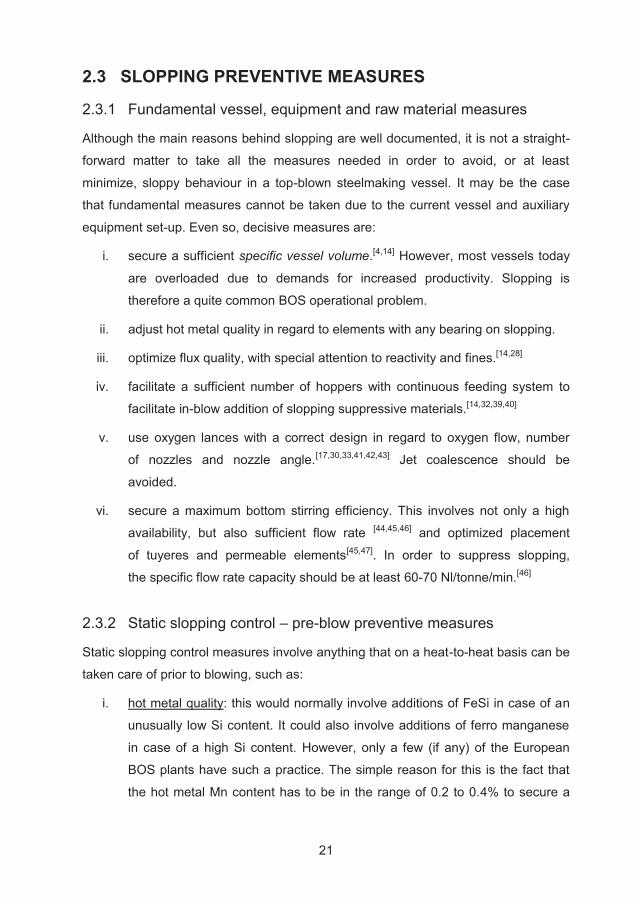
A final, but still an important observation, is the result of a study on the effect of hot
metal Mn/Si ratio on slopping tendency. A higher hot metal Si content will guide the
slag trajectory towards the under-oxidized area in the phase diagram, while a higher
hot metal Mn content will guide the slag trajectory towards the over-oxidized area. It
is obvious that there would be an optimum Mn/Si ratio, varying with overall BOS
process conditions. Figure 10 shows that during the time of the Luleå investigation
the optimum Mn/Si ration in hot metal was between 1 and 2.
Figure 10. Influence of hot metal Mn/Si ratio on slopping.[32] - circles = max - triangles = min - star = median
0
10
20
30
40
50
60
0.5 1.0 1.5 2.0
Slop
ping
freq
uenc
y (%
)
Hot metal Mn/Si (-)
( )
( )
( )
( )Slope 20% per unit Mn/Si
21
2.3 SLOPPING PREVENTIVE MEASURES
2.3.1 Fundamental vessel, equipment and raw material measures
Although the main reasons behind slopping are well documented, it is not a straight-
forward matter to take all the measures needed in order to avoid, or at least
minimize, sloppy behaviour in a top-blown steelmaking vessel. It may be the case
that fundamental measures cannot be taken due to the current vessel and auxiliary
equipment set-up. Even so, decisive measures are:
i. secure a sufficient specific vessel volume.[4,14] However, most vessels today
are overloaded due to demands for increased productivity. Slopping is
therefore a quite common BOS operational problem.
ii. adjust hot metal quality in regard to elements with any bearing on slopping.
iii. optimize flux quality, with special attention to reactivity and fines.[14,28]
iv. facilitate a sufficient number of hoppers with continuous feeding system to
facilitate in-blow addition of slopping suppressive materials.[14,32,39,40]
v. use oxygen lances with a correct design in regard to oxygen flow, number
of nozzles and nozzle angle.[17,30,33,41,42,43] Jet coalescence should be
avoided.
vi. secure a maximum bottom stirring efficiency. This involves not only a high
availability, but also sufficient flow rate [44,45,46] and optimized placement
of tuyeres and permeable elements[45,47]. In order to suppress slopping,
the specific flow rate capacity should be at least 60-70 Nl/tonne/min.[46]
2.3.2 Static slopping control – pre-blow preventive measures
Static slopping control measures involve anything that on a heat-to-heat basis can be
taken care of prior to blowing, such as:
i. hot metal quality: this would normally involve additions of FeSi in case of an
unusually low Si content. It could also involve additions of ferro manganese
in case of a high Si content. However, only a few (if any) of the European
BOS plants have such a practice. The simple reason for this is the fact that
the hot metal Mn content has to be in the range of 0.2 to 0.4% to secure a
22
low Mn content (0.1-0.2%) in the steel after blowing, which is required in
many of the products.
ii. scrap quality: this is a key parameter.[14,24,32] Scrap selection should be made
in respect to the total charge (i.e. hot metal, fluxes and coolant/fuels) in order
to avoid, either an under-oxidized dry slag trajectory in the case of only very
clean scrap, or an over-oxidized volcanic slag trajectory when large amounts
of very un-clean scrap are used.
iii. choice of coolants: the usual coolants are high in iron oxide, e.g., iron ore,
WOBs.[14,31] The same applies for these materials as for dirty scrap.
iv. flux blend: the base slag-forming additive in basic oxygen steelmaking is
burnt lime. As the BOS vessel in most cases has a magnesia lining, dolomitic
lime is added to saturate the slag with MgO in order to limit lining wear.
However, such a practice promotes slopping.
v. total metallic charge: this is another key factor in the prevention of slopping.
The vessel volume will normally increase with time, thus reducing slopping,
but the volume could decrease in the case of large build-ups in the bottom.
This is readily monitored by systems for inner vessel profile measurement. In
severe cases it could be possible to momentarily reduce bottom build-ups by,
after tapping, adding FeSi to retained slag and blowing oxygen for a period of
5-8 minutes.[48]
vi. blowing patterns:[14,17,24,29,39,40,42,49] the development and implementation of
precise blowing patterns for the oxygen lance positioning (lance profiles),
oxygen flow rate, additions and inert gas flow for bottom stirring as a function
of blowing time is fundamental in top-blowing.
a. lance profiles: basically, the distance between lance tip and bath
should be set in such a way that a balance between the oxidizing state
of slag and metal is achieved.
b. oxygen profiles: normally the oxygen flow rate will be kept constant in
order to maintain a stable decarburization rate. However, it could be
beneficial to reduce the oxygen flow rate in the case of additions of iron
oxide bearing materials and when expecting late melting of scrap
containing carbon, e.g. pig iron.
23
c. flux profiles: the main fluxes should be added in such a way that slag
formation is promoted, e.g. by delaying addition of dolomitic fluxes in
order to avoid blocking lime dissolution. Batch addition should be
avoided.
d. bath agitation profiles: proper bath agitation is needed to ensure good
heat and mass transfer between solid and molten phases to avoid
thermal gradients and to enhance scrap melting.
vii. control of slag properties: in order to check that the static measures taken
prior to blowing, prediction of slag properties and foaming could be made.
This would help in to ensure an optimum slag trajectory in regard to the risk
for slopping. These predictions could be either self-adapting (case-based)[50]
or heat and mass balance calculations.[14]
2.3.3 Dynamic slopping prediction and foam height estimation methods
After initiating the blow, dynamic slopping control measures can be taken, but this
requires a method for slopping prediction, either more direct by monitoring the foam
level or indirect by monitoring secondary information with a proven strong connection
with the foam level or rate of foam growth. Below are descriptions of early
developments, present industrial methods and currently developed techniques for
dynamic slopping prediction and foam height estimation.
2.3.3.1 Vessel weight monitoring [51]
A method for following the slag development presented in the mid-1970s involved
continuous vessel weighing The weight trace was used to check additions (weight
change), reaction rates (rate of weight change) and slag developments. The latter
was based on pattern recognition of the transmitted kinetic energy, expressed by the
vibration at the weight transducers. Slopping prediction was made by comparing the
weight change trace with the kinetic energy trace. A continuous weight increase was
interpreted as a sign of the rate of oxygen build-up in the slag exceeding that of the
decarburization of the melt, while a sharp increase in kinetic energy was interpreted
as indicating a rapid fluxing of the slag. If an increase in weight and kinetic energy
occurred simultaneously, slopping was to be expected.
24
2.3.3.2 Slopping prediction based on vessel flaring [52]
Another early development was based on detecting different patterns of vessel flaring
inside the hood using a photo cell,[52] aimed at a gap in the hood panels some 15
metres above the vessel mouth. It was found that rapid fluctuations in the light
intensity of the flare inside the hood indicated stable process conditions and a fluid
homogenous slag, while a considerable reduction in light intensity was a sign of an
imminent slopping.
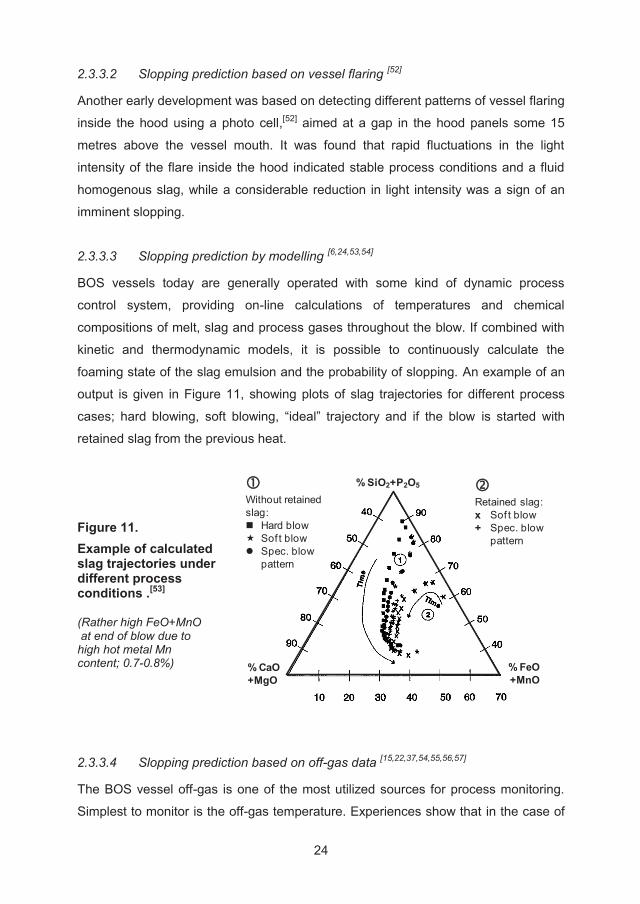
2.3.3.3 Slopping prediction by modelling [6,24,53,54]
BOS vessels today are generally operated with some kind of dynamic process
control system, providing on-line calculations of temperatures and chemical
compositions of melt, slag and process gases throughout the blow. If combined with
kinetic and thermodynamic models, it is possible to continuously calculate the
foaming state of the slag emulsion and the probability of slopping. An example of an
output is given in Figure 11, showing plots of slag trajectories for different process
cases; hard blowing, soft blowing, “ideal” trajectory and if the blow is started with
retained slag from the previous heat.
Figure 11. Example of calculated slag trajectories under different process conditions .[53]
(Rather high FeO+MnO at end of blow due to high hot metal Mn content; 0.7-0.8%)
% SiO2+P2O5
% CaO+MgO
% FeO+MnO
Without retained slag:
Hard blowSoft blowSpec. blow pattern
Retained slag:x Soft blow+ Spec. blow
pattern
2.3.3.4 Slopping prediction based on off-gas data [15,22,37,54,55,56,57]
The BOS vessel off-gas is one of the most utilized sources for process monitoring.
Simplest to monitor is the off-gas temperature. Experiences show that in the case of
25
full post-combustion, and only then, can there be a correlation between rapid
changes in off-gas temperature and slopping. The change in off-gas temperature is
to a great extent the result of post-combustion of CO to CO2 by air; the higher the
flow rate of process gas (mainly CO) out of the vessel, the more heat generated by
post-combustion.
With both off-gas analysis and flow rate it is possible to calculate not only the
decarburization rate, but also the oxygen balance at any stage in the blow. By
comparing the oxygen supplied to the process with the consumed oxygen, it is
possible to determine if the oxygen level in the slag emulsion is stable, increasing
towards an over-oxidized state or decreasing towards an under-oxidized state. This
important information can then be compared to other foaming-related data in order to
predict the risk of imminent slopping.
2.3.3.5 Foam height estimation via vessel side entry [58,59]
The methods described so far involve calculating the slopping probability based on
process output data, not efforts to directly or indirectly measure the actual foam
height (and its progression). Two novel methods for foam height estimation utilize a
side entry into the vessel; one using a camera to monitor the exit of slag emulsion
through the taphole,[58] the other using a fiberscope looking into the vessel via
customized view ports.[59] The first of these methods also estimates the foam height
by looking at the flow of slag exiting the vessel via the taphole. By applying
Bernouilli’s equation, it is possible to judge the change in foam height from the
change in slag volume flow.
With the second method, optic fibres provide processed images of the foam level
inside the vessel. By wavelength separation of the light refractory, gas and slag can
be distinguished. As flames will appear whiter and slag yellower in the processed
picture, the ratio of yellow area in the image will give a measure of the slag/foam ratio
inside the view port. Two view ports are used; the lower 2.5 metres and the upper 1.5
metres below the vessel mouth. The time for the foaming slag to expand from the
lower to the upper port is then used to predict, by extrapolation, when the foam is
expected to reach the vessel mouth.
26
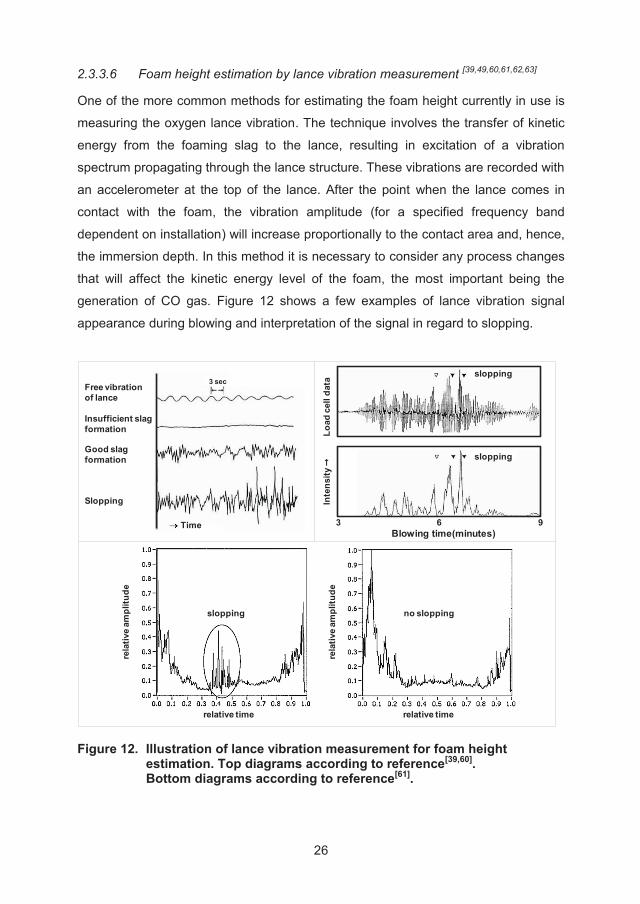
2.3.3.6 Foam height estimation by lance vibration measurement [39,49,60,61,62,63]
One of the more common methods for estimating the foam height currently in use is
measuring the oxygen lance vibration. The technique involves the transfer of kinetic
energy from the foaming slag to the lance, resulting in excitation of a vibration
spectrum propagating through the lance structure. These vibrations are recorded with
an accelerometer at the top of the lance. After the point when the lance comes in
contact with the foam, the vibration amplitude (for a specified frequency band
dependent on installation) will increase proportionally to the contact area and, hence,
the immersion depth. In this method it is necessary to consider any process changes
that will affect the kinetic energy level of the foam, the most important being the
generation of CO gas. Figure 12 shows a few examples of lance vibration signal
appearance during blowing and interpretation of the signal in regard to slopping.
rela
tive
ampl
itude
rela
tive
ampl
itude
relative time relative time
slopping no slopping
Free vibrationof lance
Insufficient slagformation
Good slag formation
Slopping
Time
3 secslopping
slopping
Inte
nsity
Lo
ad c
ell d
ata
3 6 9Blowing time(minutes)
Figure 12. Illustration of lance vibration measurement for foam height estimation. Top diagrams according to reference[39,60]. Bottom diagrams according to reference[61].
27
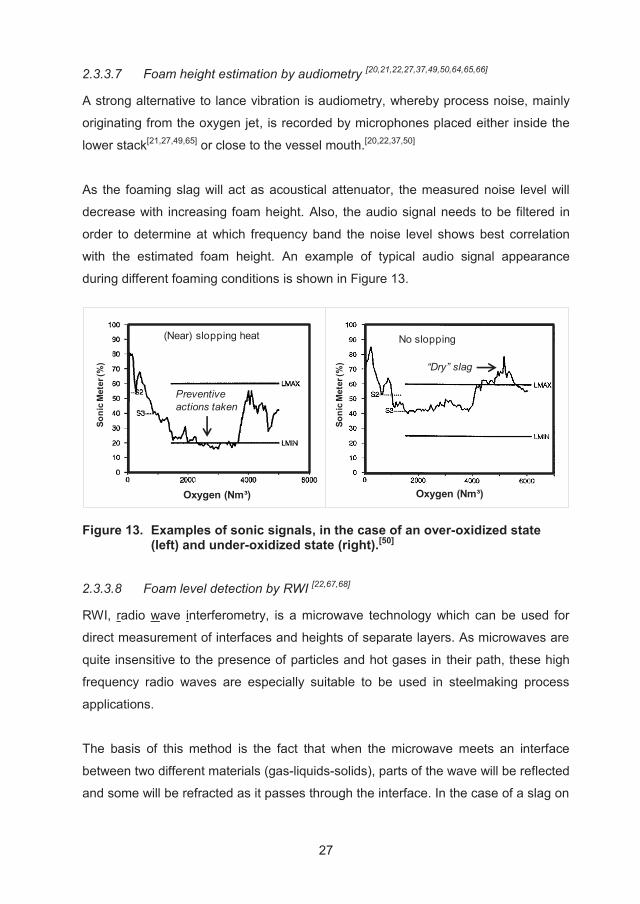
2.3.3.7 Foam height estimation by audiometry [20,21,22,27,37,49,50,64,65,66]
A strong alternative to lance vibration is audiometry, whereby process noise, mainly
originating from the oxygen jet, is recorded by microphones placed either inside the
lower stack[21,27,49,65] or close to the vessel mouth.[20,22,37,50]
As the foaming slag will act as acoustical attenuator, the measured noise level will
decrease with increasing foam height. Also, the audio signal needs to be filtered in
order to determine at which frequency band the noise level shows best correlation
with the estimated foam height. An example of typical audio signal appearance
during different foaming conditions is shown in Figure 13.
Soni
c M
eter
(%)
Soni
c M
eter
(%)
(Near) slopping heat
Preventive actions taken
No slopping
“Dry” slag
Oxygen (Nm³)Oxygen (Nm³)
Figure 13. Examples of sonic signals, in the case of an over-oxidized state (left) and under-oxidized state (right).[50]
2.3.3.8 Foam level detection by RWI [22,67,68]
RWI, radio wave interferometry, is a microwave technology which can be used for
direct measurement of interfaces and heights of separate layers. As microwaves are
quite insensitive to the presence of particles and hot gases in their path, these high
frequency radio waves are especially suitable to be used in steelmaking process
applications.
The basis of this method is the fact that when the microwave meets an interface
between two different materials (gas-liquids-solids), parts of the wave will be reflected
and some will be refracted as it passes through the interface. In the case of a slag on
28
top of a metal bath, the refracted wave that has passed through the gas-slag
interface will in its turn be partially reflected and refracted when it reaches the slag-
metal interface. As there will be a difference in the properties of the waves returning
from the metal surface and the slag surface, it is possible, by careful signal
treatment, to determine the position of each interface and, hence, get a direct
measure of the slag/foam height.
Theoretically, RWI technology should be very useful in slag foaming monitoring and
slopping prediction, even replacing many established but indirect methods. However,
it should be pointed out that, as the foam consists of a large and variable number of
gas-liquid, gas-solid and liquid-solid interfaces, there is some uncertainty as to the
accuracy of the use of radio waves for foam height measurement.
Practical problems have slowed down the work with utilization of the RWI technology.
The microwave unit has to be placed very close to the vessel mouth in order to
ensure an unobstructed passage into the vessel. This makes the unit very exposed
to skulling by molten material ejected up into the hood. Technical solutions to this
problem would be quite costly and an installation is only possible in connection with
replacement of the lower sections of the vessel hood.
2.3.3.9 Slopping prediction by combined methods [21,22,27,49,65,68]
All indirect methods for slopping prediction will at different stages of the process be
“contaminated” by other phenomena not related to slopping. The precision will
therefore increase if methods are combined. It is also important to acknowledge that,
for several of the described methods, it is the rate of change more than the absolute
signal level that will give the best prediction of an imminent slopping.
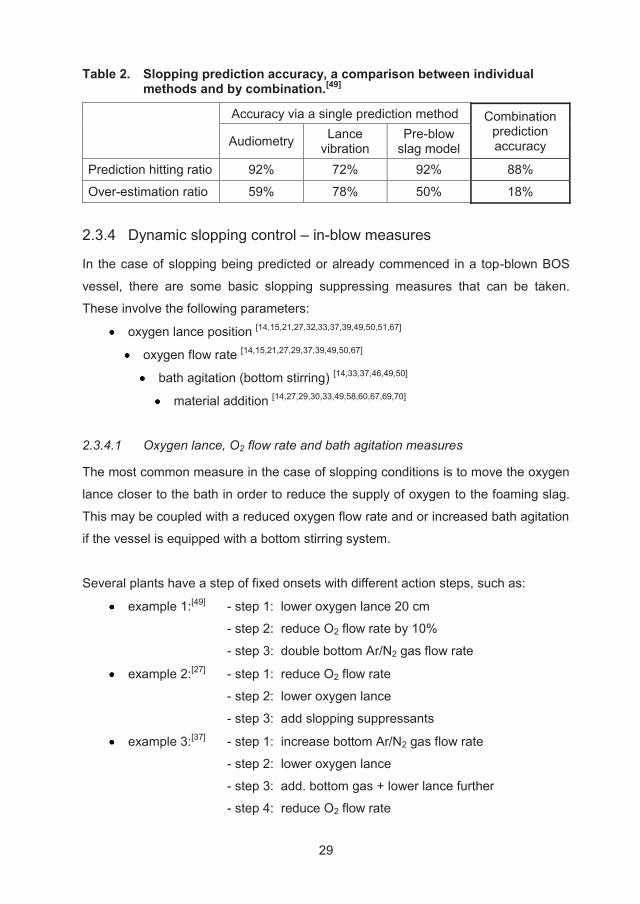
Reported accuracies in regard to predicting slopping range from 60% to 80%. An
interesting remark is that pre-blow calculation can give a 70-75% accuracy,[27]
whereas, for the same case, in-blow dynamic measurements and calculations show
roughly 5% lower accuracy. An account on the precision of slopping prediction
(shown in Table 2) has been given by Kanai et al.[49]
29
Table 2. Slopping prediction accuracy, a comparison between individual methods and by combination.[49]
Accuracy via a single prediction method Combination prediction accuracy Audiometry Lance
vibration Pre-blow
slag model Prediction hitting ratio 92% 72% 92% 88%
Over-estimation ratio 59% 78% 50% 18%
2.3.4 Dynamic slopping control – in-blow measures
In the case of slopping being predicted or already commenced in a top-blown BOS
vessel, there are some basic slopping suppressing measures that can be taken.
These involve the following parameters:
oxygen lance position [14,15,21,27,32,33,37,39,49,50,51,67]
oxygen flow rate [14,15,21,27,29,37,39,49,50,67]
bath agitation (bottom stirring) [14,33,37,46,49,50]
material addition [14,27,29,30,33,49,58,60,67,69,70]
2.3.4.1 Oxygen lance, O2 flow rate and bath agitation measures
The most common measure in the case of slopping conditions is to move the oxygen
lance closer to the bath in order to reduce the supply of oxygen to the foaming slag.
This may be coupled with a reduced oxygen flow rate and or increased bath agitation
if the vessel is equipped with a bottom stirring system.
Several plants have a step of fixed onsets with different action steps, such as:
example 1:[49] - step 1: lower oxygen lance 20 cm
- step 2: reduce O2 flow rate by 10%
- step 3: double bottom Ar/N2 gas flow rate
example 2:[27] - step 1: reduce O2 flow rate
- step 2: lower oxygen lance
- step 3: add slopping suppressants
example 3:[37] - step 1: increase bottom Ar/N2 gas flow rate
- step 2: lower oxygen lance
- step 3: add. bottom gas + lower lance further
- step 4: reduce O2 flow rate
30
It is clear that when and in which order slopping preventive measures are taken are
based on local conditions and experiences. Even though strategies and methods
may differ between plants, there are basic considerations that must be
acknowledged. The first and foremost is that it must be determined whether the
foaming slag is under- or over-oxidized.[15,29] If over-oxidized, lowering the lance is
more effective than reducing the oxygen flow rate. The latter will lead to softer
blowing, worsening the situation. For the same reasons, if the foam is under-
oxidized, reducing the oxygen flow rate, without lowering the lance, is the correct
measure. In this case, it could actually be a correct measure to raise the lance in
order to increase the oxygen level in the slag foam.
Increasing bath agitation will always be a proper measure to avoid or dampen
slopping. However, it will only have an impact after slopping has commenced if the
bottom gas flow rate is increased considerably. A suggested minimum specific
bottom gas flow rate is 60-65 Nl/tonne/min.[46]
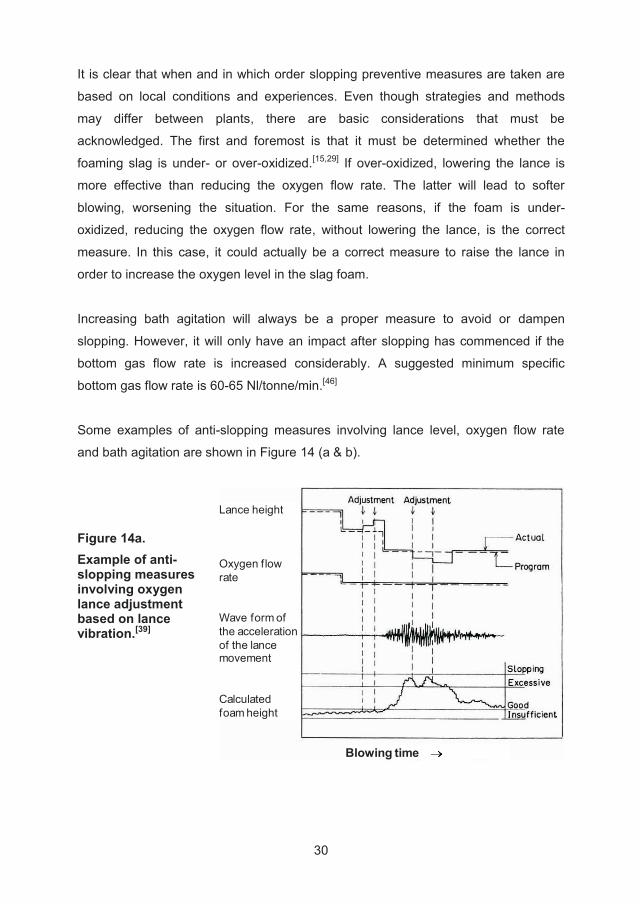
Some examples of anti-slopping measures involving lance level, oxygen flow rate
and bath agitation are shown in Figure 14 (a & b).
Figure 14a. Example of anti-slopping measures involving oxygen lance adjustment based on lance vibration.[39]
Lance height
Oxygen flowrate
Wave form ofthe accelerationof the lancemovement
Calculated foam height
Blowing time
31
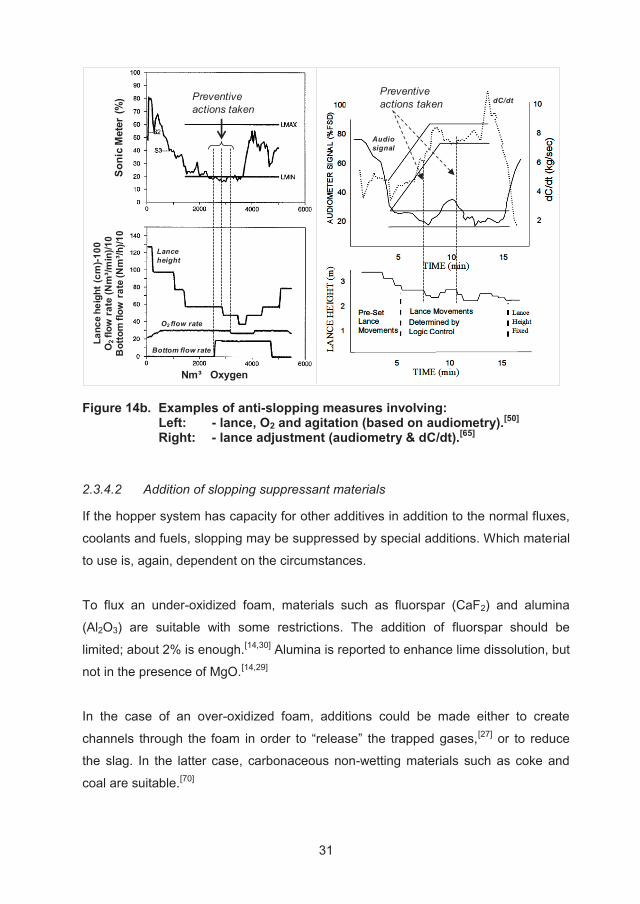
Preventive actions taken
Nm³ Oxygen
Soni
c M
eter
(%)
Lanc
e he
ight
(cm
)-100
O2
flow
rate
(Nm
³/min
)/10
Bot
tom
flow
rat
e (N
m³/h
)/10
Lanceheight
O2 flow rate
Bottom flow rate
Preventive actions taken
Audiosignal
dC/dt
Figure 14b. Examples of anti-slopping measures involving: Left: - lance, O2 and agitation (based on audiometry).[50] Right: - lance adjustment (audiometry & dC/dt).[65]
2.3.4.2 Addition of slopping suppressant materials
If the hopper system has capacity for other additives in addition to the normal fluxes,
coolants and fuels, slopping may be suppressed by special additions. Which material
to use is, again, dependent on the circumstances.
To flux an under-oxidized foam, materials such as fluorspar (CaF2) and alumina
(Al2O3) are suitable with some restrictions. The addition of fluorspar should be
limited; about 2% is enough.[14,30] Alumina is reported to enhance lime dissolution, but
not in the presence of MgO.[14,29]
In the case of an over-oxidized foam, additions could be made either to create
channels through the foam in order to “release” the trapped gases,[27] or to reduce
the slag. In the latter case, carbonaceous non-wetting materials such as coke and
coal are suitable.[70]
32
For creating channels “heavy” materials are needed. For this purpose materials such
as alumina, limestone, dolostone (i.e. raw dolomite) and iron ore are used. However,
both alumina and iron ore are wettable materials which do not break the foam.[70]
Moreover, adding iron ore will add unwanted extra oxygen.
Dolostone is a very common material used in the effort to suppress slopping, but its
efficacy is in this respect highly debateable.[14,29] There is a view that dolostone only
has a temporary effect on slopping. The addition will result in large emissions of dust
and fumes (due to the release of CO2 by the calcination), as well as in an increase in
second phase particles in the foam. Experience shows that, after an initial reduction,
slopping resumes and is more vigorous than before the dolostone addition.
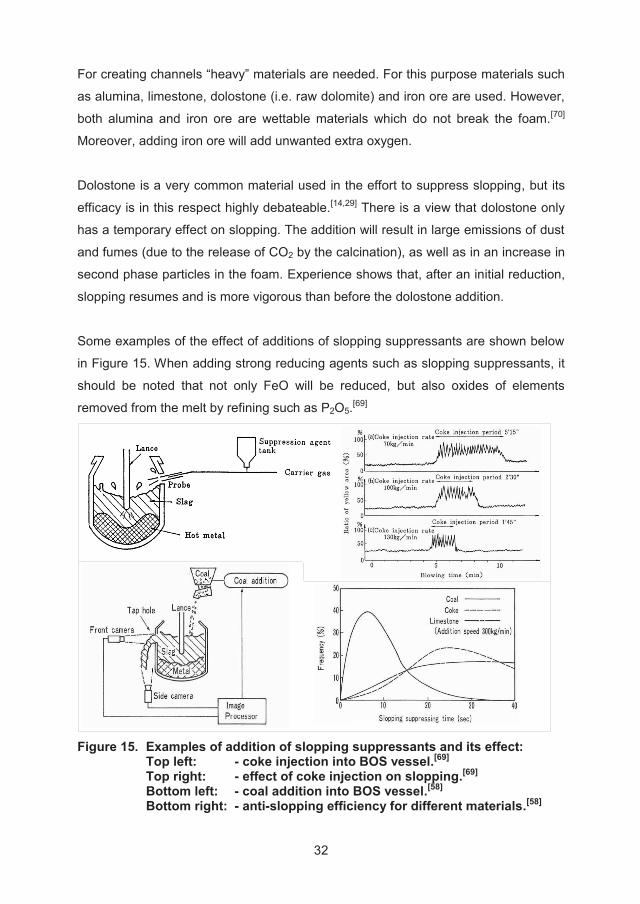
Some examples of the effect of additions of slopping suppressants are shown below
in Figure 15. When adding strong reducing agents such as slopping suppressants, it
should be noted that not only FeO will be reduced, but also oxides of elements
removed from the melt by refining such as P2O5.[69]
Figure 15. Examples of addition of slopping suppressants and its effect:
Top left: - coke injection into BOS vessel.[69] Top right: - effect of coke injection on slopping.[69] Bottom left: - coal addition into BOS vessel.[58] Bottom right: - anti-slopping efficiency for different materials.[58]
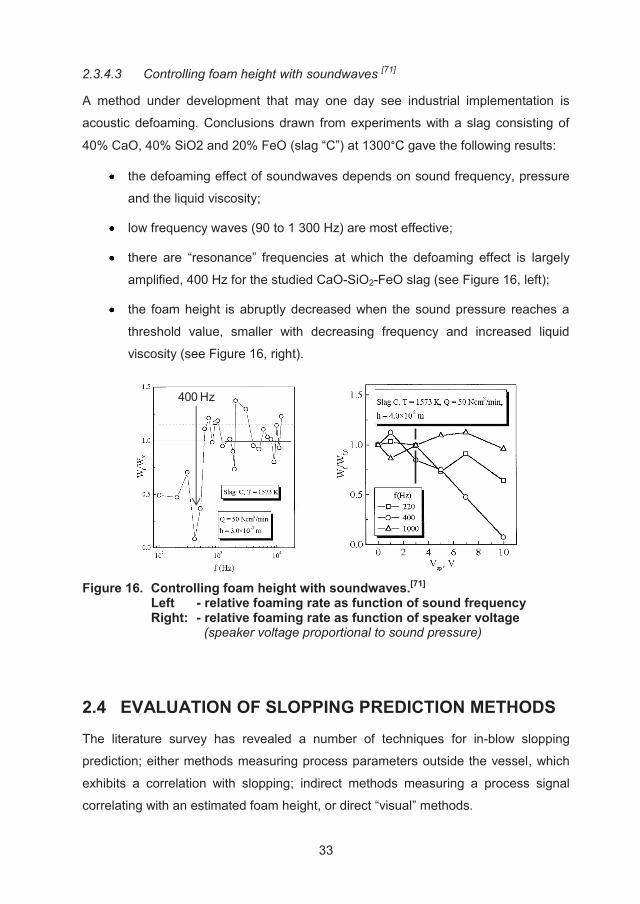
33
2.3.4.3 Controlling foam height with soundwaves [71]
A method under development that may one day see industrial implementation is
acoustic defoaming. Conclusions drawn from experiments with a slag consisting of
40% CaO, 40% SiO2 and 20% FeO (slag “C”) at 1300°C gave the following results:
the defoaming effect of soundwaves depends on sound frequency, pressure
and the liquid viscosity;
low frequency waves (90 to 1 300 Hz) are most effective;
there are “resonance” frequencies at which the defoaming effect is largely
amplified, 400 Hz for the studied CaO-SiO2-FeO slag (see Figure 16, left);
the foam height is abruptly decreased when the sound pressure reaches a
threshold value, smaller with decreasing frequency and increased liquid
viscosity (see Figure 16, right).
400 Hz
Figure 16. Controlling foam height with soundwaves.[71]
Left - relative foaming rate as function of sound frequency Right: - relative foaming rate as function of speaker voltage (speaker voltage proportional to sound pressure)
2.4 EVALUATION OF SLOPPING PREDICTION METHODS
The literature survey has revealed a number of techniques for in-blow slopping
prediction; either methods measuring process parameters outside the vessel, which
exhibits a correlation with slopping; indirect methods measuring a process signal
correlating with an estimated foam height, or direct “visual” methods.
34
2.4.1 External vessel measurements
The first group generally consists of methods that utilize off-gas data, e.g. flaring
behaviour, temperature and analysis combined with flow rate. Pattern recognition of
vessel flaring is in itself a quite simple method and has been reported to improve the
slopping prediction accuracy, leading to a 0.6% increase in metallic yield. However,
the method demands visual access into the vessel hood via some kind of open entry,
in normal enclosed conditions only possible by extensive engineering. Even though
the flare intensity is reported to be strongly dependent on slag basicity, main issues
would be that the method requires that no additions are made when there is a need
to predict slopping and that dust is prevented from blocking the entry or coming into
contact with the measurement equipment.
Measuring off-gas temperature is comparatively simple and demands minimum
maintenance. The signal could give information about one of the two fundamental
parameters included in the foaming index, i.e. the gas velocity. However, as
mentioned earlier, off-gas temperature can only be used in process control and for
slopping prediction in the case of “fully combustion” circumstances, hence, it is not
applicable in the Luleå case.
Off-gas analysis in combination with off-gas flow rate measurement will, theoretically,
give information about both the oxidizing state of the slag and the gas velocity. The
method is probably more widely used than reported, but it is necessary to have a
high accuracy in and availability of all measured parameters, including the oxygen
and nitrogen contents of the off-gas and a short response time (<< 30 seconds). The
method should probably be regarded as requiring a higher level of maintenance.
2.4.2 Indirect vessel measurements
This group of in-blow slopping prediction techniques involves utilizing vessel
weighing, lance vibration and audiometry, of which the latter two are the most
frequently used. Vessel weighing relies very much on pattern recognition of relatively
simply attainable signals. An important feature is the calculation of the change in
oxygen content and, hence, the oxidizing state of the slag based on weight change.
This would demand quite accurate weighing, as a change in FeO content from 20%
35
to 25% is equivalent to a relative weight increase of the whole vessel-charge system
by a mere 0.075% (e.g. +450 kg for a total vessel-charge weight of over 600 tonne, in
the Luleå case). Even though the method is theoretically relatively simple, it is not a
simple matter to place a vessel on load cells, and there would be questions about life
expectancy and the possibility to replace damaged load cells.
Lance vibration is also a rather straight-forward technique with a relatively low level
of maintenance. An advantage is that this method only reacts on the phenomenon for
which it is intended, unless the lance is hit by solid objects such as in-blow additions
and dropping hood skulls, causing the excitation of vibrations within the applied
frequency band. A drawback is that a useful signal is only achieved when the lance is
in direct contact with the foam, i.e. not in the early stages of the blow and not if there
is a strong central process gas flow around the lance. Other issues would be the
lance vibration behaviour in the case of lance skulling and the need to confirm the
appropriate frequency band when changing lances.
Audiometry is regarded as perhaps the most accurate method today (as indicated in
Table 2). It is, like lance vibration, a simple technique reacting mainly to a single
process phenomenon, in this case to the noise created by the oxygen jet. The
equipment is, however, sensitive to dust contamination. The drawbacks are similar to
the ones for lance vibration; the need for the lance tip to become submerged into the
foam and a complete horizontal foam coverage within the vessel. Therefore, a usable
signal is not obtained in the very early stages of the blow.
2.4.3 “Visual” methods
Reported “visual” recordings of the foam level in order to predict slopping involve the
direct methods of either attaining direct access to the vessel interior via specially
made inspection holes or the recently ongoing development utilizing radio waves
(RWI). The former would not be the first choice for several technical and safety
reasons, even though it would provide defined limits when slopping preventive in-
blow measures should be taken. RWI is still very much in a development stage,
where (as earlier described) the main issue is facilitating a protective environment for
the transmitter/receiver.
36
2.4.4 Evaluation summary
It is difficult to make a final judgement as many of the technical reports are from the
development stage, where the results are strongly dependent on local circumstances
and where there is a general lack of conclusive results and comparisons with other
methods. Therefore, the simplest way may be to make the judgement based on
which methods are most commonly used today.
As already mentioned, two methods stand out; lance vibration and audiometry. Of
these two, audiometry seems to be the most common. If this is only due to a higher
accuracy, as suggested in Table 2, or to functional stability is not conclusively evident
from the literature. As each method has its drawbacks, a combination would increase
the slopping prediction accuracy considerably. However, neither method gives any
information on foaming during the initial stages of blowing. Consequently, there is a
need for other methods, such as RWI, that would give information from the very start
of the blow. There is, however, a method that has not yet been discussed due to the
lack of public information; namely, BOS vessel vibration monitoring. This technique
was tested and evaluated a SSAB Luleå vessel in the early-1980s with quite
promising results.
Finally, even though it seems that this feature is not commonly utilized, calculating
the slopping probability based on charge data can be as powerful a tool as any in-
blow indirect slopping prediction technique (as indicated in Table 2), provided the
input data are of high quality. This applies to pre-blow calculations of slag emulsion
foaming characteristics, as well as to in-blow calculations based on off-gas analysis.
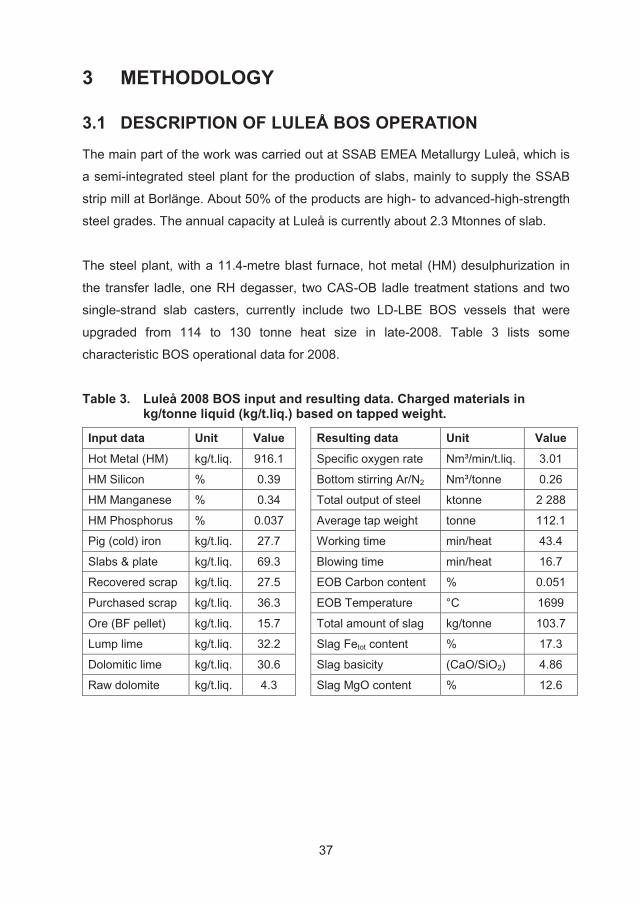
37
3 METHODOLOGY
3.1 DESCRIPTION OF LULEÅ BOS OPERATION
The main part of the work was carried out at SSAB EMEA Metallurgy Luleå, which is
a semi-integrated steel plant for the production of slabs, mainly to supply the SSAB
strip mill at Borlänge. About 50% of the products are high- to advanced-high-strength
steel grades. The annual capacity at Luleå is currently about 2.3 Mtonnes of slab.
The steel plant, with a 11.4-metre blast furnace, hot metal (HM) desulphurization in
the transfer ladle, one RH degasser, two CAS-OB ladle treatment stations and two
single-strand slab casters, currently include two LD-LBE BOS vessels that were
upgraded from 114 to 130 tonne heat size in late-2008. Table 3 lists some
characteristic BOS operational data for 2008.
Table 3. Luleå 2008 BOS input and resulting data. Charged materials in kg/tonne liquid (kg/t.liq.) based on tapped weight.
Input data Unit Value Resulting data Unit Value
Hot Metal (HM) kg/t.liq. 916.1 Specific oxygen rate Nm³/min/t.liq. 3.01
HM Silicon % 0.39 Bottom stirring Ar/N2 Nm³/tonne 0.26
HM Manganese % 0.34 Total output of steel ktonne 2 288
HM Phosphorus % 0.037 Average tap weight tonne 112.1
Pig (cold) iron kg/t.liq. 27.7 Working time min/heat 43.4
Slabs & plate kg/t.liq. 69.3 Blowing time min/heat 16.7
Recovered scrap kg/t.liq. 27.5 EOB Carbon content % 0.051
Purchased scrap kg/t.liq. 36.3 EOB Temperature °C 1699
Ore (BF pellet) kg/t.liq. 15.7 Total amount of slag kg/tonne 103.7
Lump lime kg/t.liq. 32.2 Slag Fetot content % 17.3
Dolomitic lime kg/t.liq. 30.6 Slag basicity (CaO/SiO2) 4.86
Raw dolomite kg/t.liq. 4.3 Slag MgO content % 12.6
38
3.2 SLOPPING REGISTRATION AND CAUSE ANALYSIS
3.2.1 Slopping registration method
For the investigation into the causes behind slopping it was necessary to install a
system for automatic recording of slopping events, both in regard to time and to
severity. For this purpose SSAB decided to install a system based on image analysis.
This was done on the Luleå BOS vessel LD1 in October of 2007 and on vessel LD2
in February 2009. Existing CCTVs covering the area beneath each vessel are
utilized.
A description of the slopping registration set-up and function is found in Appendix I. It
delivers a 1-second number called the slopping value (in %), calculated as the
percentage of light pixels relative to the total number of pixels in the designated
scanning area of the total camera image. For detailed studies a 2-second average
value is stored for a period of up to 14 days. For long-term follow-up a slopping index
(Σ%) is calculated for each heat by accumulating the 1-second slopping value over
the main oxygen blowing period. An average slopping value for each individual
blowing minute, from the first to the twentieth, is also calculated and stored
“indefinitely”.
3.2.2 Slopping causes investigation method
The complexity of the LD process and the insecurity in regard to the confidence level
of the recorded process data makes any process analysis quite challenging.
Therefore, to find clear correlations between specific process parameters and
slopping, a large number of heats have been analysed. It was decided to collect
process data for a period of 53 weeks of full production on BOS vessel LD1, starting
in October 2007 just after the installation of the slopping registration system and
ending in October 2008 prior to the increase in heat size from 114 to 130 tonnes.
Data for over 11,000 heats have been collected and scrutinized. The final data set
comprises more than 7,100 heats (observations), each with values for 70 process
parameters (variables). Hence, the total data set to be analysed has close to half a
million individual data.
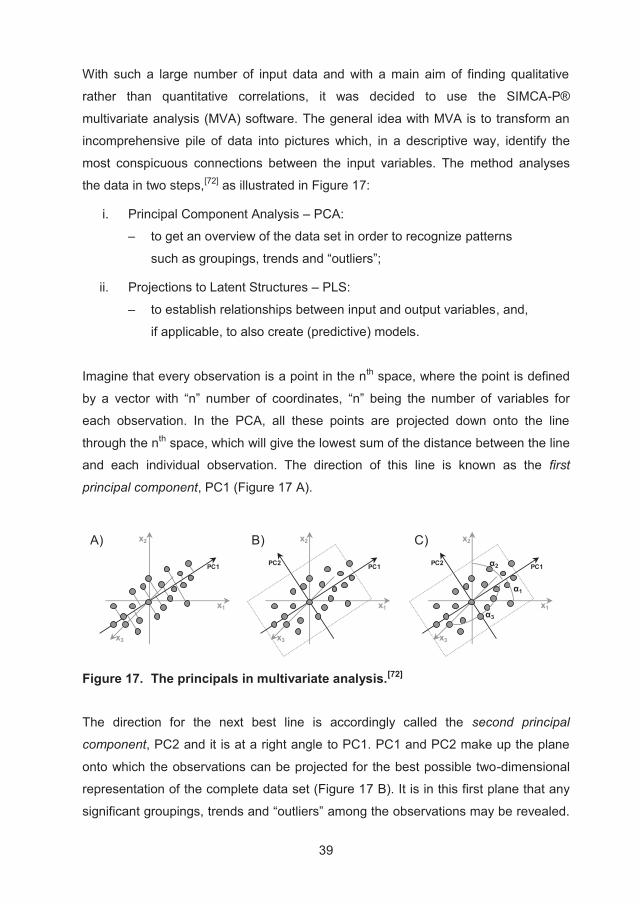
39
With such a large number of input data and with a main aim of finding qualitative
rather than quantitative correlations, it was decided to use the SIMCA-P®
multivariate analysis (MVA) software. The general idea with MVA is to transform an
incomprehensive pile of data into pictures which, in a descriptive way, identify the
most conspicuous connections between the input variables. The method analyses
the data in two steps,[72] as illustrated in Figure 17:
i. Principal Component Analysis – PCA:
– to get an overview of the data set in order to recognize patterns
such as groupings, trends and “outliers”;
ii. Projections to Latent Structures – PLS:
– to establish relationships between input and output variables, and,
if applicable, to also create (predictive) models.
Imagine that every observation is a point in the nth space, where the point is defined
by a vector with “n” number of coordinates, “n” being the number of variables for
each observation. In the PCA, all these points are projected down onto the line
through the nth space, which will give the lowest sum of the distance between the line
and each individual observation. The direction of this line is known as the first
principal component, PC1 (Figure 17 A).
A) B) C)
x1
x2
x3
PC1PC2
x1
x2
x3
PC1PC2 α2
α1
α3
x1
x2
x3
PC1
Figure 17. The principals in multivariate analysis.[72]
The direction for the next best line is accordingly called the second principal
component, PC2 and it is at a right angle to PC1. PC1 and PC2 make up the plane
onto which the observations can be projected for the best possible two-dimensional
representation of the complete data set (Figure 17 B). It is in this first plane that any
significant groupings, trends and “outliers” among the observations may be revealed.
40
If not, perhaps in the next best plane made up by PC1 and PC3, or by PC2 and PC3,
or by PC1 and PC4, etc.
In the projection process the principal components axis has replaced the original
variables. This enables determination of the impact of the individual variable, as a
small angle between the axis for an original variable and a principal component axis
indicate a strong impact in the PC direction (Figure 17 C), contrary to a large angle.
3.3 VESSEL VIBRATION FOR FOAM HEIGHT ESTIMATION
3.3.1 Earlier experiences
The first BOS (LD) vessel was installed in Luleå in 1972 and the plant was fully
converted to steelmaking via the LD process in 1976, when the second LD vessel
was commissioned. Initial process control development was slow, mainly due to lack
of in-house experience of the top-blown process. Hence, in 1978 SSAB sought the
assistance of Kawasaki Steel, which resulted in, among other things, the investment
in a sublance process control system in 1980.
In addition to the sublance system, installation of a lance vibration measurement
system for foaming and slag level control was recommended. Trials were conducted,
but technical problems in connection with frequent lance changes and continuous
problems with lance skulling shifting the optimum frequency band resulted in an early
abandonment of this method. Instead, it was decided to test measuring the vibrations
of the vessel itself, also a method investigated by Kawasaki Steel in the 1970s.[39]
Development began in 1981 and was carried out with the assistance of vibration
specialists from Luleå University of Technology. The vibrations were measured by
placing an accelerometer on the bearing housing on the drive side of the vessel.
Records from the initial work are scarce and confined to a single internal report,[73] in
which the following conclusions are stated:
“ (1) At 10 Hz frequency the registered amplitude should be between 15% and
60% on the printer scale during the decarburization period for good process
behaviour;
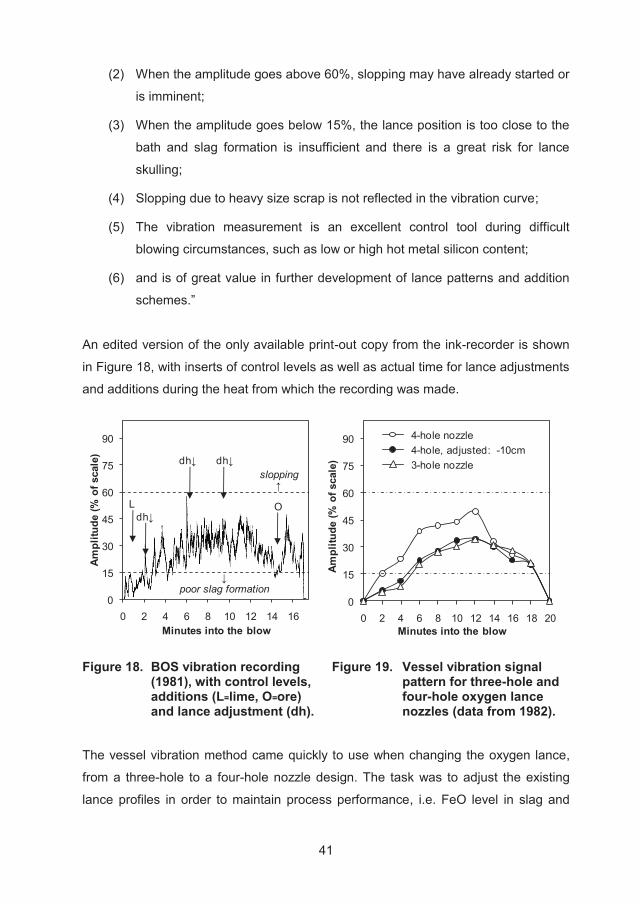
41
(2) When the amplitude goes above 60%, slopping may have already started or
is imminent;
(3) When the amplitude goes below 15%, the lance position is too close to the
bath and slag formation is insufficient and there is a great risk for lance
skulling;
(4) Slopping due to heavy size scrap is not reflected in the vibration curve;
(5) The vibration measurement is an excellent control tool during difficult
blowing circumstances, such as low or high hot metal silicon content;
(6) and is of great value in further development of lance patterns and addition
schemes.”
An edited version of the only available print-out copy from the ink-recorder is shown
in Figure 18, with inserts of control levels as well as actual time for lance adjustments
and additions during the heat from which the recording was made.
0
15
30
45
60
75
90
0 2 4 6 8 10 12 14 16 18 20
Ampl
itude
(% o
f sca
le)
Minutes into the blow
4-hole nozzle4-hole, adjusted: -10cm3-hole nozzle
L Odh↓
slopping↑
↓poor slag formation
0
15
30
45
60
75
90
0 2 4 6 8 10 12 14 16
Ampl
itude
(% o
f sca
le)
Minutes into the blow
dh↓ dh↓
Figure 18. BOS vibration recording (1981), with control levels, additions (L=lime, O=ore) and lance adjustment (dh).
Figure 19. Vessel vibration signal pattern for three-hole and four-hole oxygen lance nozzles (data from 1982).
The vessel vibration method came quickly to use when changing the oxygen lance,
from a three-hole to a four-hole nozzle design. The task was to adjust the existing
lance profiles in order to maintain process performance, i.e. FeO level in slag and
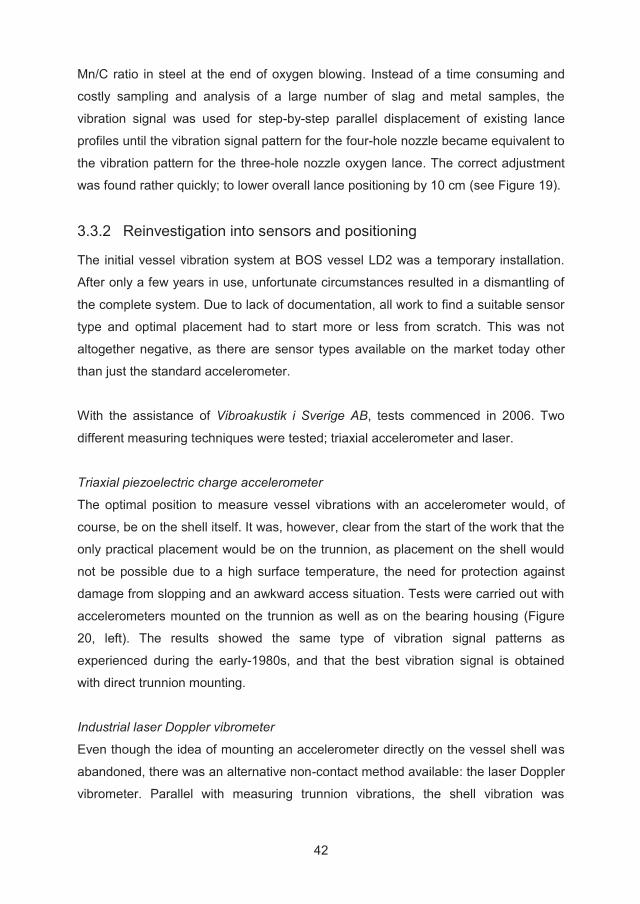
42
Mn/C ratio in steel at the end of oxygen blowing. Instead of a time consuming and
costly sampling and analysis of a large number of slag and metal samples, the
vibration signal was used for step-by-step parallel displacement of existing lance
profiles until the vibration signal pattern for the four-hole nozzle became equivalent to
the vibration pattern for the three-hole nozzle oxygen lance. The correct adjustment
was found rather quickly; to lower overall lance positioning by 10 cm (see Figure 19).
3.3.2 Reinvestigation into sensors and positioning
The initial vessel vibration system at BOS vessel LD2 was a temporary installation.
After only a few years in use, unfortunate circumstances resulted in a dismantling of
the complete system. Due to lack of documentation, all work to find a suitable sensor
type and optimal placement had to start more or less from scratch. This was not
altogether negative, as there are sensor types available on the market today other
than just the standard accelerometer.
With the assistance of Vibroakustik i Sverige AB, tests commenced in 2006. Two
different measuring techniques were tested; triaxial accelerometer and laser.
Triaxial piezoelectric charge accelerometer
The optimal position to measure vessel vibrations with an accelerometer would, of
course, be on the shell itself. It was, however, clear from the start of the work that the
only practical placement would be on the trunnion, as placement on the shell would
not be possible due to a high surface temperature, the need for protection against
damage from slopping and an awkward access situation. Tests were carried out with
accelerometers mounted on the trunnion as well as on the bearing housing (Figure
20, left). The results showed the same type of vibration signal patterns as
experienced during the early-1980s, and that the best vibration signal is obtained
with direct trunnion mounting.
Industrial laser Doppler vibrometer
Even though the idea of mounting an accelerometer directly on the vessel shell was
abandoned, there was an alternative non-contact method available: the laser Doppler
vibrometer. Parallel with measuring trunnion vibrations, the shell vibration was
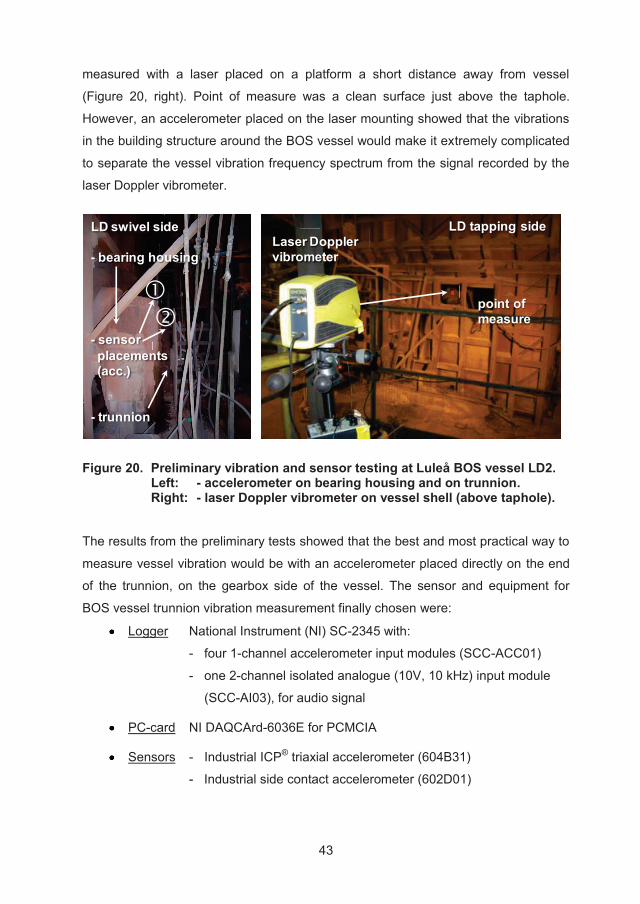
43
measured with a laser placed on a platform a short distance away from vessel
(Figure 20, right). Point of measure was a clean surface just above the taphole.
However, an accelerometer placed on the laser mounting showed that the vibrations
in the building structure around the BOS vessel would make it extremely complicated
to separate the vessel vibration frequency spectrum from the signal recorded by the
laser Doppler vibrometer.
LD tapping sideLaser Dopplervibrometer
point of measure
LD swivel side
- bearing housing
- sensorplacements(acc.)
- trunnion
Figure 20. Preliminary vibration and sensor testing at Luleå BOS vessel LD2. Left: - accelerometer on bearing housing and on trunnion. Right: - laser Doppler vibrometer on vessel shell (above taphole).
The results from the preliminary tests showed that the best and most practical way to
measure vessel vibration would be with an accelerometer placed directly on the end
of the trunnion, on the gearbox side of the vessel. The sensor and equipment for
BOS vessel trunnion vibration measurement finally chosen were:
Logger National Instrument (NI) SC-2345 with:
- four 1-channel accelerometer input modules (SCC-ACC01)
- one 2-channel isolated analogue (10V, 10 kHz) input module
(SCC-AI03), for audio signal
PC-card NI DAQCArd-6036E for PCMCIA
Sensors - Industrial ICP® triaxial accelerometer (604B31)
- Industrial side contact accelerometer (602D01)
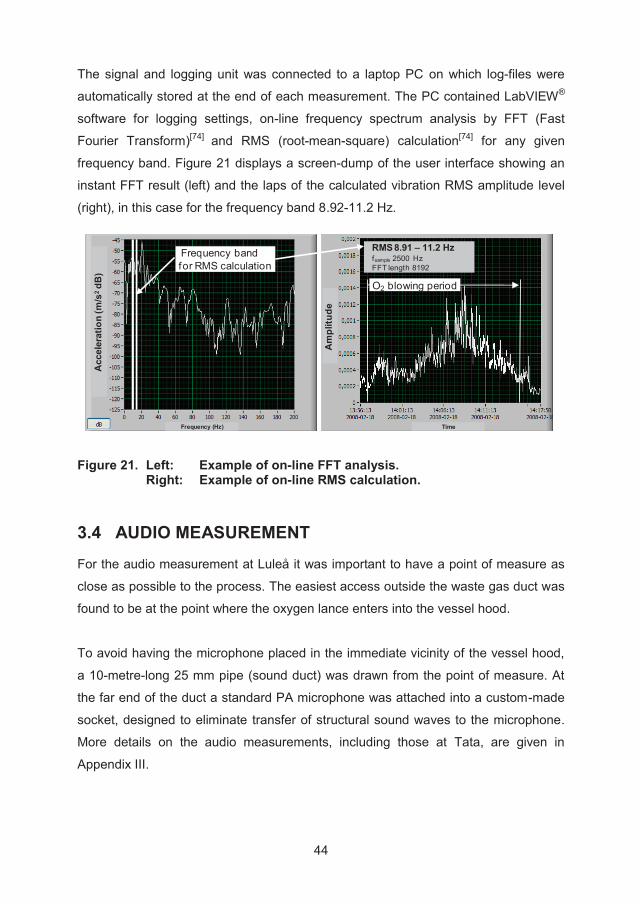
44
The signal and logging unit was connected to a laptop PC on which log-files were
automatically stored at the end of each measurement. The PC contained LabVIEW®
software for logging settings, on-line frequency spectrum analysis by FFT (Fast
Fourier Transform)[74] and RMS (root-mean-square) calculation[74] for any given
frequency band. Figure 21 displays a screen-dump of the user interface showing an
instant FFT result (left) and the laps of the calculated vibration RMS amplitude level
(right), in this case for the frequency band 8.92-11.2 Hz.
RMS 8.91 – 11.2 Hzfsample 2500 HzFFT length 8192
Time
Am
plitu
de
Frequency (Hz)
Acc
eler
atio
n (m
/s2dB
)
O2 blowing period
Frequency band for RMS calculation
Figure 21. Left: Example of on-line FFT analysis. Right: Example of on-line RMS calculation.
3.4 AUDIO MEASUREMENT
For the audio measurement at Luleå it was important to have a point of measure as
close as possible to the process. The easiest access outside the waste gas duct was
found to be at the point where the oxygen lance enters into the vessel hood.
To avoid having the microphone placed in the immediate vicinity of the vessel hood,
a 10-metre-long 25 mm pipe (sound duct) was drawn from the point of measure. At
the far end of the duct a standard PA microphone was attached into a custom-made
socket, designed to eliminate transfer of structural sound waves to the microphone.
More details on the audio measurements, including those at Tata, are given in
Appendix III.
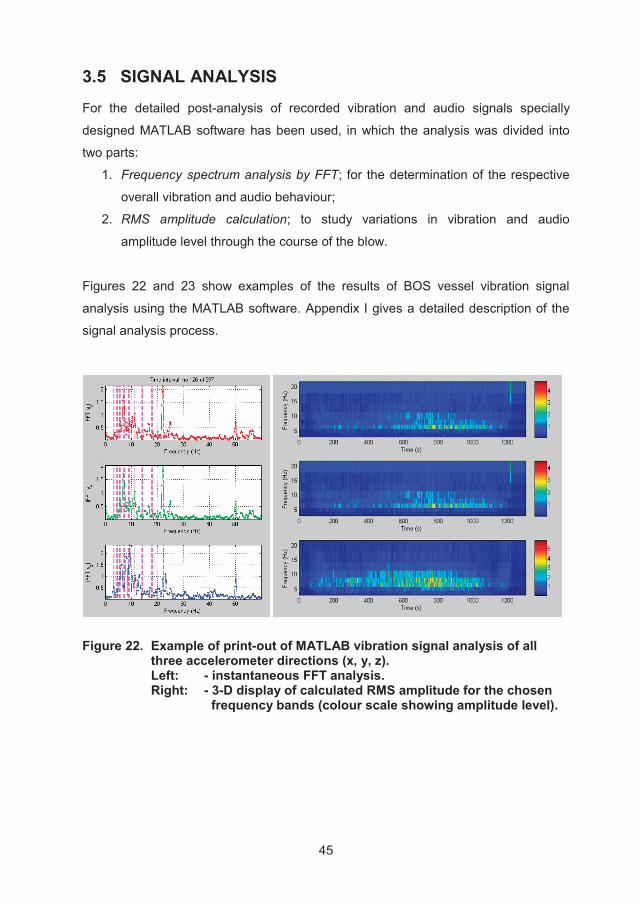
45
3.5 SIGNAL ANALYSIS
For the detailed post-analysis of recorded vibration and audio signals specially
designed MATLAB software has been used, in which the analysis was divided into
two parts:
1. Frequency spectrum analysis by FFT; for the determination of the respective
overall vibration and audio behaviour;
2. RMS amplitude calculation; to study variations in vibration and audio
amplitude level through the course of the blow.
Figures 22 and 23 show examples of the results of BOS vessel vibration signal
analysis using the MATLAB software. Appendix I gives a detailed description of the
signal analysis process.
Figure 22. Example of print-out of MATLAB vibration signal analysis of all three accelerometer directions (x, y, z). Left: - instantaneous FFT analysis. Right: - 3-D display of calculated RMS amplitude for the chosen frequency bands (colour scale showing amplitude level).
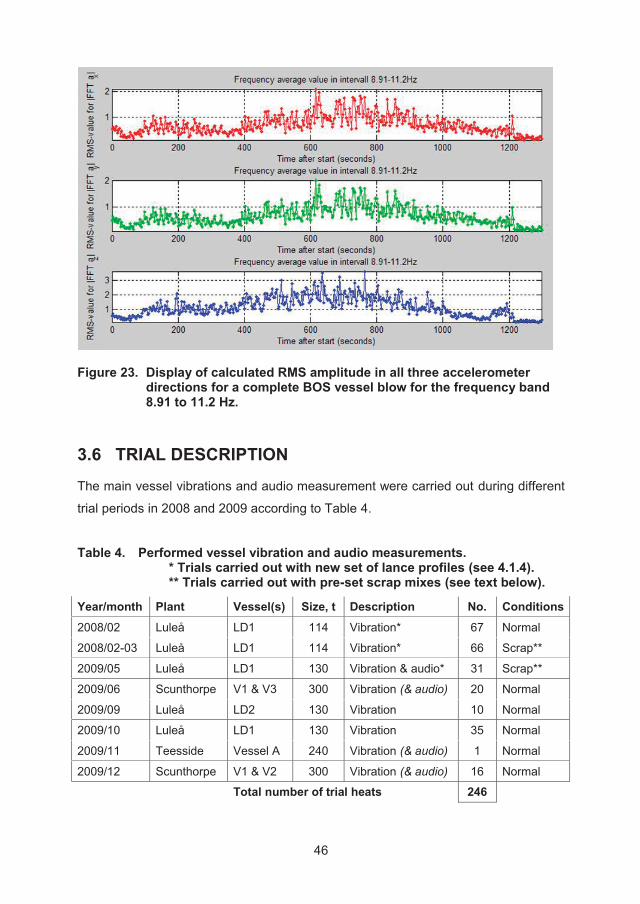
46
Figure 23. Display of calculated RMS amplitude in all three accelerometer directions for a complete BOS vessel blow for the frequency band 8.91 to 11.2 Hz.
3.6 TRIAL DESCRIPTION
The main vessel vibrations and audio measurement were carried out during different
trial periods in 2008 and 2009 according to Table 4.
Table 4. Performed vessel vibration and audio measurements. * Trials carried out with new set of lance profiles (see 4.1.4). ** Trials carried out with pre-set scrap mixes (see text below).
Year/month Plant Vessel(s) Size, t Description No. Conditions
2008/02 Luleå LD1 114 Vibration* 67 Normal
2008/02-03 Luleå LD1 114 Vibration* 66 Scrap**
2009/05 Luleå LD1 130 Vibration & audio* 31 Scrap**
2009/06 Scunthorpe V1 & V3 300 Vibration (& audio) 20 Normal
2009/09 Luleå LD2 130 Vibration 10 Normal
2009/10 Luleå LD1 130 Vibration 35 Normal
2009/11 Teesside Vessel A 240 Vibration (& audio) 1 Normal
2009/12 Scunthorpe V1 & V2 300 Vibration (& audio) 16 Normal
Total number of trial heats 246
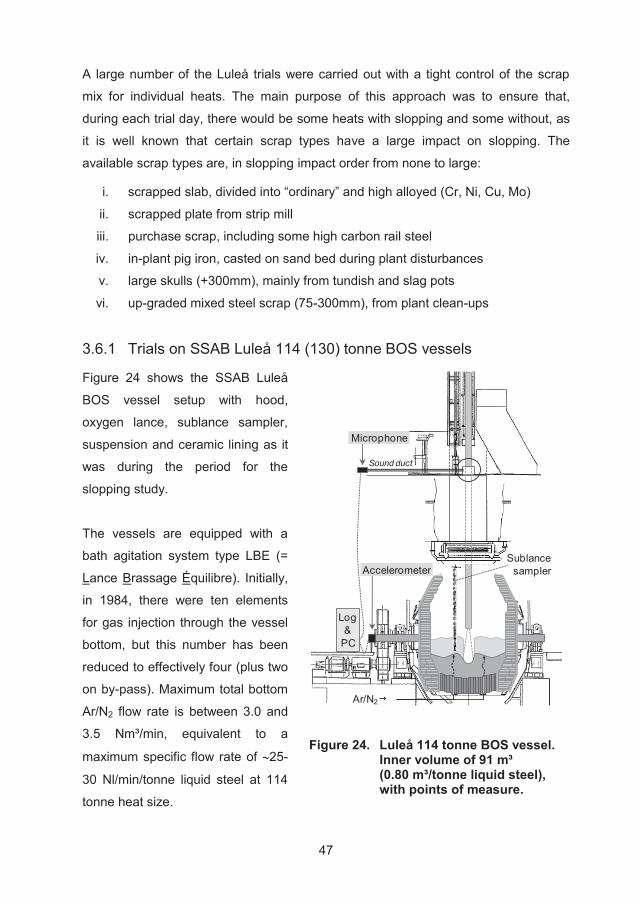
47
A large number of the Luleå trials were carried out with a tight control of the scrap
mix for individual heats. The main purpose of this approach was to ensure that,
during each trial day, there would be some heats with slopping and some without, as
it is well known that certain scrap types have a large impact on slopping. The
available scrap types are, in slopping impact order from none to large:
i. scrapped slab, divided into “ordinary” and high alloyed (Cr, Ni, Cu, Mo)
ii. scrapped plate from strip mill
iii. purchase scrap, including some high carbon rail steel
iv. in-plant pig iron, casted on sand bed during plant disturbances
v. large skulls (+300mm), mainly from tundish and slag pots
vi. up-graded mixed steel scrap (75-300mm), from plant clean-ups
3.6.1 Trials on SSAB Luleå 114 (130) tonne BOS vessels
Figure 24 shows the SSAB Luleå
BOS vessel setup with hood,
oxygen lance, sublance sampler,
suspension and ceramic lining as it
was during the period for the
slopping study.
The vessels are equipped with a
bath agitation system type LBE (=
Lance Brassage Équilibre). Initially,
in 1984, there were ten elements
for gas injection through the vessel
bottom, but this number has been
reduced to effectively four (plus two
on by-pass). Maximum total bottom
Ar/N2 flow rate is between 3.0 and
3.5 Nm³/min, equivalent to a
maximum specific flow rate of 25-
30 Nl/min/tonne liquid steel at 114
tonne heat size.
Ar/N2
Sublancesampler
Microphone
Accelerometer
Sound duct
Log&
PC
Figure 24. Luleå 114 tonne BOS vessel. Inner volume of 91 m³ (0.80 m³/tonne liquid steel), with points of measure.
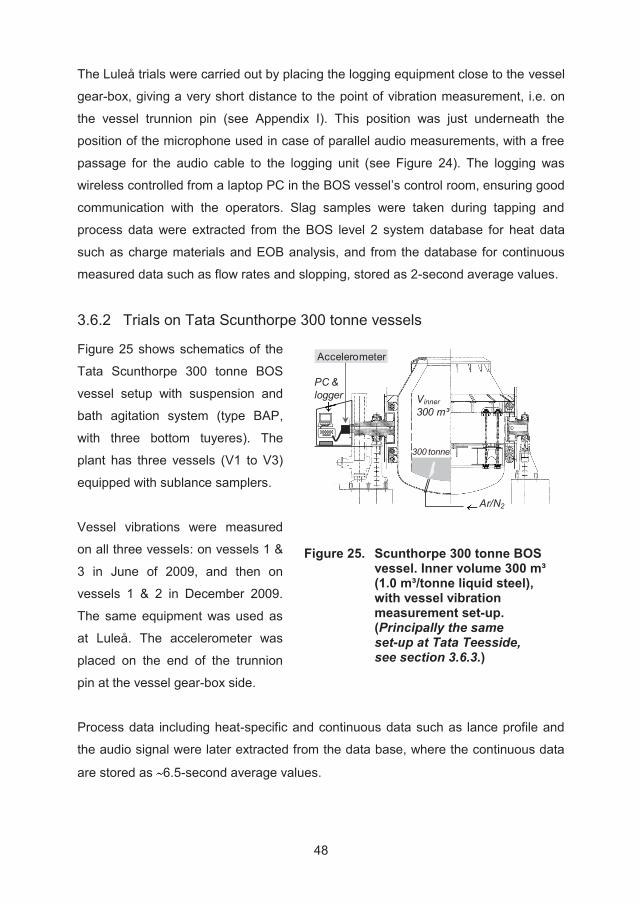
48
The Luleå trials were carried out by placing the logging equipment close to the vessel
gear-box, giving a very short distance to the point of vibration measurement, i.e. on
the vessel trunnion pin (see Appendix I). This position was just underneath the
position of the microphone used in case of parallel audio measurements, with a free
passage for the audio cable to the logging unit (see Figure 24). The logging was
wireless controlled from a laptop PC in the BOS vessel’s control room, ensuring good
communication with the operators. Slag samples were taken during tapping and
process data were extracted from the BOS level 2 system database for heat data
such as charge materials and EOB analysis, and from the database for continuous
measured data such as flow rates and slopping, stored as 2-second average values.
3.6.2 Trials on Tata Scunthorpe 300 tonne vessels
Figure 25 shows schematics of the
Tata Scunthorpe 300 tonne BOS
vessel setup with suspension and
bath agitation system (type BAP,
with three bottom tuyeres). The
plant has three vessels (V1 to V3)
equipped with sublance samplers.
Vessel vibrations were measured
on all three vessels: on vessels 1 &
3 in June of 2009, and then on
vessels 1 & 2 in December 2009.
The same equipment was used as
at Luleå. The accelerometer was
placed on the end of the trunnion
pin at the vessel gear-box side.
Vinner300 m³
PC &logger
Accelerometer
300 tonne
Ar/N2
Figure 25. Scunthorpe 300 tonne BOS vessel. Inner volume 300 m³ (1.0 m³/tonne liquid steel), with vessel vibration measurement set-up. (Principally the same set-up at Tata Teesside, see section 3.6.3.)
Process data including heat-specific and continuous data such as lance profile and
the audio signal were later extracted from the data base, where the continuous data
are stored as 6.5-second average values.
49
In the Scunthorpe trials slopping events had to be manually noted. During the first
trial series in June 2009, the heats were recorded on film for later analysis in regard
to the time and severity of slopping. The overall result was not satisfactory, as it was
in several cases impossible to distinguish between flaring and slopping.
3.6.3 Single trial on Tata Teesside (Lackenby) 240 tonne vessel
In connection with the second trial series at Scunthorpe in December 2009, a shorter
series of vibration measurements was also planned for the Tata Teesside (Lackenby)
240(250) tonne BOS vessels. However, it was only possible to carry out a single
measurement, this due to production disturbances in connection with a decision to
“mothball” the plant during the coming months. The set-up for the Teesside
measurement was identical with the one at Scunthorpe.
The Teesside vessels have an inner volume of 180m³ ( 0.75m³/t.liq.), but as for the
rest, the same features as those in Scunthorpe; BAP type bath agitation system (8
tuyeres), sublance samplers and “SMART Lance” audiometry system for slopping
control. The vessels lack a slopping registration system.
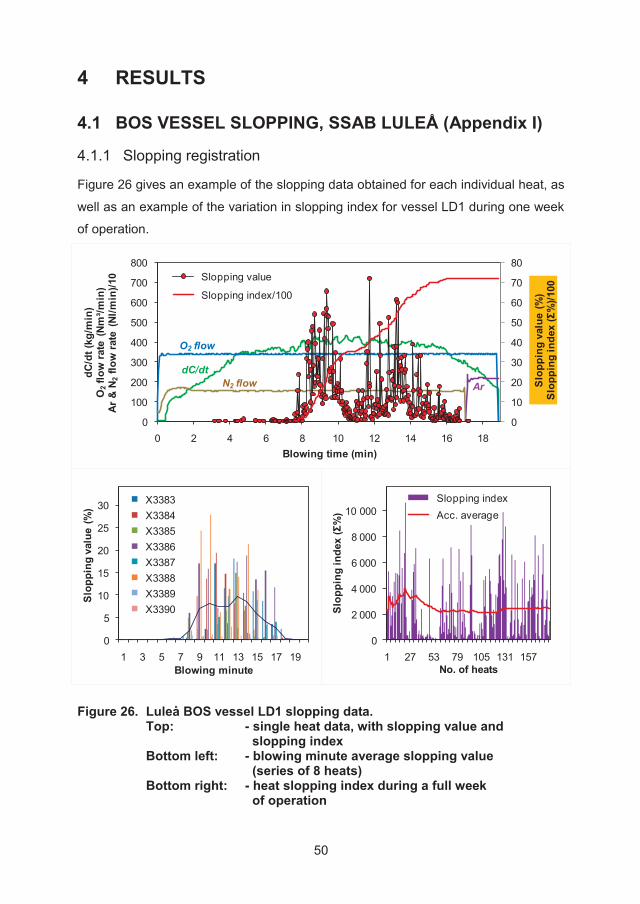
50
4 RESULTS
4.1 BOS VESSEL SLOPPING, SSAB LULEÅ (Appendix I)
4.1.1 Slopping registration
Figure 26 gives an example of the slopping data obtained for each individual heat, as
well as an example of the variation in slopping index for vessel LD1 during one week
of operation.
0
10
20
30
40
50
60
70
80
0
100
200
300
400
500
600
700
800
0 2 4 6 8 10 12 14 16 18
dC/d
t (kg
/min
)O
2flo
w r
ate
(Nm
³/min
) Ar
& N
2flo
w r
ate
(Nl/m
in)/1
0
Slop
ping
val
ue (%
)Sl
oppi
ng in
dex
(Σ%
)/100
Blowing time (min)
Slopping value
Slopping index/100
N2 flow ArdC/dt
O2 flow
0
5
10
15
20
25
30
1 3 5 7 9 11 13 15 17 19
Slop
ping
val
ue (
%)
Blowing minute
X3383X3384X3385X3386X3387X3388X3389X3390
0
2 000
4 000
6 000
8 000
10 000
1 27 53 79 105 131 157
Slop
ping
inde
x (Σ
%)
No. of heats
Slopping indexAcc. average
Figure 26. Luleå BOS vessel LD1 slopping data. Top: - single heat data, with slopping value and slopping index Bottom left: - blowing minute average slopping value (series of 8 heats) Bottom right: - heat slopping index during a full week of operation
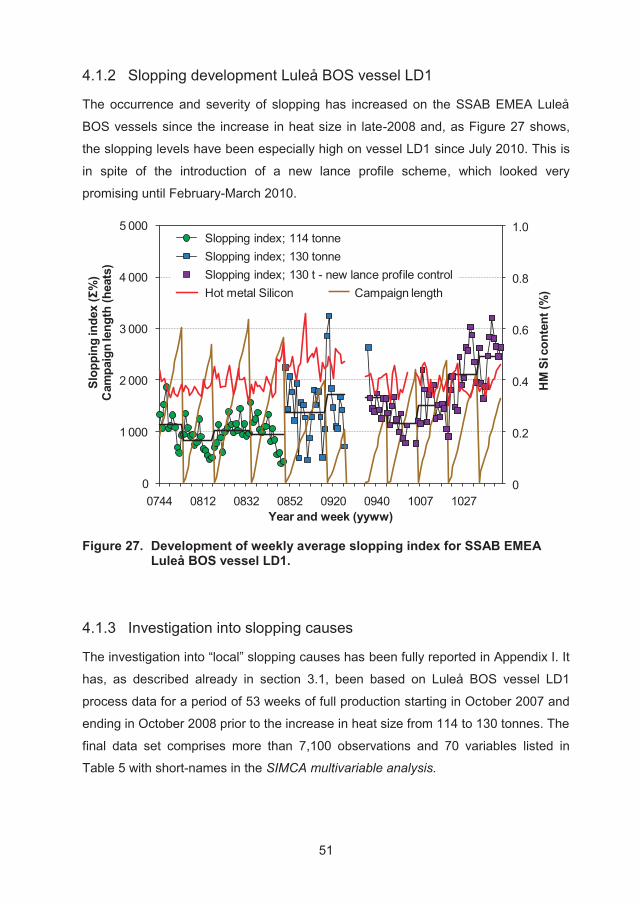
51
4.1.2 Slopping development Luleå BOS vessel LD1
The occurrence and severity of slopping has increased on the SSAB EMEA Luleå
BOS vessels since the increase in heat size in late-2008 and, as Figure 27 shows,
the slopping levels have been especially high on vessel LD1 since July 2010. This is
in spite of the introduction of a new lance profile scheme, which looked very
promising until February-March 2010.
0,0
0,2
0,4
0,6
0,8
1,0
0
1 000
2 000
3 000
4 000
5 000
0744 0812 0832 0852 0920 0940 1007 1027
HM
Si c
onte
nt (%
)
Slop
ping
inde
x (Σ
%)
Cam
paig
n le
ngth
(hea
ts)
Year and week (yyww)
Slopping index; 114 tonneSlopping index; 130 tonneSlopping index; 130 t - new lance profile controlHot metal Silicon
1.0
0.8
0.6
0.4
0.2
0
Campaign length
Figure 27. Development of weekly average slopping index for SSAB EMEA Luleå BOS vessel LD1.
4.1.3 Investigation into slopping causes
The investigation into “local” slopping causes has been fully reported in Appendix I. It
has, as described already in section 3.1, been based on Luleå BOS vessel LD1
process data for a period of 53 weeks of full production starting in October 2007 and
ending in October 2008 prior to the increase in heat size from 114 to 130 tonnes. The
final data set comprises more than 7,100 observations and 70 variables listed in
Table 5 with short-names in the SIMCA multivariable analysis.
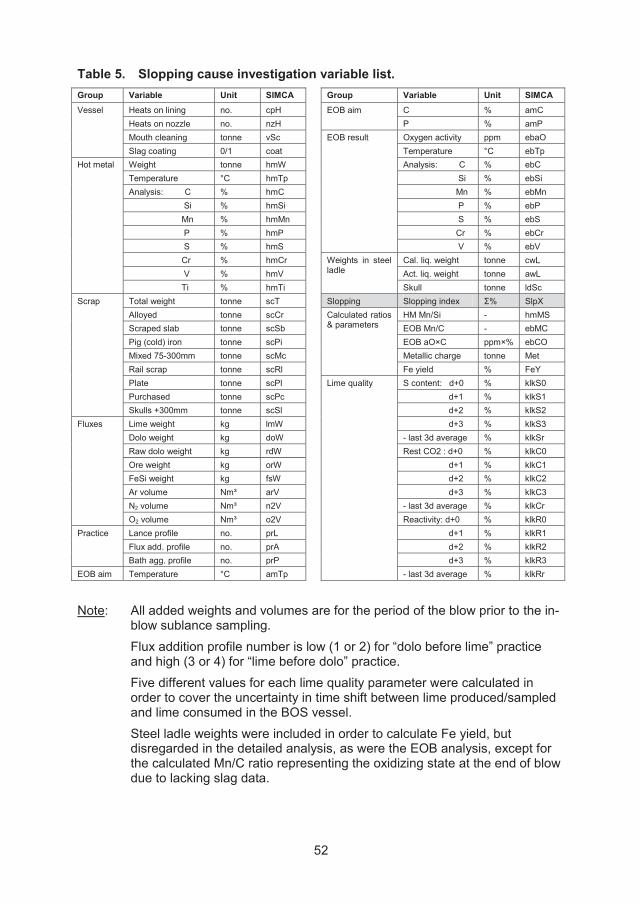
52
Table 5. Slopping cause investigation variable list. Group Variable Unit SIMCA Group Variable Unit SIMCA Vessel Heats on lining no. cpH EOB aim C % amC
Heats on nozzle no. nzH P % amP Mouth cleaning tonne vSc EOB result Oxygen activity ppm ebaO Slag coating 0/1 coat Temperature °C ebTp
Hot metal Weight tonne hmW Analysis: C % ebC Temperature °C hmTp Si % ebSi Analysis: C % hmC Mn % ebMn Si % hmSi P % ebP Mn % hmMn S % ebS P % hmP Cr % ebCr S % hmS V % ebV Cr % hmCr Weights in steel
ladle Cal. liq. weight tonne cwL
V % hmV Act. liq. weight tonne awL Ti % hmTi Skull tonne ldSc
Scrap Total weight tonne scT Slopping Slopping index Σ% SlpX Alloyed tonne scCr Calculated ratios
& parameters HM Mn/Si - hmMS
Scraped slab tonne scSb EOB Mn/C - ebMC Pig (cold) iron tonne scPi EOB aO×C ppm×% ebCO Mixed 75-300mm tonne scMc Metallic charge tonne Met Rail scrap tonne scRl Fe yield % FeY Plate tonne scPl Lime quality S content: d+0 % klkS0 Purchased tonne scPc d+1 % klkS1 Skulls +300mm tonne scSl d+2 % klkS2
Fluxes Lime weight kg lmW d+3 % klkS3 Dolo weight kg doW - last 3d average % klkSr Raw dolo weight kg rdW Rest CO2 : d+0 % klkC0 Ore weight kg orW d+1 % klkC1 FeSi weight kg fsW d+2 % klkC2 Ar volume Nm³ arV d+3 % klkC3 N2 volume Nm³ n2V - last 3d average % klkCr O2 volume Nm³ o2V Reactivity: d+0 % klkR0
Practice Lance profile no. prL d+1 % klkR1 Flux add. profile no. prA d+2 % klkR2 Bath agg. profile no. prP d+3 % klkR3
EOB aim Temperature °C amTp - last 3d average % klkRr
Note: All added weights and volumes are for the period of the blow prior to the in-blow sublance sampling.
Flux addition profile number is low (1 or 2) for “dolo before lime” practice and high (3 or 4) for “lime before dolo” practice.
Five different values for each lime quality parameter were calculated in order to cover the uncertainty in time shift between lime produced/sampled and lime consumed in the BOS vessel.
Steel ladle weights were included in order to calculate Fe yield, but disregarded in the detailed analysis, as were the EOB analysis, except for the calculated Mn/C ratio representing the oxidizing state at the end of blow due to lacking slag data.
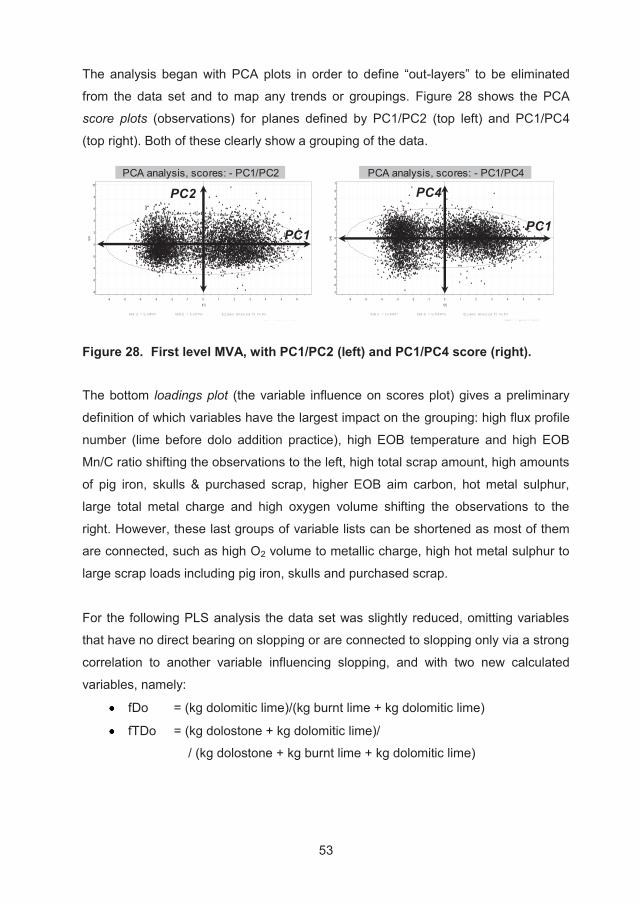
53
The analysis began with PCA plots in order to define “out-layers” to be eliminated
from the data set and to map any trends or groupings. Figure 28 shows the PCA
score plots (observations) for planes defined by PC1/PC2 (top left) and PC1/PC4
(top right). Both of these clearly show a grouping of the data.
-8
-6
-4
-2
0
2
4
6
8
10
-6 -5 -4 -3 -2 -1 0 1 2 3 4 5 6
t[2]
t[1]
SIMCA3-N9.M2 (PCA-X), M2: without e.o.b. analysis & weight in ladlet[Comp. 1]/t[Comp. 2]
R2X[1] = 0,148507 R2X[2] = 0,102763 Ellipse: Hotelling T2 (0,95)
SIMCA-P+ 11 - 2010-01-14 14:06:33
PCA analysis, scores: - PC1/PC2
PC1
PC2
-7
-6
-5
-4
-3
-2
-1
0
1
2
3
4
5
6
7
-6 -5 -4 -3 -2 -1 0 1 2 3 4 5 6
t[4]
t[1]
SIMCA3-N9.M2 (PCA-X), M2: without e.o.b. analysis & weight in ladlet[Comp. 1]/t[Comp. 4]
R2X[1] = 0,148507 R2X[4] = 0,0549074 Ellipse: Hotelling T2 (0,95)
SIMCA-P+ 11 - 2010-01-14 14:07:44
PC4
PC1
PCA analysis, scores: - PC1/PC4
Figure 28. First level MVA, with PC1/PC2 (left) and PC1/PC4 score (right).
The bottom loadings plot (the variable influence on scores plot) gives a preliminary
definition of which variables have the largest impact on the grouping: high flux profile
number (lime before dolo addition practice), high EOB temperature and high EOB
Mn/C ratio shifting the observations to the left, high total scrap amount, high amounts
of pig iron, skulls & purchased scrap, higher EOB aim carbon, hot metal sulphur,
large total metal charge and high oxygen volume shifting the observations to the
right. However, these last groups of variable lists can be shortened as most of them
are connected, such as high O2 volume to metallic charge, high hot metal sulphur to
large scrap loads including pig iron, skulls and purchased scrap.
For the following PLS analysis the data set was slightly reduced, omitting variables
that have no direct bearing on slopping or are connected to slopping only via a strong
correlation to another variable influencing slopping, and with two new calculated
variables, namely:
fDo = (kg dolomitic lime)/(kg burnt lime + kg dolomitic lime)
fTDo = (kg dolostone + kg dolomitic lime)/
/ (kg dolostone + kg burnt lime + kg dolomitic lime)
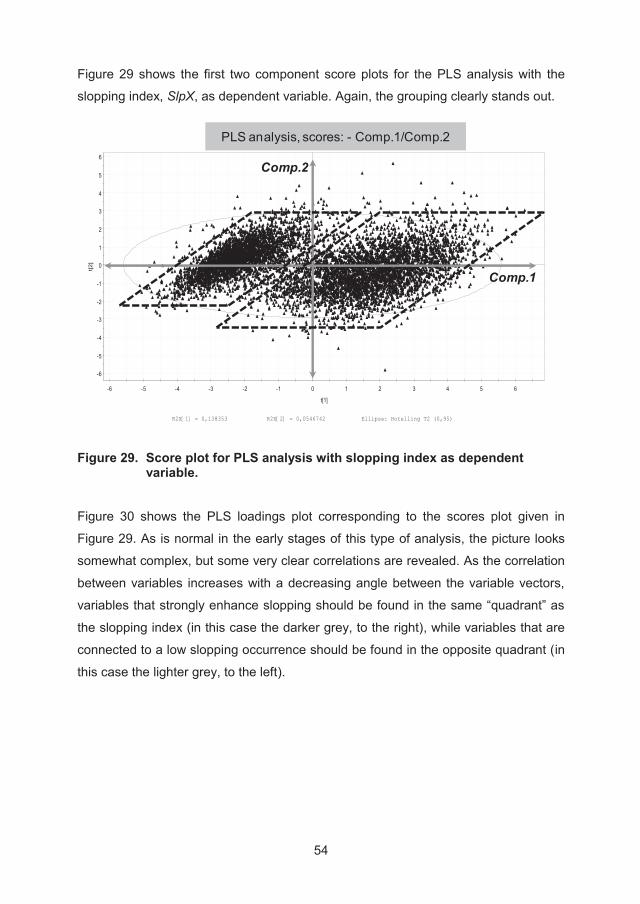
54
Figure 29 shows the first two component score plots for the PLS analysis with the
slopping index, SlpX, as dependent variable. Again, the grouping clearly stands out.
-6
-5
-4
-3
-2
-1
0
1
2
3
4
5
6
-6 -5 -4 -3 -2 -1 0 1 2 3 4 5 6
t[2]
t[1]
SIMCA3-N9.M3 (PLS), M3: as M2 with Y = Slopping indext[Comp. 1]/t[Comp. 2]
R2X[1] = 0,138353 R2X[2] = 0,0546742 Ellipse: Hotelling T2 (0,95)
SIMCA-P+ 11 - 2010-01-14 16:01:12
PLS analysis, scores: - Comp.1/Comp.2
Comp.1
Comp.2
Figure 29. Score plot for PLS analysis with slopping index as dependent variable.
Figure 30 shows the PLS loadings plot corresponding to the scores plot given in
Figure 29. As is normal in the early stages of this type of analysis, the picture looks
somewhat complex, but some very clear correlations are revealed. As the correlation
between variables increases with a decreasing angle between the variable vectors,
variables that strongly enhance slopping should be found in the same “quadrant” as
the slopping index (in this case the darker grey, to the right), while variables that are
connected to a low slopping occurrence should be found in the opposite quadrant (in
this case the lighter grey, to the left).
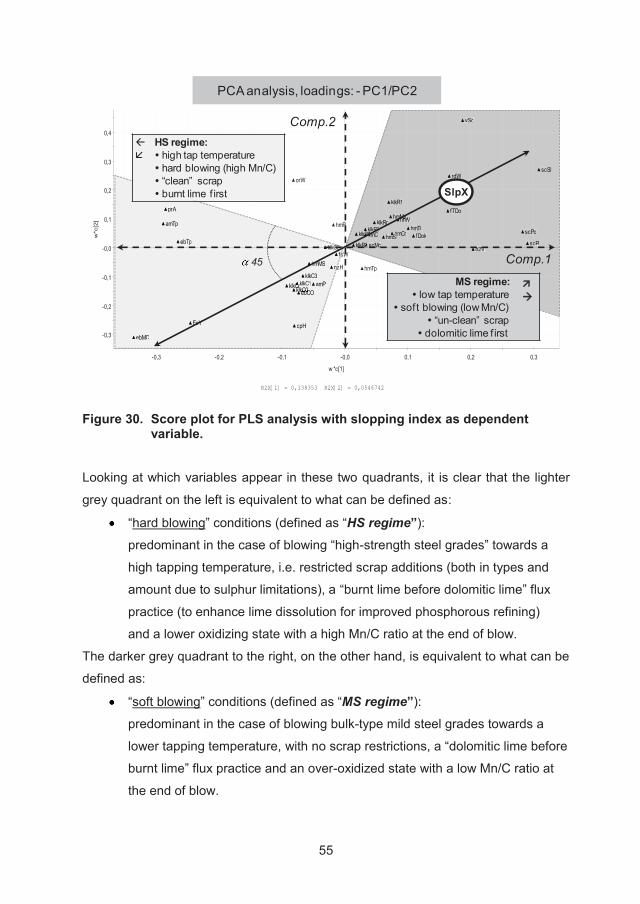
55
-0,3
-0,2
-0,1
-0,0
0,1
0,2
0,3
0,4
-0,3 -0,2 -0,1 -0,0 0,1 0,2 0,3
w*c
[2]
w *c[1]
SIMCA3-N9.M3 (PLS), M3: as M2 with Y = Slopping indexw*c[Comp. 1]/w*c[Comp. 2]
R2X[1] = 0,138353 R2X[2] = 0,0546742
XY
cpH
nzH hmTp
hmC hmSi
hmMnhmP
hmS
hmCr
hmVhmTi
scT
scPiscMc
scPc
scSl
vSc
rdWorW
fsWo2V
prA
amTp
amC
amP
ebTp
hmMS
ebMC
ebCO
FeY
fDok
fTDo
klkC0
klkR0
klkC1
klkC2
klkC3
klkR1
klkR2
klkR3
klkCr
klkRr
SlpX
SIMCA-P+ 11 - 2010-01-14 16:02:05
cpH
nz
fs
prA
amTp
amP
ebTpT
hmMSh
ebMC
ebCOO
FeY
klkC0kl ebCebCklkC1
klkC2klkC2
klkC3klkC3CklkCrkCrklkkl
kk
hmCC hmSiS
hmMnhmMm
hmCrSiSi
hmVhmVVMnMnMnMn
hmTi
scPicscMcM
scPcP
scSl
vScS
rdW
o2V2V
fDok
fTDo
klkR0kRhh
klkR1
klkR2R2
klkR3RR0
klkRr
SlpXSSlpX
PCA analysis, loadings: - PC1/PC2
Comp.1
Comp.2
45
HS regime:high tap temperaturehard blowing (high Mn/C)“clean” scrapburnt lime f irst
MS regime:low tap temperature
soft blowing (low Mn/C)“un-clean” scrap
dolomitic lime f irst
Figure 30. Score plot for PLS analysis with slopping index as dependent variable.
Looking at which variables appear in these two quadrants, it is clear that the lighter
grey quadrant on the left is equivalent to what can be defined as:
“hard blowing” conditions (defined as “HS regime”):
predominant in the case of blowing “high-strength steel grades” towards a
high tapping temperature, i.e. restricted scrap additions (both in types and
amount due to sulphur limitations), a “burnt lime before dolomitic lime” flux
practice (to enhance lime dissolution for improved phosphorous refining)
and a lower oxidizing state with a high Mn/C ratio at the end of blow.
The darker grey quadrant to the right, on the other hand, is equivalent to what can be
defined as:
“soft blowing” conditions (defined as “MS regime”):
predominant in the case of blowing bulk-type mild steel grades towards a
lower tapping temperature, with no scrap restrictions, a “dolomitic lime before
burnt lime” flux practice and an over-oxidized state with a low Mn/C ratio at
the end of blow.
56
As can be seen in Figure 30 and as described in Appendix I, the soft blowing MS
regime is connected with a high degree of slopping, resulting in an extra 1% loss in
valuable metal. A hard blowing HS regime, on the other hand, exhibits basically very
low slopping levels with a negligible extra loss of metal.
The final analysis has resulted in the following list with the most common “local”
SSAB Luleå causes of slopping, in prioritized order:
MS regime:
i. overall soft blowing conditions
ii. large additions of un-clean scrap
such as pig iron and large skulls
iii. high ratio of dolomitic fluxes
iv. a low melt temperature profile
v. lime quality (hard burnt)
vi. large (initial) ore additions
vii. low vessel volume
viii. high hot metal Si content
HS regime:
i. large additions of skulls (allowed)
ii. soft blowing conditions
iii. high hot metal Si content
iv. high ratio of dolomitic fluxes
v. large (initial) ore additions
vi. lime quality
vii. a low melt temperature profile
viii. low vessel volume
4.1.4 Development of new lance profiles
The work to develop new lance profiles was initiated before the start of this thesis
work. Early in the work it was realized that scrap quality has a large impact on the
blowing conditions and slopping behaviour, and that this somehow had to be
included in the new lance profiles. However, it was not until a quantitative measure of
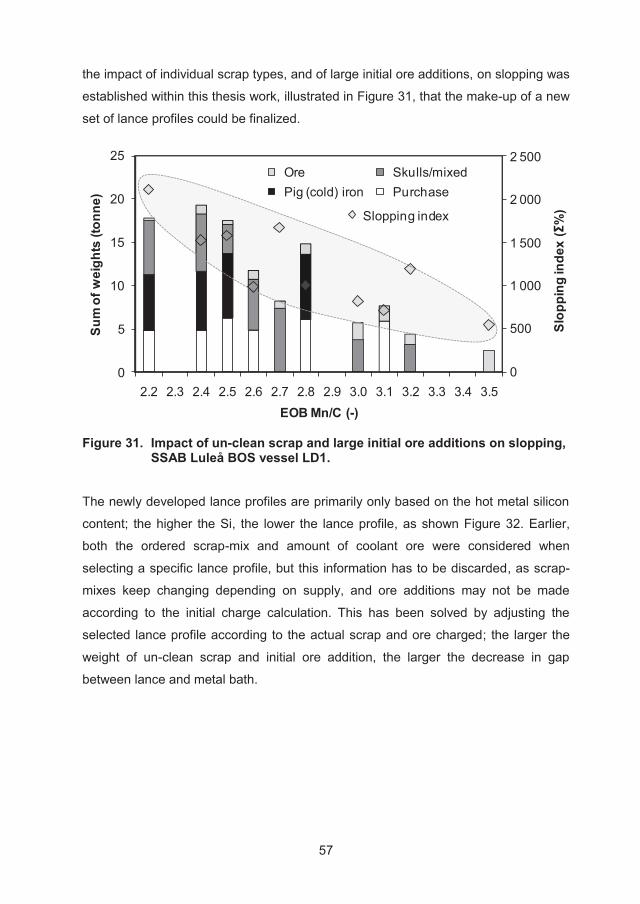
57
the impact of individual scrap types, and of large initial ore additions, on slopping was
established within this thesis work, illustrated in Figure 31, that the make-up of a new
set of lance profiles could be finalized.
0
5
10
15
20
25
2.2 2.3 2.4 2.5 2.6 2.7 2.8 2.9 3.0 3.1 3.2 3.3 3.4 3.5
Sum
of w
eigh
ts (t
onne
)
EOB Mn/C (-)
Ore Skulls/mixedPig (cold) iron Purchase
0
500
1 000
1 500
2 000
2 500
Slop
ping
inde
x (
Sli
id
(ΣΣ%
)%
)
Slopping index
Slop
ping
inde
x (Σ
%)
2 500
2 000
1 500
1 000
500
0
Slopping index
Figure 31. Impact of un-clean scrap and large initial ore additions on slopping, SSAB Luleå BOS vessel LD1.
The newly developed lance profiles are primarily only based on the hot metal silicon
content; the higher the Si, the lower the lance profile, as shown Figure 32. Earlier,
both the ordered scrap-mix and amount of coolant ore were considered when
selecting a specific lance profile, but this information has to be discarded, as scrap-
mixes keep changing depending on supply, and ore additions may not be made
according to the initial charge calculation. This has been solved by adjusting the
selected lance profile according to the actual scrap and ore charged; the larger the
weight of un-clean scrap and initial ore addition, the larger the decrease in gap
between lance and metal bath.
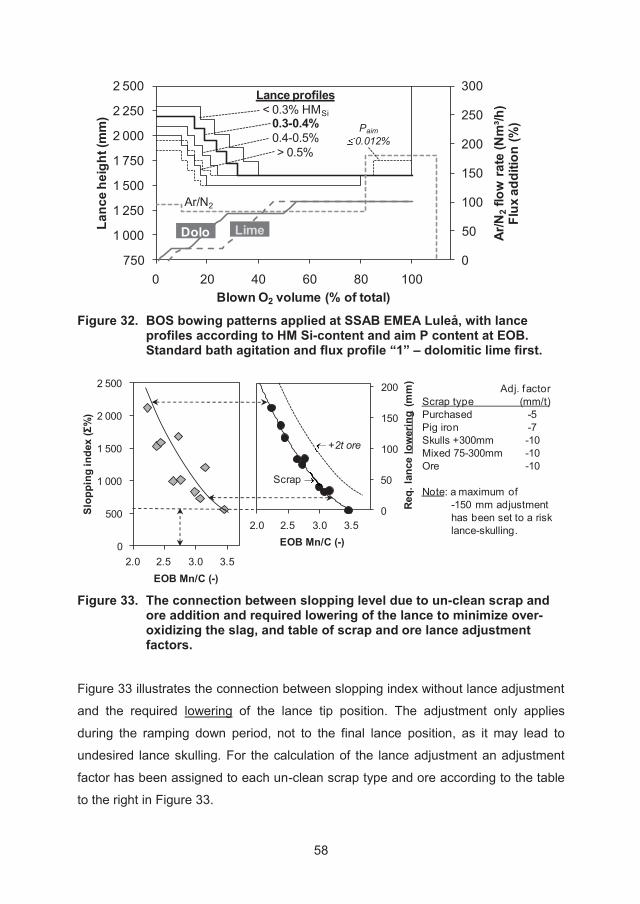
58
0
50
100
150
200
250
300
750
1 000
1 250
1 500
1 750
2 000
2 250
2 500
0 20 40 60 80 100
Ar/N
2flo
w ra
te (N
m³/h
)Fl
ux a
dditi
on (%
)
Lanc
e he
ight
(mm
)
Blown O2 volume (% of total)
LimeDolo
Paim0.012%
Lance profiles< 0.3% HMSi
0.3-0.4%0.4-0.5%> 0.5%
Ar/N2
Figure 32. BOS bowing patterns applied at SSAB EMEA Luleå, with lance
profiles according to HM Si-content and aim P content at EOB. Standard bath agitation and flux profile “1” – dolomitic lime first.
0
500
1 000
1 500
2 000
2 500
2,0 2,5 3,0 3,5
Slop
ping
inde
x (Σ
%)
EOB Mn/C (-)
0
50
100
150
200
2,0 2,5 3,0 3,5
Req.
lanc
e lo
wer
ing
(mm
)
EOB Mn/C (-)
Scrap
+2t ore
Adj. factorScrap type (mm/t)Purchased -5Pig iron -7Skulls +300mm -10Mixed 75-300mm -10Ore -10
Note: a maximum of -150 mm adjustmenthas been set to a risklance-skulling.
2.0 2.5 3.0 3.5
2.0 2.5 3.0 3.5
Figure 33. The connection between slopping level due to un-clean scrap and
ore addition and required lowering of the lance to minimize over-oxidizing the slag, and table of scrap and ore lance adjustment factors.
Figure 33 illustrates the connection between slopping index without lance adjustment
and the required lowering of the lance tip position. The adjustment only applies
during the ramping down period, not to the final lance position, as it may lead to
undesired lance skulling. For the calculation of the lance adjustment an adjustment
factor has been assigned to each un-clean scrap type and ore according to the table
to the right in Figure 33.
59
4.2 VESSEL VIBRATION MEASUREMENTS (Appendix II-III)
The results from the vessel vibration trials have been reported in:
Appendix II: where the theory on BOS vessel vibration and foam height estimation
and a thorough account of the vessel vibration measurement trials
and signal analysis performed at Luleå is presented, and in
Appendix III: where the account of the vibration trials on larger BOS vessels made
at Tata Scunthorpe Works is given.
Below follows a summary of the Luleå and the Scunthorpe vessel vibration results,
as well as a short account of the single vessel vibration measurement carried out at
Tata Teesside Works.
4.2.1 SSAB EMEA Luleå 114/130 tonne vessel
The vessel vibration trials at Luleå confirm a strong correlation between vessel
vibration and BOS process phenomena such as slag foaming, and that:
i. the most favourable and practical vessel vibration sensor placement for foam
height estimation, is on the trunnion pin on the vessel tilting drive-side;
ii. the best correlation with an estimated foam height is with low frequency
vibrations in the vessel horizontal direction, 90° to the trunnion axis;
iii. the optimum vibration mid-frequency for foam height estimation for the Luleå
114/130 tonne vessels is 10-11 Hz (as was found in the 1980’s tests);
iv. as the filtering properties of the mechanical structure will vary from vessel to
vessel, so will the optimum mid-frequency, but it will remain constant for an
individual vessel as long as no major change is made to its design;
v. the vessel vibration signal in the frequency area interesting in foam height
estimation is not influenced by any moving heavy auxiliary equipment such
as charging cranes or debricking machines, as the vessel and its foundation
are structurally separated from the surrounding building structure;
vi. the confirmed correlation between vessel vibration and foam height can be
used for dynamic foam height and slopping control.
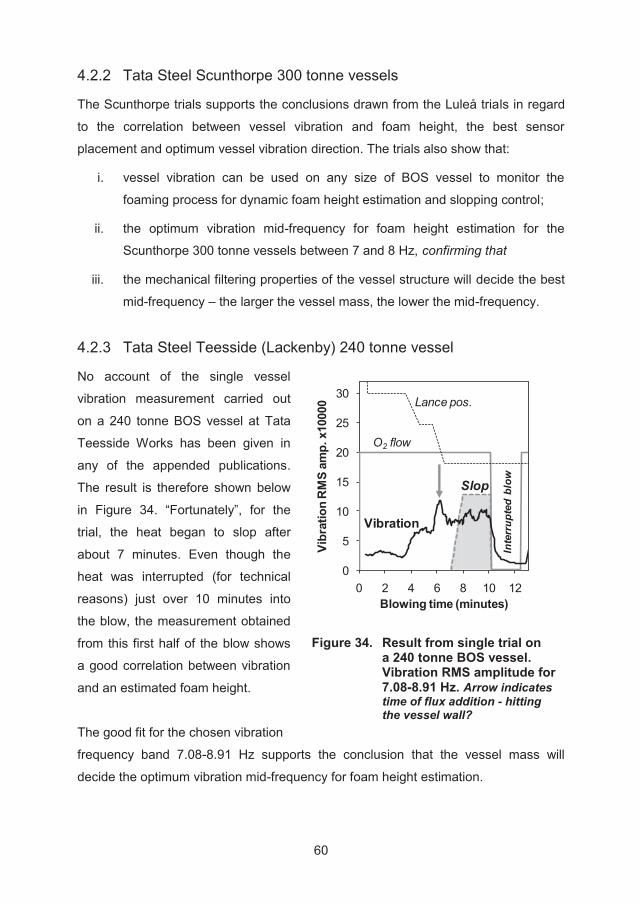
60
4.2.2 Tata Steel Scunthorpe 300 tonne vessels
The Scunthorpe trials supports the conclusions drawn from the Luleå trials in regard
to the correlation between vessel vibration and foam height, the best sensor
placement and optimum vessel vibration direction. The trials also show that:
i. vessel vibration can be used on any size of BOS vessel to monitor the
foaming process for dynamic foam height estimation and slopping control;
ii. the optimum vibration mid-frequency for foam height estimation for the
Scunthorpe 300 tonne vessels between 7 and 8 Hz, confirming that
iii. the mechanical filtering properties of the vessel structure will decide the best
mid-frequency – the larger the vessel mass, the lower the mid-frequency.
4.2.3 Tata Steel Teesside (Lackenby) 240 tonne vessel
No account of the single vessel
vibration measurement carried out
on a 240 tonne BOS vessel at Tata
Teesside Works has been given in
any of the appended publications.
The result is therefore shown below
in Figure 34. “Fortunately”, for the
trial, the heat began to slop after
about 7 minutes. Even though the
heat was interrupted (for technical
reasons) just over 10 minutes into
the blow, the measurement obtained
from this first half of the blow shows
a good correlation between vibration
and an estimated foam height.
The good fit for the chosen vibration
Lance pos.
O2 flow
SlopIn
terr
upte
d bl
ow
Vibration
0
5
10
15
20
25
30
0 2 4 6 8 10 12
Vibr
atio
n R
MS
amp.
x10
000
Blowing time (minutes) Figure 34. Result from single trial on
a 240 tonne BOS vessel. Vibration RMS amplitude for 7.08-8.91 Hz. Arrow indicates time of flux addition - hitting the vessel wall?
frequency band 7.08-8.91 Hz supports the conclusion that the vessel mass will
decide the optimum vibration mid-frequency for foam height estimation.
61
4.3 AUDIO MEASUREMENTS AT LULEÅ (Appendix III)
The usefulness of audiometry for BOS process slopping control is well proven.
Hence, the audio measurements at Luleå were carried out in order to compare the
vessel vibration technique with audio measurements under controlled conditions.
The results from the audio measurements at Luleå, described in greater detail in
Appendix III, showed that:
i. it may not be necessary to measure the process sound from inside the off-
gas hood. If the local conditions are suitable, a good audio signal can be
obtained by measuring the sound at the point where the oxygen lance enters
the hood;
ii. independent of the point of measure and microphone arrangement, the
microphone must be well protected from heat and dust;
iii. the audio signal obtained at the Luleå trials exhibits the same basic pattern
during the blow as by the audiometry systems at other plants;
iv. the optimum audio frequency band for foam height estimation in the Luleå
130 tonne BOS vessels is 400-450 Hz;
v. the audio signal can be used to detect high moisture content in fluxes, as the
sound from the “micro” steam explosions that will occur will clearly show up
in the raw audio signal.
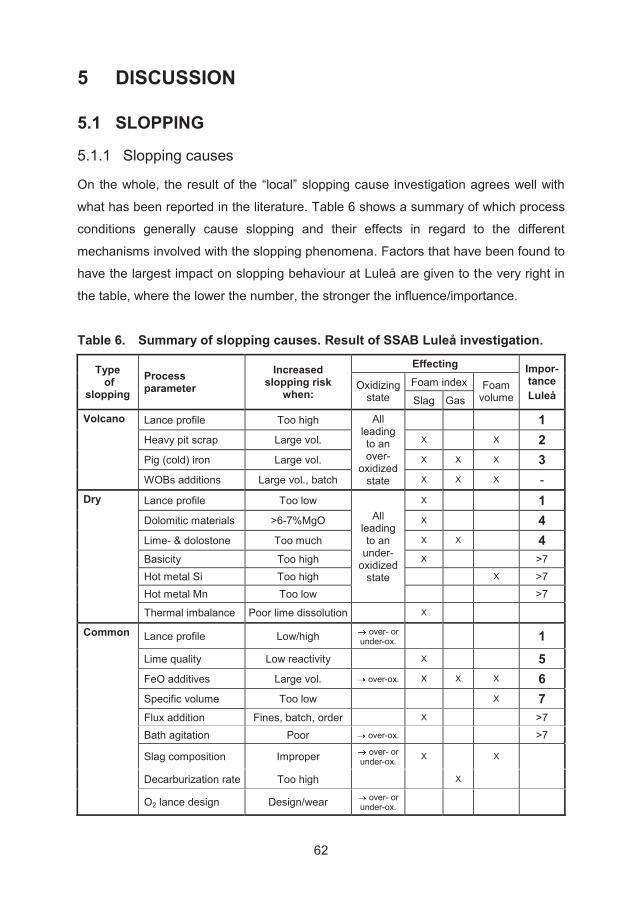
62
5 DISCUSSION
5.1 SLOPPING
5.1.1 Slopping causes
On the whole, the result of the “local” slopping cause investigation agrees well with
what has been reported in the literature. Table 6 shows a summary of which process
conditions generally cause slopping and their effects in regard to the different
mechanisms involved with the slopping phenomena. Factors that have been found to
have the largest impact on slopping behaviour at Luleå are given to the very right in
the table, where the lower the number, the stronger the influence/importance.
Table 6. Summary of slopping causes. Result of SSAB Luleå investigation.
Type of
slopping Process parameter
Increased slopping risk
when:
Effecting Impor-tance Luleå
Oxidizing state
Foam index Foam volume Slag Gas
Volcano Lance profile Too high All leading to an over-
oxidized state
1 Heavy pit scrap Large vol. X X 2 Pig (cold) iron Large vol. X X X 3 WOBs additions Large vol., batch X X X -
Dry Lance profile Too low All
leading to an
under-oxidized
state
X 1 Dolomitic materials >6-7%MgO X 4 Lime- & dolostone Too much X X 4 Basicity Too high X >7 Hot metal Si Too high X >7 Hot metal Mn Too low >7
Thermal imbalance Poor lime dissolution X Common Lance profile Low/high over- or
under-ox. 1
Lime quality Low reactivity X 5 FeO additives Large vol. over-ox. X X X 6 Specific volume Too low X 7 Flux addition Fines, batch, order X >7 Bath agitation Poor over-ox. >7
Slag composition Improper over- or under-ox. X X
Decarburization rate Too high X
O2 lance design Design/wear over- or under-ox.
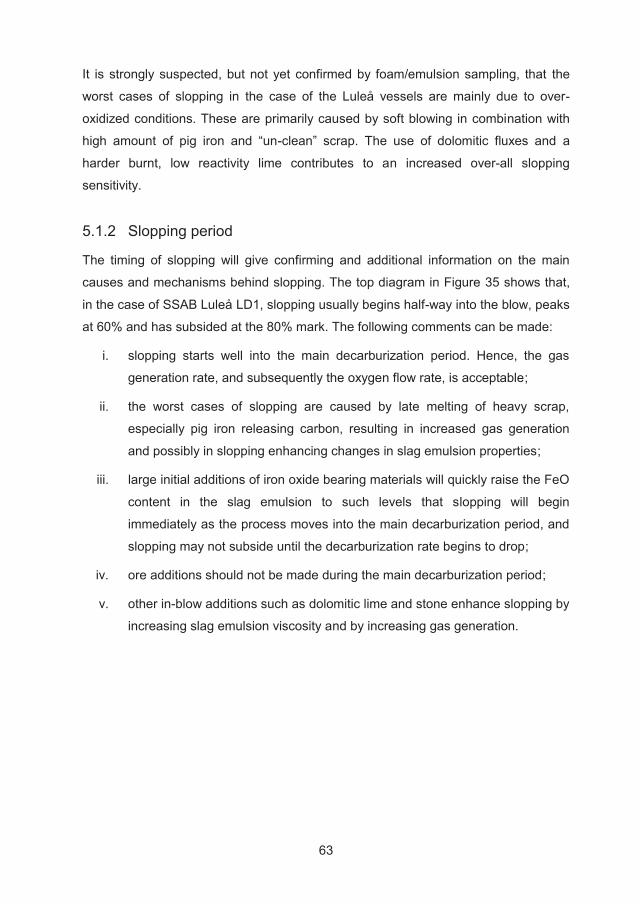
63
It is strongly suspected, but not yet confirmed by foam/emulsion sampling, that the
worst cases of slopping in the case of the Luleå vessels are mainly due to over-
oxidized conditions. These are primarily caused by soft blowing in combination with
high amount of pig iron and “un-clean” scrap. The use of dolomitic fluxes and a
harder burnt, low reactivity lime contributes to an increased over-all slopping
sensitivity.
5.1.2 Slopping period
The timing of slopping will give confirming and additional information on the main
causes and mechanisms behind slopping. The top diagram in Figure 35 shows that,
in the case of SSAB Luleå LD1, slopping usually begins half-way into the blow, peaks
at 60% and has subsided at the 80% mark. The following comments can be made:
i. slopping starts well into the main decarburization period. Hence, the gas
generation rate, and subsequently the oxygen flow rate, is acceptable;
ii. the worst cases of slopping are caused by late melting of heavy scrap,
especially pig iron releasing carbon, resulting in increased gas generation
and possibly in slopping enhancing changes in slag emulsion properties;
iii. large initial additions of iron oxide bearing materials will quickly raise the FeO
content in the slag emulsion to such levels that slopping will begin
immediately as the process moves into the main decarburization period, and
slopping may not subside until the decarburization rate begins to drop;
iv. ore additions should not be made during the main decarburization period;
v. other in-blow additions such as dolomitic lime and stone enhance slopping by
increasing slag emulsion viscosity and by increasing gas generation.
64
0100200300400500600700800900
0
2
4
6
8
10
12
14
0 2 4 6 8 10 12 14 16 18
Dec
arbu
rizat
ion
rate
dC/d
t (kg
/min
)
Aver
age
blow
ing
min
ute
slop
ping
val
ue (%
)
Blowing time (min)
Skulls, pig iron & purchased scrapPig iron & purchased scrapPig iron, purchased scrap & slabSlab & plateNo scrapdc/dt, act.
Theoretical dC/dtC+½O22 COO2 flow rate
340 Nm³/min
Figure 35. Timing of slopping, SSAB Luleå vessel LD1.
5.1.3 Slopping preventive actions
It could be that the current level of metallic loss, vessel maintenance, production
interruptions and environmental problems caused by slopping are acceptable from an
operational standpoint. If not, Table 6 gives most of the information needed in order
to prioritize the measures that need to be taken to minimize slopping.
5.1.3.1 Static slopping preventive measures
The most important static measures to be taken to minimize slopping are, in
prioritized order:
1. secure an accurate determination of bath level for a precise lance profile
control. This involves not only monitoring of the vessel inner profile, but also
determining the actual metallic content in un-clean scrap types;
2. optimize lance profiles and lance nozzle design;
3. improve scrap quality by minimizing the amount of non-metallic in large
skulls, pig-iron and mixed smaller size scrap;
4. when needed: limit the added amount of un-clean scrap based on slopping
probability, e.g., early in the vessel campaign, in the case of large bottom
build-ups, if unfavourable hot metal chemistry;
65
5. maximize lime dissolution by minimizing the use of dolomitic fluxes and by
improving lime reactivity;
6. if large ore additions are needed, add prior to start of blow and allow time for
melting (use bottom stirring and add a limited amount of flux);
7. avoid reducing vessel volume by excessive bottom build-up by slag coating;
8. discuss optimization of hot metal Si and Mn aim and control;
9. facilitate continuous feeding of fluxes and ore;
10. facilitate a higher bath agitation gas flow rate;
11. facilitate addition of slopping suppressive materials.
5.1.3.2 Slopping prediction
It is evident that all the above listed static measures may not be dealt with within a
shorter space of time; hence, the demand for the development of standardized
dynamic measures. This requires a system which can predict slopping early enough
to make any dynamic slopping prevention measure effective. Such a system should
be a combination of pre-blow calculations and in-blow techniques involving, for
instance, vessel vibration, audiometry and off-gas analysis.
5.1.3.3 Dynamic slopping preventive measures
The dynamic measures to be considered are first and foremost a combination of the
following, depending on the type of expected slopping:
1. lance gap adjustment;
2. oxygen flow rate adjustment, especially in case of large ore additions;
3. increased bath agitation;
4. additions of slopping suppressive carbonaceous non-wetting materials
such as coke and coal should be considered.
Slopping enhancing in-blow practices to be avoided are:
additions of lime- or dolostone
ore additions during the main decarburization period,
if not coupled with a reduction of oxygen flow rate
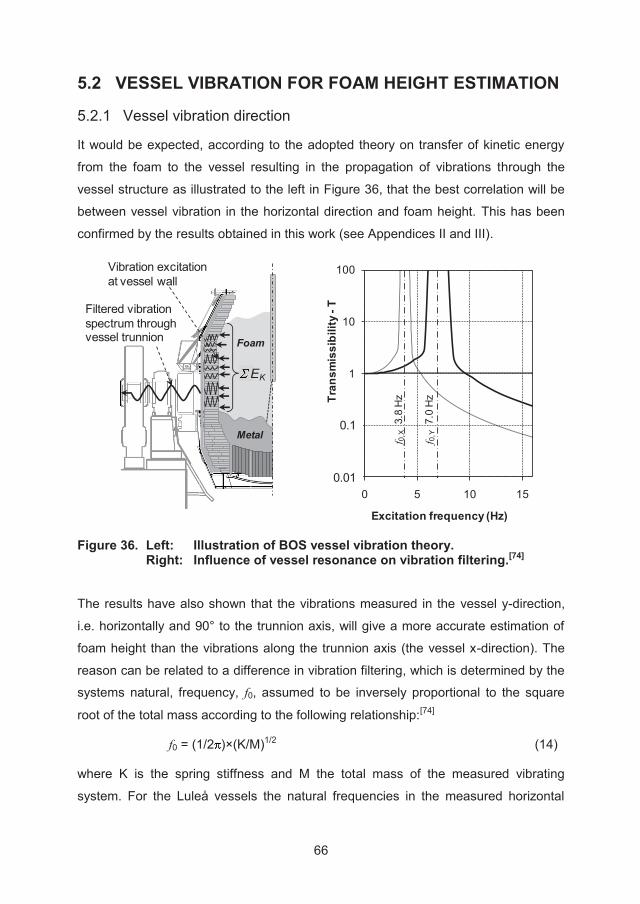
66
5.2 VESSEL VIBRATION FOR FOAM HEIGHT ESTIMATION
5.2.1 Vessel vibration direction
It would be expected, according to the adopted theory on transfer of kinetic energy
from the foam to the vessel resulting in the propagation of vibrations through the
vessel structure as illustrated to the left in Figure 36, that the best correlation will be
between vessel vibration in the horizontal direction and foam height. This has been
confirmed by the results obtained in this work (see Appendices II and III).
0,01
0,1
1
10
100
0 5 10 15
Tran
smis
sibi
lity
-T
Excitation frequency (Hz)
f 0,X
3.8
Hz
f 0,Y
7.0
Hz
Vibration excitationat vessel wall
Foam
EK
Metal
Filtered vibration spectrum through vessel trunnion
0.1
0.01
Figure 36. Left: Illustration of BOS vessel vibration theory. Right: Influence of vessel resonance on vibration filtering.[74]
The results have also shown that the vibrations measured in the vessel y-direction,
i.e. horizontally and 90° to the trunnion axis, will give a more accurate estimation of
foam height than the vibrations along the trunnion axis (the vessel x-direction). The
reason can be related to a difference in vibration filtering, which is determined by the
systems natural, frequency, f0, assumed to be inversely proportional to the square
root of the total mass according to the following relationship:[74]
f0 = (1/2 )×(K/M)1/2 (14)
where K is the spring stiffness and M the total mass of the measured vibrating
system. For the Luleå vessels the natural frequencies in the measured horizontal
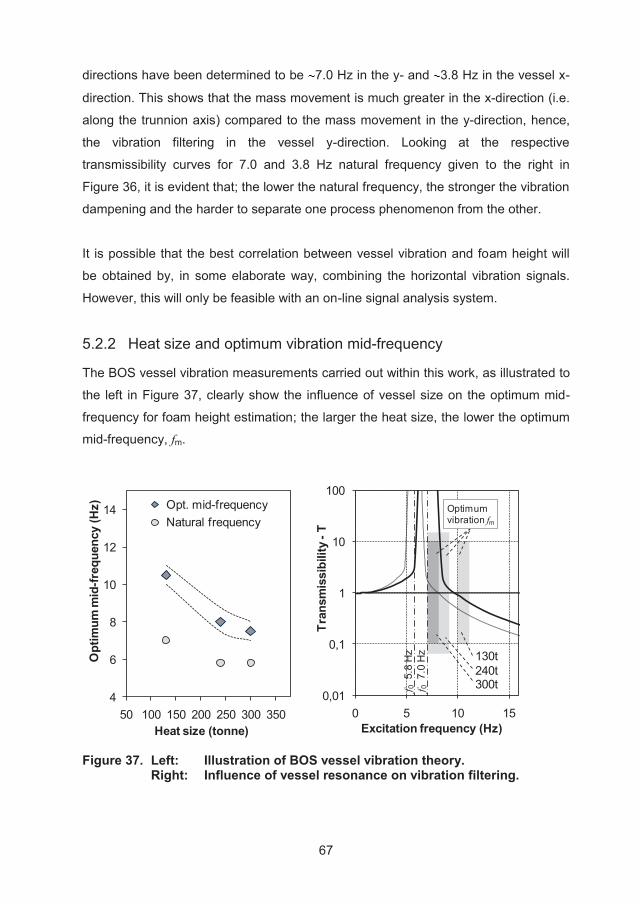
67
directions have been determined to be 7.0 Hz in the y- and 3.8 Hz in the vessel x-
direction. This shows that the mass movement is much greater in the x-direction (i.e.
along the trunnion axis) compared to the mass movement in the y-direction, hence,
the vibration filtering in the vessel y-direction. Looking at the respective
transmissibility curves for 7.0 and 3.8 Hz natural frequency given to the right in
Figure 36, it is evident that; the lower the natural frequency, the stronger the vibration
dampening and the harder to separate one process phenomenon from the other.
It is possible that the best correlation between vessel vibration and foam height will
be obtained by, in some elaborate way, combining the horizontal vibration signals.
However, this will only be feasible with an on-line signal analysis system.
5.2.2 Heat size and optimum vibration mid-frequency
The BOS vessel vibration measurements carried out within this work, as illustrated to
the left in Figure 37, clearly show the influence of vessel size on the optimum mid-
frequency for foam height estimation; the larger the heat size, the lower the optimum
mid-frequency, fm.
4
6
8
10
12
14
50 100 150 200 250 300 350
Opt
imum
mid
-freq
uenc
y (H
z)
Heat size (tonne)
Opt. mid-frequencyNatural frequency
130t240t300tf 0
5.8
Hz
f 07.
0 H
z
0,01
0,1
1
10
100
0 5 10 15
Tran
smis
sibi
lity
-T
Excitation frequency (Hz)
Optimumvibration fm
Figure 37. Left: Illustration of BOS vessel vibration theory. Right: Influence of vessel resonance on vibration filtering.
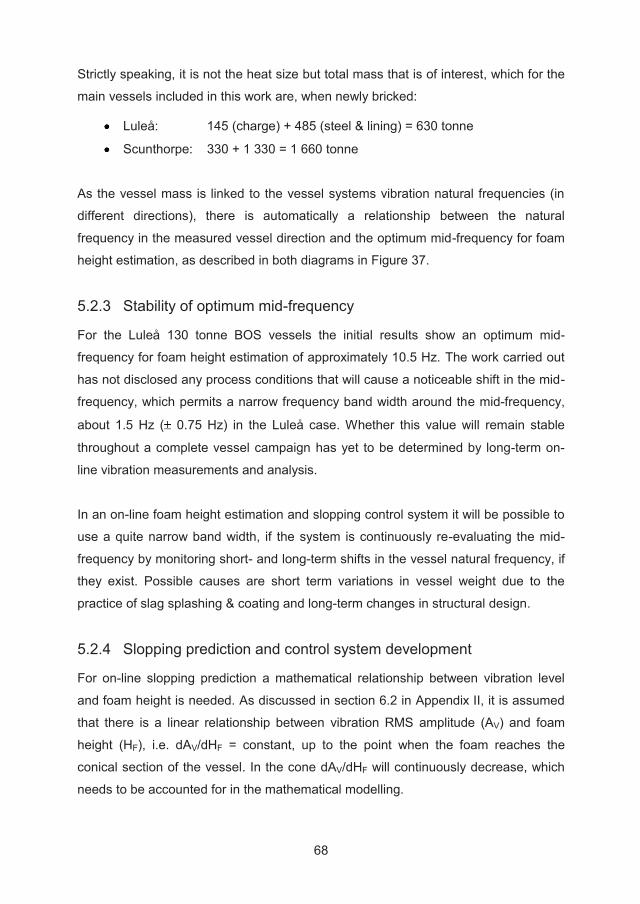
68
Strictly speaking, it is not the heat size but total mass that is of interest, which for the
main vessels included in this work are, when newly bricked:
Luleå: 145 (charge) + 485 (steel & lining) = 630 tonne
Scunthorpe: 330 + 1 330 = 1 660 tonne
As the vessel mass is linked to the vessel systems vibration natural frequencies (in
different directions), there is automatically a relationship between the natural
frequency in the measured vessel direction and the optimum mid-frequency for foam
height estimation, as described in both diagrams in Figure 37.
5.2.3 Stability of optimum mid-frequency
For the Luleå 130 tonne BOS vessels the initial results show an optimum mid-
frequency for foam height estimation of approximately 10.5 Hz. The work carried out
has not disclosed any process conditions that will cause a noticeable shift in the mid-
frequency, which permits a narrow frequency band width around the mid-frequency,
about 1.5 Hz ( 0.75 Hz) in the Luleå case. Whether this value will remain stable
throughout a complete vessel campaign has yet to be determined by long-term on-
line vibration measurements and analysis.
In an on-line foam height estimation and slopping control system it will be possible to
use a quite narrow band width, if the system is continuously re-evaluating the mid-
frequency by monitoring short- and long-term shifts in the vessel natural frequency, if
they exist. Possible causes are short term variations in vessel weight due to the
practice of slag splashing & coating and long-term changes in structural design.
5.2.4 Slopping prediction and control system development
For on-line slopping prediction a mathematical relationship between vibration level
and foam height is needed. As discussed in section 6.2 in Appendix II, it is assumed
that there is a linear relationship between vibration RMS amplitude (AV) and foam
height (HF), i.e. dAV/dHF = constant, up to the point when the foam reaches the
conical section of the vessel. In the cone dAV/dHF will continuously decrease, which
needs to be accounted for in the mathematical modelling.
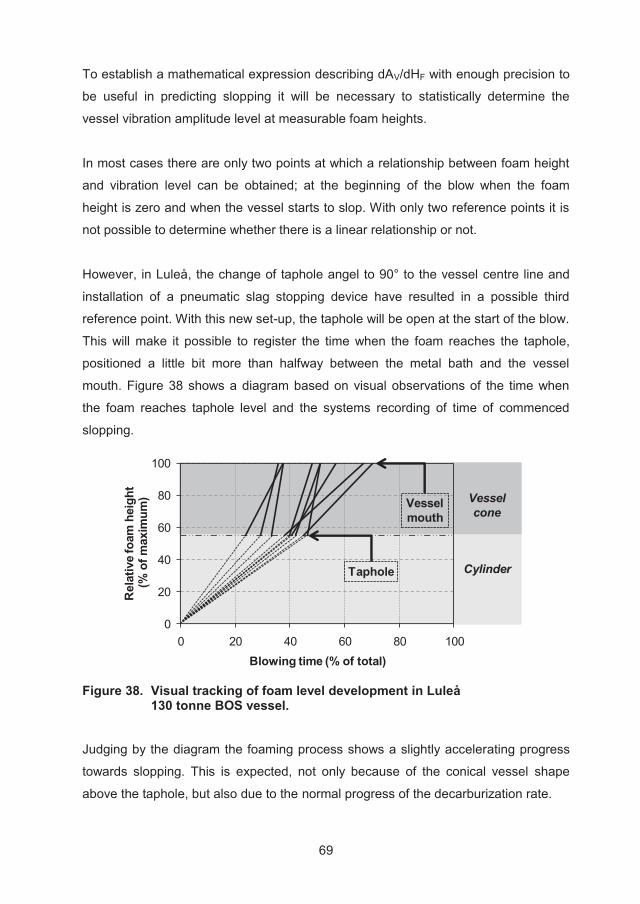
69
To establish a mathematical expression describing dAV/dHF with enough precision to
be useful in predicting slopping it will be necessary to statistically determine the
vessel vibration amplitude level at measurable foam heights.
In most cases there are only two points at which a relationship between foam height
and vibration level can be obtained; at the beginning of the blow when the foam
height is zero and when the vessel starts to slop. With only two reference points it is
not possible to determine whether there is a linear relationship or not.
However, in Luleå, the change of taphole angel to 90° to the vessel centre line and
installation of a pneumatic slag stopping device have resulted in a possible third
reference point. With this new set-up, the taphole will be open at the start of the blow.
This will make it possible to register the time when the foam reaches the taphole,
positioned a little bit more than halfway between the metal bath and the vessel
mouth. Figure 38 shows a diagram based on visual observations of the time when
the foam reaches taphole level and the systems recording of time of commenced
slopping.
0
20
40
60
80
100
0 20 40 60 80 100
Rel
ativ
e fo
am h
eigh
t(%
of m
axim
um)
Blowing time (% of total)
Vesselcone
Cylinder
Vesselmouth
Taphole
Figure 38. Visual tracking of foam level development in Luleå 130 tonne BOS vessel.
Judging by the diagram the foaming process shows a slightly accelerating progress
towards slopping. This is expected, not only because of the conical vessel shape
above the taphole, but also due to the normal progress of the decarburization rate.
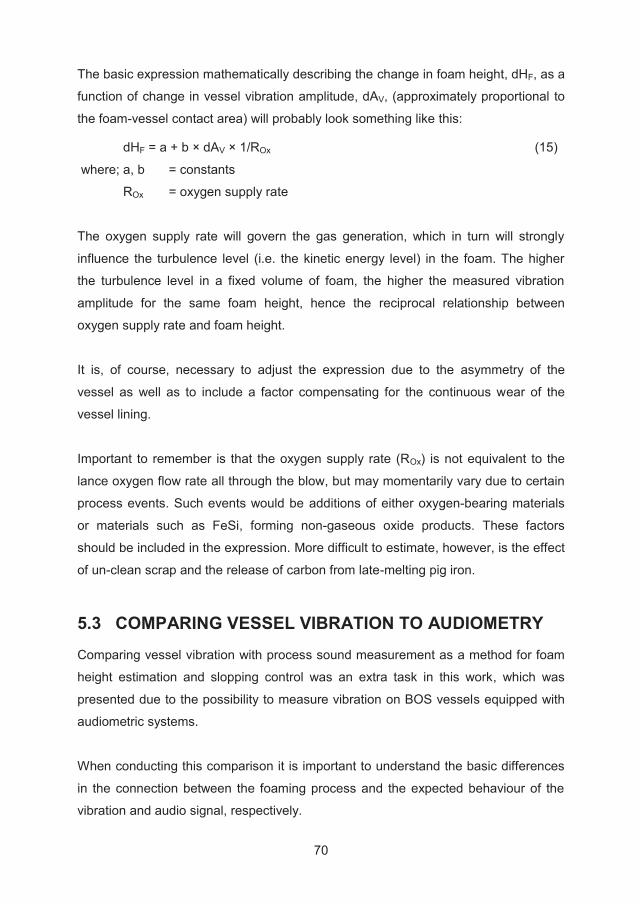
70
The basic expression mathematically describing the change in foam height, dHF, as a
function of change in vessel vibration amplitude, dAV, (approximately proportional to
the foam-vessel contact area) will probably look something like this:
dHF = a + b × dAV × 1/ROx (15)
where; a, b = constants
ROx = oxygen supply rate
The oxygen supply rate will govern the gas generation, which in turn will strongly
influence the turbulence level (i.e. the kinetic energy level) in the foam. The higher
the turbulence level in a fixed volume of foam, the higher the measured vibration
amplitude for the same foam height, hence the reciprocal relationship between
oxygen supply rate and foam height.
It is, of course, necessary to adjust the expression due to the asymmetry of the
vessel as well as to include a factor compensating for the continuous wear of the
vessel lining.
Important to remember is that the oxygen supply rate (ROx) is not equivalent to the
lance oxygen flow rate all through the blow, but may momentarily vary due to certain
process events. Such events would be additions of either oxygen-bearing materials
or materials such as FeSi, forming non-gaseous oxide products. These factors
should be included in the expression. More difficult to estimate, however, is the effect
of un-clean scrap and the release of carbon from late-melting pig iron.
5.3 COMPARING VESSEL VIBRATION TO AUDIOMETRY
Comparing vessel vibration with process sound measurement as a method for foam
height estimation and slopping control was an extra task in this work, which was
presented due to the possibility to measure vibration on BOS vessels equipped with
audiometric systems.
When conducting this comparison it is important to understand the basic differences
in the connection between the foaming process and the expected behaviour of the
vibration and audio signal, respectively.
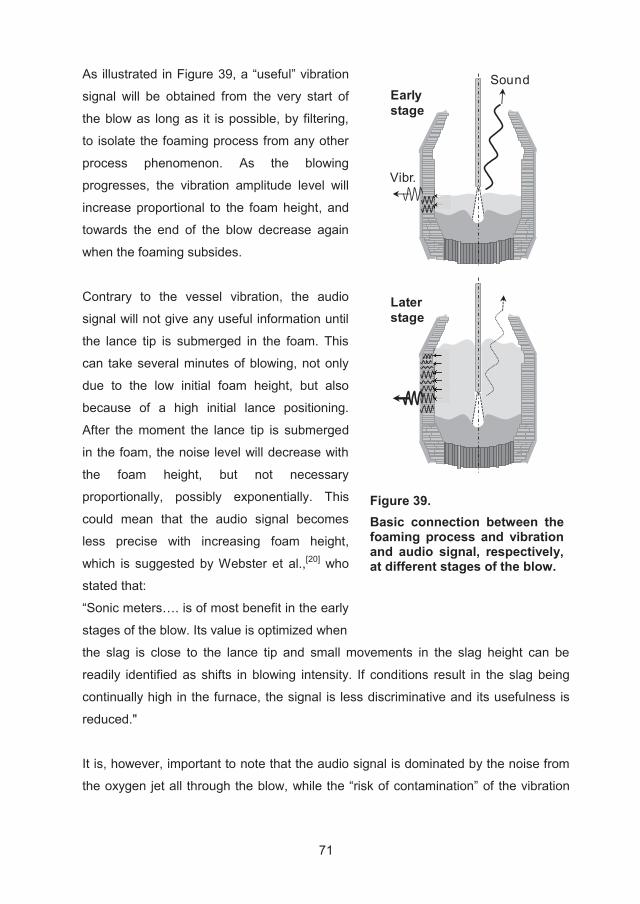
71
As illustrated in Figure 39, a “useful” vibration
signal will be obtained from the very start of
the blow as long as it is possible, by filtering,
to isolate the foaming process from any other
process phenomenon. As the blowing
progresses, the vibration amplitude level will
increase proportional to the foam height, and
towards the end of the blow decrease again
when the foaming subsides.
Contrary to the vessel vibration, the audio
signal will not give any useful information until
the lance tip is submerged in the foam. This
can take several minutes of blowing, not only
due to the low initial foam height, but also
because of a high initial lance positioning.
After the moment the lance tip is submerged
in the foam, the noise level will decrease with
the foam height, but not necessary
proportionally, possibly exponentially. This
could mean that the audio signal becomes
less precise with increasing foam height,
which is suggested by Webster et al.,[20] who
stated that:
“Sonic meters…. is of most benefit in the early
stages of the blow. Its value is optimized when
Sound
Vibr.
Earlystage
Laterstage
Figure 39. Basic connection between the foaming process and vibration and audio signal, respectively, at different stages of the blow.
the slag is close to the lance tip and small movements in the slag height can be
readily identified as shifts in blowing intensity. If conditions result in the slag being
continually high in the furnace, the signal is less discriminative and its usefulness is
reduced."
It is, however, important to note that the audio signal is dominated by the noise from
the oxygen jet all through the blow, while the “risk of contamination” of the vibration
72
signal by other vibration-generating process phenomena than the foaming process is
larger and varying throughout the blow.
The trials at Luleå as well as at Scunthorpe, described in Appendix III, show the
general usefulness of both methods, provided correct signal filtering is employed,
and that there is good correlation between the signal amplitude from respective
system and foam height, judged by the occurrence of slopping.
The respective methods’ pros and cons can be summarized as follows:
i. vessel vibration will give an indication of the progress of the foaming process
throughout the whole blow, but there is always a risk of signal contamination
caused by other process phenomena than foaming, such as additions that
will change the volume fraction of gas in the foam and, hence, the level of
kinetic energy per unit volume of foam;
ii. the audio signal will not give any relevant information until 4-5 minutes into
the blow when the oxygen lance has made proper contact with the foam, but
is less susceptible to influence by other varying process-generated noise
than the oxygen jet, except in the case of additions of wet materials;
iii. both methods will “suffer” in the case of a reduced or fluctuating oxygen flow
rate; vessel vibration, as it is affected by the generation rate of process
gases, and the audiometry, as the process noise is dominated by the sound
created by the oxygen jet.
Even if some of the trial heats indicate that vessel vibration signal may pick up an
imminent slopping event before the audio signal, the observations are too few to
draw any definite conclusions as to whether one of the methods is better than the
other. Instead, the results so far give a clear indication that it would be quite
profitable to combine the two methods. In any case, a lot more parallel
measurements are needed.
73
6 CONCLUSIONS
6.1 BOS SLOPPING BEHAVIOUR
Reflecting over the all the published basic research and plant development carried
out in order to attend to the slopping problem, it is perhaps surprising the issue is still
very much the centre of attention; or perhaps not, considering the practical everyday
BOS process operation.
Recording slopping is readily achieved by on-line image analysis utilizing cameras
that cover the area underneath the vessel and or the vessel mouth. In the latter case
it is necessary to be able to distinguish between slopping and flaring, while in both
cases it would be of great value to be able to distinguish between slopping and
spitting.
The main slopping causes are well documented and are not unique to the SSAB
Luleå BOS vessel operation, namely:
over-charged vessels due to productivity demands and occasionally
due to excessive splashing and slag coating;
poor lance profile control in combination with improper lance nozzle design;
the use of low-grade in-plant recycled scrap;
large flux and coolant batch additions;
improper slag formation control due to varying hot metal quality;
excessive use of dolomitic fluxes;
lack or loss of proper bath agitation;
lack of static slopping probability and slag control models,
slopping prediction systems and standardized dynamic measures.
To achieve a major improvement in the slopping situation for the Luleå BOS
operation, all the above issues need to be addressed and evaluated against clearly
stated existing aims and demands.
74
However, slopping will most likely continue to be a serious yield, operational and
environmental problem, as it will be a tempting possibility to increase the vessel load
every time an improvement in the slopping situation is achieved.
If there is a need to implement a slopping prediction system, there are a number of
possible solutions, a couple of which are even commercially available. Most common
are methods based on process sound (audiometry), lance vibration or off-gas
analysis. The precision in slopping prediction can be considerably improved by
combining methods.
6.2 VESSEL VIBRATION FOR FOAM HEIGHT ESTIMATION
This work has shown and confirmed that:
1. during the BOS process, transfer of kinetic energy from the foaming slag to
the vessel results in vibration at the vessel wall. These vibrations propagate
through the vessel structure, but only the lower part of the vibration frequency
spectrum will travel all the way to the outer parts of the structure, as the
vessel itself will act as a mechanical filter;
2. best correlation with foam level is obtained with the vibrations in the
horizontal y-direction, i.e. in the vessel tilting direction. This observation is not
surprising, as the forces of the foaming slag only act on the vertical part of
the vessel;
3. most favourable and practical is to monitor vessel vibrations by placing an
accelerometer on the trunnion. It should be on the drive side, where the
trunnion has more free movement;
4. as the resonance and, hence, the filtering properties of the vessel
mechanical structure will vary from converter to converter, so will the
optimum frequency band. It will, however, remain constant for an individual
converter as long as no major change is made to the vessel design;
5. the results indicate that there is a correlation between vibration and foam
height that can be used for dynamic foam level and slopping control;
75
6. vessel vibration can be used on any size of BOS vessel to monitor the
foaming process for dynamic foam height estimation and slopping control;
7. as the mechanical filtering properties of the vessel structure will vary from
vessel to vessel, so will the optimum mid-frequency; the larger the vessel
mass, the lower the optimum mid-frequency;
8. under controlled process conditions BOS vessel vibration and audiometry are
equally valuable methods for dynamic foam height and slopping control, but
certain process disturbances and practices may cause either of the methods
to fail;
9. as there is a difference between which method that will fail dependent on
process conditions, a combination of the two would largely increase the
accuracy in the prediction of slopping, which could be further improved by
integrating other process data such as off-gas analysis.
76
7 FUTURE WORK
It is the local BOS process situation that determines which issues or phenomena
require deeper analysis. For the BOS operation at SSAB Luleå it is necessary to
make a deeper study into the initial stages of the slag formation, to map the slag
trajectory for different process cases and to determine which factors obstruct lime
dissolution. This work would require the development of an in-blow sampling method
which will produce large enough slag samples to enable determination of the slag
emulsion make-up (i.e. fractions of liquid slag, precipitated slag phases, 2nd phase
particles and metal droplets) by microscopic examinations.
With the installation of an on-line vessel vibration measurements system it will be
possible to study both short- and long-term influences on the choice of frequency
band for foam height estimation.
With good knowledge of how to process the vibration signal, it will be possible to
develop an on-line system, which should include both static pre-blow slopping
probability calculations, dynamic in-blow slopping prediction and standardized
slopping prevention actions. For best possible accuracy in slopping prediction the
system should make use of audio measurements as well as of proper off-gas data
(flow rate and analysis). Also important is to develop an operator interface which will
simultaneously display all available process signals involved in slopping prediction;
vibration, audio, lance profile, bath agitation function, oxygen flow rate
decarburization rate and in-blow additions, as well as the registered slopping value.
It is also recommended that a deeper analysis of the vessel vibration signal into
correlations with other process phenomena, such as decarburization rate, bath
agitation efficiency and dephosphorization, be conducted.
77
8 REFERENCES
[1] Krieger, W., “50 Years LD Steelmaking - 50 Years of Innovation”, Proc. 4th
EOSC, Graz, Austria, May 2003, paper-001, Keynote1, CD-ROM.
[2] “Steel Statistical Yearbook 2009”, worldsteel Association, worldsteel
Committee on Economic Studies – Brussels, 2010, published on the web:
http://www.worldsteel.org/pictures/programfiles/SSY2009.pdf
[3] Siemens/VAI, “LD (BOF) Steelmaking Solutions”, published on the web:
http://is.industry.siemens.com/broschueren/pdf/metals/siemens_vai/en/LD
BOF-SteelmakingSolutions_en.pdf
[4] Di Napoli Guzela, D. and de Oliveira, J.G., “The Ultimate LD Steelmaking
Converter, The Synthesis of 50 Years of Development”, Proc. 4th EOSC,
Graz, Austria, May 2003, paper 28, CD-ROM.
[5] Jung, S-M. and Fruehan, R.J., “Foaming Characteristics of BOS Slags”,
ISIJ Int., Vol. 40 (2000), No. 4, pp. 348-355.
[6] Misra, P., Deo, B. and Chhabra, R.P., “Dynamic Model of Slag Foaming in
Oxygen Steelmaking Converters”, ISIJ Int., Vol. 38 (1998), No. 11, pp.
1225-1232.
[7] Lahiri, A.K and Pal, S., “Foaminess of Slag: Cause and Control”, Proc. 7th
Int. Conf. on Molten Slags Fluxes and Salts, Cap Town, South Africa,
January 2004, pp. 473-477.
[8] Lotun, and Pilon, L., “Physical Modeling of Slag Foaming for Various
Operating Conditions and Slag Compositions”, ISIJ Int., Vol. 45 (2005),
No. 6, pp. 835-840.
[9] Lahiri, A.K. and Seetharaman, S., “Foaming Behavior of Slags”,
Metallurgical and Materials Trans. B, Vol. 33B, June 2002, pp. 449-502.
[10] Ito, K. and Fruehan, R.J., “Study on the Foaming of CaO-SiO2-FeO Slags:
Part II. Dimensional Analysis and Foaming in Iron and Steelmaking
Processes”, Metallurgical Trans. B, Vol. 20B, August 1989, pp. 515-521.
[11] Bikerman, J.J., “Foams and Emulsions”, Industrial and Engineering
Chemistry, Vol. 57, No. 1, January 1965, pp. 56-62.
[12] Brinkman, H.C., “The Viscosity of Concentrated Suspensions and
Solutions”, Jour. of Chemical Physics., Vol. 20, No. 4, April 1952, p. 571.
78
[13] Happel, J., “Viscosity of Suspensions of Uniform Spheres”, Jour. of
Applied Physics, Vol. 28, No. 11, November 1957, pp. 1288-1292.
[14] Chukwulebe, B.O., Balajee, S.R., Robertson, K.J., Grattan, J.G. and
Green, M.J., “Computer Optimization of Oxygen Blowing Practices to
Control BOF Slopping”, Proc. AISTech 2004, Vol. 1, Nashville,
Tennessee, USA, pp.751-762.
[15] Lait, J.E., Heyer, K.W. and Cuthill, G.K., “BOF Control Using Waste Gas
Temperature”, McMaster Symp. on The Role of Slag in Basic Oxygen
Steelmaking Processes, Hamilton, Canada, 1976, paper 8.
[16] Margot-Marette, H. and Riboud, P.V., “Fusibilité et Christalisation des
Laitiers Basiques peu Phosphatés d’Aciérie”, Revue de Métallurgie,
September 1964, pp. 709-713.
[17] Deo, B. and Boom, R., “Fundamentals of Steelmaking Metallurgy”,
Prentice Hall International (UK) Limited, London, UK, 1993, ISBN 0-13-
345380-4, pp. 161-188.
[18] Oeters, F. and Scheel, R., “Untersuchungen zur Kalkauflösung in CaO-
FeO-SiO2-Schlacken”, Arch. Eisenhüttenwesen, Vol. 45 (1974), Nr. 9,
September, pp. 575-580 (in German).
[19] Persson, A., “Slag Formation in the LD Converter and its Importance for
Dephosphorization”, Master’s Thesis 2005:312 CIV, Luleå University of
Technology, ISSN: 1402 - 1617 (in Swedish).
[20] Webster, D.L., Greenhalgh, K.G. and Boswell, C., “Recent Development in
Process Control and Efficiency at BHP Newcastle Works BOS Shop”,
Proc. 68th ISS Steelmaking Conf., Vol. 68, Detroit, Michigan, USA, 1985,
pp. 299-307.
[21] Evestedt, M. and Medvedev, A., “Model-based Slopping Warning in the LD
Steel Converter Process”, Journal of Process Control, No.19 (2009), pp.
1000-1010.
[22] Ruuska, J., Ollila, S., Bååth, L. and Leiviskä, K., “Possibilities to Use New
Measurements to Control LD-KG-converter”, Proc. 5th EOSC, Aachen,
Germany, June 2006, pp. 210-217, CD-ROM.
[23] Kattenbelt, C., Spelbos, E., Mink, P. and Roffel, B., “Detection of Slopping
in Basic Oxygen Steelmaking using a Camera Viewing the Converter
Mouth”, Steel Research Int., Vol. 79 (2008), No. 11, pp. 821-825.
79
[24] Shakirov, M., Boutchenkov, A., Galperine, G. and Schrader, B., “Prediction
and Prevention of Slopping in a BOF”, Iron & Steel Technology, January
2004, pp. 38-44.
[25] Opletal, J., Klimek, K., Piegza, Z., Petrunin, M., Chernyavskiy, S.,
Galparine, G. and Schrader, B., “Optimization of BOF Operations at
Trinecke Zelezarny”, Proc. AISTech 2005, Vol.1, Charlotte, North Carolina,
USA, pp. 751-757, CD-ROM.
[26] Lindgren, C-H., “Lime Dissolution and Slag Foaming in the LD”, Technical
Report MF 11/73, MEFOS, Luleå, Sweden (in Swedish).
[27] Snoeijer, A.B., Mink, P., Overbosch, A., Hartwig, M., ter Voort, H. and
Brockhoff, J.P., “Improvement of Converter Process Consistency at BOS
No 2, Corus IJmuiden”, Proc. 5th EOSC, Aachen, Germany, June 2006,
pp. 186-193, CD-ROM.
[28] Blossey, R.G., Kim, C.S. and Shimkets, J.D., “BOF Slopping Control”,
Proc. 62nd ISS Steelmaking Conf., Vol. 62, 1979, Detroit, Michigan, USA,
pp.158-163.
[29] Cosma, D., Stubs P. and Strathdee, B.A., “B.O.F. Slag Control Studies at
Dofasco”, McMaster Symp. on The Role of Slag in Basic Oxygen
Steelmaking Processes, Hamilton, Canada, 1976, paper 4.
[30] Stravinskas, J. and Deamer, M.R., “Influence of Operating Variables on
BOF Yield”, Proc. 61th ISS Steelmaking Proc., Vol. 61, 1978, Chicago,
Illinois, USA, pp. 15-22.
[31] Irmler, B., Klimek, K., Piegza, Z., Galperine, G., Petrounine, M., Schrader,
B. and Opletal, J., “Metallurgically Engineered Flux for Liquid
Steelmaking”, Proc. ISSTech 2003, Vol. 1, Indianapolis, Indiana, USA, pp.
1157-1165, CD-ROM.
[32] Grip, C-E., “Slopping in the LD – Summary of Present Knowledge Level
and Measures”, Technical Report MFS 1/81, SSAB, Luleå, Sweden (in
Swedish).
[33] Bock, B., Schoop, J. and Oehler, C., “The Influence of Blowing
Techniques, Bottom Stirring and Lance Design in the LD Process on Slag
Formation, the Formation of Lance and Converter Skulls and Converter
Lining Life”, Proc. 3rd EOSC, Birmingham, UK, October 2000, CD-ROM.
80
[34] Classen, S.B. and Gerber, A., “BOF Production and Cost Optimisation at
ISCOR Vanderbijlpark”, Proc. 3rd EOSC, Birmingham, UK, October 2000,
CD-ROM.
[35] Lilja, J., Ollila, S. and Nevala, H., “Decade of Development in Steelmaking
at Ruukki Production, Raahe Steel Works”, Proc. 5th EOSC, Aachen,
Germany, June 2006, pp. 494-500, CD-ROM.
[36] Chigwedu, C., Kempken, J. and Pluschkell, W., “A New Approach for the
Dynamic Process Simulation of the BOF-Process”, Proc. 5th EOSC,
Aachen, Germany, June 2006, pp. 363-371, CD-ROM.
[37] Nishizaki, R.M., Hambly, L.E. and Lohbihler, A.H., “Automatic Slop Control
at Stelco's Hilton Works”, Proc. 67th ISS Steelmaking Conf., Vol. 67, 1984,
Chicago, Illinois, USA, pp. 163-169.
[38] Masui, A., Yamada, K. and Takahashi, K., “Slagmaking, Slag/metal
Reactions and their Sites in BOF Refining Processes”, McMaster Symp.
on The Role of Slag in Basic Oxygen Steelmaking Processes, Hamilton,
Canada, 1976, paper 3.
[39] Iida, Y., Emoto, K., Ogawa, M., Masuda, Y., Onishi, M. and Yamada, H.,
”Fully Automatic Blowing Technique for Basic Oxygen Steelmaking
Furnace”, Trans. ISIJ, Vol. 24, 1984, pp.540-546.
[40] Molloseau, C.L., and Fruehan, R.J., “Waste Oxide Recycling During
Oxygen Steelmaking”, Proc. 83rd ISS Steelmaking Conf., Vol. 83, 2000,
Pittsburgh, Pennsylvania, USA, pp. 303-313.
[41] Lee, M.S., O´Rourke, S.L. and Molloy, N.A., “Fluid Flow and Surface
Waves in the BOF”, Iron & Steelmaker, October 2002, pp. 56-65.
[42] Ajmani, S.K., Subba Rao, B.V. and Chatterjee, A., “Mixing and Mass
Transfer in the 130t LD Converters at Tata Steel: Cold Model Studies”,
Tata Search, 1994, pp. 62-70.
[43] Loumala, M.J., Fabritius, T.M.J., Virtanen, E.O., Siivola, T.P. and Härkki,
J.J., “Splashing and Spitting Behaviour in the Combined Blown
Steelmaking Converter”, ISIJ Int., Vol. 42 (2002), No. 9, pp. 944-949.
[44] Nagai, J., Yamamoto, T., Yamada, H., Take, H., Tachibana, R., Omori, H.,
Nakanishi, K. and Iida, Y., “Metallurgical Characteristics of Combined-
blown Converters”, Kawasaki Steel Technical Report, No. 6, September
1982, pp. 12-20.
81
[45] Taguchi, K., Hanmyo, M., Shiratani, Y. and Hasagawa, T., “Improving the
BOF Process by Bottom Blowing: the NK-CB Process”, Iron and steel
Engineer, April 1983, pp. 26-31.
[46] Barão, C.D., Moreira, D.B., Duarte, J.C., and de Souza Junior, J.A.,
“Converters Revamping with New Combined Blowing Process by CST”,
Proc. ISSTech 2003 Conf., Vol. 1, Indianapolis, Indiana, USA, pp. 675-
681, CD-ROM.
[47] Bruckhaus, R. and Lachmund, H., “Stirring Strategies to Meet the Highest
Metallurgical Requirements in the BOF Process”, Iron & Steel Technology,
November 2007, pp.44-50.
[48] Bradley, J.E., Balajee, S.R. and Halgas, J.M., “An Integrated Approach to
Yield Improvement at Mittal Steel – Indiana Harbor East No. 4 BOF Shop”,
AISTech 2005 Proc., Vol. 1, Charlotte, North Carolina, USA, pp. 679-689,
CD-ROM.
[49] Kanai, T., Sakai, A., Tani, J., Yoshida, S. and Matsui, N. ”Development of
a Slopping Prediction and Control System in BOF Operation”, Proc. 2nd
EOSC, Taranto, Italy, 1997, pp. 267-275.
[50] Bencini, C. and Poli, A., “Automation for Refining and Slag Control in LD
Process at AFP/Piombino Steel Shop”, Proc. 76th ISS Steelmaking Conf.,
Vol. 76, 1993, Dallas, Texas, USA, pp. 193-198.
[51] Grenfell, H.W. and Brown, D.J., “Use of Continuous Weighing of BOS
Furnace for Controlling the Blow”, Proc. 57th Open Hearth and Basic
Oxygen Conf., Vol. 57, 1974, Atlantic City, New Jersey, USA, pp. 2-15.
[52] Kemlo, K.G., “Use of Photocell Equipment for Slop Control on a 200 tonne
B.O.S. Furnace”, BHP tech. bulletin, Vol.18, No. 1, May 1974, pp. 16-22.
[53] Garnica, P.G., Morales, R.D. and Rodríguez, N.U., “Slag Control of BOF
Combined Blowing Process by Mathematical Modelling”, Proc.
Metallurgical Processes for the Early Twenty-First Century, TMS, 1994,
pp. 631-642.
[54] Naito, K., Kitamura, S. and Ogawa, Y., “Effects of BOF Top-blowing and
Bottom-stirring Conditions on Suppressing Excessive Oxidation”,
Ironmaking & Steelmaking, Vol. 29, No. 3, June 2002 , pp. 208-213.
82
[55] Takawa, T., Katayama, K. Katohgi, K. and Kuribayashi, T., ”Analysis of
Converter Process Variables from Exhaust Gas”, Trans. ISIJ, Vol. 28,
1988, pp. 59-67.
[56] Zhi-Gang, H., Liu, L., Ping, H. and Ming-Xiang, T., “A Dynamical Off-gas
Model on a 150t BOF”, Steel Times Int., April/May 2003, pp. 14-16.
[57] Merriman, D., “Mass Spectrometry for Oxygen Steelmaking Control”, Steel
Times, November 1997, pp. 439-440.
[58] Oda, M., Yoshino, M., Muraki, Y. and Hasegawa, T., “Development of the
Slopping Predictive and Suppressing System in LD Converter”, Proc. 6th
Int. Iron and Steel Congress, ISIJ, Nagoya, Japan, 1990, pp. 109-114.
[59] Iso, H., Arima, K., Kanemoto, M., Ueda, Y. and Yamane, H., “Prediction
and Suppression of Slopping in the Converter”, Trans. ISIJ, Vol. 28, 1988,
pp. 382-391.
[60] Pak, J.J., Min, D.J. and You, B.D., “Slag Foaming Phenomena and its
Suppression Techniques in BOF Steelmaking Process”, Proc. 79th ISS
Steelmaking Conf., Vol. 79, 1996, Pittsburgh, Pennsylvania, USA, pp. 763-
769.
[61] Walker, D.I., Kemeny, F.L. and Jones, J.A.T., “Vessel Slopping Detection”,
Proc. AISTech 2005, Vol.1, Charlotte, North Carolina, USA, pp. 711-720,
CD-ROM.
[62] Note: “Some Trials in the Development of a Slopping Prediction Technique
in the BOF at Kakogawa Works, Kobe Steel, Ltd.”, ISIJ Int., Vol. 31 (1991),
No. 1, pp. 1368-1370.
[63] Zuliani, D.J., Scipolo, V., Maiolo, J. and Born, C., “Opportunities for
Increasing Productivity and Lowering Operating Costs While Reducing
GHG Emissions in Steelmaking”, Proc. AISTech 2010 Conf., Vol. I,
Pittsburgh, Pennsylvania, USA, pp. 61-71, CD-ROM.
[64] Dauby, P. and Etienne, A., “Advantages of the Control of Slag
Composition in Basic Oxygen Steelmaking Process”, McMaster Symp. on
The Role of Slag in Basic Oxygen Steelmaking Processes, Hamilton,
Canada, 1976, paper 12.
[65] van Boggelen, J.W.K., “Use of Dynamic Data to Optimise Vessel
Refining”, Proc. 5th EOSC, Aachen, Germany, June 2006, pp. 108-114,
CD-ROM.
83
[66] Cicutti, C., MartÍn, M., Donayo, R. and Gómez, A., “Evaluation of the
Slopping Tendency in Oxygen Converters Using Sound Signals”, Proc.
16th IAS Steelmaking Conf., Rosario, Argentina, 2007, pp. 147-155.
[67] Note: “Prediction and Control of Slag Slopping in BOF Using Microwave
Gauge”, Trans. ISIJ, Vol.24 , No.6(1984), p.502.
[68] Millman, M.S., Bååth, L., Malmberg, D. and Price, E., “Radio Wwave
Interferometry for BOS Slag Control”, Proc. 2nd Int. Congress on the
Science and Technology of Steelmaking, Vol. 1, 2001, pp. 309-320.
[69] Iso, H., Ueda, Y., Narita, H., Yoshida, T., Saito, M., Ogata, S., Sakanashi,
N. and Murata, T., ”Development of Closed OG System (ACOR)”, Nippon
Steel Technical Report, No. 31, October 1986, pp. 17-26.
[70] Zhang, Y. and Fruehan, R.J., “Effect of Carbonaceous Particles on Slag
Foaming”, Metallurgical and Materials Trans. B, Volume 26B, August
1995, pp. 813-819.
[71] Komarov, S.V., Kuwabara, M. and Sano, M., “Control of Slag Foaming
Rate by Sound Wave”, Proc. 6th Int. Conf. on Molten Slags Fluxes and
Salts, Stockholm/Helsinki, Sweden/Finland, June 2000, Filename: 257.pdf,
only on CD-ROM.
[72] Eriksson, L., Johansson, E., Kettaneh-Wold, N. and Wold, S., “Multi- and
Megavariate Data Analysis – Principles and Applications”, Umetrics AB,
Umeå, Sweden, ISBN- 91-973730-1-X.
[73] Jacobsen, G. and Puhls, A., “Slag Vibration Measurements”, Technical
Report TM-MFS 1/82, SSAB, Luleå, Sweden (in Swedish).
[74] Beranek, L. and Vér, I., “Noise and vibration control engineering”, Wiley-
Interscience, John Wiley & Sons, Inc., New York, (1992), ISBN 0-471-
61751-2.


Appendix I
Avoiding Sloppy BOS Process Behaviour
M. Brämming and B. Björkman
Proc. AISTech2010 Iron & Steel Technology Conference, Vol. 1, pages 1037-1047 (on CD-ROM),
also published in
Iron & Steel Technology, 2010, Vol. 7, No. 11, pages 66-75.

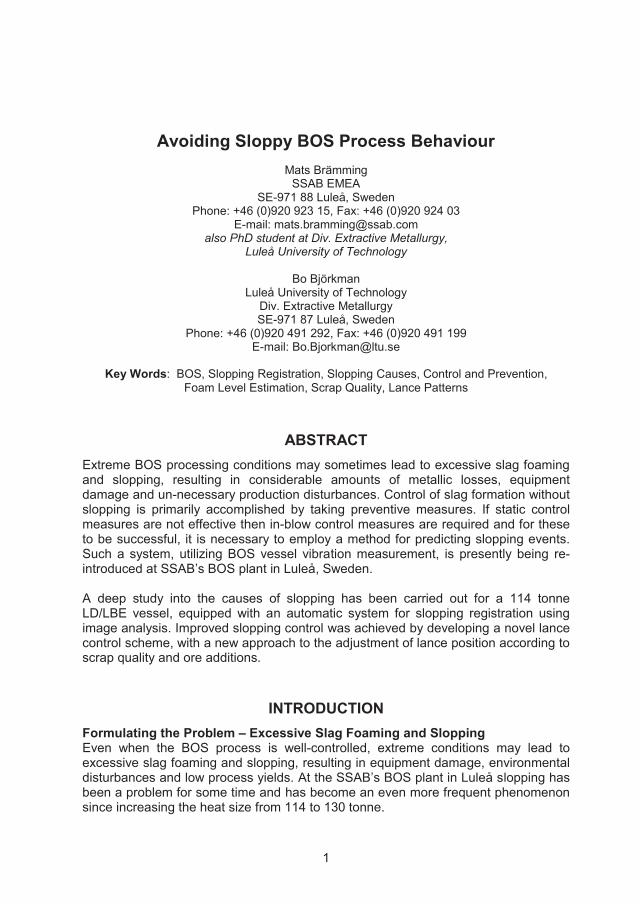
1
Avoiding Sloppy BOS Process Behaviour
Mats Brämming SSAB EMEA
SE-971 88 Luleå, Sweden Phone: +46 (0)920 923 15, Fax: +46 (0)920 924 03
E-mail: [email protected] also PhD student at Div. Extractive Metallurgy,
Luleå University of Technology
Bo Björkman Luleå University of Technology
Div. Extractive Metallurgy SE-971 87 Luleå, Sweden
Phone: +46 (0)920 491 292, Fax: +46 (0)920 491 199 E-mail: [email protected]
Key Words: BOS, Slopping Registration, Slopping Causes, Control and Prevention,
Foam Level Estimation, Scrap Quality, Lance Patterns
ABSTRACT Extreme BOS processing conditions may sometimes lead to excessive slag foaming and slopping, resulting in considerable amounts of metallic losses, equipment damage and un-necessary production disturbances. Control of slag formation without slopping is primarily accomplished by taking preventive measures. If static control measures are not effective then in-blow control measures are required and for these to be successful, it is necessary to employ a method for predicting slopping events. Such a system, utilizing BOS vessel vibration measurement, is presently being re-introduced at SSAB’s BOS plant in Luleå, Sweden. A deep study into the causes of slopping has been carried out for a 114 tonne LD/LBE vessel, equipped with an automatic system for slopping registration using image analysis. Improved slopping control was achieved by developing a novel lance control scheme, with a new approach to the adjustment of lance position according to scrap quality and ore additions.
INTRODUCTION Formulating the Problem – Excessive Slag Foaming and Slopping Even when the BOS process is well-controlled, extreme conditions may lead to excessive slag foaming and slopping, resulting in equipment damage, environmental disturbances and low process yields. At the SSAB’s BOS plant in Luleå slopping has been a problem for some time and has become an even more frequent phenomenon since increasing the heat size from 114 to 130 tonne.
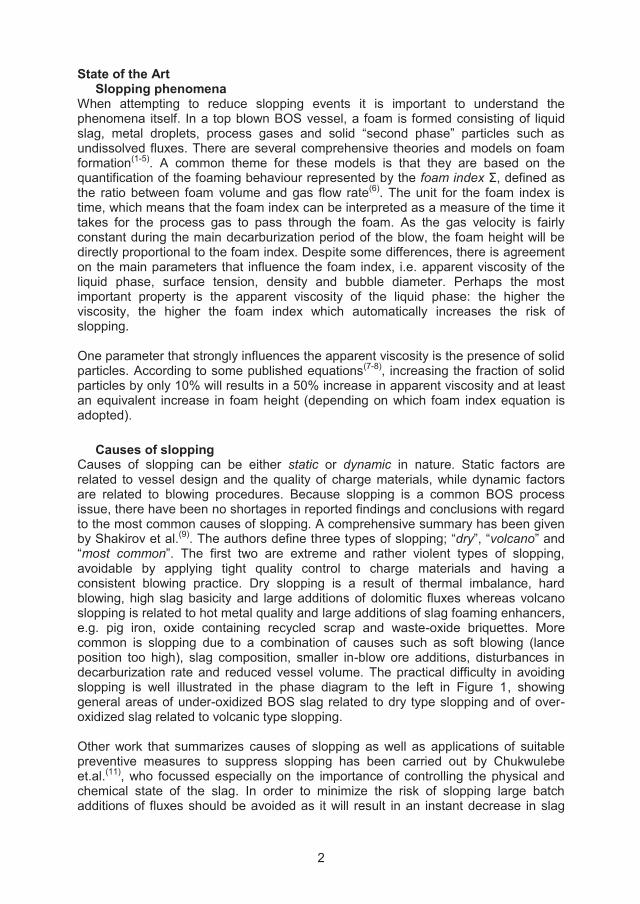
2
State of the Art Slopping phenomena When attempting to reduce slopping events it is important to understand the phenomena itself. In a top blown BOS vessel, a foam is formed consisting of liquid slag, metal droplets, process gases and solid “second phase” particles such as undissolved fluxes. There are several comprehensive theories and models on foam formation(1-5). A common theme for these models is that they are based on the quantification of the foaming behaviour represented by the foam index Σ, defined as the ratio between foam volume and gas flow rate(6). The unit for the foam index is time, which means that the foam index can be interpreted as a measure of the time it takes for the process gas to pass through the foam. As the gas velocity is fairly constant during the main decarburization period of the blow, the foam height will be directly proportional to the foam index. Despite some differences, there is agreement on the main parameters that influence the foam index, i.e. apparent viscosity of the liquid phase, surface tension, density and bubble diameter. Perhaps the most important property is the apparent viscosity of the liquid phase: the higher the viscosity, the higher the foam index which automatically increases the risk of slopping. One parameter that strongly influences the apparent viscosity is the presence of solid particles. According to some published equations(7-8), increasing the fraction of solid particles by only 10% will results in a 50% increase in apparent viscosity and at least an equivalent increase in foam height (depending on which foam index equation is adopted). Causes of slopping Causes of slopping can be either static or dynamic in nature. Static factors are related to vessel design and the quality of charge materials, while dynamic factors are related to blowing procedures. Because slopping is a common BOS process issue, there have been no shortages in reported findings and conclusions with regard to the most common causes of slopping. A comprehensive summary has been given by Shakirov et al.(9). The authors define three types of slopping; “dry”, “volcano” and “most common”. The first two are extreme and rather violent types of slopping, avoidable by applying tight quality control to charge materials and having a consistent blowing practice. Dry slopping is a result of thermal imbalance, hard blowing, high slag basicity and large additions of dolomitic fluxes whereas volcano slopping is related to hot metal quality and large additions of slag foaming enhancers, e.g. pig iron, oxide containing recycled scrap and waste-oxide briquettes. More common is slopping due to a combination of causes such as soft blowing (lance position too high), slag composition, smaller in-blow ore additions, disturbances in decarburization rate and reduced vessel volume. The practical difficulty in avoiding slopping is well illustrated in the phase diagram to the left in Figure 1, showing general areas of under-oxidized BOS slag related to dry type slopping and of over-oxidized slag related to volcanic type slopping. Other work that summarizes causes of slopping as well as applications of suitable preventive measures to suppress slopping has been carried out by Chukwulebe et.al.(11), who focussed especially on the importance of controlling the physical and chemical state of the slag. In order to minimize the risk of slopping large batch additions of fluxes should be avoided as it will result in an instant decrease in slag
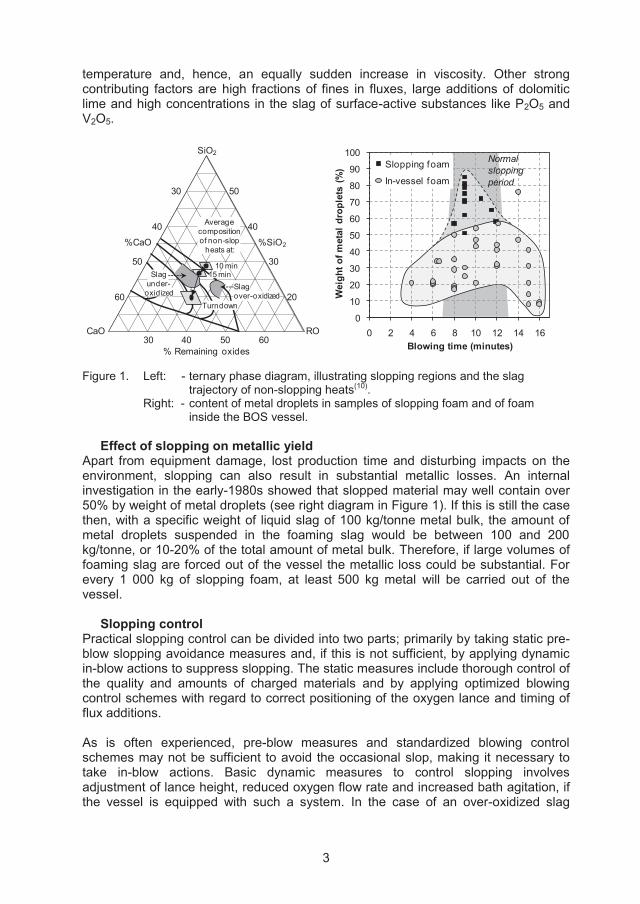
3
temperature and, hence, an equally sudden increase in viscosity. Other strong contributing factors are high fractions of fines in fluxes, large additions of dolomitic lime and high concentrations in the slag of surface-active substances like P2O5 and V2O5.
Turndown
30 50
40 40
%CaO %SiO2
50 30
60 20Slagover-oxidized
SiO2
CaO RO30 40 50 60
% Remaining oxides
Average composition of non-slop
heats at:
Slagunder-oxidized
15 min 10 min
0
10
20
30
40
50
60
70
80
90
100
0 2 4 6 8 10 12 14 16W
eigh
t of m
etal
dro
plet
s (%
)Blowing time (minutes)
Slopping foam
In-vessel foam
Normalsloppingperiod
Figure 1. Left: - ternary phase diagram, illustrating slopping regions and the slag
trajectory of non-slopping heats(10). Right: - content of metal droplets in samples of slopping foam and of foam inside the BOS vessel.
Effect of slopping on metallic yield Apart from equipment damage, lost production time and disturbing impacts on the environment, slopping can also result in substantial metallic losses. An internal investigation in the early-1980s showed that slopped material may well contain over 50% by weight of metal droplets (see right diagram in Figure 1). If this is still the case then, with a specific weight of liquid slag of 100 kg/tonne metal bulk, the amount of metal droplets suspended in the foaming slag would be between 100 and 200 kg/tonne, or 10-20% of the total amount of metal bulk. Therefore, if large volumes of foaming slag are forced out of the vessel the metallic loss could be substantial. For every 1 000 kg of slopping foam, at least 500 kg metal will be carried out of the vessel. Slopping control Practical slopping control can be divided into two parts; primarily by taking static pre-blow slopping avoidance measures and, if this is not sufficient, by applying dynamic in-blow actions to suppress slopping. The static measures include thorough control of the quality and amounts of charged materials and by applying optimized blowing control schemes with regard to correct positioning of the oxygen lance and timing of flux additions. As is often experienced, pre-blow measures and standardized blowing control schemes may not be sufficient to avoid the occasional slop, making it necessary to take in-blow actions. Basic dynamic measures to control slopping involves adjustment of lance height, reduced oxygen flow rate and increased bath agitation, if the vessel is equipped with such a system. In the case of an over-oxidized slag
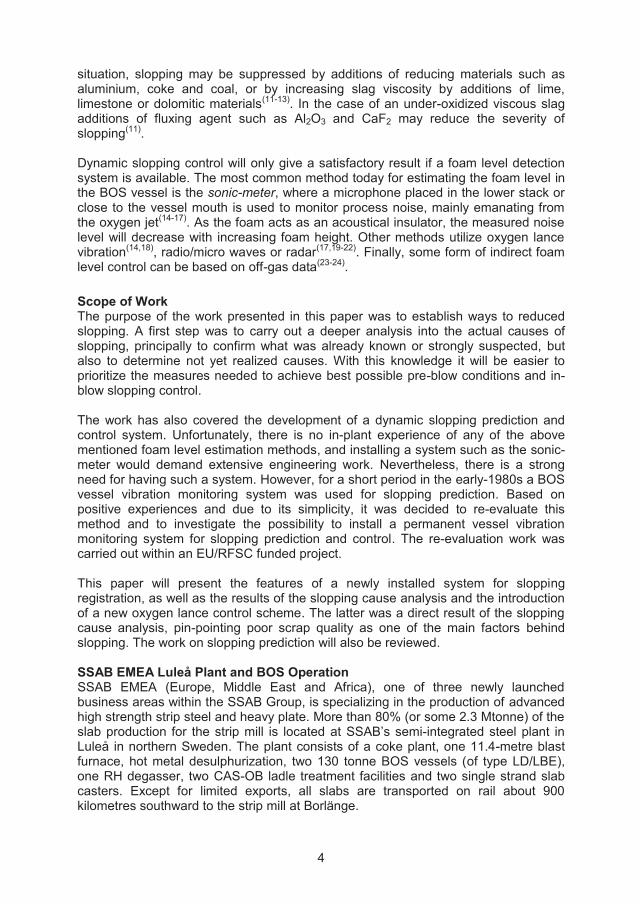
4
situation, slopping may be suppressed by additions of reducing materials such as aluminium, coke and coal, or by increasing slag viscosity by additions of lime, limestone or dolomitic materials(11-13). In the case of an under-oxidized viscous slag additions of fluxing agent such as Al2O3 and CaF2 may reduce the severity of slopping(11). Dynamic slopping control will only give a satisfactory result if a foam level detection system is available. The most common method today for estimating the foam level in the BOS vessel is the sonic-meter, where a microphone placed in the lower stack or close to the vessel mouth is used to monitor process noise, mainly emanating from the oxygen jet(14-17). As the foam acts as an acoustical insulator, the measured noise level will decrease with increasing foam height. Other methods utilize oxygen lance vibration(14,18), radio/micro waves or radar(17,19-22). Finally, some form of indirect foam level control can be based on off-gas data(23-24). Scope of Work The purpose of the work presented in this paper was to establish ways to reduced slopping. A first step was to carry out a deeper analysis into the actual causes of slopping, principally to confirm what was already known or strongly suspected, but also to determine not yet realized causes. With this knowledge it will be easier to prioritize the measures needed to achieve best possible pre-blow conditions and in-blow slopping control. The work has also covered the development of a dynamic slopping prediction and control system. Unfortunately, there is no in-plant experience of any of the above mentioned foam level estimation methods, and installing a system such as the sonic-meter would demand extensive engineering work. Nevertheless, there is a strong need for having such a system. However, for a short period in the early-1980s a BOS vessel vibration monitoring system was used for slopping prediction. Based on positive experiences and due to its simplicity, it was decided to re-evaluate this method and to investigate the possibility to install a permanent vessel vibration monitoring system for slopping prediction and control. The re-evaluation work was carried out within an EU/RFSC funded project. This paper will present the features of a newly installed system for slopping registration, as well as the results of the slopping cause analysis and the introduction of a new oxygen lance control scheme. The latter was a direct result of the slopping cause analysis, pin-pointing poor scrap quality as one of the main factors behind slopping. The work on slopping prediction will also be reviewed. SSAB EMEA Luleå Plant and BOS Operation SSAB EMEA (Europe, Middle East and Africa), one of three newly launched business areas within the SSAB Group, is specializing in the production of advanced high strength strip steel and heavy plate. More than 80% (or some 2.3 Mtonne) of the slab production for the strip mill is located at SSAB’s semi-integrated steel plant in Luleå in northern Sweden. The plant consists of a coke plant, one 11.4-metre blast furnace, hot metal desulphurization, two 130 tonne BOS vessels (of type LD/LBE), one RH degasser, two CAS-OB ladle treatment facilities and two single strand slab casters. Except for limited exports, all slabs are transported on rail about 900 kilometres southward to the strip mill at Borlänge.
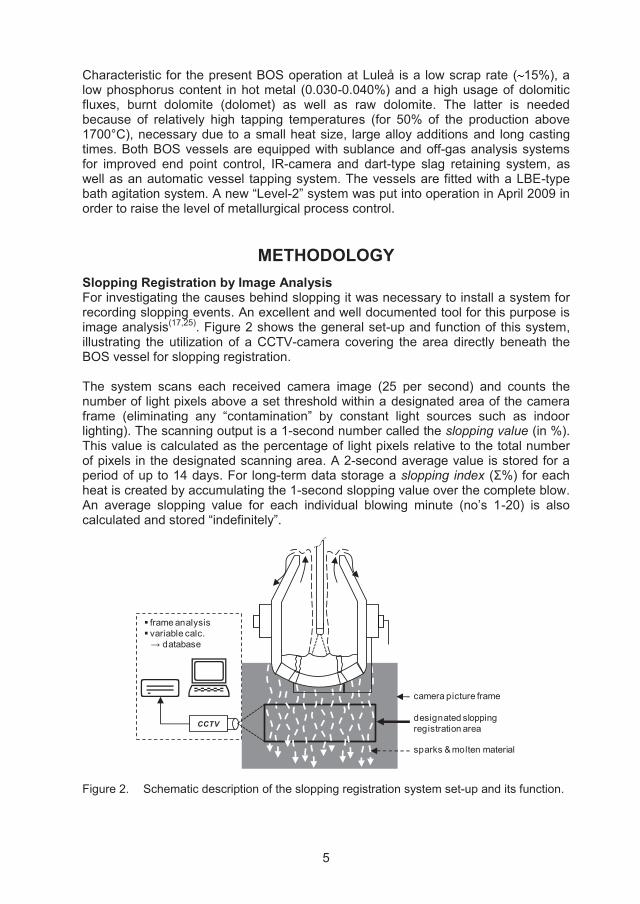
5
Characteristic for the present BOS operation at Luleå is a low scrap rate ( 15%), a low phosphorus content in hot metal (0.030-0.040%) and a high usage of dolomitic fluxes, burnt dolomite (dolomet) as well as raw dolomite. The latter is needed because of relatively high tapping temperatures (for 50% of the production above 1700°C), necessary due to a small heat size, large alloy additions and long casting times. Both BOS vessels are equipped with sublance and off-gas analysis systems for improved end point control, IR-camera and dart-type slag retaining system, as well as an automatic vessel tapping system. The vessels are fitted with a LBE-type bath agitation system. A new “Level-2” system was put into operation in April 2009 in order to raise the level of metallurgical process control.
METHODOLOGY Slopping Registration by Image Analysis For investigating the causes behind slopping it was necessary to install a system for recording slopping events. An excellent and well documented tool for this purpose is image analysis(17,25). Figure 2 shows the general set-up and function of this system, illustrating the utilization of a CCTV-camera covering the area directly beneath the BOS vessel for slopping registration. The system scans each received camera image (25 per second) and counts the number of light pixels above a set threshold within a designated area of the camera frame (eliminating any “contamination” by constant light sources such as indoor lighting). The scanning output is a 1-second number called the slopping value (in %). This value is calculated as the percentage of light pixels relative to the total number of pixels in the designated scanning area. A 2-second average value is stored for a period of up to 14 days. For long-term data storage a slopping index (Σ%) for each heat is created by accumulating the 1-second slopping value over the complete blow. An average slopping value for each individual blowing minute (no’s 1-20) is also calculated and stored “indefinitely”.
CCTV
frame analysisvariable calc.→ database
camera picture frame
designated sloppingregistration area
sparks & molten material
Figure 2. Schematic description of the slopping registration system set-up and its function.
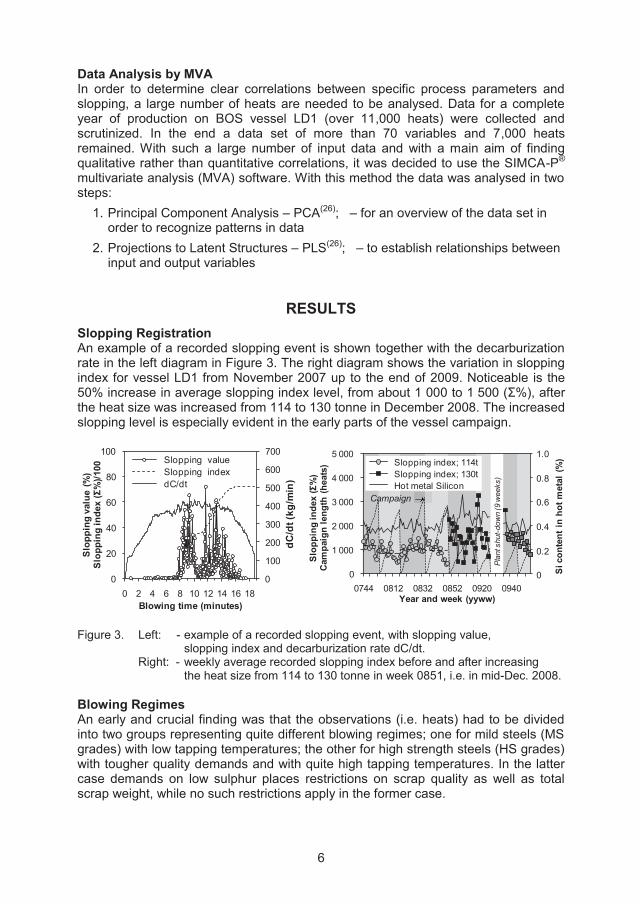
6
Data Analysis by MVA In order to determine clear correlations between specific process parameters and slopping, a large number of heats are needed to be analysed. Data for a complete year of production on BOS vessel LD1 (over 11,000 heats) were collected and scrutinized. In the end a data set of more than 70 variables and 7,000 heats remained. With such a large number of input data and with a main aim of finding qualitative rather than quantitative correlations, it was decided to use the SIMCA-P® multivariate analysis (MVA) software. With this method the data was analysed in two steps:
1. Principal Component Analysis – PCA(26); – for an overview of the data set in order to recognize patterns in data
2. Projections to Latent Structures – PLS(26); – to establish relationships between input and output variables
RESULTS Slopping Registration An example of a recorded slopping event is shown together with the decarburization rate in the left diagram in Figure 3. The right diagram shows the variation in slopping index for vessel LD1 from November 2007 up to the end of 2009. Noticeable is the 50% increase in average slopping index level, from about 1 000 to 1 500 (Σ%), after the heat size was increased from 114 to 130 tonne in December 2008. The increased slopping level is especially evident in the early parts of the vessel campaign.
0
100
200
300
400
500
600
700
0
20
40
60
80
100
0 2 4 6 8 10 12 14 16 18
dC/d
t (kg
/min
)
Slop
ping
val
ue (
%)
Slo
ppin
g in
dex
(Σ%
)/100
Blowing time (minutes)
Slopping valueSlopping indexdC/dt
Plan
t shu
t-dow
n (9
wee
ks)
Campaign
0,0
0,2
0,4
0,6
0,8
1,0
0
1 000
2 000
3 000
4 000
5 000
0744 0812 0832 0852 0920 0940
Si c
onte
nt in
hot
met
al (%
)
Slop
ping
inde
x (Σ
%)
Cam
paig
n le
ngth
(hea
ts)
Year and week (yyww)
Slopping index; 114tSlopping index; 130tHot metal Silicon
1.0
0.8
0.6
0.4
0.2
0
Figure 3. Left: - example of a recorded slopping event, with slopping value,
slopping index and decarburization rate dC/dt. Right: - weekly average recorded slopping index before and after increasing the heat size from 114 to 130 tonne in week 0851, i.e. in mid-Dec. 2008.
Blowing Regimes An early and crucial finding was that the observations (i.e. heats) had to be divided into two groups representing quite different blowing regimes; one for mild steels (MS grades) with low tapping temperatures; the other for high strength steels (HS grades) with tougher quality demands and with quite high tapping temperatures. In the latter case demands on low sulphur places restrictions on scrap quality as well as total scrap weight, while no such restrictions apply in the former case.
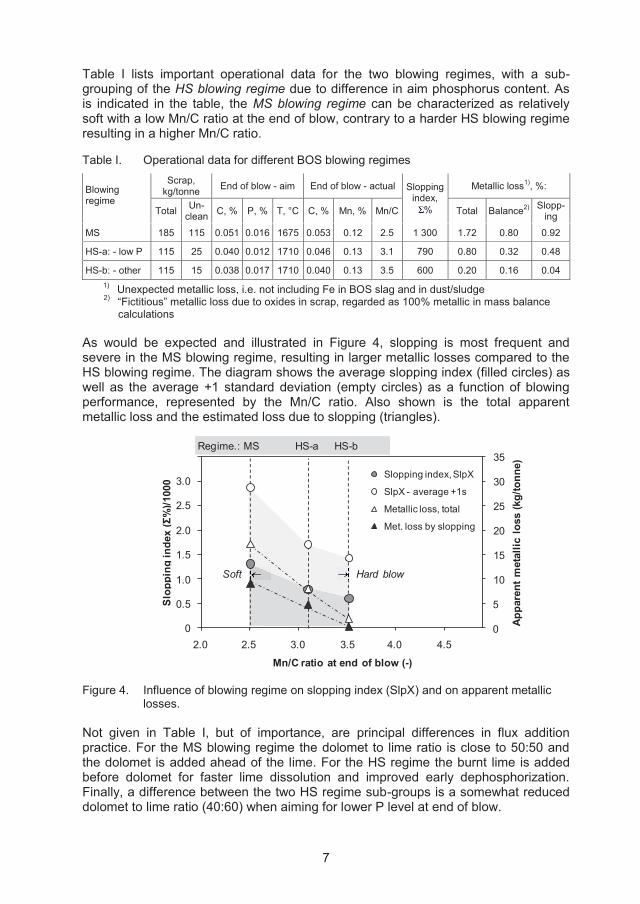
7
Table I lists important operational data for the two blowing regimes, with a sub-grouping of the HS blowing regime due to difference in aim phosphorus content. As is indicated in the table, the MS blowing regime can be characterized as relatively soft with a low Mn/C ratio at the end of blow, contrary to a harder HS blowing regime resulting in a higher Mn/C ratio. Table I. Operational data for different BOS blowing regimes
Blowing regime
Scrap, kg/tonne End of blow - aim End of blow - actual Slopping
index, %
Metallic loss1), %:
Total Un-clean C, % P, % T, °C C, % Mn, % Mn/C Total Balance2) Slopp-
ing
MS 185 115 0.051 0.016 1675 0.053 0.12 2.5 1 300 1.72 0.80 0.92
HS-a: - low P 115 25 0.040 0.012 1710 0.046 0.13 3.1 790 0.80 0.32 0.48
HS-b: - other 115 15 0.038 0.017 1710 0.040 0.13 3.5 600 0.20 0.16 0.04
1) Unexpected metallic loss, i.e. not including Fe in BOS slag and in dust/sludge 2) “Fictitious” metallic loss due to oxides in scrap, regarded as 100% metallic in mass balance calculations As would be expected and illustrated in Figure 4, slopping is most frequent and severe in the MS blowing regime, resulting in larger metallic losses compared to the HS blowing regime. The diagram shows the average slopping index (filled circles) as well as the average +1 standard deviation (empty circles) as a function of blowing performance, represented by the Mn/C ratio. Also shown is the total apparent metallic loss and the estimated loss due to slopping (triangles).
Soft Hard blow
0
5
10
15
20
25
30
35
0
500
1 000
1 500
2 000
2 500
3 000
3 500
2,0 2,5 3,0 3,5 4,0 4,5
App
aren
t m
etal
lic lo
ss (k
g/to
nne)
Slo
ppin
g in
dex
(Σ%
)/100
0
Mn/C ratio at end of blow (-)
Slopping index, SlpX
SlpX - average +1s
Metallic loss, total
Met. loss by slopping
Regime.: MS HS-a HS-b
2.0 2.5 3.0 3.5 4.0 4.5
3.0
2.5
2.0
1.5
1.0
0.5
0
Figure 4. Influence of blowing regime on slopping index (SlpX) and on apparent metallic
losses. Not given in Table I, but of importance, are principal differences in flux addition practice. For the MS blowing regime the dolomet to lime ratio is close to 50:50 and the dolomet is added ahead of the lime. For the HS regime the burnt lime is added before dolomet for faster lime dissolution and improved early dephosphorization. Finally, a difference between the two HS regime sub-groups is a somewhat reduced dolomet to lime ratio (40:60) when aiming for lower P level at end of blow.
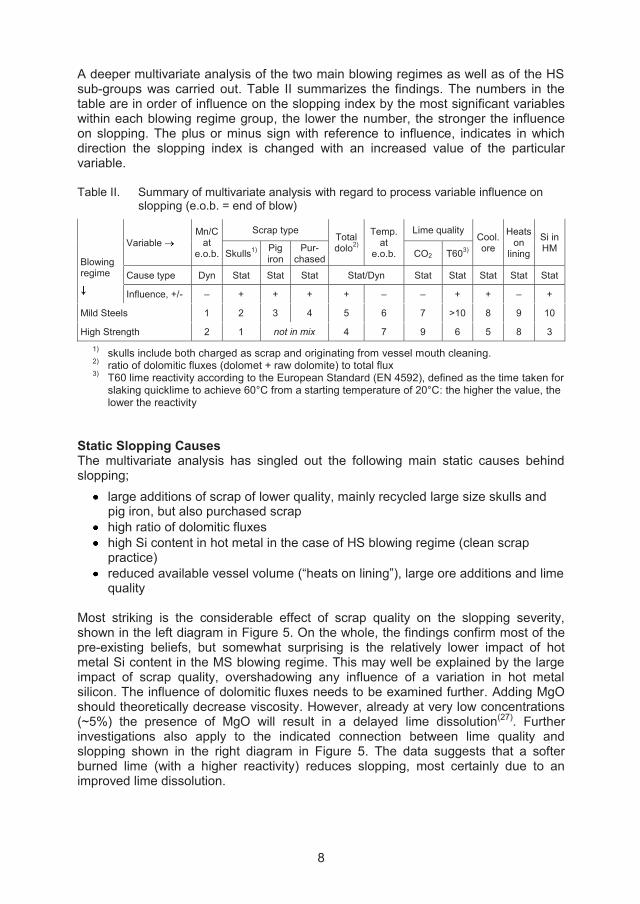
8
A deeper multivariate analysis of the two main blowing regimes as well as of the HS sub-groups was carried out. Table II summarizes the findings. The numbers in the table are in order of influence on the slopping index by the most significant variables within each blowing regime group, the lower the number, the stronger the influence on slopping. The plus or minus sign with reference to influence, indicates in which direction the slopping index is changed with an increased value of the particular variable. Table II. Summary of multivariate analysis with regard to process variable influence on
slopping (e.o.b. = end of blow)
Blowing regime
Variable Mn/C
at e.o.b.
Scrap type Total dolo2)
Temp. at
e.o.b.
Lime quality Cool. ore
Heats on
lining
Si in HM Skulls1) Pig
iron Pur-
chased CO2 T603)
Cause type Dyn Stat Stat Stat Stat/Dyn Stat Stat Stat Stat Stat
Influence, +/- – + + + + – – + + – +
Mild Steels 1 2 3 4 5 6 7 >10 8 9 10
High Strength 2 1 not in mix 4 7 9 6 5 8 3
1) skulls include both charged as scrap and originating from vessel mouth cleaning. 2) ratio of dolomitic fluxes (dolomet + raw dolomite) to total flux 3) T60 lime reactivity according to the European Standard (EN 4592), defined as the time taken for
slaking quicklime to achieve 60°C from a starting temperature of 20°C: the higher the value, the lower the reactivity
Static Slopping Causes The multivariate analysis has singled out the following main static causes behind slopping;
large additions of scrap of lower quality, mainly recycled large size skulls and pig iron, but also purchased scrap
high ratio of dolomitic fluxes high Si content in hot metal in the case of HS blowing regime (clean scrap
practice) reduced available vessel volume (“heats on lining”), large ore additions and lime
quality Most striking is the considerable effect of scrap quality on the slopping severity, shown in the left diagram in Figure 5. On the whole, the findings confirm most of the pre-existing beliefs, but somewhat surprising is the relatively lower impact of hot metal Si content in the MS blowing regime. This may well be explained by the large impact of scrap quality, overshadowing any influence of a variation in hot metal silicon. The influence of dolomitic fluxes needs to be examined further. Adding MgO should theoretically decrease viscosity. However, already at very low concentrations (~5%) the presence of MgO will result in a delayed lime dissolution(27). Further investigations also apply to the indicated connection between lime quality and slopping shown in the right diagram in Figure 5. The data suggests that a softer burned lime (with a higher reactivity) reduces slopping, most certainly due to an improved lime dissolution.
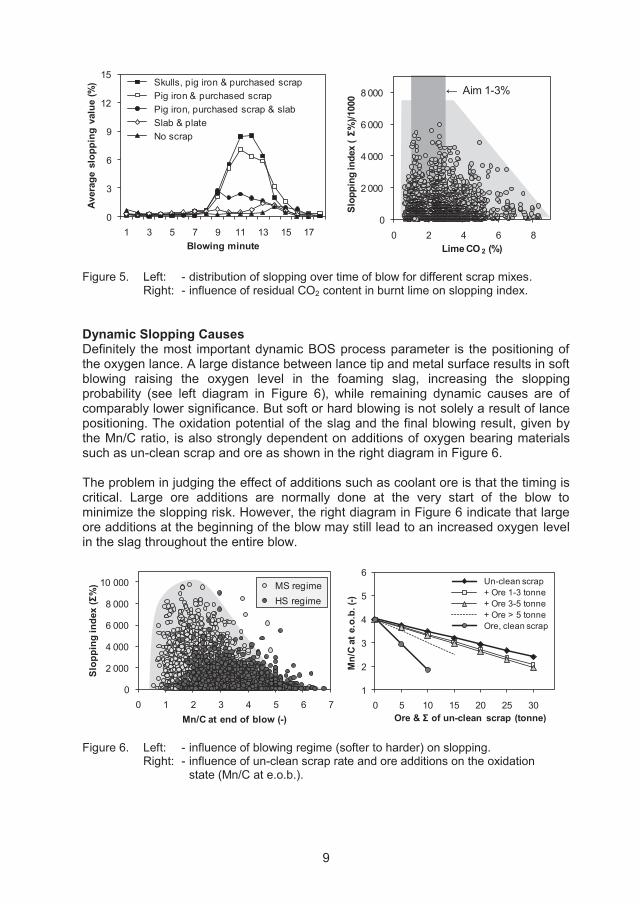
9
0
3
6
9
12
15
1 3 5 7 9 11 13 15 17
Aver
age
slop
ping
val
ue (%
)
Blowing minute
Skulls, pig iron & purchased scrapPig iron & purchased scrapPig iron, purchased scrap & slabSlab & plateNo scrap
← Aim 1-3%
0
2 000
4 000
6 000
8 000
0 2 4 6 8
Slop
ping
inde
x (Σ%
)/100
0
Lime CO 2 (%) Figure 5. Left: - distribution of slopping over time of blow for different scrap mixes.
Right: - influence of residual CO2 content in burnt lime on slopping index.
Dynamic Slopping Causes Definitely the most important dynamic BOS process parameter is the positioning of the oxygen lance. A large distance between lance tip and metal surface results in soft blowing raising the oxygen level in the foaming slag, increasing the slopping probability (see left diagram in Figure 6), while remaining dynamic causes are of comparably lower significance. But soft or hard blowing is not solely a result of lance positioning. The oxidation potential of the slag and the final blowing result, given by the Mn/C ratio, is also strongly dependent on additions of oxygen bearing materials such as un-clean scrap and ore as shown in the right diagram in Figure 6. The problem in judging the effect of additions such as coolant ore is that the timing is critical. Large ore additions are normally done at the very start of the blow to minimize the slopping risk. However, the right diagram in Figure 6 indicate that large ore additions at the beginning of the blow may still lead to an increased oxygen level in the slag throughout the entire blow.
0
2 000
4 000
6 000
8 000
10 000
0 1 2 3 4 5 6 7
Slop
ping
inde
x (Σ
%)
Mn/C at end of blow (-)
MS regimeHS regime
1
2
3
4
5
6
0 5 10 15 20 25 30
Mn/
C at
e.o
.b. (
-)
Ore & Σ of un-clean scrap (tonne)
Un-clean scrap+ Ore 1-3 tonne+ Ore 3-5 tonne+ Ore > 5 tonneOre, clean scrap
Figure 6. Left: - influence of blowing regime (softer to harder) on slopping.
Right: - influence of un-clean scrap rate and ore additions on the oxidation state (Mn/C at e.o.b.).
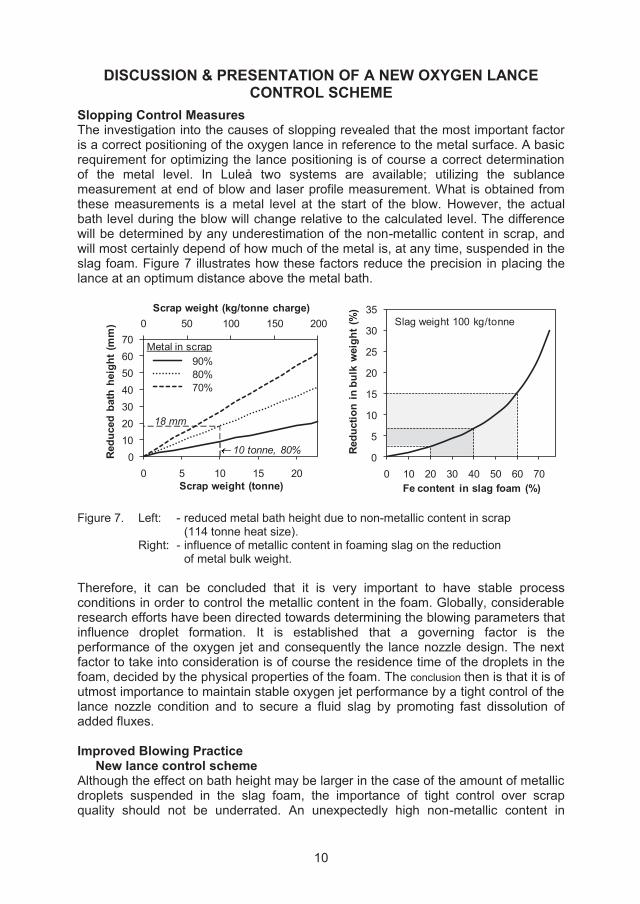
10
DISCUSSION & PRESENTATION OF A NEW OXYGEN LANCE CONTROL SCHEME
Slopping Control Measures The investigation into the causes of slopping revealed that the most important factor is a correct positioning of the oxygen lance in reference to the metal surface. A basic requirement for optimizing the lance positioning is of course a correct determination of the metal level. In Luleå two systems are available; utilizing the sublance measurement at end of blow and laser profile measurement. What is obtained from these measurements is a metal level at the start of the blow. However, the actual bath level during the blow will change relative to the calculated level. The difference will be determined by any underestimation of the non-metallic content in scrap, and will most certainly depend of how much of the metal is, at any time, suspended in the slag foam. Figure 7 illustrates how these factors reduce the precision in placing the lance at an optimum distance above the metal bath.
0 50 100 150 200
010203040506070
0 5 10 15 20
Scrap weight (kg/tonne charge)
Redu
ced
bath
hei
ght (
mm
)
Scrap weight (tonne)
90%80%70%
Metal in scrap
10 tonne, 80%
18 mm
0
5
10
15
20
25
30
35
0 10 20 30 40 50 60 70
Redu
ctio
n in
bul
k w
eigh
t (%
)
Fe content in slag foam (%)
Slag weight 100 kg/tonne
Figure 7. Left: - reduced metal bath height due to non-metallic content in scrap
(114 tonne heat size). Right: - influence of metallic content in foaming slag on the reduction of metal bulk weight.
Therefore, it can be concluded that it is very important to have stable process conditions in order to control the metallic content in the foam. Globally, considerable research efforts have been directed towards determining the blowing parameters that influence droplet formation. It is established that a governing factor is the performance of the oxygen jet and consequently the lance nozzle design. The next factor to take into consideration is of course the residence time of the droplets in the foam, decided by the physical properties of the foam. The conclusion then is that it is of utmost importance to maintain stable oxygen jet performance by a tight control of the lance nozzle condition and to secure a fluid slag by promoting fast dissolution of added fluxes. Improved Blowing Practice New lance control scheme Although the effect on bath height may be larger in the case of the amount of metallic droplets suspended in the slag foam, the importance of tight control over scrap quality should not be underrated. An unexpectedly high non-metallic content in
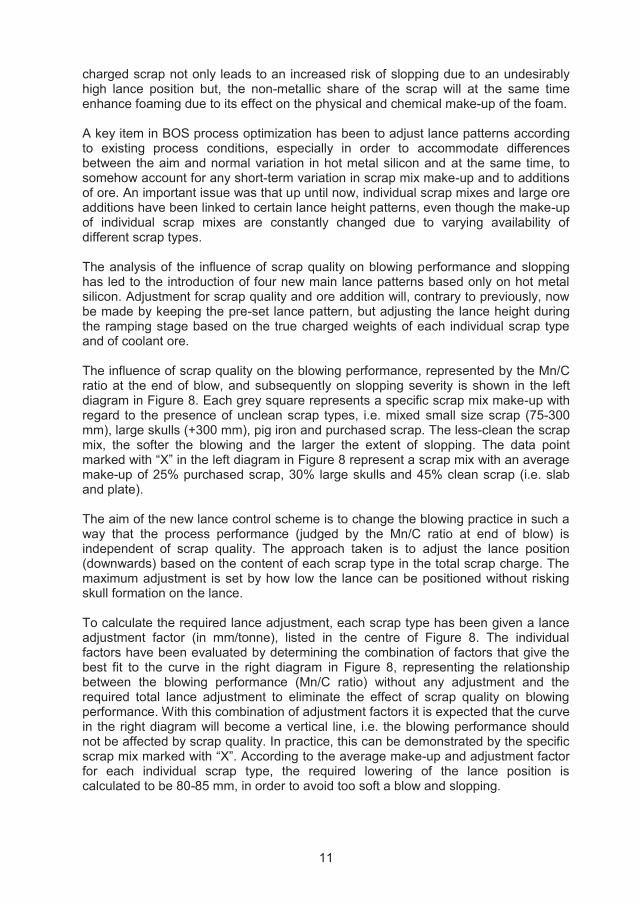
11
charged scrap not only leads to an increased risk of slopping due to an undesirably high lance position but, the non-metallic share of the scrap will at the same time enhance foaming due to its effect on the physical and chemical make-up of the foam. A key item in BOS process optimization has been to adjust lance patterns according to existing process conditions, especially in order to accommodate differences between the aim and normal variation in hot metal silicon and at the same time, to somehow account for any short-term variation in scrap mix make-up and to additions of ore. An important issue was that up until now, individual scrap mixes and large ore additions have been linked to certain lance height patterns, even though the make-up of individual scrap mixes are constantly changed due to varying availability of different scrap types. The analysis of the influence of scrap quality on blowing performance and slopping has led to the introduction of four new main lance patterns based only on hot metal silicon. Adjustment for scrap quality and ore addition will, contrary to previously, now be made by keeping the pre-set lance pattern, but adjusting the lance height during the ramping stage based on the true charged weights of each individual scrap type and of coolant ore. The influence of scrap quality on the blowing performance, represented by the Mn/C ratio at the end of blow, and subsequently on slopping severity is shown in the left diagram in Figure 8. Each grey square represents a specific scrap mix make-up with regard to the presence of unclean scrap types, i.e. mixed small size scrap (75-300 mm), large skulls (+300 mm), pig iron and purchased scrap. The less-clean the scrap mix, the softer the blowing and the larger the extent of slopping. The data point marked with “X” in the left diagram in Figure 8 represent a scrap mix with an average make-up of 25% purchased scrap, 30% large skulls and 45% clean scrap (i.e. slab and plate). The aim of the new lance control scheme is to change the blowing practice in such a way that the process performance (judged by the Mn/C ratio at end of blow) is independent of scrap quality. The approach taken is to adjust the lance position (downwards) based on the content of each scrap type in the total scrap charge. The maximum adjustment is set by how low the lance can be positioned without risking skull formation on the lance. To calculate the required lance adjustment, each scrap type has been given a lance adjustment factor (in mm/tonne), listed in the centre of Figure 8. The individual factors have been evaluated by determining the combination of factors that give the best fit to the curve in the right diagram in Figure 8, representing the relationship between the blowing performance (Mn/C ratio) without any adjustment and the required total lance adjustment to eliminate the effect of scrap quality on blowing performance. With this combination of adjustment factors it is expected that the curve in the right diagram will become a vertical line, i.e. the blowing performance should not be affected by scrap quality. In practice, this can be demonstrated by the specific scrap mix marked with “X”. According to the average make-up and adjustment factor for each individual scrap type, the required lowering of the lance position is calculated to be 80-85 mm, in order to avoid too soft a blow and slopping.
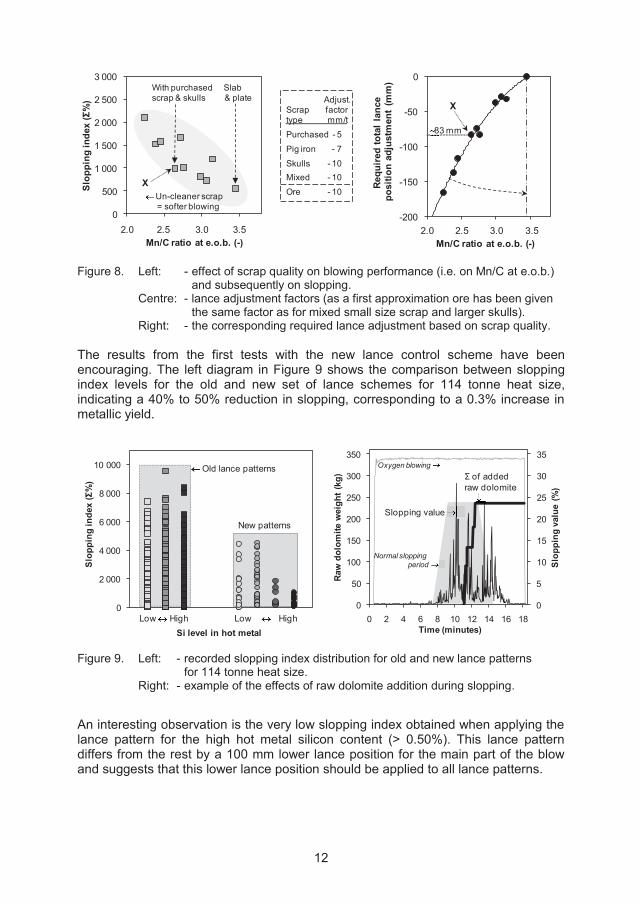
12
0
500
1 000
1 500
2 000
2 500
3 000
2,0 2,5 3,0 3,5
Slop
ping
inde
x (Σ
%)
Mn/C ratio at e.o.b. (-)2.0 2.5 3.0 3.5
With purchased Slab scrap & skulls & plate
XUn-cleaner scrap= softer blowing
Adjust.Scrap factortype mm/t
Purchased - 5
Pig iron - 7
Skulls - 10Mixed - 10
Ore - 10
-200
-150
-100
-50
0
2,0 2,5 3,0 3,5
Requ
ired
tota
l lan
cepo
sitio
n ad
just
men
t (m
m)
Mn/C ratio at e.o.b. (-)
X
2.0 2.5 3.0 3.5
83 mm
Figure 8. Left: - effect of scrap quality on blowing performance (i.e. on Mn/C at e.o.b.)
and subsequently on slopping. Centre: - lance adjustment factors (as a first approximation ore has been given the same factor as for mixed small size scrap and larger skulls). Right: - the corresponding required lance adjustment based on scrap quality.
The results from the first tests with the new lance control scheme have been encouraging. The left diagram in Figure 9 shows the comparison between slopping index levels for the old and new set of lance schemes for 114 tonne heat size, indicating a 40% to 50% reduction in slopping, corresponding to a 0.3% increase in metallic yield.
0
2 000
4 000
6 000
8 000
10 000
Slop
ping
inde
x (Σ
%)
Low High Low HighSi level in hot metal
Old lance patterns
New patterns
0
5
10
15
20
25
30
35
0
50
100
150
200
250
300
350
0 2 4 6 8 10 12 14 16 18
Slop
ping
val
ue (%
)
Raw
dol
omite
wei
ght (
kg)
Time (minutes)
Normal sloppingperiod
Oxygen blowing
Slopping value
Σ of addedraw dolomite
Figure 9. Left: - recorded slopping index distribution for old and new lance patterns for 114 tonne heat size. Right: - example of the effects of raw dolomite addition during slopping.
An interesting observation is the very low slopping index obtained when applying the lance pattern for the high hot metal silicon content (> 0.50%). This lance pattern differs from the rest by a 100 mm lower lance position for the main part of the blow and suggests that this lower lance position should be applied to all lance patterns.
13
Dynamic control measures Presently no standardized dynamic control measures are taken in case of slopping. However, in an effort to reduce the severity of slopping, operators have adopted the method of charging raw dolomite during or just prior to an expected slopping event. The idea is to create some kind of a “funnel effect”, releasing process gas trapped in the foam, but the effect is quite random. Sometimes slopping is suppressed, but just as frequently, slopping is enhanced. This is shown in the right diagram in Figure 9. Slopping begins at 8 minutes and becomes quite heavy at 10 minutes. Consequently the operator orders an addition of raw dolomite. In this case, slopping subsides during the weighing procedure and is at a minimum just as the raw dolomite is charged into the vessel. It may be coincidence, but the addition is accompanied by a return to slopping, which then continues past the normal slopping end-point. Hence, even if an addition of raw dolomite gives an initial reduction in slopping, the positive effects may be short-lived. The risk is that adding raw dolomite increases the amount of undissolved second phase particles in the foam, enhancing the foaming process and which may be even further enhanced by the extra CO2 released when the raw dolomite is burned. In addition, charging fluxes will lower the temperature and hence decrease the fluidity of the foam and increasing the foam height. Referring to the phase diagram in Figure 1, addition of raw dolomite may be the correct measure if slopping is caused by an over-oxidized slag, but will encourage slopping if the slag is under-oxidized. Foam level estimation and control As stated above, no dynamic control measures have been introduced, but such measures will be developed when the vessel vibration foam level estimation system is up and running. The theory behind a correlation between BOS vessel vibration and foam level is identical to that for lance vibration for foam level control presented in the early-1980s by Y. Iida et al.(18); – the transfer of kinetic energy from the slag foam to a mechanical structure for which the vibration is measured and where the amount of transferred energy is proportional to the contact area and hence the foam height. This, mainly horizontal transfer of energy to the wall of the steelmaking vessel, results in the excitation of a vibration spectrum propagating through the structure. Preliminary tests began in 2006 and were followed by a main trial series in 2008, where vibration measurements were made for some 200 heats. The vibration curves that were obtained display the same type of patterns as those experienced in the early-1980s. Figure 10 shows typical vibration patterns for slopping and non-slopping heats, illustrating the connection between vessel vibration level and foam height in the BOS vessel. The results are quite encouraging and therefore, it has been decided to install a permanent system at Luleå’s BOS vessel LD2, making it possible to develop a slopping prediction system based on vessel vibration measurement.
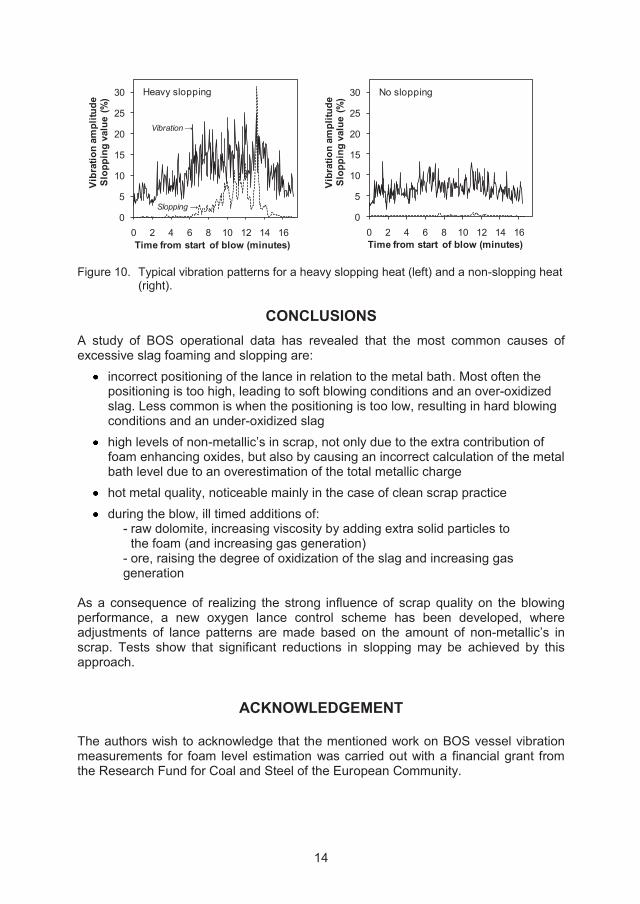
14
0
5
10
15
20
25
30
0 2 4 6 8 10 12 14 16
Vibr
atio
n am
plitu
deSl
oppi
ng v
alue
(%
)
Time from start of blow (minutes)
Heavy slopping
Vibration →
Slopping →0
5
10
15
20
25
30
0 2 4 6 8 10 12 14 16
Vibr
atio
n am
plitu
deSl
oppi
ng v
alue
(%
)
Time from start of blow (minutes)
No slopping
Figure 10. Typical vibration patterns for a heavy slopping heat (left) and a non-slopping heat
(right).
CONCLUSIONS A study of BOS operational data has revealed that the most common causes of excessive slag foaming and slopping are:
incorrect positioning of the lance in relation to the metal bath. Most often the positioning is too high, leading to soft blowing conditions and an over-oxidized slag. Less common is when the positioning is too low, resulting in hard blowing conditions and an under-oxidized slag
high levels of non-metallic’s in scrap, not only due to the extra contribution of foam enhancing oxides, but also by causing an incorrect calculation of the metal bath level due to an overestimation of the total metallic charge
hot metal quality, noticeable mainly in the case of clean scrap practice during the blow, ill timed additions of:
- raw dolomite, increasing viscosity by adding extra solid particles to the foam (and increasing gas generation) - ore, raising the degree of oxidization of the slag and increasing gas generation
As a consequence of realizing the strong influence of scrap quality on the blowing performance, a new oxygen lance control scheme has been developed, where adjustments of lance patterns are made based on the amount of non-metallic’s in scrap. Tests show that significant reductions in slopping may be achieved by this approach.
ACKNOWLEDGEMENT
The authors wish to acknowledge that the mentioned work on BOS vessel vibration measurements for foam level estimation was carried out with a financial grant from the Research Fund for Coal and Steel of the European Community.
15
REFERENCES
1. S-M. Jung and R.J. Fruehan, “Foaming Characteristics of BOS Slags”, ISIJ Int., Vol. 40 (2000), No. 4, pp. 348-355.
2. P. Misra, B. Deo and R.P. Chhabra, “Dynamic Model of Slag Foaming in Oxygen Steelmaking Converters”, ISIJ Int., Vol. 38 (1998), No. 11, pp. 1225-1232.
3. A.K. Lahiri and S. Pal, “Foaminess of Slag: Cause and Control”, 7th Int. Conf. on Molten Slags Fluxes and Salts, Cap Town, South Africa, January 2004.
4. D. Lotun and L. Pilon, “Physical Modeling of Slag Foaming for Various Operating Conditions and Slag Compositions”, ISIJ Int., Vol. 45 (2005), No. 6, pp. 835-840).
5. A.K. Lahiri and S. Seetharaman, “Foaming Behavior of Slags”, Metallurgical and Materials Trans. B, Vol. 33B, June 2002, pp. 449-502.
6. J.J. Bikerman, “Foams and Emulsions”, Industrial and Engineering Chemistry, Vol. 57, No. 1, January 1965, pp. 56-62.
7. H.C. Brinkman, “The Viscosity of Concentrated Suspensions and Solutions”, Journal of Chemical Physics., Vol. 20, No. 4, April 1952, p. 571.
8. J. Happel, “Viscosity of Suspensions of Uniform Spheres”, Journal of Applied Physics, Vol. 28, No. 11, November 1957, pp. 1288-1292.
9. M. Shakirov, A. Boutchenkov, G. Galperine and B. Schrader, “Prediction and Prevention of Slopping”, Iron & Steel Technology, January 2004, pp. 38-44.
10. J.E. Lait, K.W. Heyer and G.K. Cuthill, ”BOF Control Using Waste Gas Temperature”, The Role of Slag in Basic Oxygen Steelmaking Processes, McMaster, Hamilton, Canada, May 1976, paper 8.
11. B.O. Chukwulebe, S.R. Balajee, K.J. Robertson, J.G. Grattan and M.J. Green, “Computer Optimization of Oxygen Blowing Practicies to Control BOF Slopping”, AISTech2004, Nashville, TN, USA, September 2004, Vol. 1, pp. 751-762.
12. H. Iso, K. Arima, M. Kanemoto, Y. Ueda and H.Yamane, ”Prediction and Suppression of Slopping in the Converter”, Trans. ISIJ, Vol. 28, 1988, pp. 382-391.
13. M. Oda, M. Yoshino, Y. Muraki and T. Hasegawa, “Development of the Slopping Predictive and Suppressing System in LD Converter”, 6th Int. Iron and Steel Congress, ISIJ, Nagoya, Japan, 1990, pp. 109-114.
14. T. Kanai, A. Sakai, J. Tani, S. Yoshida and N. Matsui, ”Development of a Slopping Prediction Control System in BOF Operation“, 2nd EOSC, Milan, Italy, October 1997, pp. 267-275.
15. J.W.K. van Boggelen, “Use of Dynamic Data to Optimise Vessel Refining”, 5th EOSC, Aachen, Germany, June 2006, pp. 108-114 (on CD-ROM).
16. C. Bencini and A. Poli, “Automation for Refining and Slag Control in LD Process at AFP/Piombino Steel Shop”, 76th Steelmaking Conference, Dallas, TX, USA, March 1993, pp. 193-198.
17. J. Ruuska, S. Ollila, L. Bååth and K. Leiviskä, “Possibilities to Use New Measurements to Control LD-KG-converter”, 5th EOSC, Aachen, Germany, June 2006, pp. 210-217 (on CD-ROM).

16
18. Y. Iida, K. Emoto, M. Ogawa, Y. Masuda, M. Onishi and H. Yamada, ”Fully Automatic Blowing Technique for Basic Oxygen Steelmaking Furnace”, Trans. ISIJ, Vol. 24 (1984), pp. 540-546.
19. M. S. Millman, L. Bååth, D. Malmberg and E. Price, “Radio Wave Interferometry for BOS Slag Control”, 2nd Int. Congress on the Science and Technology of Steelmaking, Vol. 1, Swansea, UK, April 2001, pp. 309-320.
20. T. Saito, I. Tsubone, M. Azuma, H. Yamana and H. Takezoe, “Development of Automatic Blowing Control System in Combined Blowing Converter”, Tetso-to-Hagané (JISJ), Vol. 76, No. 11, 1990, pp. 1978-1985.
21. D. Malmberg, P. Hahlin and E. Nilsson, “Microwave Technology in Steel and Metal Industry, an Overview”, ISIJ Int., Vol. 47, No. 4, 2007, pp. 553-538.
22. R. Bruckhaus, V. Fiedler and H. Lachmund, “Improvement of the BOF Process by Use of a Radar Measurement at the Dillinger Hütte Steelplant”, Reue de Métallurgi, June 2001, pp. 553-559.
23. T. Takawa, K. Katayama, K. Katohgi and T. Kuribayashi, “Analysis of Converter Process Variables from Exhaust Gas”, Trans. ISIJ, Vol. 28, 1988, pp. 59-67.
24. P. G. Garnica, R. D. Morales and N. U. Rodríguez, “Slag Control of BOF Combined Blowing Process by Mathematical Modelling”, Metallurgical Processes for Early Twenty-First Century, San Diego, CA, USA, September 1994, pp. 631-642.
25. C. Kattenbelt, E. Spelbos, P. Mink and B. Roffel, “Detection of Slopping in Basic Oxygen Steelmaking using a Camera Viewing the Converter Mouth”, Steel Research Int., Vol. 79, No. 11,, 2008, pp. 821-825.
26. L. Eriksson, E. Johansson, N. Kettaneh-Wold and S. Wold, “Multi- and Megavariate Data Analysis – Principals and Applications”, Umetrics AB, Umeå, Sweden, ISBN- 91-973730-1-X.
27. B. Deo and R. Boom, “Fundamentals of Steelmaking Metallurgy”, Prentice Hall International (UK) Limited, London, UK, 1993, ISBN 0-13-345380-4, pp. 161-188.

Appendix II
BOS Vessel Vibration Measurement for Foam Level Detection
M. Brämming, S. Millman, A. Overbosch, A. Kapilashrami, D. Malmberg and B. Björkman
Accepted for publication in ISIJ International, Vol.51 (2011), No.1, January 2011

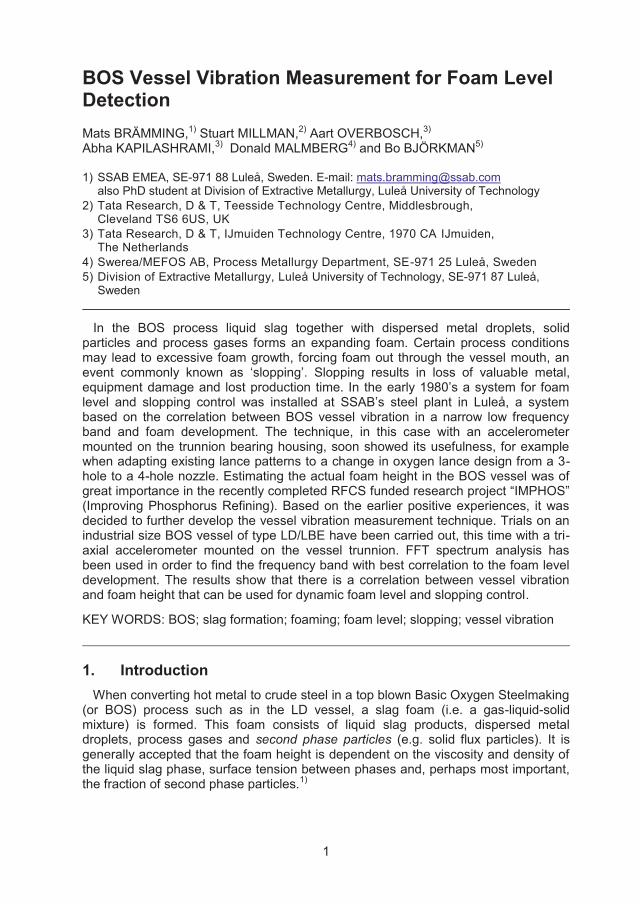
1
BOS Vessel Vibration Measurement for Foam Level Detection Mats BRÄMMING,1) Stuart MILLMAN,2) Aart OVERBOSCH,3) Abha KAPILASHRAMI,3) Donald MALMBERG4) and Bo BJÖRKMAN5) 1) SSAB EMEA, SE-971 88 Luleå, Sweden. E-mail: [email protected]
also PhD student at Division of Extractive Metallurgy, Luleå University of Technology 2) Tata Research, D & T, Teesside Technology Centre, Middlesbrough,
Cleveland TS6 6US, UK 3) Tata Research, D & T, IJmuiden Technology Centre, 1970 CA IJmuiden,
The Netherlands 4) Swerea/MEFOS AB, Process Metallurgy Department, SE-971 25 Luleå, Sweden 5) Division of Extractive Metallurgy, Luleå University of Technology, SE-971 87 Luleå,
Sweden In the BOS process liquid slag together with dispersed metal droplets, solid particles and process gases forms an expanding foam. Certain process conditions may lead to excessive foam growth, forcing foam out through the vessel mouth, an event commonly known as ‘slopping’. Slopping results in loss of valuable metal, equipment damage and lost production time. In the early 1980’s a system for foam level and slopping control was installed at SSAB’s steel plant in Luleå, a system based on the correlation between BOS vessel vibration in a narrow low frequency band and foam development. The technique, in this case with an accelerometer mounted on the trunnion bearing housing, soon showed its usefulness, for example when adapting existing lance patterns to a change in oxygen lance design from a 3-hole to a 4-hole nozzle. Estimating the actual foam height in the BOS vessel was of great importance in the recently completed RFCS funded research project “IMPHOS” (Improving Phosphorus Refining). Based on the earlier positive experiences, it was decided to further develop the vessel vibration measurement technique. Trials on an industrial size BOS vessel of type LD/LBE have been carried out, this time with a tri-axial accelerometer mounted on the vessel trunnion. FFT spectrum analysis has been used in order to find the frequency band with best correlation to the foam level development. The results show that there is a correlation between vessel vibration and foam height that can be used for dynamic foam level and slopping control. KEY WORDS: BOS; slag formation; foaming; foam level; slopping; vessel vibration 1. Introduction When converting hot metal to crude steel in a top blown Basic Oxygen Steelmaking (or BOS) process such as in the LD vessel, a slag foam (i.e. a gas-liquid-solid mixture) is formed. This foam consists of liquid slag products, dispersed metal droplets, process gases and second phase particles (e.g. solid flux particles). It is generally accepted that the foam height is dependent on the viscosity and density of the liquid slag phase, surface tension between phases and, perhaps most important, the fraction of second phase particles.1)
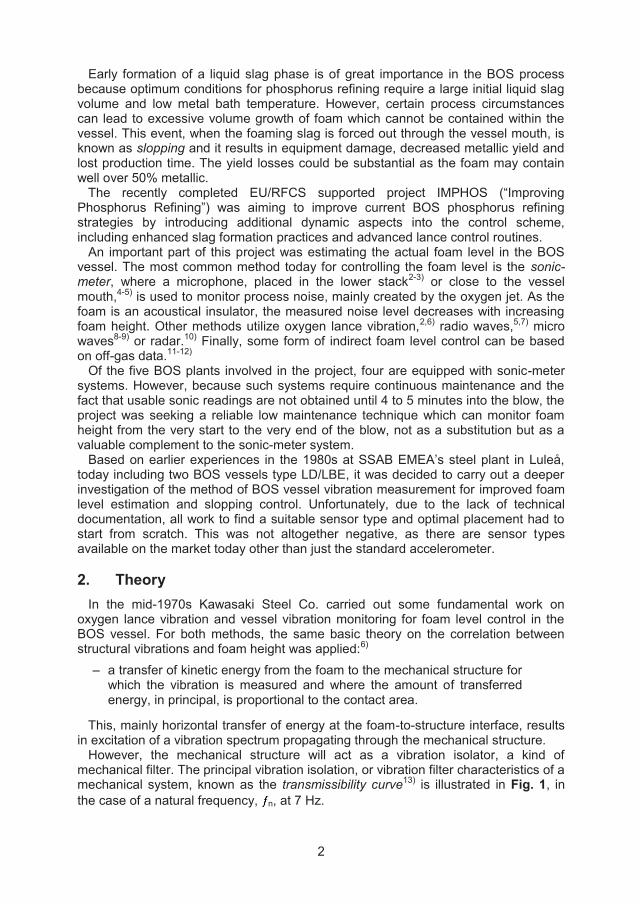
2
Early formation of a liquid slag phase is of great importance in the BOS process because optimum conditions for phosphorus refining require a large initial liquid slag volume and low metal bath temperature. However, certain process circumstances can lead to excessive volume growth of foam which cannot be contained within the vessel. This event, when the foaming slag is forced out through the vessel mouth, is known as slopping and it results in equipment damage, decreased metallic yield and lost production time. The yield losses could be substantial as the foam may contain well over 50% metallic. The recently completed EU/RFCS supported project IMPHOS (“Improving Phosphorus Refining”) was aiming to improve current BOS phosphorus refining strategies by introducing additional dynamic aspects into the control scheme, including enhanced slag formation practices and advanced lance control routines. An important part of this project was estimating the actual foam level in the BOS vessel. The most common method today for controlling the foam level is the sonic-meter, where a microphone, placed in the lower stack2-3) or close to the vessel mouth,4-5) is used to monitor process noise, mainly created by the oxygen jet. As the foam is an acoustical insulator, the measured noise level decreases with increasing foam height. Other methods utilize oxygen lance vibration,2,6) radio waves,5,7) micro waves8-9) or radar.10) Finally, some form of indirect foam level control can be based on off-gas data.11-12) Of the five BOS plants involved in the project, four are equipped with sonic-meter systems. However, because such systems require continuous maintenance and the fact that usable sonic readings are not obtained until 4 to 5 minutes into the blow, the project was seeking a reliable low maintenance technique which can monitor foam height from the very start to the very end of the blow, not as a substitution but as a valuable complement to the sonic-meter system. Based on earlier experiences in the 1980s at SSAB EMEA’s steel plant in Luleå, today including two BOS vessels type LD/LBE, it was decided to carry out a deeper investigation of the method of BOS vessel vibration measurement for improved foam level estimation and slopping control. Unfortunately, due to the lack of technical documentation, all work to find a suitable sensor type and optimal placement had to start from scratch. This was not altogether negative, as there are sensor types available on the market today other than just the standard accelerometer. 2. Theory In the mid-1970s Kawasaki Steel Co. carried out some fundamental work on oxygen lance vibration and vessel vibration monitoring for foam level control in the BOS vessel. For both methods, the same basic theory on the correlation between structural vibrations and foam height was applied:6)
– a transfer of kinetic energy from the foam to the mechanical structure for which the vibration is measured and where the amount of transferred energy, in principal, is proportional to the contact area.
This, mainly horizontal transfer of energy at the foam-to-structure interface, results in excitation of a vibration spectrum propagating through the mechanical structure. However, the mechanical structure will act as a vibration isolator, a kind of mechanical filter. The principal vibration isolation, or vibration filter characteristics of a mechanical system, known as the transmissibility curve13) is illustrated in Fig. 1, in the case of a natural frequency, n, at 7 Hz.
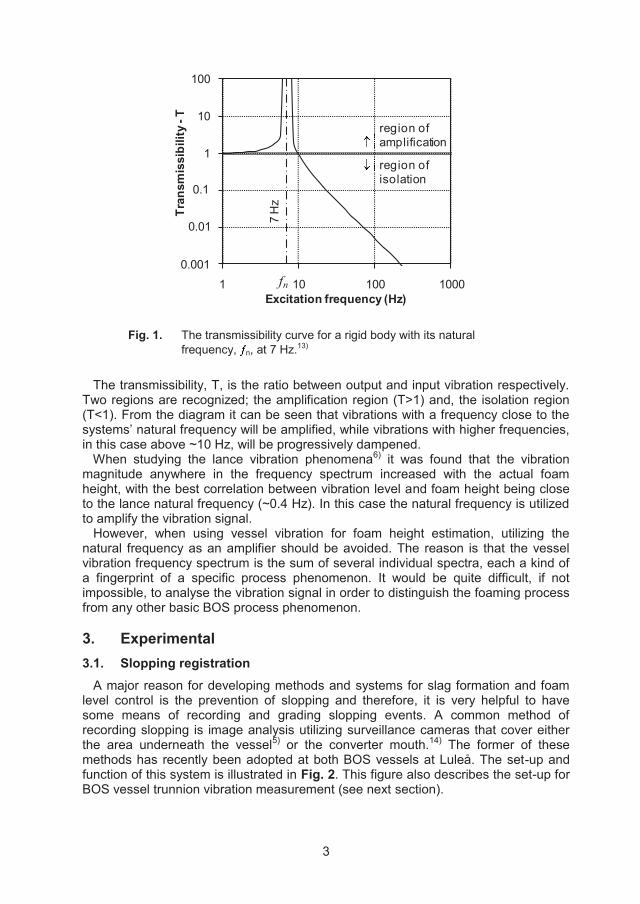
3
0,001
0,01
0,1
1
10
100
1 10 100 1000
Tran
smis
sibi
lity
-T
Excitation frequency (Hz)
region of amplification
region ofisolation
7 H
zfn
0.1
0.01
0.001
Fig. 1. The transmissibility curve for a rigid body with its natural frequency, n, at 7 Hz.13)
The transmissibility, T, is the ratio between output and input vibration respectively. Two regions are recognized; the amplification region (T>1) and, the isolation region (T<1). From the diagram it can be seen that vibrations with a frequency close to the systems’ natural frequency will be amplified, while vibrations with higher frequencies, in this case above ~10 Hz, will be progressively dampened. When studying the lance vibration phenomena6) it was found that the vibration magnitude anywhere in the frequency spectrum increased with the actual foam height, with the best correlation between vibration level and foam height being close to the lance natural frequency (~0.4 Hz). In this case the natural frequency is utilized to amplify the vibration signal. However, when using vessel vibration for foam height estimation, utilizing the natural frequency as an amplifier should be avoided. The reason is that the vessel vibration frequency spectrum is the sum of several individual spectra, each a kind of a fingerprint of a specific process phenomenon. It would be quite difficult, if not impossible, to analyse the vibration signal in order to distinguish the foaming process from any other basic BOS process phenomenon. 3. Experimental 3.1. Slopping registration A major reason for developing methods and systems for slag formation and foam level control is the prevention of slopping and therefore, it is very helpful to have some means of recording and grading slopping events. A common method of recording slopping is image analysis utilizing surveillance cameras that cover either the area underneath the vessel5) or the converter mouth.14) The former of these methods has recently been adopted at both BOS vessels at Luleå. The set-up and function of this system is illustrated in Fig. 2. This figure also describes the set-up for BOS vessel trunnion vibration measurement (see next section).
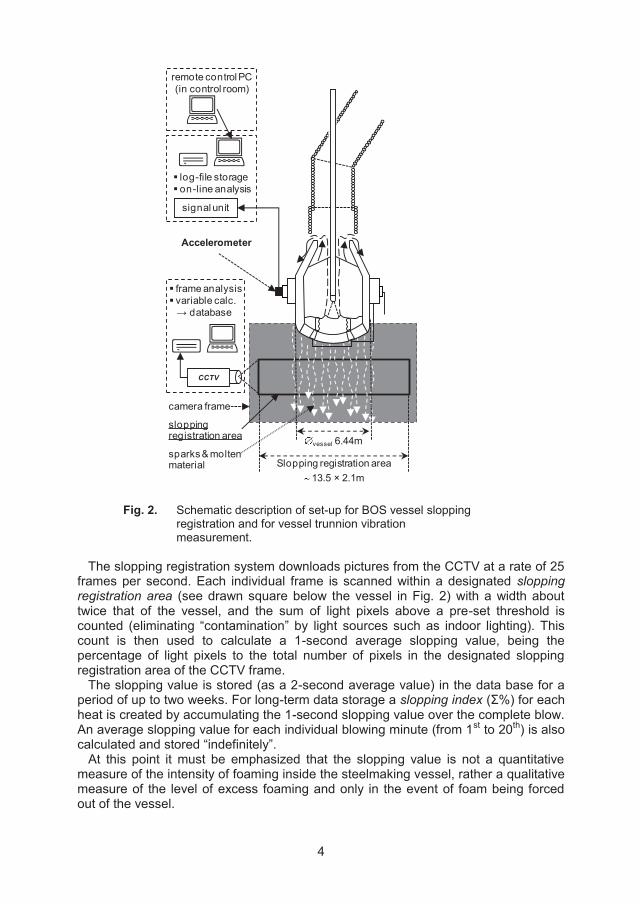
4
CCTV
frame analysisvariable calc.→ database
camera frame
sloppingregistration area
sparks & molten material Slopping registration area
13.5 × 2.1m
vessel 6.44m
signal unit
log-file storageon-line analysis
Accelerometer
remote control PC(in control room)
Fig. 2. Schematic description of set-up for BOS vessel slopping registration and for vessel trunnion vibration measurement.
The slopping registration system downloads pictures from the CCTV at a rate of 25 frames per second. Each individual frame is scanned within a designated slopping registration area (see drawn square below the vessel in Fig. 2) with a width about twice that of the vessel, and the sum of light pixels above a pre-set threshold is counted (eliminating “contamination” by light sources such as indoor lighting). This count is then used to calculate a 1-second average slopping value, being the percentage of light pixels to the total number of pixels in the designated slopping registration area of the CCTV frame. The slopping value is stored (as a 2-second average value) in the data base for a period of up to two weeks. For long-term data storage a slopping index (Σ%) for each heat is created by accumulating the 1-second slopping value over the complete blow. An average slopping value for each individual blowing minute (from 1st to 20th) is also calculated and stored “indefinitely”. At this point it must be emphasized that the slopping value is not a quantitative measure of the intensity of foaming inside the steelmaking vessel, rather a qualitative measure of the level of excess foaming and only in the event of foam being forced out of the vessel.
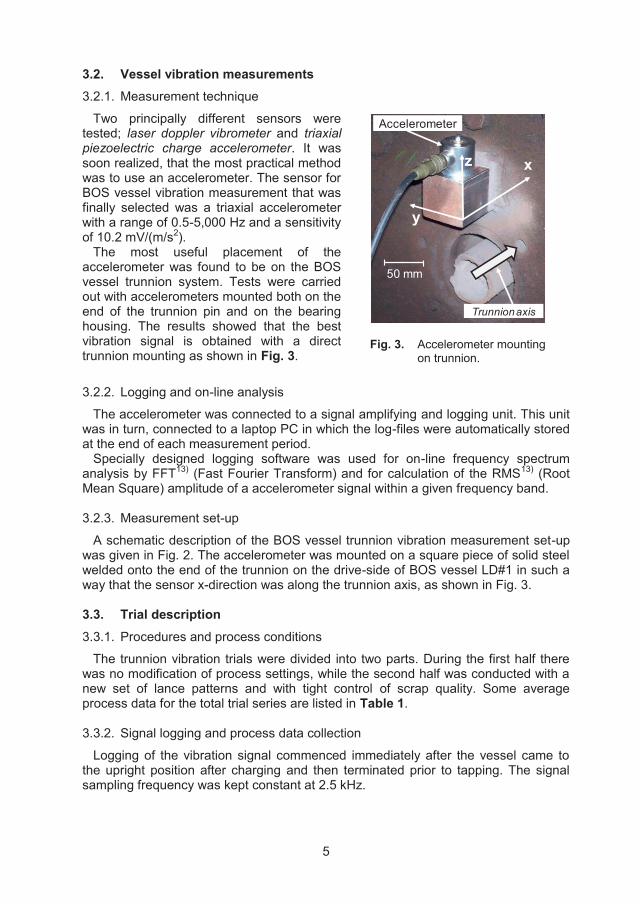
5
3.2. Vessel vibration measurements 3.2.1. Measurement technique
Two principally different sensors were tested; laser doppler vibrometer and triaxial piezoelectric charge accelerometer. It was soon realized, that the most practical method was to use an accelerometer. The sensor for BOS vessel vibration measurement that was finally selected was a triaxial accelerometer with a range of 0.5-5,000 Hz and a sensitivity of 10.2 mV/(m/s2). The most useful placement of the accelerometer was found to be on the BOS vessel trunnion system. Tests were carried out with accelerometers mounted both on the end of the trunnion pin and on the bearing housing. The results showed that the best vibration signal is obtained with a direct trunnion mounting as shown in Fig. 3.
50 mm
Accelerometer
y
z x
Trunnion axis
Fig. 3. Accelerometer mounting on trunnion.
3.2.2. Logging and on-line analysis
The accelerometer was connected to a signal amplifying and logging unit. This unit was in turn, connected to a laptop PC in which the log-files were automatically stored at the end of each measurement period. Specially designed logging software was used for on-line frequency spectrum analysis by FFT13) (Fast Fourier Transform) and for calculation of the RMS13) (Root Mean Square) amplitude of a accelerometer signal within a given frequency band. 3.2.3. Measurement set-up
A schematic description of the BOS vessel trunnion vibration measurement set-up was given in Fig. 2. The accelerometer was mounted on a square piece of solid steel welded onto the end of the trunnion on the drive-side of BOS vessel LD#1 in such a way that the sensor x-direction was along the trunnion axis, as shown in Fig. 3. 3.3. Trial description 3.3.1. Procedures and process conditions
The trunnion vibration trials were divided into two parts. During the first half there was no modification of process settings, while the second half was conducted with a new set of lance patterns and with tight control of scrap quality. Some average process data for the total trial series are listed in Table 1. 3.3.2. Signal logging and process data collection
Logging of the vibration signal commenced immediately after the vessel came to the upright position after charging and then terminated prior to tapping. The signal sampling frequency was kept constant at 2.5 kHz.
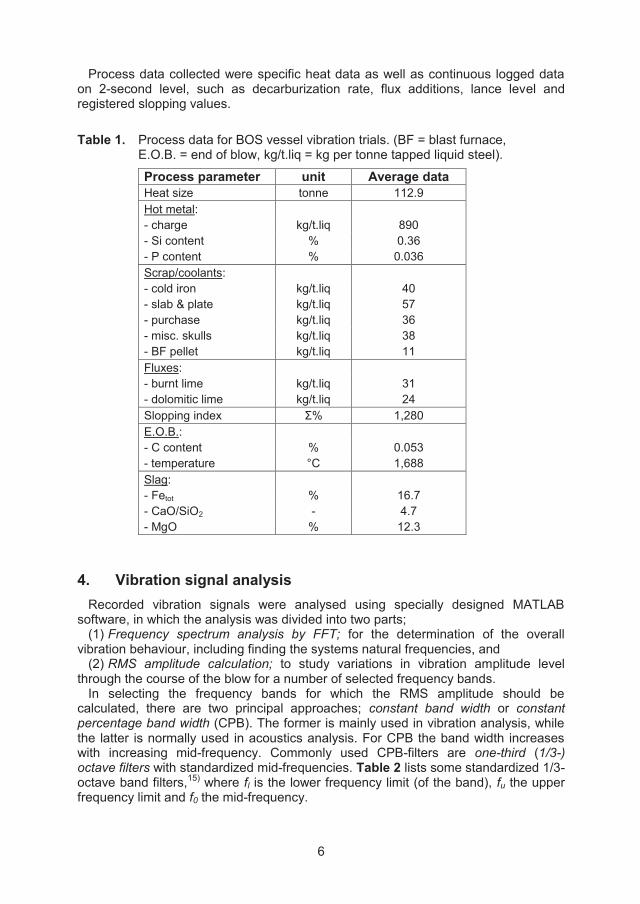
6
Process data collected were specific heat data as well as continuous logged data on 2-second level, such as decarburization rate, flux additions, lance level and registered slopping values. Table 1. Process data for BOS vessel vibration trials. (BF = blast furnace,
E.O.B. = end of blow, kg/t.liq = kg per tonne tapped liquid steel).
Process parameter unit Average data Heat size tonne 112.9 Hot metal: - charge kg/t.liq 890 - Si content % 0.36 - P content % 0.036 Scrap/coolants: - cold iron kg/t.liq 40 - slab & plate kg/t.liq 57 - purchase kg/t.liq 36 - misc. skulls kg/t.liq 38 - BF pellet kg/t.liq 11 Fluxes: - burnt lime kg/t.liq 31 - dolomitic lime kg/t.liq 24 Slopping index Σ% 1,280 E.O.B.: - C content % 0.053 - temperature °C 1,688 Slag: - Fetot % 16.7 - CaO/SiO2 - 4.7 - MgO % 12.3
4. Vibration signal analysis Recorded vibration signals were analysed using specially designed MATLAB software, in which the analysis was divided into two parts; (1) Frequency spectrum analysis by FFT; for the determination of the overall vibration behaviour, including finding the systems natural frequencies, and (2) RMS amplitude calculation; to study variations in vibration amplitude level through the course of the blow for a number of selected frequency bands. In selecting the frequency bands for which the RMS amplitude should be calculated, there are two principal approaches; constant band width or constant percentage band width (CPB). The former is mainly used in vibration analysis, while the latter is normally used in acoustics analysis. For CPB the band width increases with increasing mid-frequency. Commonly used CPB-filters are one-third (1/3-) octave filters with standardized mid-frequencies. Table 2 lists some standardized 1/3-octave band filters,15) where fl is the lower frequency limit (of the band), fu the upper frequency limit and f0 the mid-frequency.
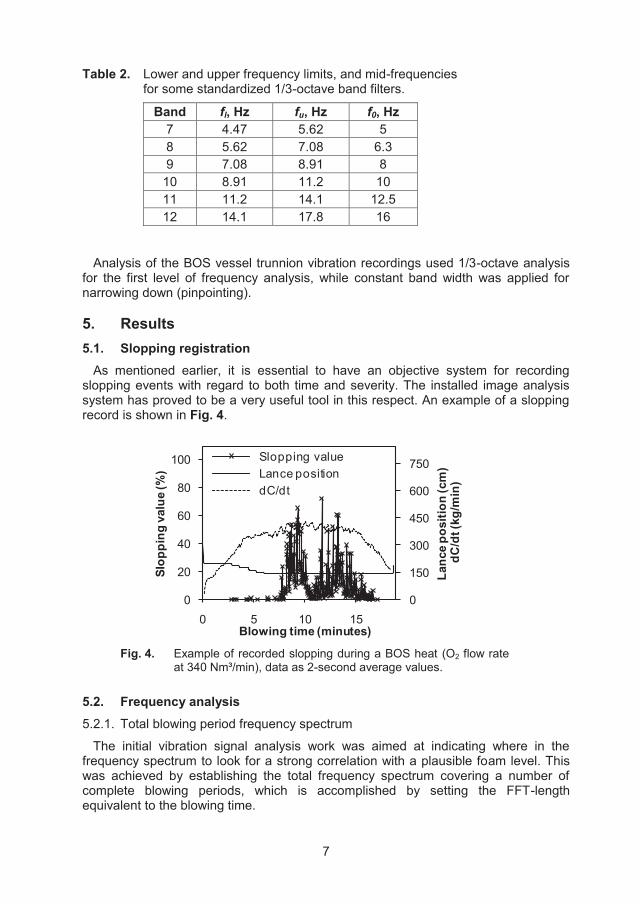
7
Table 2. Lower and upper frequency limits, and mid-frequencies for some standardized 1/3-octave band filters.
Band fl, Hz fu, Hz f0, Hz 7 4.47 5.62 5 8 5.62 7.08 6.3 9 7.08 8.91 8
10 8.91 11.2 10 11 11.2 14.1 12.5 12 14.1 17.8 16
Analysis of the BOS vessel trunnion vibration recordings used 1/3-octave analysis for the first level of frequency analysis, while constant band width was applied for narrowing down (pinpointing). 5. Results 5.1. Slopping registration As mentioned earlier, it is essential to have an objective system for recording slopping events with regard to both time and severity. The installed image analysis system has proved to be a very useful tool in this respect. An example of a slopping record is shown in Fig. 4.
0
150
300
450
600
750
0
20
40
60
80
100
0 5 10 15
Lanc
e po
sitio
n (c
m)
dC/d
t (kg
/min
)
Slop
ping
val
ue (%
)
Blowing time (minutes)
Slopping valueLance positiondC/dt
Fig. 4. Example of recorded slopping during a BOS heat (O2 flow rate
at 340 Nm³/min), data as 2-second average values.
5.2. Frequency analysis 5.2.1. Total blowing period frequency spectrum
The initial vibration signal analysis work was aimed at indicating where in the frequency spectrum to look for a strong correlation with a plausible foam level. This was achieved by establishing the total frequency spectrum covering a number of complete blowing periods, which is accomplished by setting the FFT-length equivalent to the blowing time.
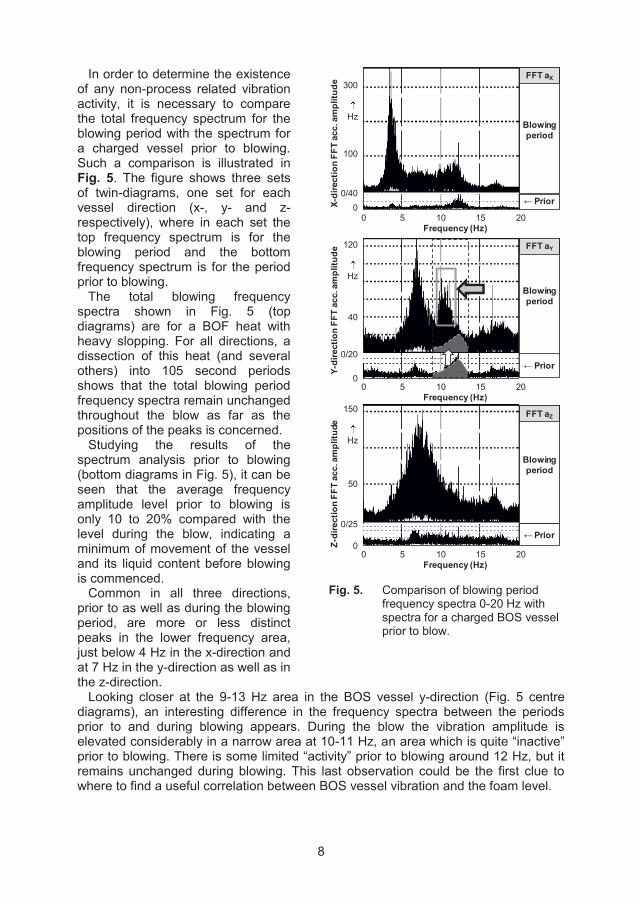
8
In order to determine the existence of any non-process related vibration activity, it is necessary to compare the total frequency spectrum for the blowing period with the spectrum for a charged vessel prior to blowing. Such a comparison is illustrated in Fig. 5. The figure shows three sets of twin-diagrams, one set for each vessel direction (x-, y- and z- respectively), where in each set the top frequency spectrum is for the blowing period and the bottom frequency spectrum is for the period prior to blowing. The total blowing frequency spectra shown in Fig. 5 (top diagrams) are for a BOF heat with heavy slopping. For all directions, a dissection of this heat (and several others) into 105 second periods shows that the total blowing period frequency spectra remain unchanged throughout the blow as far as the positions of the peaks is concerned. Studying the results of the spectrum analysis prior to blowing (bottom diagrams in Fig. 5), it can be seen that the average frequency amplitude level prior to blowing is only 10 to 20% compared with the level during the blow, indicating a minimum of movement of the vessel and its liquid content before blowing is commenced. Common in all three directions, prior to as well as during the blowing period, are more or less distinct peaks in the lower frequency area, just below 4 Hz in the x-direction and at 7 Hz in the y-direction as well as in the z-direction.
Y-di
rect
ion
FFT
acc.
am
plitu
de
Blowing period
← Prior
FFT aY
0 5 10 15 20Frequency (Hz)
Z-di
rect
ion
FFT
acc.
am
plitu
de
Blowing period
← Prior
FFT aZ
0 5 10 15 20Frequency (Hz)
0 5 10 15 20Frequency (Hz)
X-di
rect
ion
FFT
acc.
am
plitu
de
Blowing period
← Prior
FFT aX300
.Hz
100
0/400
150
.Hz
50
0/25
0
120
.Hz
40
0/20
0
Fig. 5. Comparison of blowing period frequency spectra 0-20 Hz with spectra for a charged BOS vessel prior to blow.
Looking closer at the 9-13 Hz area in the BOS vessel y-direction (Fig. 5 centre diagrams), an interesting difference in the frequency spectra between the periods prior to and during blowing appears. During the blow the vibration amplitude is elevated considerably in a narrow area at 10-11 Hz, an area which is quite “inactive” prior to blowing. There is some limited “activity” prior to blowing around 12 Hz, but it remains unchanged during blowing. This last observation could be the first clue to where to find a useful correlation between BOS vessel vibration and the foam level.
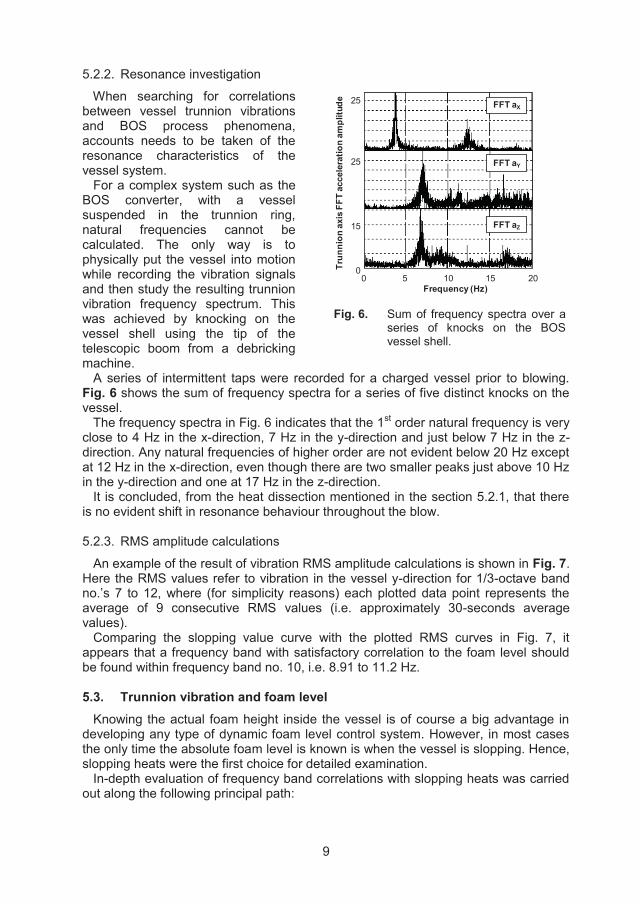
9
5.2.2. Resonance investigation
When searching for correlations between vessel trunnion vibrations and BOS process phenomena, accounts needs to be taken of the resonance characteristics of the vessel system. For a complex system such as the BOS converter, with a vessel suspended in the trunnion ring, natural frequencies cannot be calculated. The only way is to physically put the vessel into motion while recording the vibration signals and then study the resulting trunnion vibration frequency spectrum. This was achieved by knocking on the vessel shell using the tip of the telescopic boom from a debricking machine.
0 5 10 15 20Frequency (Hz)
FFT aX
FFT aY
FFT aZ
Trun
nion
axi
s FF
T ac
cele
ratio
n am
plitu
de 25
25
15
0
Fig. 6. Sum of frequency spectra over a series of knocks on the BOS vessel shell.
A series of intermittent taps were recorded for a charged vessel prior to blowing. Fig. 6 shows the sum of frequency spectra for a series of five distinct knocks on the vessel. The frequency spectra in Fig. 6 indicates that the 1st order natural frequency is very close to 4 Hz in the x-direction, 7 Hz in the y-direction and just below 7 Hz in the z-direction. Any natural frequencies of higher order are not evident below 20 Hz except at 12 Hz in the x-direction, even though there are two smaller peaks just above 10 Hz in the y-direction and one at 17 Hz in the z-direction. It is concluded, from the heat dissection mentioned in the section 5.2.1, that there is no evident shift in resonance behaviour throughout the blow. 5.2.3. RMS amplitude calculations
An example of the result of vibration RMS amplitude calculations is shown in Fig. 7. Here the RMS values refer to vibration in the vessel y-direction for 1/3-octave band no.’s 7 to 12, where (for simplicity reasons) each plotted data point represents the average of 9 consecutive RMS values (i.e. approximately 30-seconds average values). Comparing the slopping value curve with the plotted RMS curves in Fig. 7, it appears that a frequency band with satisfactory correlation to the foam level should be found within frequency band no. 10, i.e. 8.91 to 11.2 Hz. 5.3. Trunnion vibration and foam level Knowing the actual foam height inside the vessel is of course a big advantage in developing any type of dynamic foam level control system. However, in most cases the only time the absolute foam level is known is when the vessel is slopping. Hence, slopping heats were the first choice for detailed examination. In-depth evaluation of frequency band correlations with slopping heats was carried out along the following principal path:
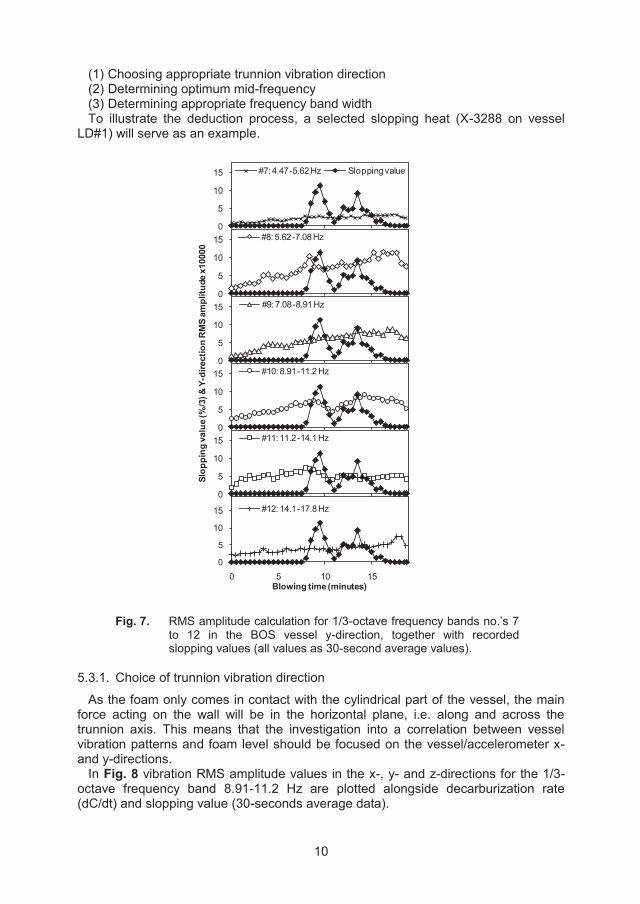
10
(1) Choosing appropriate trunnion vibration direction (2) Determining optimum mid-frequency (3) Determining appropriate frequency band width To illustrate the deduction process, a selected slopping heat (X-3288 on vessel LD#1) will serve as an example.
Slop
ping
val
ue (%
/3) &
Y-d
irect
ion
RM
S am
plitu
de x
1000
0
0
5
10
15 #7: 4.47-5.62 Hz Slopping value
0
5
10
15 #8: 5.62-7.08 Hz
0
5
10
15 #9: 7.08-8.91 Hz
0
5
10
15
0 5 10 15Blowing time (minutes)
#12: 14.1-17.8 Hz0
5
10
15 #11: 11.2-14.1 Hz0
5
10
15 #10: 8.91-11.2 Hz
Fig. 7. RMS amplitude calculation for 1/3-octave frequency bands no.’s 7 to 12 in the BOS vessel y-direction, together with recorded slopping values (all values as 30-second average values).
5.3.1. Choice of trunnion vibration direction
As the foam only comes in contact with the cylindrical part of the vessel, the main force acting on the wall will be in the horizontal plane, i.e. along and across the trunnion axis. This means that the investigation into a correlation between vessel vibration patterns and foam level should be focused on the vessel/accelerometer x- and y-directions. In Fig. 8 vibration RMS amplitude values in the x-, y- and z-directions for the 1/3-octave frequency band 8.91-11.2 Hz are plotted alongside decarburization rate (dC/dt) and slopping value (30-seconds average data).
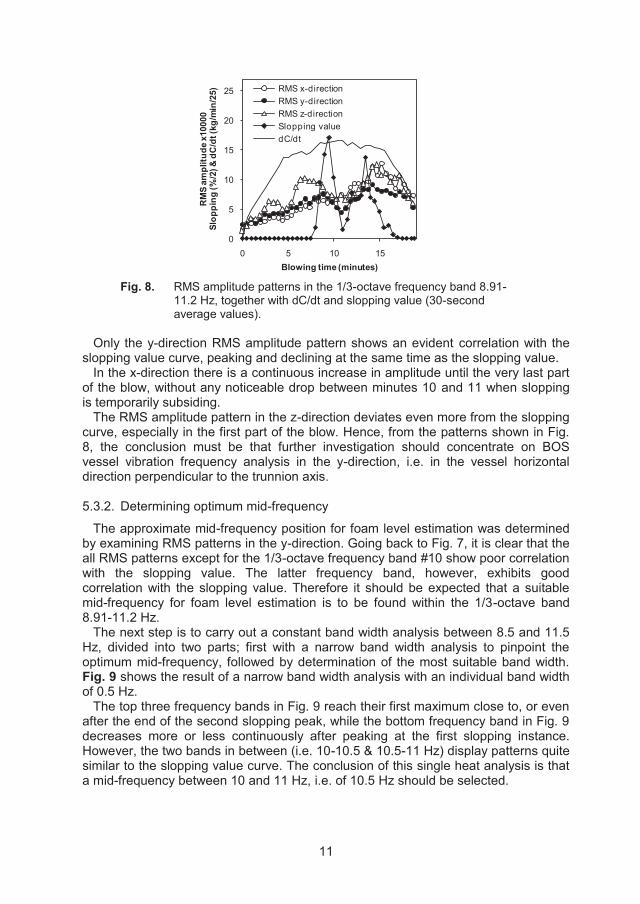
11
0
5
10
15
20
25
0 5 10 15
RM
S am
plitu
de x
1000
0Sl
oppi
ng (%
/2) &
dC
/dt (
kg/m
in/2
5)
Blowing time (minutes)
RMS x-directionRMS y-directionRMS z-directionSlopping valuedC/dt
Fig. 8. RMS amplitude patterns in the 1/3-octave frequency band 8.91-
11.2 Hz, together with dC/dt and slopping value (30-second average values).
Only the y-direction RMS amplitude pattern shows an evident correlation with the slopping value curve, peaking and declining at the same time as the slopping value. In the x-direction there is a continuous increase in amplitude until the very last part of the blow, without any noticeable drop between minutes 10 and 11 when slopping is temporarily subsiding. The RMS amplitude pattern in the z-direction deviates even more from the slopping curve, especially in the first part of the blow. Hence, from the patterns shown in Fig. 8, the conclusion must be that further investigation should concentrate on BOS vessel vibration frequency analysis in the y-direction, i.e. in the vessel horizontal direction perpendicular to the trunnion axis. 5.3.2. Determining optimum mid-frequency
The approximate mid-frequency position for foam level estimation was determined by examining RMS patterns in the y-direction. Going back to Fig. 7, it is clear that the all RMS patterns except for the 1/3-octave frequency band #10 show poor correlation with the slopping value. The latter frequency band, however, exhibits good correlation with the slopping value. Therefore it should be expected that a suitable mid-frequency for foam level estimation is to be found within the 1/3-octave band 8.91-11.2 Hz. The next step is to carry out a constant band width analysis between 8.5 and 11.5 Hz, divided into two parts; first with a narrow band width analysis to pinpoint the optimum mid-frequency, followed by determination of the most suitable band width. Fig. 9 shows the result of a narrow band width analysis with an individual band width of 0.5 Hz. The top three frequency bands in Fig. 9 reach their first maximum close to, or even after the end of the second slopping peak, while the bottom frequency band in Fig. 9 decreases more or less continuously after peaking at the first slopping instance. However, the two bands in between (i.e. 10-10.5 & 10.5-11 Hz) display patterns quite similar to the slopping value curve. The conclusion of this single heat analysis is that a mid-frequency between 10 and 11 Hz, i.e. of 10.5 Hz should be selected.
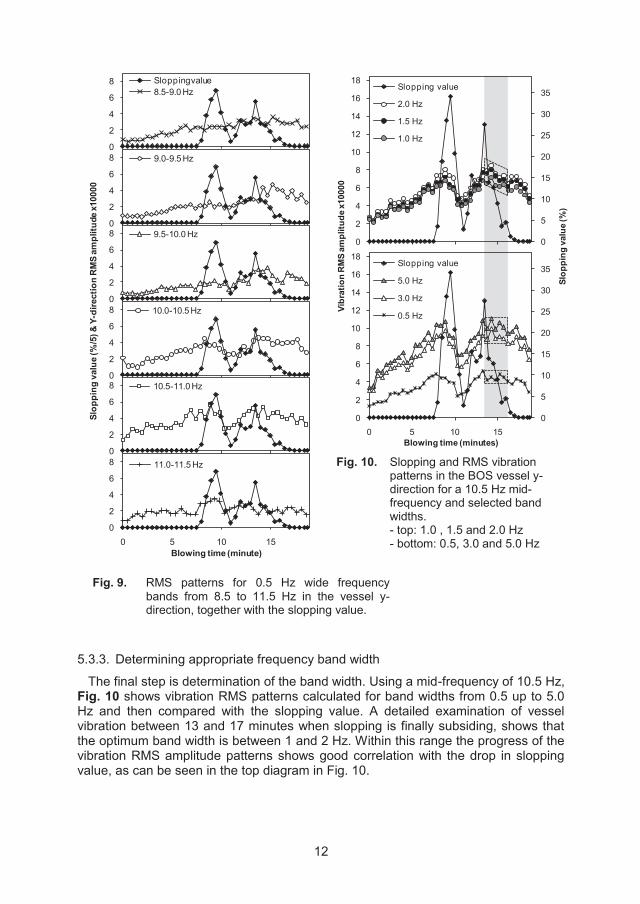
12
Slop
ping
val
ue (%
/5) &
Y-d
irect
ion
RM
S am
plitu
de x
1000
0
0
2
4
6
8 Slopping value8.5-9.0 Hz
0
2
4
6
8 9.0-9.5 Hz
0
2
4
6
8 9.5-10.0 Hz
0
2
4
6
8 10.0-10.5 Hz
0
2
4
6
8 10.5-11.0 Hz
0
2
4
6
8
0 5 10 15Blowing time (minute)
11.0-11.5 Hz
0
5
10
15
20
25
30
35
0
2
4
6
8
10
12
14
16
18
Slop
ping
val
ue (%
)
Vibr
atio
n R
MS
ampl
itude
x10
000
Slopping value
2.0 Hz
1.5 Hz
1.0 Hz
Slop
ping
val
ue (%
)
0
5
10
15
20
25
30
35
0
2
4
6
8
10
12
14
16
18
0 5 10 15
Slop
ping
val
ue (%
)
Vibr
atio
n R
MS
ampl
itude
x10
000
Blowing time (minutes)
Slopping value
5.0 Hz
3.0 Hz
0.5 Hz
Vibr
atio
n R
MS
ampl
itude
x10
000
Fig. 10. Slopping and RMS vibration patterns in the BOS vessel y-direction for a 10.5 Hz mid-frequency and selected band widths. - top: 1.0 , 1.5 and 2.0 Hz - bottom: 0.5, 3.0 and 5.0 Hz
Fig. 9. RMS patterns for 0.5 Hz wide frequency bands from 8.5 to 11.5 Hz in the vessel y-direction, together with the slopping value.
5.3.3. Determining appropriate frequency band width
The final step is determination of the band width. Using a mid-frequency of 10.5 Hz, Fig. 10 shows vibration RMS patterns calculated for band widths from 0.5 up to 5.0 Hz and then compared with the slopping value. A detailed examination of vessel vibration between 13 and 17 minutes when slopping is finally subsiding, shows that the optimum band width is between 1 and 2 Hz. Within this range the progress of the vibration RMS amplitude patterns shows good correlation with the drop in slopping value, as can be seen in the top diagram in Fig. 10.
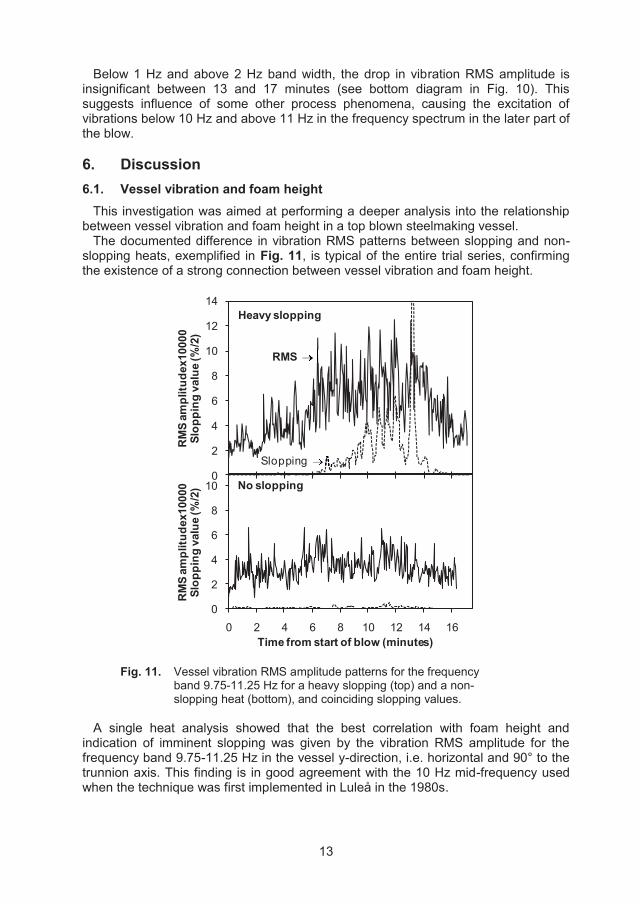
13
Below 1 Hz and above 2 Hz band width, the drop in vibration RMS amplitude is insignificant between 13 and 17 minutes (see bottom diagram in Fig. 10). This suggests influence of some other process phenomena, causing the excitation of vibrations below 10 Hz and above 11 Hz in the frequency spectrum in the later part of the blow. 6. Discussion 6.1. Vessel vibration and foam height This investigation was aimed at performing a deeper analysis into the relationship between vessel vibration and foam height in a top blown steelmaking vessel. The documented difference in vibration RMS patterns between slopping and non-slopping heats, exemplified in Fig. 11, is typical of the entire trial series, confirming the existence of a strong connection between vessel vibration and foam height.
0
2
4
6
8
10
12
14
RM
S am
plitu
dex1
0000
Slop
ping
val
ue (%
/2)
0
2
4
6
8
10
0 2 4 6 8 10 12 14 16
RM
S am
plitu
dex1
0000
Slop
ping
val
ue (%
/2)
Time from start of blow (minutes)
Heavy slopping
No slopping
RMS
Slopping
Fig. 11. Vessel vibration RMS amplitude patterns for the frequency band 9.75-11.25 Hz for a heavy slopping (top) and a non-slopping heat (bottom), and coinciding slopping values.
A single heat analysis showed that the best correlation with foam height and indication of imminent slopping was given by the vibration RMS amplitude for the frequency band 9.75-11.25 Hz in the vessel y-direction, i.e. horizontal and 90° to the trunnion axis. This finding is in good agreement with the 10 Hz mid-frequency used when the technique was first implemented in Luleå in the 1980s.
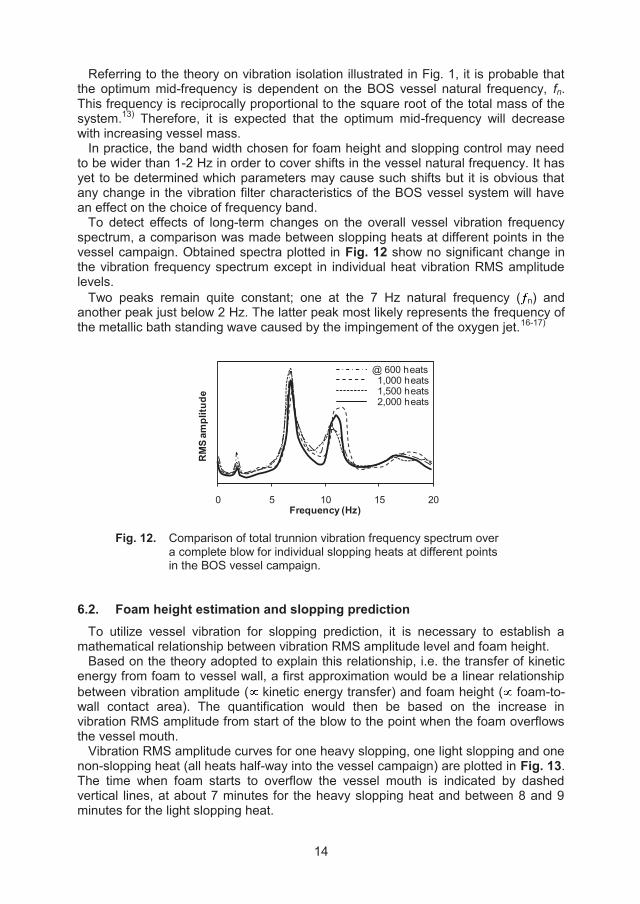
14
Referring to the theory on vibration isolation illustrated in Fig. 1, it is probable that the optimum mid-frequency is dependent on the BOS vessel natural frequency, fn. This frequency is reciprocally proportional to the square root of the total mass of the system.13) Therefore, it is expected that the optimum mid-frequency will decrease with increasing vessel mass. In practice, the band width chosen for foam height and slopping control may need to be wider than 1-2 Hz in order to cover shifts in the vessel natural frequency. It has yet to be determined which parameters may cause such shifts but it is obvious that any change in the vibration filter characteristics of the BOS vessel system will have an effect on the choice of frequency band. To detect effects of long-term changes on the overall vessel vibration frequency spectrum, a comparison was made between slopping heats at different points in the vessel campaign. Obtained spectra plotted in Fig. 12 show no significant change in the vibration frequency spectrum except in individual heat vibration RMS amplitude levels. Two peaks remain quite constant; one at the 7 Hz natural frequency ( n) and another peak just below 2 Hz. The latter peak most likely represents the frequency of the metallic bath standing wave caused by the impingement of the oxygen jet.16-17)
0 5 10 15 20
RM
S am
plitu
de
Frequency (Hz)
@ 600 heats1,000 heats1,500 heats2,000 heats
Fig. 12. Comparison of total trunnion vibration frequency spectrum over a complete blow for individual slopping heats at different points in the BOS vessel campaign.
6.2. Foam height estimation and slopping prediction To utilize vessel vibration for slopping prediction, it is necessary to establish a mathematical relationship between vibration RMS amplitude level and foam height. Based on the theory adopted to explain this relationship, i.e. the transfer of kinetic energy from foam to vessel wall, a first approximation would be a linear relationship between vibration amplitude ( kinetic energy transfer) and foam height ( foam-to-wall contact area). The quantification would then be based on the increase in vibration RMS amplitude from start of the blow to the point when the foam overflows the vessel mouth. Vibration RMS amplitude curves for one heavy slopping, one light slopping and one non-slopping heat (all heats half-way into the vessel campaign) are plotted in Fig. 13. The time when foam starts to overflow the vessel mouth is indicated by dashed vertical lines, at about 7 minutes for the heavy slopping heat and between 8 and 9 minutes for the light slopping heat.
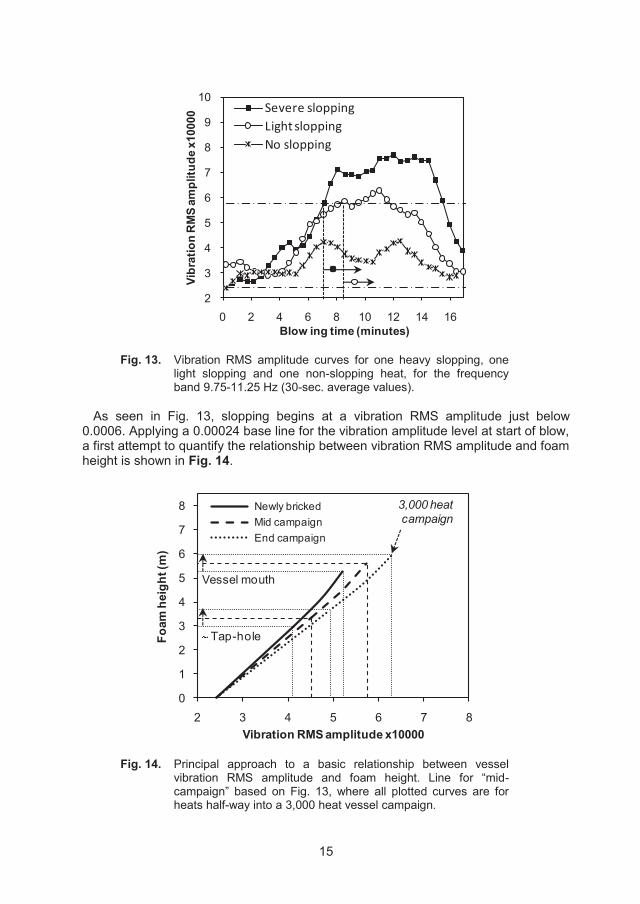
15
2
3
4
5
6
7
8
9
10
0 2 4 6 8 10 12 14 16
Vibr
atio
n R
MS
ampl
itude
x10
000
Blow ing time (minutes)
Severe sloppingLight sloppingNo slopping
Fig. 13. Vibration RMS amplitude curves for one heavy slopping, one light slopping and one non-slopping heat, for the frequency band 9.75-11.25 Hz (30-sec. average values).
As seen in Fig. 13, slopping begins at a vibration RMS amplitude just below 0.0006. Applying a 0.00024 base line for the vibration amplitude level at start of blow, a first attempt to quantify the relationship between vibration RMS amplitude and foam height is shown in Fig. 14.
0
1
2
3
4
5
6
7
8
2 3 4 5 6 7 8
Foam
hei
ght (
m)
Vibration RMS amplitude x10,000
Newly brickedMid campaignEnd campaign
0
1
2
3
4
5
6
7
8
2 3 4 5 6 7 8
Foam
hei
ght (
m)
Vibration RMS amplitude x10000
Newly brickedMid campaignEnd campaign
Vessel mouth
Tap-hole
3,000 heatcampaign
Fig. 14. Principal approach to a basic relationship between vessel vibration RMS amplitude and foam height. Line for “mid-campaign” based on Fig. 13, where all plotted curves are for heats half-way into a 3,000 heat vessel campaign.
16
To compensate for the continuous wear of the vessel lining, the value for the vibration RMS amplitude over which slopping is expected needs to be adjusted (as shown in Fig. 14), as the ratio of contact area to foam height increases with increased vessel diameter and as the distance from bath level to vessel mouth increases with increasing bottom wear. 7. Conclusions (1) During the BOS process, transfer of kinetic energy from the foaming slag to the vessel results in vibration at the vessel wall. These vibrations propagate through the vessel structure, but only the lower part of the vibration frequency spectrum will travel all the way to the outer parts of the structure, as the vessel itself will act as a mechanical filter. (2) Best correlation with foam level is obtained with the vibrations in the horizontal y-direction, i.e. in the vessel tilting direction. This observation is not surprising, as the forces of the foaming slag only act on the vertical part of the vessel. (3) Most favourable and practical is to monitor vessel vibrations by placing an accelerometer on the trunnion. It should be on the drive-side, as here the trunnion is free to move. (4) As the resonance and hence the filtering properties of the vessel mechanical structure will vary from converter to converter, so will the optimum frequency band. It will however, remain constant for an individual converter as long as no major change is made to the vessel design. (5) The results indicate that there is a correlation between vibration and foam height that can be used for dynamic foam level and slopping control. Acknowledgements
The authors wish to acknowledge that the experimental work and analysis presented in this article was carried out with a financial grant from the Research Fund for Coal and Steel of the European Community. It should also be acknowledged that this publication is a part of an industrial PhD work carried out at the Division of Extractive Metallurgy, Luleå University of Technology, and linked to the PRISMA Centre for Process Integration in Steelmaking, a research centre located at Swerea MEFOS which is supported by Scandinavian mining and metallurgical industries and by VINNOVA (The Swedish Governmental Agency for Innovation Systems), SSF (The Swedish Foundation for Strategic Research) and KK-stiftelsen (The Knowledge Foundation, a research financier for Swedish institutions for higher education).
REFERENCES
1) K. Ito and R.J. Fruehan: Metall. Trans. B, 20B(1989), 515. 2) T. Kanai, A. Sakai, J. Tani, S. Yoshida and N. Matsui: Proc. of 2nd European
Oxygen Steelmaking Congress, AIM, Milan, (1997), 267. 3) J. W. K. van Boggelen: Proc. of 5th European Oxygen Steelmaking Conference,
Steel Inst. VDEh, Aachen, (2006), 108, CD-ROM.
17
4) C. Bencini and A. Poli: Proc. of 76th Steelmaking Conference, Iron & Steel Society, Warrendale, PA, (1993), 193.
5) J. Ruuska, S. Ollila, L. Bååth and K. Leiviskä: Proc. of 5th European Oxygen Steelmaking Conference, Steel Inst. VDEh, Aachen, (2006), 210, CD-ROM.
6) Y. Iida, K. Emoto, M. Ogawa, Y. Masuda, M. Onishi and H. Yamada: Trans. Iron Steel Inst. Jpn., 24(1984), 540.
7) M. S. Millman, L. Bååth, D. Malmberg and E. Price: Proc. of 2nd Int. Congress on the Science and Technology of Steelmaking, Vol. 1, University of Wales, Swansea, (2001), 309.
8) T. Saito, I. Tsubone, M. Azuma, H. Yamana and H. Takezoe: Tetso-to-Hagané (JISJ), 76(1990), 1978.
9) D. Malmberg, P. Hahlin and E. Nilsson: ISIJ Int., 47(2007), 553. 10) R. Bruckhaus, V. Fiedler and H. Lachmund: Reue de Métallurgi, June(2001),
533. 11) T. Takawa, K. Katayama, K. Katohgi and T. Kuribayashi: Trans. Iron Steel Inst.
Jpn., 28(1988), 59. 12) P. G. Garnica, R. D. Morales and N. U. Rodríguez: Proc. of Metallurgical
Processes for Early Twenty-First Century, TMS, Warrendale, PA, USA, (1994), 631.
13) L. Beranek and I. Vér: Noise and vibration control engineering, Wiley-Interscience, John Wiley & Sons, Inc., New York, (1992), ISBN 0-471-61751-2, 49-56, 430 & 566.
14) C. Kattenbelt, E. Spelbos, P. Mink and B. Roffel: Steel Research Int., 79(2008), No. 11, 821.
15) M. P. Norton and D.G. Karczub: Fundamentals of noise and vibration analysis for engineers 2nd edition, Cambridge University Press, Cambridge, New York, (1989), ISBN 0-521-49913-5, 264.
16) M. S. Lee and S. L. O´Rourke: Iron and Steelmaker, 28(2002), No. 9, 56. 17) M. J. Loumala, T. M. J. Fabritius and J. J. Härkki: ISIJ Int., 44(2004), 809.


Appendix III
Comparison between Vessel Vibration and Audiometry for Slopping Control in the
Top-blown BOS Process
M. Brämming, S. Millman, G. Parker, A. Kapilashrami, D. Malmberg and B. Björkman
Submitted to Steel Research International.

1
Comparison between Vessel Vibration and Audiometry for Slopping Control in the Top-blown BOS Process Mats Brämming1), Gareth Parker2), Stuart Millman3), Abha Kapilashrami4), Donald Malmberg5), Bo Björkman6) 1) SSAB EMEA, SE-971 88 Luleå, Sweden, also PhD student at Division of Process
Metallurgy, Luleå University of Technology 2) Tata Construction & Industrial, PO Box 1, Scunthorpe, N. Lincolnshire DN16 1BP, UK 3) Tata Research, D & T, Teesside Technology Centre, PO Box 11, Grangetown
Middlesbrough, Cleveland TS6 6US, UK 4) Tata Research, D & T, IJmuiden Technology Centre, PO Box 1000, 1970 CA
IJmuiden, The Netherlands 5) Swerea/MEFOS AB, Box 812, SE-971 25 Luleå, Sweden 6) Division of Extractive Metallurgy, Luleå University of Technology, SE-971 87 Luleå,
Sweden Excess slag foam growth is a frequent problem in the BOS process. In the worst case, foam is forced out of the vessel and this phenomenon, commonly called slopping, not only results in loss of valuable metal yield but also in equipment damage and lost production time. In order to minimize slopping, accurate estimation of the foam level inside the vessel, is an important part of BOS process control. In the top blown BOS vessel slopping control is achieved using both static and dynamic measures. The most common implemented technique for dynamic foam height estimation and slopping control is the audiometer system. An alternative method, vessel vibration monitoring, has been investigated as part of the work in a RFCS funded research project called IMPHOS. In order to judge the usefulness of this method, parallel vibration and audio measurements have been carried out on 130 tonne as well as on 300 tonne BOS vessels. The results show that during stable process conditions there is good agreement between the two methods with regard to foam height estimation and, as vessel vibration and audiometry are largely independent of each other, a combination of the two is likely to increase significantly the accuracy of slopping prediction. Keywords: BOS, process control, foaming, slopping, audiometry, vessel vibration 1. Introduction Early slag foam formation is critically important in Basic Oxygen Steelmaking (BOS), because it affords vessel lining protection and creates the best possible conditions for phosphorus refining. However, process conditions may lead to such an excessive foam volume growth that the foam cannot be contained within the vessel and the heat will slop. Slopping will result in reduced metallic yield, equipment damage and lost production time. The recently completed EU/RFCS supported research project IMPHOS (“Improving Phosphorus Refining”) was aimed at improving BOS phosphorus refining strategies, mainly by introducing additional dynamic aspects into the process control scheme. A key objective of this project was to improve capability for estimating the actual foam height in the BOS vessel.
2
One of the most common methods today for foam height estimation and control is process sound measurements with an audiometer system. By recording process sound either inside the lower stack[1,2] or close to the vessel[3,4] mouth it is possible to monitor process noise, mainly originating from the oxygen jet. Because the slag foam acts as an acoustical attenuator, the intensity of the measured noise decreases with increasing foam height. Another method developed in Japan in the 1970s is based on monitoring the oxygen lance vibration.[1,5] More indirect foam height estimations can be based on off-gas data.[6,7] From a practical point of view, the position of the foam surface, i.e. the foam level inside the vessel is important for optimizing refining conditions. More recently developed methods for direct foam level measurement utilizes radio waves,[4,8] micro waves,[9,10] or radar.[11] All BOS plants involved in the IMPHOS project, except SSAB Luleå, have audiometer systems for foam height estimation and dynamic slopping control. The aim of this part of the project was to improve foam height estimation from start to end of the blow using techniques other than audiometric, not as a substitution but as a valuable complement to the audiometer system. As there were some previous experiences of BOS vessel vibration monitoring for foam height estimation and slopping control at the SSAB Luleå plant, it was decided to re-evaluate this method. 2. Vessel vibration theory and development The investigation into and the subsequent development of BOS vessel vibration measurement and signal analysis for foam height estimation was carried out at SSAB EMEA’s semi-integrated steel plant in Luleå.[12] The method is based on the theory[5] of transfer of kinetic energy from the foaming slag to the vessel itself, resulting in vibration excitation at the vessel wall. These vibrations propagate through the vessel structure which acts as a mechanical filter and in the main, the lower part of the vibration frequency spectrum will travel all the way to the outer parts of the structure. The main conclusions drawn from newly conducted trials on the 130 tonne BOS vessels at Luleå are, that:[12]
optimum position of the vibration sensor is directly on the trunnion pin on the gearbox side of vessel
best correlation with foam height is obtained with the vibration in the vessel horizontal direction, especially perpendicular to the trunnion axis
as the resonance, and hence the filtering properties of the mechanical structure, will vary between vessels so will the optimum frequency band for foam height estimation, but it will remain constant for individual vessels as long as no major design change is made
the correlation between vibration and foam height was found to be sufficiently good that development of a dynamic foam level and slopping control system based on vibration is considered to be worthwhile
3. Experimental In order to confirm the validity of the BOS vessel vibration results from the Luleå 130 tonne vessels, a series of additional trials have been carried out on 300 tonne BOS vessels at Tata Steel Scunthorpe Works, where all vessels are equipped with
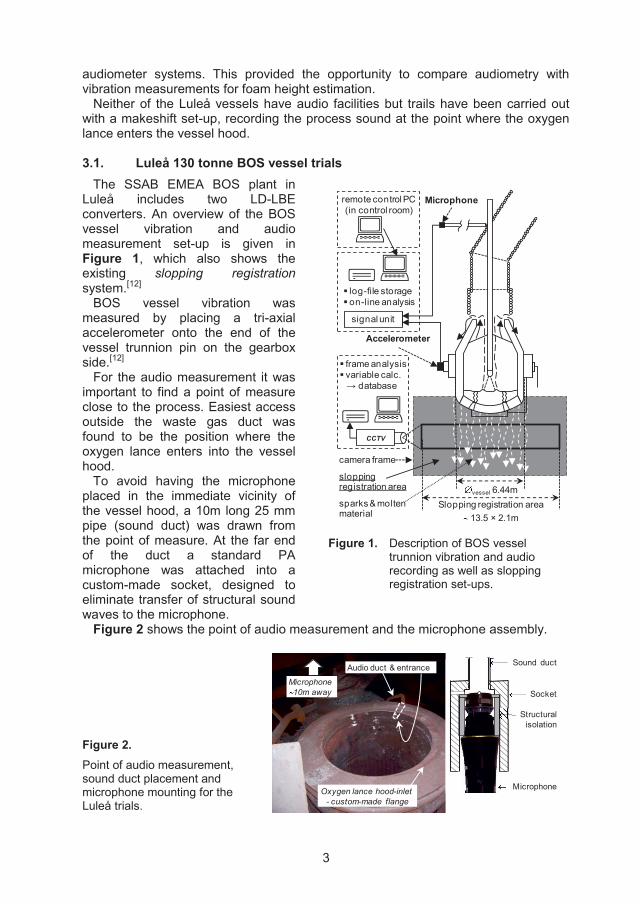
3
audiometer systems. This provided the opportunity to compare audiometry with vibration measurements for foam height estimation. Neither of the Luleå vessels have audio facilities but trails have been carried out with a makeshift set-up, recording the process sound at the point where the oxygen lance enters the vessel hood. 3.1. Luleå 130 tonne BOS vessel trials The SSAB EMEA BOS plant in Luleå includes two LD-LBE converters. An overview of the BOS vessel vibration and audio measurement set-up is given in Figure 1, which also shows the existing slopping registration system.[12] BOS vessel vibration was measured by placing a tri-axial accelerometer onto the end of the vessel trunnion pin on the gearbox side.[12] For the audio measurement it was important to find a point of measure close to the process. Easiest access outside the waste gas duct was found to be the position where the oxygen lance enters into the vessel hood. To avoid having the microphone placed in the immediate vicinity of the vessel hood, a 10m long 25 mm pipe (sound duct) was drawn from the point of measure. At the far end of the duct a standard PA microphone was attached into a custom-made socket, designed to eliminate transfer of structural sound waves to the microphone.
CCTV
frame analysisvariable calc.→ database
camera frame
sloppingregistration area
sparks & molten material
Slopping registration area13.5 × 2.1m
vessel 6.44m
signal unit
log-file storageon-line analysis
Accelerometer
remote control PC(in control room)
Microphone
Figure 1. Description of BOS vessel trunnion vibration and audio recording as well as slopping registration set-ups.
Figure 2 shows the point of audio measurement and the microphone assembly. Figure 2. Point of audio measurement, sound duct placement and microphone mounting for the Luleå trials.
Microphone10m away
Audio duct & entrance
Oxygen lance hood-inlet - custom-made flange
Sound duct
Socket
Structuralisolation
Microphone
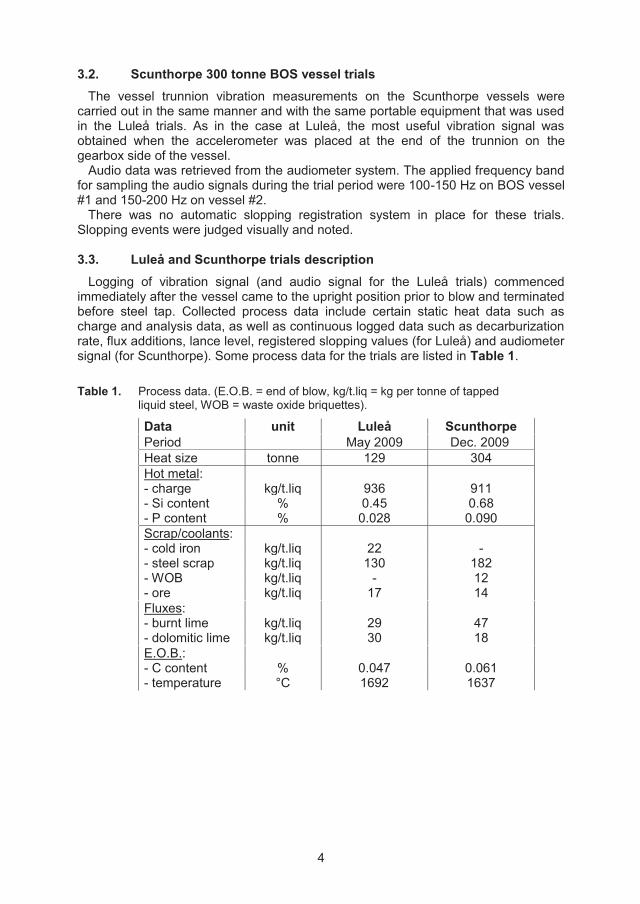
4
3.2. Scunthorpe 300 tonne BOS vessel trials The vessel trunnion vibration measurements on the Scunthorpe vessels were carried out in the same manner and with the same portable equipment that was used in the Luleå trials. As in the case at Luleå, the most useful vibration signal was obtained when the accelerometer was placed at the end of the trunnion on the gearbox side of the vessel. Audio data was retrieved from the audiometer system. The applied frequency band for sampling the audio signals during the trial period were 100-150 Hz on BOS vessel #1 and 150-200 Hz on vessel #2. There was no automatic slopping registration system in place for these trials. Slopping events were judged visually and noted. 3.3. Luleå and Scunthorpe trials description Logging of vibration signal (and audio signal for the Luleå trials) commenced immediately after the vessel came to the upright position prior to blow and terminated before steel tap. Collected process data include certain static heat data such as charge and analysis data, as well as continuous logged data such as decarburization rate, flux additions, lance level, registered slopping values (for Luleå) and audiometer signal (for Scunthorpe). Some process data for the trials are listed in Table 1. Table 1. Process data. (E.O.B. = end of blow, kg/t.liq = kg per tonne of tapped
liquid steel, WOB = waste oxide briquettes).
Data unit Luleå Scunthorpe Period May 2009 Dec. 2009 Heat size tonne 129 304 Hot metal: - charge kg/t.liq 936 911 - Si content % 0.45 0.68 - P content % 0.028 0.090 Scrap/coolants: - cold iron kg/t.liq 22 - - steel scrap kg/t.liq 130 182 - WOB kg/t.liq - 12 - ore kg/t.liq 17 14 Fluxes: - burnt lime kg/t.liq 29 47 - dolomitic lime kg/t.liq 30 18 E.O.B.: - C content % 0.047 0.061 - temperature °C 1692 1637
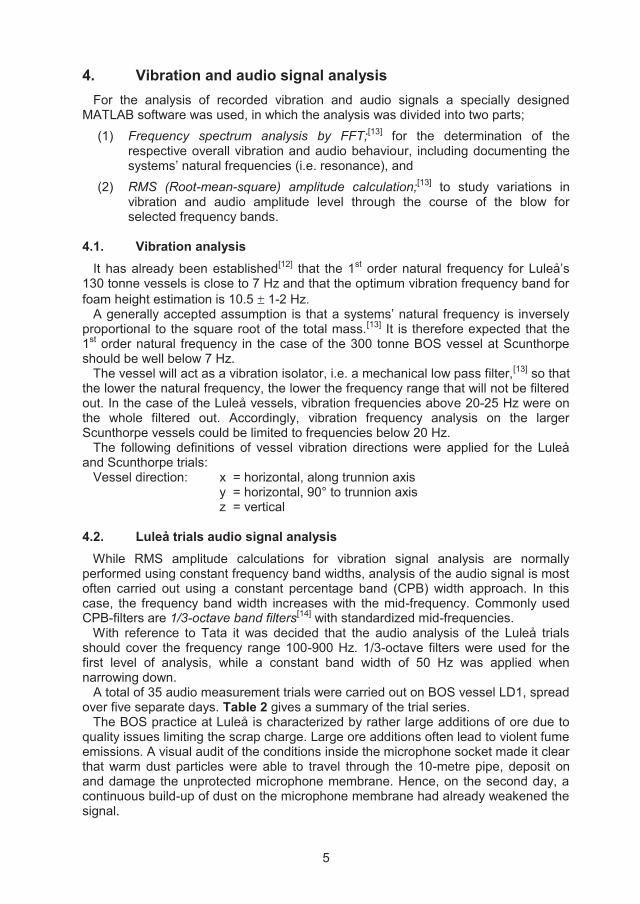
5
4. Vibration and audio signal analysis For the analysis of recorded vibration and audio signals a specially designed MATLAB software was used, in which the analysis was divided into two parts;
(1) Frequency spectrum analysis by FFT;[13] for the determination of the respective overall vibration and audio behaviour, including documenting the systems’ natural frequencies (i.e. resonance), and
(2) RMS (Root-mean-square) amplitude calculation;[13] to study variations in vibration and audio amplitude level through the course of the blow for selected frequency bands.
4.1. Vibration analysis It has already been established[12] that the 1st order natural frequency for Luleå’s 130 tonne vessels is close to 7 Hz and that the optimum vibration frequency band for foam height estimation is 10.5 1-2 Hz. A generally accepted assumption is that a systems’ natural frequency is inversely proportional to the square root of the total mass.[13] It is therefore expected that the 1st order natural frequency in the case of the 300 tonne BOS vessel at Scunthorpe should be well below 7 Hz. The vessel will act as a vibration isolator, i.e. a mechanical low pass filter,[13] so that the lower the natural frequency, the lower the frequency range that will not be filtered out. In the case of the Luleå vessels, vibration frequencies above 20-25 Hz were on the whole filtered out. Accordingly, vibration frequency analysis on the larger Scunthorpe vessels could be limited to frequencies below 20 Hz. The following definitions of vessel vibration directions were applied for the Luleå and Scunthorpe trials: Vessel direction: x = horizontal, along trunnion axis y = horizontal, 90° to trunnion axis z = vertical 4.2. Luleå trials audio signal analysis While RMS amplitude calculations for vibration signal analysis are normally performed using constant frequency band widths, analysis of the audio signal is most often carried out using a constant percentage band (CPB) width approach. In this case, the frequency band width increases with the mid-frequency. Commonly used CPB-filters are 1/3-octave band filters[14] with standardized mid-frequencies. With reference to Tata it was decided that the audio analysis of the Luleå trials should cover the frequency range 100-900 Hz. 1/3-octave filters were used for the first level of analysis, while a constant band width of 50 Hz was applied when narrowing down. A total of 35 audio measurement trials were carried out on BOS vessel LD1, spread over five separate days. Table 2 gives a summary of the trial series. The BOS practice at Luleå is characterized by rather large additions of ore due to quality issues limiting the scrap charge. Large ore additions often lead to violent fume emissions. A visual audit of the conditions inside the microphone socket made it clear that warm dust particles were able to travel through the 10-metre pipe, deposit on and damage the unprotected microphone membrane. Hence, on the second day, a continuous build-up of dust on the microphone membrane had already weakened the signal.
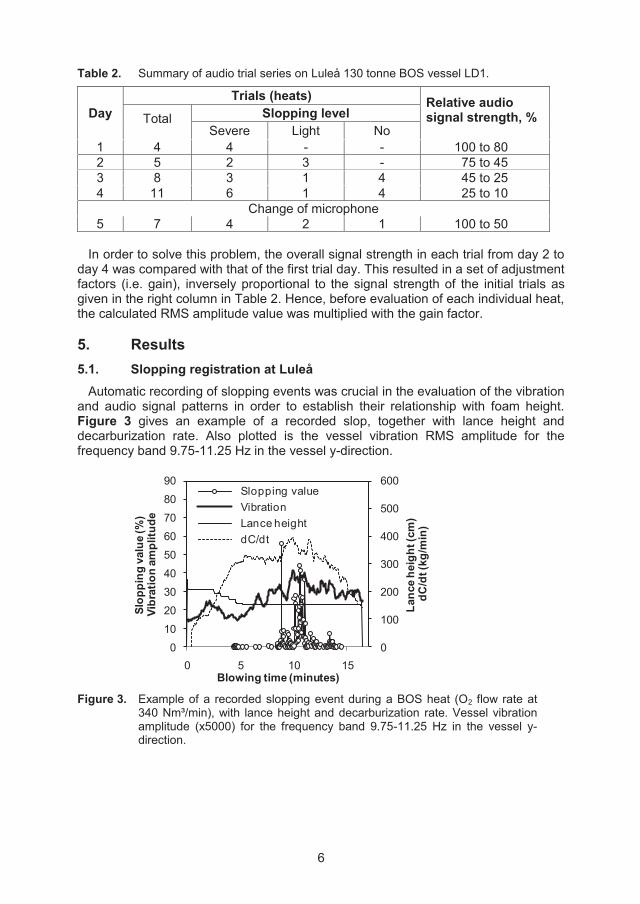
6
Table 2. Summary of audio trial series on Luleå 130 tonne BOS vessel LD1.
Day Trials (heats) Relative audio
signal strength, % Total Slopping level Severe Light No
1 4 4 - - 100 to 80 2 5 2 3 - 75 to 45 3 8 3 1 4 45 to 25 4 11 6 1 4 25 to 10
Change of microphone 5 7 4 2 1 100 to 50
In order to solve this problem, the overall signal strength in each trial from day 2 to day 4 was compared with that of the first trial day. This resulted in a set of adjustment factors (i.e. gain), inversely proportional to the signal strength of the initial trials as given in the right column in Table 2. Hence, before evaluation of each individual heat, the calculated RMS amplitude value was multiplied with the gain factor. 5. Results 5.1. Slopping registration at Luleå Automatic recording of slopping events was crucial in the evaluation of the vibration and audio signal patterns in order to establish their relationship with foam height. Figure 3 gives an example of a recorded slop, together with lance height and decarburization rate. Also plotted is the vessel vibration RMS amplitude for the frequency band 9.75-11.25 Hz in the vessel y-direction.
0
100
200
300
400
500
600
0
10
20
30
40
50
60
70
80
90
0 5 10 15
Lanc
e he
ight
(cm
) dC
/dt (
kg/m
in)
Slop
ping
val
ue (%
)Vi
brat
ion
ampl
itude
Blowing time (minutes)
Slopping valueVibrationLance heightdC/dt
Figure 3. Example of a recorded slopping event during a BOS heat (O2 flow rate at
340 Nm³/min), with lance height and decarburization rate. Vessel vibration amplitude (x5000) for the frequency band 9.75-11.25 Hz in the vessel y-direction.
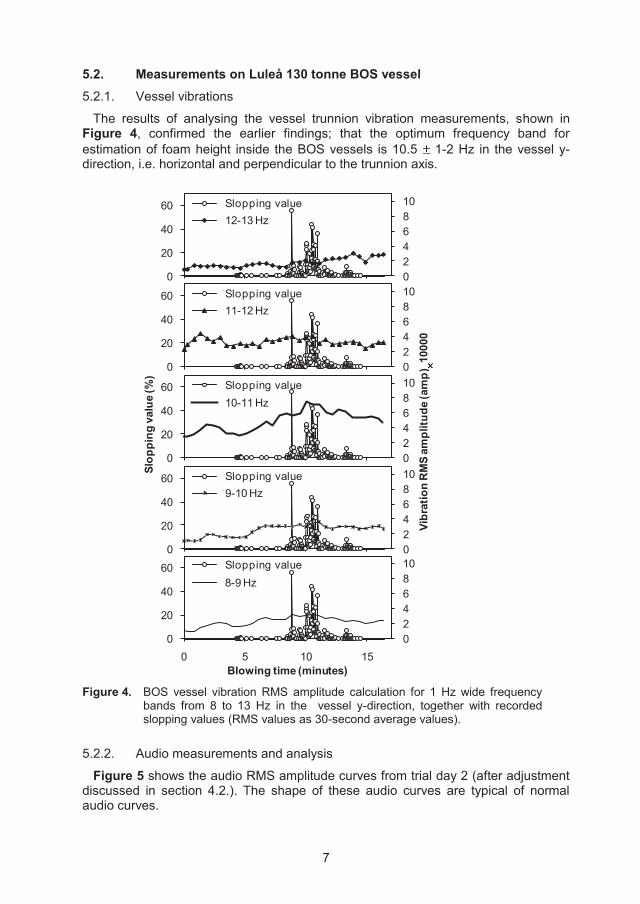
7
5.2. Measurements on Luleå 130 tonne BOS vessel 5.2.1. Vessel vibrations
The results of analysing the vessel trunnion vibration measurements, shown in Figure 4, confirmed the earlier findings; that the optimum frequency band for estimation of foam height inside the BOS vessels is 10.5 1-2 Hz in the vessel y-direction, i.e. horizontal and perpendicular to the trunnion axis.
0246810
0
20
40
60
0 5 10 15Blowing time (minutes)
Slopping value8-9 Hz
0246810
0
20
40
60 Slopping value9-10 Hz
0246810
0
20
40
60 Slopping value10-11 Hz
0246810
0
20
40
60 Slopping value11-12 Hz
0246810
0
20
40
60 Slopping value12-13 Hz
Slop
ping
val
ue (%
)
Vibr
atio
n R
MS
ampl
itude
(am
p))10
000
Figure 4. BOS vessel vibration RMS amplitude calculation for 1 Hz wide frequency
bands from 8 to 13 Hz in the vessel y-direction, together with recorded slopping values (RMS values as 30-second average values).
5.2.2. Audio measurements and analysis
Figure 5 shows the audio RMS amplitude curves from trial day 2 (after adjustment discussed in section 4.2.). The shape of these audio curves are typical of normal audio curves.
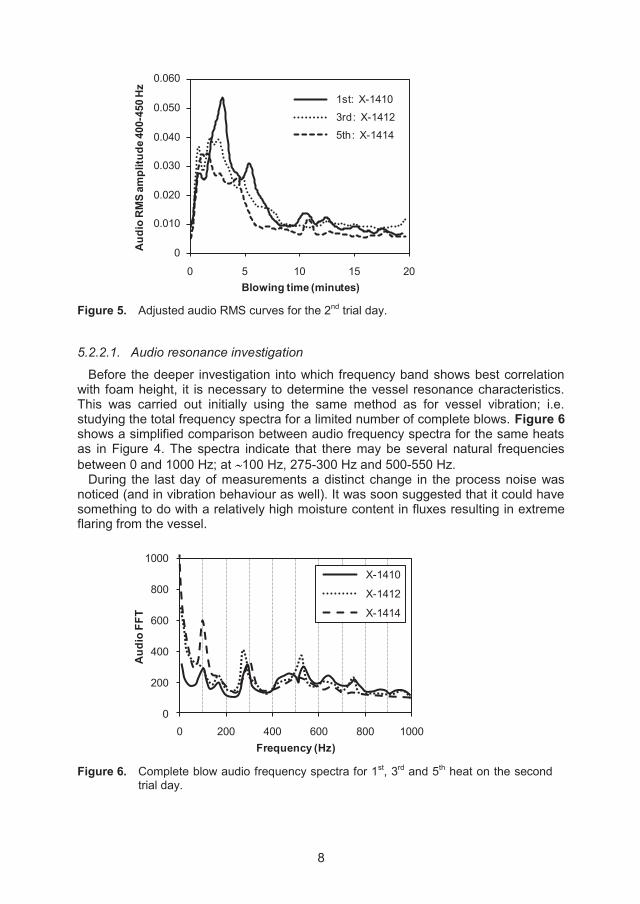
8
0,000
0,010
0,020
0,030
0,040
0,050
0,060
0 5 10 15 20
Aud
io R
MS
ampl
itude
400
-450
Hz
Blowing time (minutes)
1st: X-1410
3rd: X-14125th: X-1414
0.060
0.050
0.040
0.030
0.020
0.010
0
Figure 5. Adjusted audio RMS curves for the 2nd trial day.
5.2.2.1. Audio resonance investigation
Before the deeper investigation into which frequency band shows best correlation with foam height, it is necessary to determine the vessel resonance characteristics. This was carried out initially using the same method as for vessel vibration; i.e. studying the total frequency spectra for a limited number of complete blows. Figure 6 shows a simplified comparison between audio frequency spectra for the same heats as in Figure 4. The spectra indicate that there may be several natural frequencies between 0 and 1000 Hz; at 100 Hz, 275-300 Hz and 500-550 Hz. During the last day of measurements a distinct change in the process noise was noticed (and in vibration behaviour as well). It was soon suggested that it could have something to do with a relatively high moisture content in fluxes resulting in extreme flaring from the vessel.
0
200
400
600
800
1000
0 200 400 600 800 1000
Aud
io F
FT
Frequency (Hz)
X-1410
X-1412
X-1414
Figure 6. Complete blow audio frequency spectra for 1st, 3rd and 5th heat on the second
trial day.
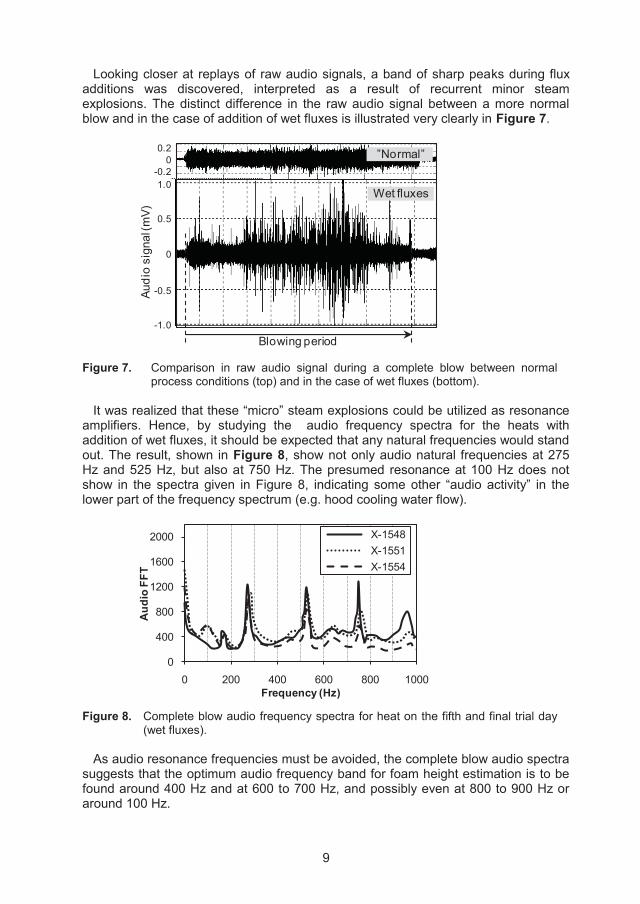
9
Looking closer at replays of raw audio signals, a band of sharp peaks during flux additions was discovered, interpreted as a result of recurrent minor steam explosions. The distinct difference in the raw audio signal between a more normal blow and in the case of addition of wet fluxes is illustrated very clearly in Figure 7.
0.20
-0.21.0
0.5
0
-0.5
-1.0
Audi
o si
gnal
(mV)
”Normal”
Wet fluxes
Blowing period
Figure 7. Comparison in raw audio signal during a complete blow between normal process conditions (top) and in the case of wet fluxes (bottom).
It was realized that these “micro” steam explosions could be utilized as resonance amplifiers. Hence, by studying the audio frequency spectra for the heats with addition of wet fluxes, it should be expected that any natural frequencies would stand out. The result, shown in Figure 8, show not only audio natural frequencies at 275 Hz and 525 Hz, but also at 750 Hz. The presumed resonance at 100 Hz does not show in the spectra given in Figure 8, indicating some other “audio activity” in the lower part of the frequency spectrum (e.g. hood cooling water flow).
0
400
800
1200
1600
2000
0 200 400 600 800 1000
Aud
io F
FT
Frequency (Hz)
X-1548X-1551X-1554
Figure 8. Complete blow audio frequency spectra for heat on the fifth and final trial day
(wet fluxes). As audio resonance frequencies must be avoided, the complete blow audio spectra suggests that the optimum audio frequency band for foam height estimation is to be found around 400 Hz and at 600 to 700 Hz, and possibly even at 800 to 900 Hz or around 100 Hz.
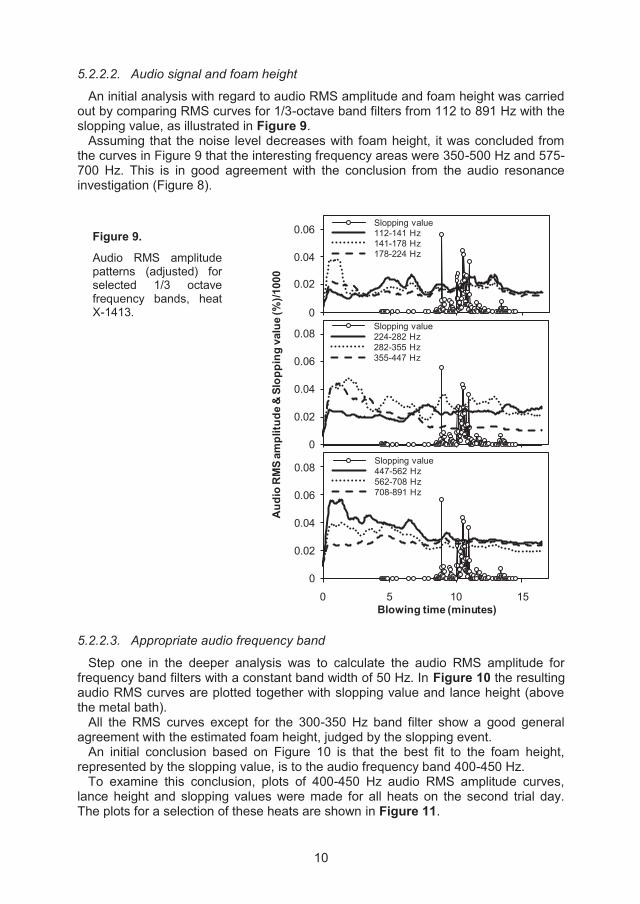
10
5.2.2.2. Audio signal and foam height
An initial analysis with regard to audio RMS amplitude and foam height was carried out by comparing RMS curves for 1/3-octave band filters from 112 to 891 Hz with the slopping value, as illustrated in Figure 9. Assuming that the noise level decreases with foam height, it was concluded from the curves in Figure 9 that the interesting frequency areas were 350-500 Hz and 575-700 Hz. This is in good agreement with the conclusion from the audio resonance investigation (Figure 8).
Figure 9.
Audio RMS amplitude patterns (adjusted) for selected 1/3 octave frequency bands, heat X-1413.
0,00
0,02
0,04
0,06
0,08
0 5 10 15Blowing time (minutes)
Slopping value447-562 Hz562-708 Hz708-891 Hz
0,00
0,02
0,04
0,06
0,08Slopping value224-282 Hz282-355 Hz355-447 Hz
0,00
0,02
0,04
0,06 Slopping value112-141 Hz141-178 Hz178-224 Hz
0.06
0.04
0.02
0
0.08
0.06
0.04
0.02
0
0.08
0.06
0.04
0.02
0
Aud
io R
MS
ampl
itude
& S
lopp
ing
valu
e (%
)/100
0
5.2.2.3. Appropriate audio frequency band
Step one in the deeper analysis was to calculate the audio RMS amplitude for frequency band filters with a constant band width of 50 Hz. In Figure 10 the resulting audio RMS curves are plotted together with slopping value and lance height (above the metal bath). All the RMS curves except for the 300-350 Hz band filter show a good general agreement with the estimated foam height, judged by the slopping event. An initial conclusion based on Figure 10 is that the best fit to the foam height, represented by the slopping value, is to the audio frequency band 400-450 Hz. To examine this conclusion, plots of 400-450 Hz audio RMS amplitude curves, lance height and slopping values were made for all heats on the second trial day. The plots for a selection of these heats are shown in Figure 11.
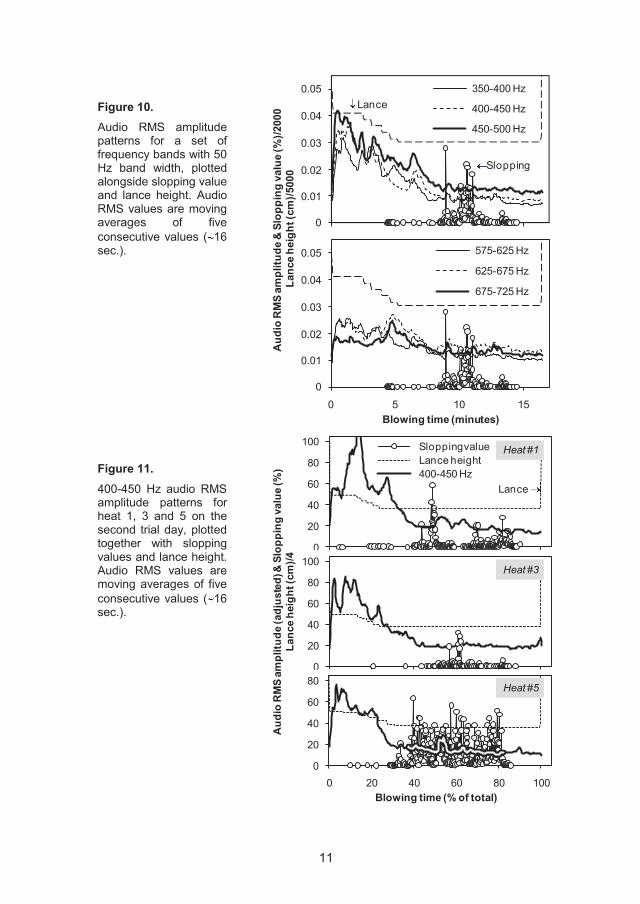
11
Figure 10. Audio RMS amplitude patterns for a set of frequency bands with 50 Hz band width, plotted alongside slopping value and lance height. Audio RMS values are moving averages of five consecutive values ( 16 sec.).
0,00
0,01
0,02
0,03
0,04
0,05 350-400 Hz
400-450 Hz
450-500 Hz
0,00
0,01
0,02
0,03
0,04
0,05
0 5 10 15Blowing time (minutes)
575-625 Hz
625-675 Hz
675-725 Hz
0.05
0.04
0.03
0.02
0.01
0
Aud
io R
MS
ampl
itude
& S
lopp
ing
valu
e (%
)/200
0 La
nce
heig
ht (c
m)/5
000
0.05
0.04
0.03
0.02
0.01
0
Lance
Slopping
Figure 11. 400-450 Hz audio RMS amplitude patterns for heat 1, 3 and 5 on the second trial day, plotted together with slopping values and lance height. Audio RMS values are moving averages of five consecutive values ( 16 sec.).
0
20
40
60
80
100 Slopping valueLance height400-450 Hz
0
20
40
60
80
100
0
20
40
60
80
0 20 40 60 80 100Blowing time (% of total)
Aud
io R
MS
ampl
itude
(adj
uste
d) &
Slo
ppin
g va
lue
(%)
Lanc
e he
ight
(cm
)/4
Lance
Heat #1
Heat #3
Heat #5
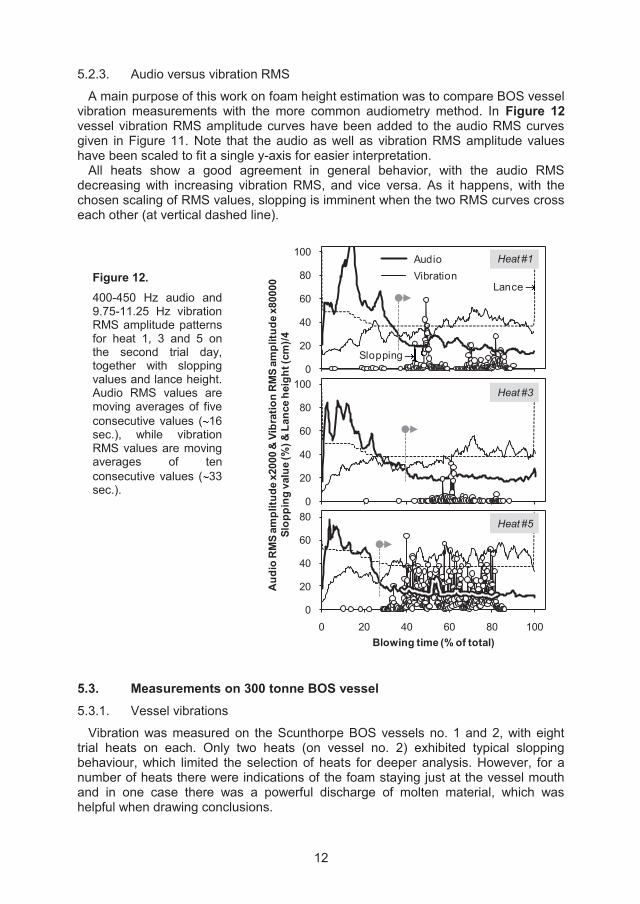
12
5.2.3. Audio versus vibration RMS
A main purpose of this work on foam height estimation was to compare BOS vessel vibration measurements with the more common audiometry method. In Figure 12 vessel vibration RMS amplitude curves have been added to the audio RMS curves given in Figure 11. Note that the audio as well as vibration RMS amplitude values have been scaled to fit a single y-axis for easier interpretation. All heats show a good agreement in general behavior, with the audio RMS decreasing with increasing vibration RMS, and vice versa. As it happens, with the chosen scaling of RMS values, slopping is imminent when the two RMS curves cross each other (at vertical dashed line).
Figure 12. 400-450 Hz audio and 9.75-11.25 Hz vibration RMS amplitude patterns for heat 1, 3 and 5 on the second trial day, together with slopping values and lance height. Audio RMS values are moving averages of five consecutive values ( 16 sec.), while vibration RMS values are moving averages of ten consecutive values ( 33 sec.).
0
20
40
60
80
0 20 40 60 80 100Blowing time (% of total)
0
20
40
60
80
1000
20
40
60
80
100AudioVibration
Aud
io R
MS
ampl
itude
x20
00 &
Vib
ratio
n R
MS
ampl
itude
x80
000
Slop
ping
val
ue (%
) & L
ance
hei
ght (
cm)/4
Lance
Slopping
Heat #1
Heat #3
Heat #5
5.3. Measurements on 300 tonne BOS vessel 5.3.1. Vessel vibrations
Vibration was measured on the Scunthorpe BOS vessels no. 1 and 2, with eight trial heats on each. Only two heats (on vessel no. 2) exhibited typical slopping behaviour, which limited the selection of heats for deeper analysis. However, for a number of heats there were indications of the foam staying just at the vessel mouth and in one case there was a powerful discharge of molten material, which was helpful when drawing conclusions.
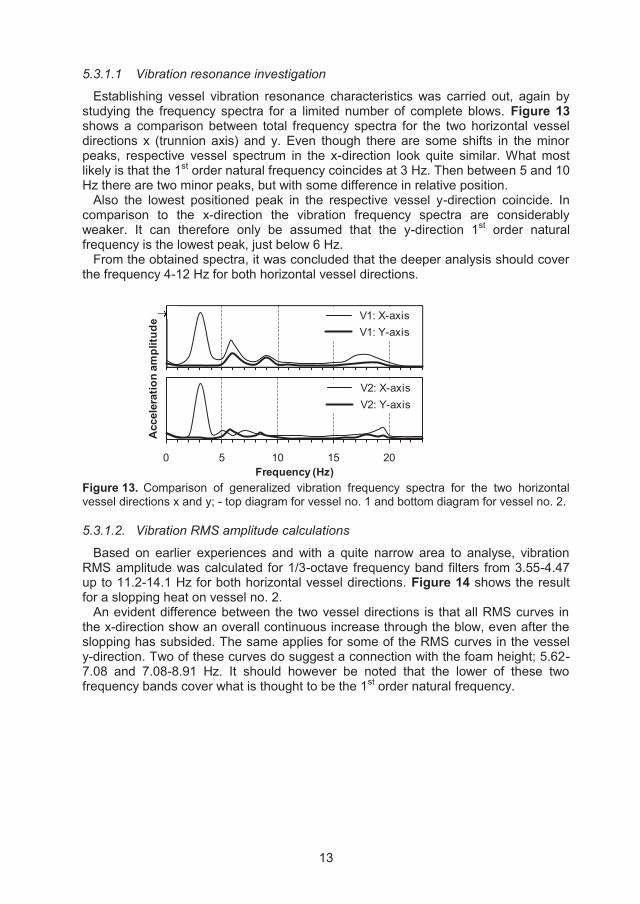
13
5.3.1.1 Vibration resonance investigation
Establishing vessel vibration resonance characteristics was carried out, again by studying the frequency spectra for a limited number of complete blows. Figure 13 shows a comparison between total frequency spectra for the two horizontal vessel directions x (trunnion axis) and y. Even though there are some shifts in the minor peaks, respective vessel spectrum in the x-direction look quite similar. What most likely is that the 1st order natural frequency coincides at 3 Hz. Then between 5 and 10 Hz there are two minor peaks, but with some difference in relative position. Also the lowest positioned peak in the respective vessel y-direction coincide. In comparison to the x-direction the vibration frequency spectra are considerably weaker. It can therefore only be assumed that the y-direction 1st order natural frequency is the lowest peak, just below 6 Hz. From the obtained spectra, it was concluded that the deeper analysis should cover the frequency 4-12 Hz for both horizontal vessel directions.
02468
10
0 5 10 15 20Frequency (Hz)
V1: X-axisV1: Y-axis
02468
10
0 5 10 15 20Frequency (Hz)
V2: X-axisV2: Y-axis
Acc
eler
atio
n am
plitu
de e
Figure 13. Comparison of generalized vibration frequency spectra for the two horizontal vessel directions x and y; - top diagram for vessel no. 1 and bottom diagram for vessel no. 2. 5.3.1.2. Vibration RMS amplitude calculations
Based on earlier experiences and with a quite narrow area to analyse, vibration RMS amplitude was calculated for 1/3-octave frequency band filters from 3.55-4.47 up to 11.2-14.1 Hz for both horizontal vessel directions. Figure 14 shows the result for a slopping heat on vessel no. 2. An evident difference between the two vessel directions is that all RMS curves in the x-direction show an overall continuous increase through the blow, even after the slopping has subsided. The same applies for some of the RMS curves in the vessel y-direction. Two of these curves do suggest a connection with the foam height; 5.62-7.08 and 7.08-8.91 Hz. It should however be noted that the lower of these two frequency bands cover what is thought to be the 1st order natural frequency.
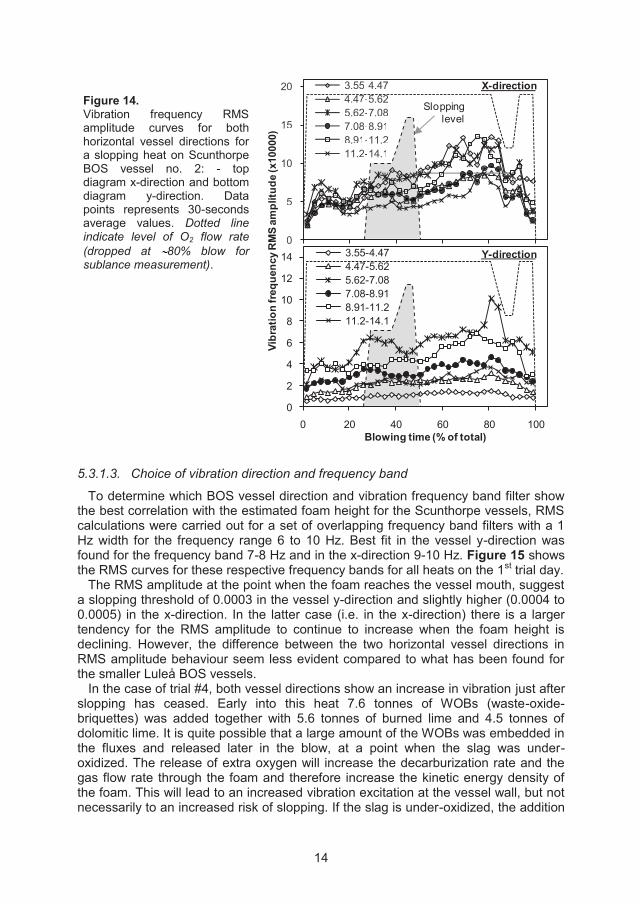
14
Figure 14. Vibration frequency RMS amplitude curves for both horizontal vessel directions for a slopping heat on Scunthorpe BOS vessel no. 2: - top diagram x-direction and bottom diagram y-direction. Data points represents 30-seconds average values. Dotted line indicate level of O2 flow rate (dropped at 80% blow for sublance measurement).
0
5
10
15
20
0 20 40 60 80 100Blowing time (% of total)
3.55-4.474.47-5.625.62-7.087.08-8.918.91-11.211.2-14.1
Vibr
atio
n fr
eque
ncy
RM
S am
plitu
de (x
1000
0)
Sloppinglevel
X-direction
Y-direction
0
2
4
6
8
10
12
14
0 20 40 60 80 100Blowing time (% of total)
3.55-4.474.47-5.625.62-7.087.08-8.918.91-11.211.2-14.1
5.3.1.3. Choice of vibration direction and frequency band
To determine which BOS vessel direction and vibration frequency band filter show the best correlation with the estimated foam height for the Scunthorpe vessels, RMS calculations were carried out for a set of overlapping frequency band filters with a 1 Hz width for the frequency range 6 to 10 Hz. Best fit in the vessel y-direction was found for the frequency band 7-8 Hz and in the x-direction 9-10 Hz. Figure 15 shows the RMS curves for these respective frequency bands for all heats on the 1st trial day. The RMS amplitude at the point when the foam reaches the vessel mouth, suggest a slopping threshold of 0.0003 in the vessel y-direction and slightly higher (0.0004 to 0.0005) in the x-direction. In the latter case (i.e. in the x-direction) there is a larger tendency for the RMS amplitude to continue to increase when the foam height is declining. However, the difference between the two horizontal vessel directions in RMS amplitude behaviour seem less evident compared to what has been found for the smaller Luleå BOS vessels. In the case of trial #4, both vessel directions show an increase in vibration just after slopping has ceased. Early into this heat 7.6 tonnes of WOBs (waste-oxide-briquettes) was added together with 5.6 tonnes of burned lime and 4.5 tonnes of dolomitic lime. It is quite possible that a large amount of the WOBs was embedded in the fluxes and released later in the blow, at a point when the slag was under-oxidized. The release of extra oxygen will increase the decarburization rate and the gas flow rate through the foam and therefore increase the kinetic energy density of the foam. This will lead to an increased vibration excitation at the vessel wall, but not necessarily to an increased risk of slopping. If the slag is under-oxidized, the addition
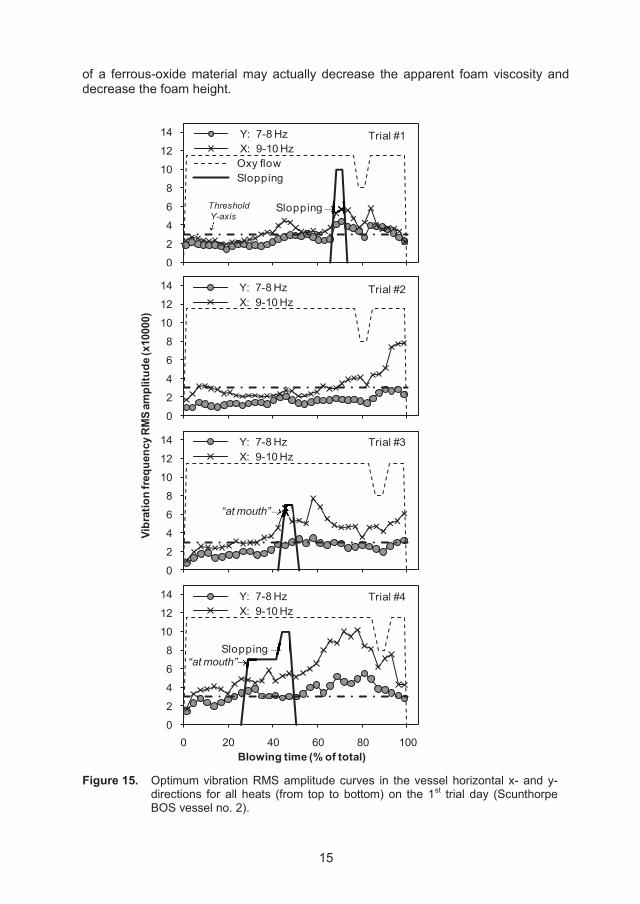
15
of a ferrous-oxide material may actually decrease the apparent foam viscosity and decrease the foam height.
0
2
4
6
8
10
12
14
0 20 40 60 80 100Blowing time (% of total)
Y: 7-8 HzX: 9-10 HzOxy flowSlopping
0
2
4
6
8
10
12
14
0 20 40 60 80 100Blowing time (% of total)
Y: 7-8 HzX: 9-10 Hz
0
2
4
6
8
10
12
14
0 20 40 60 80 100Blowing time (% of total)
Y: 7-8 HzX: 9-10 Hz
0
2
4
6
8
10
12
14
0 20 40 60 80 100Blowing time (% of total)
Y: 7-8 HzX: 9-10 Hz
Vibr
atio
n fr
eque
ncy
RM
S am
plitu
de (x
1000
0)Trial #1
Trial #2
Trial #3
Trial #4
ThresholdY-axis
Slopping
“at mouth””
Slopping “at mouth”
pp”
Figure 15. Optimum vibration RMS amplitude curves in the vessel horizontal x- and y-
directions for all heats (from top to bottom) on the 1st trial day (Scunthorpe BOS vessel no. 2).
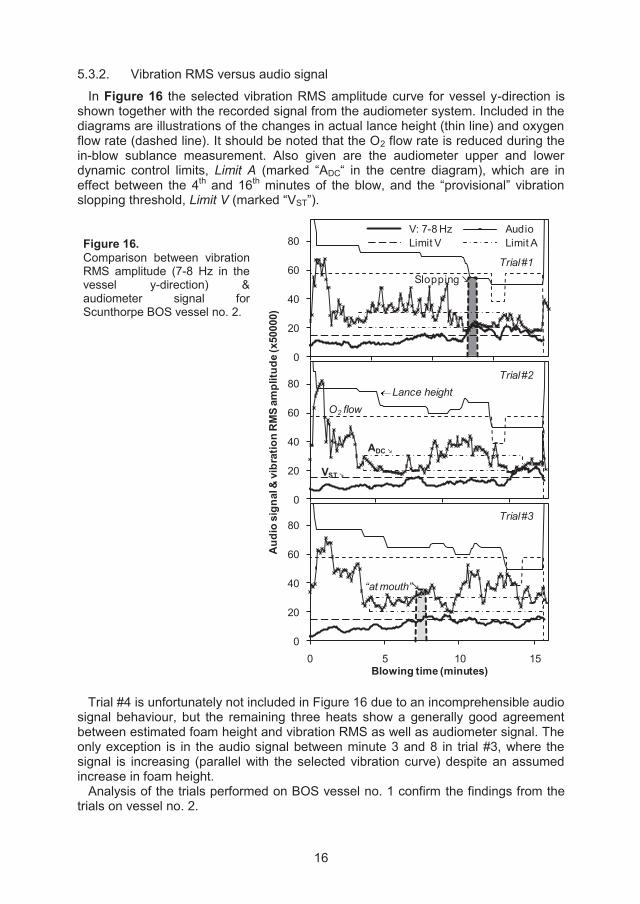
16
5.3.2. Vibration RMS versus audio signal
In Figure 16 the selected vibration RMS amplitude curve for vessel y-direction is shown together with the recorded signal from the audiometer system. Included in the diagrams are illustrations of the changes in actual lance height (thin line) and oxygen flow rate (dashed line). It should be noted that the O2 flow rate is reduced during the in-blow sublance measurement. Also given are the audiometer upper and lower dynamic control limits, Limit A (marked “ADC“ in the centre diagram), which are in effect between the 4th and 16th minutes of the blow, and the “provisional” vibration slopping threshold, Limit V (marked “VST”). Figure 16. Comparison between vibration RMS amplitude (7-8 Hz in the vessel y-direction) & audiometer signal for Scunthorpe BOS vessel no. 2.
0
20
40
60
80
0 5 10 15Blowing time (minutes)
V: 7-8 Hz AudioLimit V Limit A
Aud
io s
igna
l & v
ibra
tion
RM
S am
plitu
de (x
5000
0)
0
20
40
60
80
0 5 10 15Blowing time (minutes)
0
20
40
60
80
0 5 10 15Blowing time (minutes)
Trial #1
Trial #2
Trial #3
Slopping
Lance height
“at mouth”
O2 flow
VST
ADC
Trial #4 is unfortunately not included in Figure 16 due to an incomprehensible audio signal behaviour, but the remaining three heats show a generally good agreement between estimated foam height and vibration RMS as well as audiometer signal. The only exception is in the audio signal between minute 3 and 8 in trial #3, where the signal is increasing (parallel with the selected vibration curve) despite an assumed increase in foam height. Analysis of the trials performed on BOS vessel no. 1 confirm the findings from the trials on vessel no. 2.
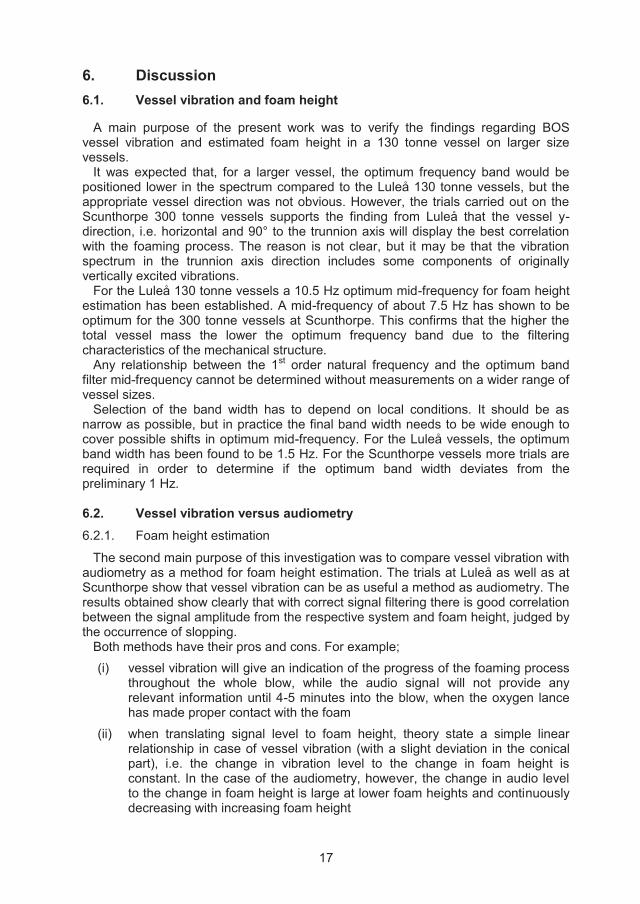
17
6. Discussion 6.1. Vessel vibration and foam height
A main purpose of the present work was to verify the findings regarding BOS vessel vibration and estimated foam height in a 130 tonne vessel on larger size vessels. It was expected that, for a larger vessel, the optimum frequency band would be positioned lower in the spectrum compared to the Luleå 130 tonne vessels, but the appropriate vessel direction was not obvious. However, the trials carried out on the Scunthorpe 300 tonne vessels supports the finding from Luleå that the vessel y-direction, i.e. horizontal and 90° to the trunnion axis will display the best correlation with the foaming process. The reason is not clear, but it may be that the vibration spectrum in the trunnion axis direction includes some components of originally vertically excited vibrations. For the Luleå 130 tonne vessels a 10.5 Hz optimum mid-frequency for foam height estimation has been established. A mid-frequency of about 7.5 Hz has shown to be optimum for the 300 tonne vessels at Scunthorpe. This confirms that the higher the total vessel mass the lower the optimum frequency band due to the filtering characteristics of the mechanical structure. Any relationship between the 1st order natural frequency and the optimum band filter mid-frequency cannot be determined without measurements on a wider range of vessel sizes. Selection of the band width has to depend on local conditions. It should be as narrow as possible, but in practice the final band width needs to be wide enough to cover possible shifts in optimum mid-frequency. For the Luleå vessels, the optimum band width has been found to be 1.5 Hz. For the Scunthorpe vessels more trials are required in order to determine if the optimum band width deviates from the preliminary 1 Hz. 6.2. Vessel vibration versus audiometry 6.2.1. Foam height estimation
The second main purpose of this investigation was to compare vessel vibration with audiometry as a method for foam height estimation. The trials at Luleå as well as at Scunthorpe show that vessel vibration can be as useful a method as audiometry. The results obtained show clearly that with correct signal filtering there is good correlation between the signal amplitude from the respective system and foam height, judged by the occurrence of slopping. Both methods have their pros and cons. For example;
(i) vessel vibration will give an indication of the progress of the foaming process throughout the whole blow, while the audio signal will not provide any relevant information until 4-5 minutes into the blow, when the oxygen lance has made proper contact with the foam
(ii) when translating signal level to foam height, theory state a simple linear relationship in case of vessel vibration (with a slight deviation in the conical part), i.e. the change in vibration level to the change in foam height is constant. In the case of the audiometry, however, the change in audio level to the change in foam height is large at lower foam heights and continuously decreasing with increasing foam height
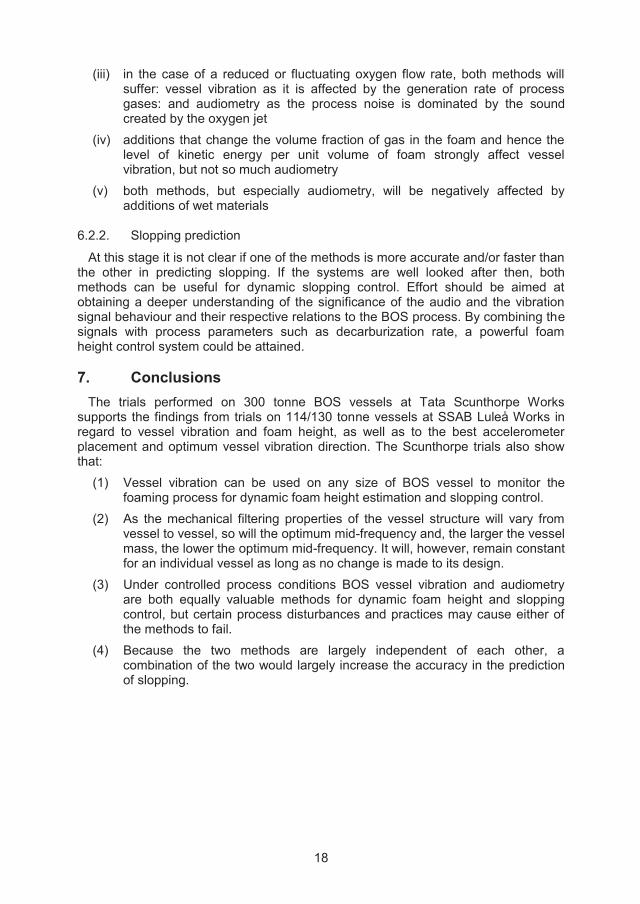
18
(iii) in the case of a reduced or fluctuating oxygen flow rate, both methods will suffer: vessel vibration as it is affected by the generation rate of process gases: and audiometry as the process noise is dominated by the sound created by the oxygen jet
(iv) additions that change the volume fraction of gas in the foam and hence the level of kinetic energy per unit volume of foam strongly affect vessel vibration, but not so much audiometry
(v) both methods, but especially audiometry, will be negatively affected by additions of wet materials
6.2.2. Slopping prediction
At this stage it is not clear if one of the methods is more accurate and/or faster than the other in predicting slopping. If the systems are well looked after then, both methods can be useful for dynamic slopping control. Effort should be aimed at obtaining a deeper understanding of the significance of the audio and the vibration signal behaviour and their respective relations to the BOS process. By combining the signals with process parameters such as decarburization rate, a powerful foam height control system could be attained. 7. Conclusions The trials performed on 300 tonne BOS vessels at Tata Scunthorpe Works supports the findings from trials on 114/130 tonne vessels at SSAB Luleå Works in regard to vessel vibration and foam height, as well as to the best accelerometer placement and optimum vessel vibration direction. The Scunthorpe trials also show that:
(1) Vessel vibration can be used on any size of BOS vessel to monitor the foaming process for dynamic foam height estimation and slopping control.
(2) As the mechanical filtering properties of the vessel structure will vary from vessel to vessel, so will the optimum mid-frequency and, the larger the vessel mass, the lower the optimum mid-frequency. It will, however, remain constant for an individual vessel as long as no change is made to its design.
(3) Under controlled process conditions BOS vessel vibration and audiometry are both equally valuable methods for dynamic foam height and slopping control, but certain process disturbances and practices may cause either of the methods to fail.
(4) Because the two methods are largely independent of each other, a combination of the two would largely increase the accuracy in the prediction of slopping.

19
Acknowledgements
The authors wish to acknowledge that the experimental work and analysis presented in this article was carried out with a financial grant from the Research Fund for Coal and Steel of the European Community. It should also be acknowledged that this publication is a part of an industrial PhD work carried out at the Division of Extractive Metallurgy, Luleå University of Technology, and linked to the PRISMA Centre for Process Integration in Steelmaking, a research centre located at Swerea MEFOS which is supported by Scandinavian mining and metallurgical industries and by VINNOVA (The Swedish Governmental Agency for Innovation Systems), SSF (The Swedish Foundation for Strategic Research) and KK-stiftelsen (The Knowledge Foundation, a research financier for Swedish institutions for higher education). References
[1] T. Kanai, A. Sakai, J. Tani, S. Yoshida and N. Matsui: Proc. of 2nd European Oxygen Steelmaking Congress, AIM, Milan, (1997), 267.
[2] J. W. K. van Boggelen: Proc. of 5th European Oxygen Steelmaking Conference, Steel Inst. VDEh, Aachen, (2006), 108, CD-ROM.
[3] C. Bencini and A. Poli: Proc. of 76th Steelmaking Conference, Iron & Steel Society, Warrendale, PA, (1993), 193.
[4] J. Ruuska, S. Ollila, L. Bååth and K. Leiviskä: Proc. of 5th European Oxygen Steelmaking Conference, Steel Inst. VDEh, Aachen, (2006), 210, CD-ROM.
[5] Y. Iida, K. Emoto, M. Ogawa, Y. Masuda, M. Onishi, H. Yamada: Trans. ISIJ, 24 (1984), 540.
[6] T. Takawa, K. Katayama, K. Katohgi and T. Kuribayashi: Trans. Iron Steel Inst. Jpn., 28(1988), 59.
[7] P. G. Garnica, R. D. Morales and N. U. Rodríguez: Proc. of Metallurgical Processes for Early Twenty-First Century, TMS, Warrendale, PA, USA, (1994), 631.
[8] M. S. Millman, L. Bååth, D. Malmberg and E. Price: Proc. of 2nd Int. Congress on the Science and Technology of Steelmaking, Vol. 1, University of Wales, Swansea, (2001), 309.
[9] T. Saito, I. Tsubone, M. Azuma, H. Yamana and H. Takezoe: Tetso-to-Hagané (JISJ), 76(1990), 1978.
[10] D. Malmberg, P. Hahlin and E. Nilsson: ISIJ Int., 47(2007), 553. [11] R. Bruckhaus, V. Fiedler and H. Lachmund: Revue de Métallurgi, June(2001), 533. [12] M. Brämming, S. Millman, A. Overbosch, A. Kapilashrami, D. Malmberg, B. Björkman:
to be published in ISIJ Int., Vol.51 (2011), No.1, January 2011. [13] L. Beranek, I. Vér: Noise and vibration control engineering, Wiley-Interscience, John
Wiley & Sons, Inc., New York, ISBN 0-471-61751-2, 566. [14] M. P. Norton: Fundamentals of noise and vibration analysis for engineers, Cambridge
University Press, ISBN 0-521-34941-9, 264.