Embed Size (px)
Citation preview
Avondale
City of
Communicating BudgetReductions
GFOA AZFebruary 2009

Avondale
City of
Financial Forecast
Fiscal Update2nd Quarter FY 2009
Avondale
City of
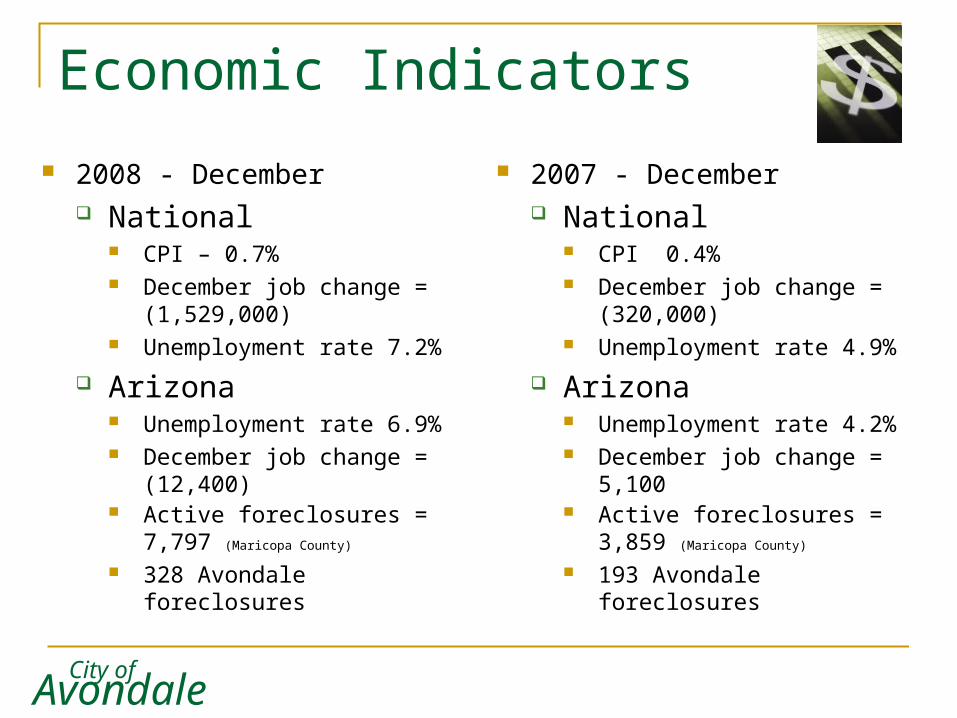
Economic Indicators
2008 - December National
CPI – 0.7% December job change =
(1,529,000) Unemployment rate 7.2%
Arizona Unemployment rate 6.9% December job change =
(12,400) Active foreclosures = 7,797
(Maricopa County)
328 Avondale foreclosures
2007 - December National
CPI 0.4% December job change =
(320,000) Unemployment rate 4.9%
Arizona Unemployment rate 4.2% December job change =
5,100 Active foreclosures = 3,859
(Maricopa County)
193 Avondale foreclosures
Avondale
City of
State Revenues
Shared Sales Tax December sales tax collections were down
(16.4)% compared to December 2007 and were $(79.7) million short of the monthly forecast.
14.8% projected annual loss = $920,000 to Avondale
Income Tax December individual income tax collections were
down (6.2)% compared to December 2007 and were $(43.1) million below forecast.
Avondale
City of
State Revenues
Auto In-Lieu Tax FY 2009 YTD Disbursement to Avondale $100,00
below 2007 (7.5% below City forecast)
HURF FY 2009 YTD Disbursement $348,000 below
2007 (14% below City forecast)
Avondale
City of
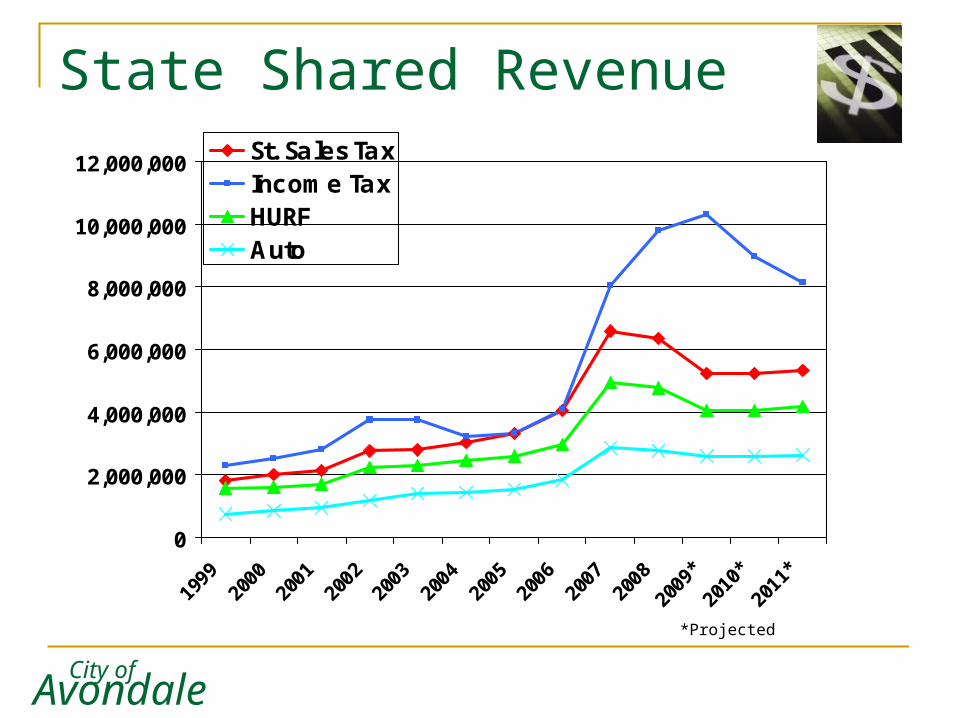
State Shared Revenue
0
2,000,000
4,000,000
6,000,000
8,000,000
10,000,000
12,000,000
1999
2000
2001
2002
2003
2004
2005
2006
2007
2008
2009
*
2010
*
2011
*
St. Sales TaxIncome TaxHURFAuto
*Projected
Avondale
City of
Local Revenues
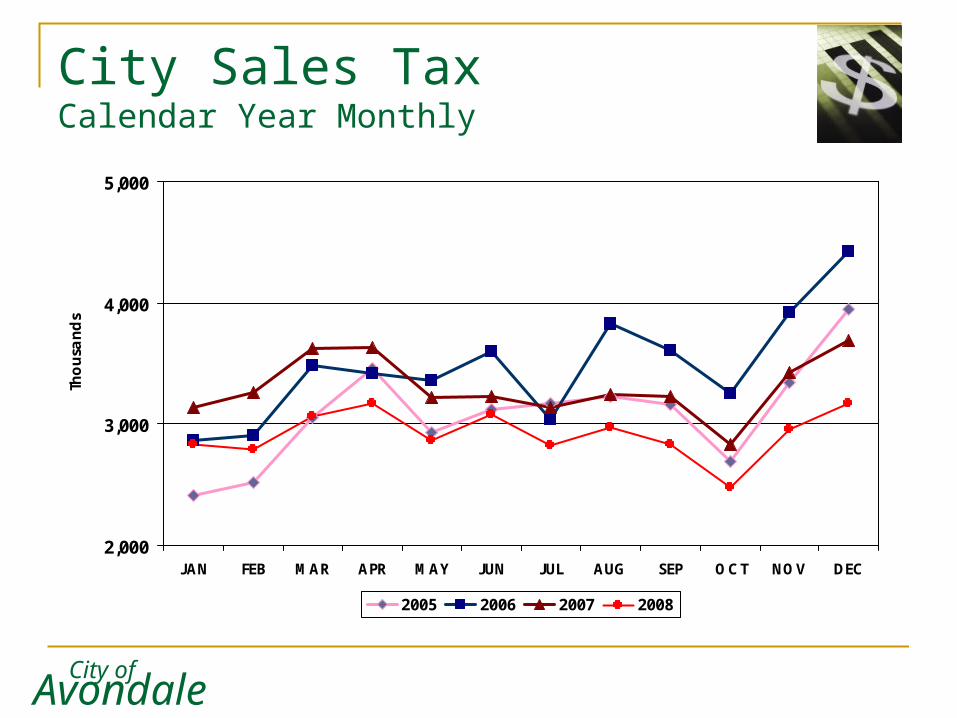
Sales Tax Six month collections $2.2 million or 11.3% below
forecast Six month collections below same six months
prior year $2.4 million or -12%. Development Revenue
Single family permits total 39 year to date – 38% below forecast
Avondale
City of
City Sales TaxCalendar Year Monthly
2,000
3,000
4,000
5,000
JAN FEB MAR APR MAY JUN JUL AUG SEP OCT NOV DEC
Thousa
nds
2005 2006 2007 2008
Avondale
City of
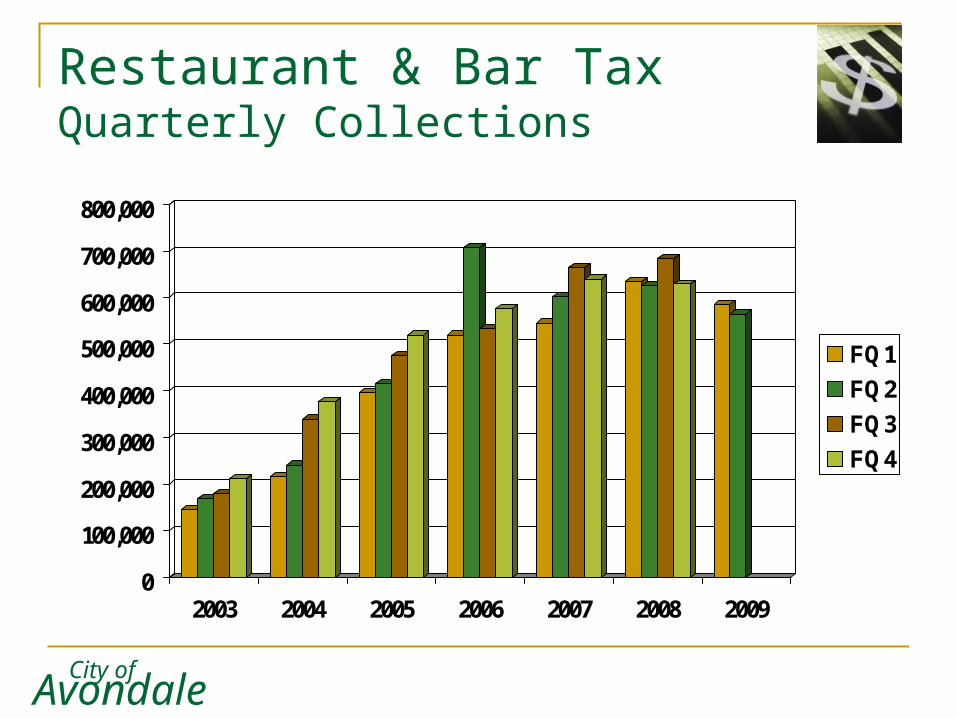
Restaurant & Bar TaxQuarterly Collections
0
100,000
200,000
300,000
400,000
500,000
600,000
700,000
800,000
2003 2004 2005 2006 2007 2008 2009
FQ1FQ2FQ3FQ4
Avondale
City of
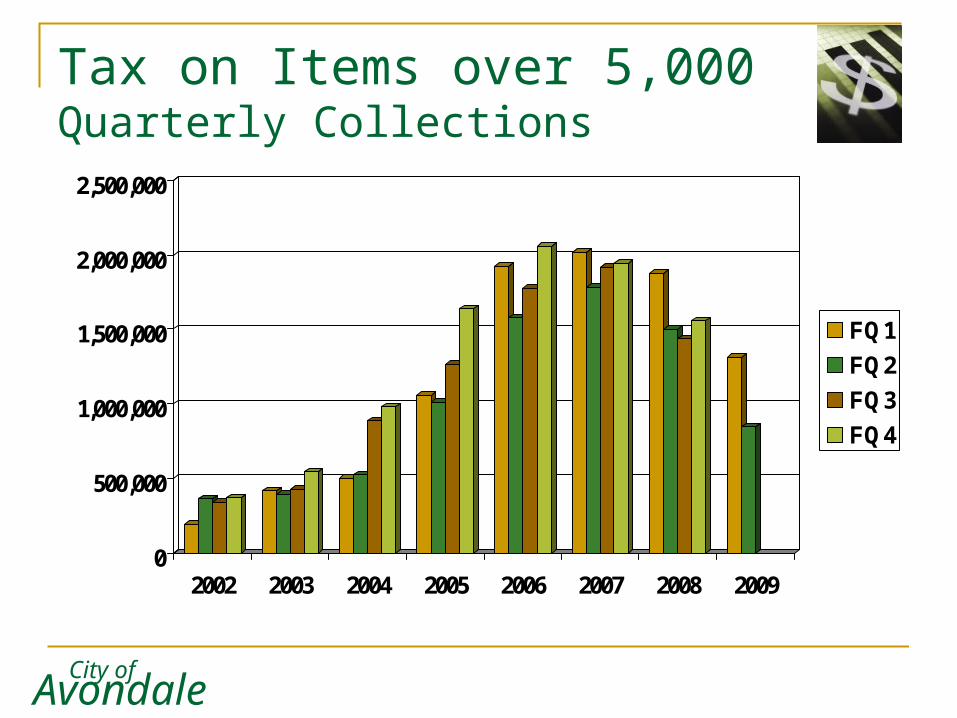
Tax on Items over 5,000Quarterly Collections
0
500,000
1,000,000
1,500,000
2,000,000
2,500,000
2002 2003 2004 2005 2006 2007 2008 2009
FQ1FQ2FQ3FQ4
Avondale
City of
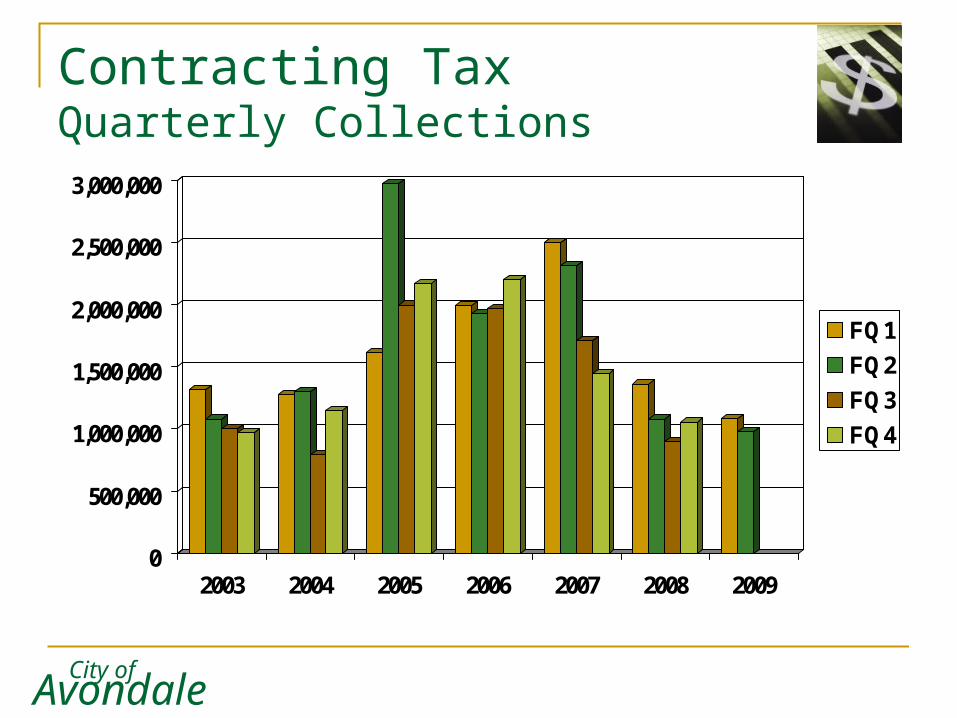
Contracting TaxQuarterly Collections
0
500,000
1,000,000
1,500,000
2,000,000
2,500,000
3,000,000
2003 2004 2005 2006 2007 2008 2009
FQ1FQ2FQ3FQ4
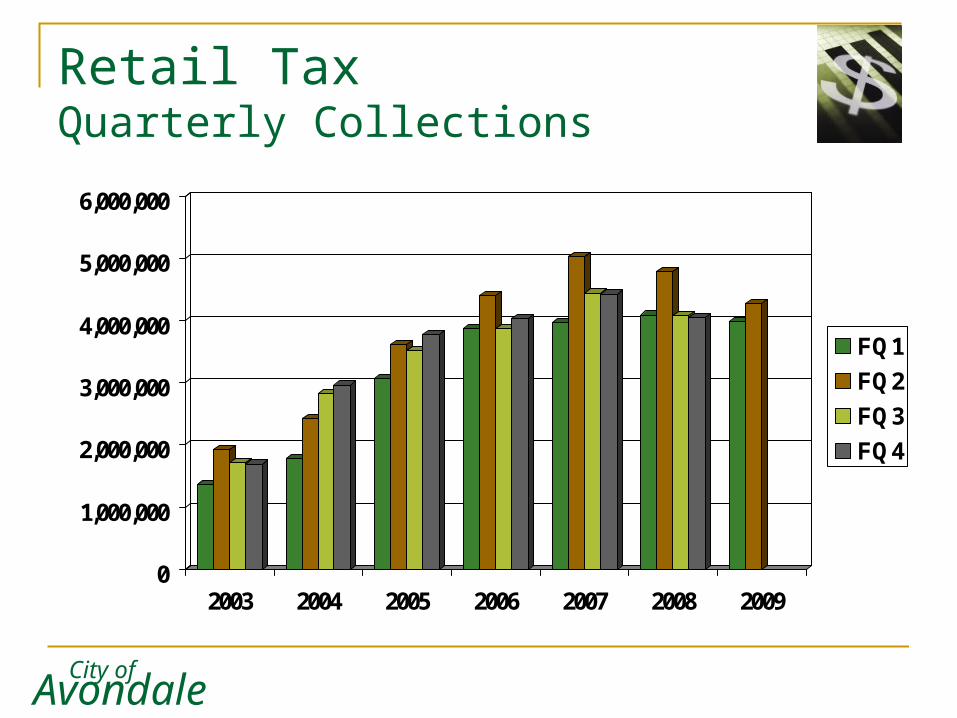
Avondale
City of
Retail TaxQuarterly Collections
0
1,000,000
2,000,000
3,000,000
4,000,000
5,000,000
6,000,000
2003 2004 2005 2006 2007 2008 2009
FQ1FQ2FQ3FQ4
Avondale
City of
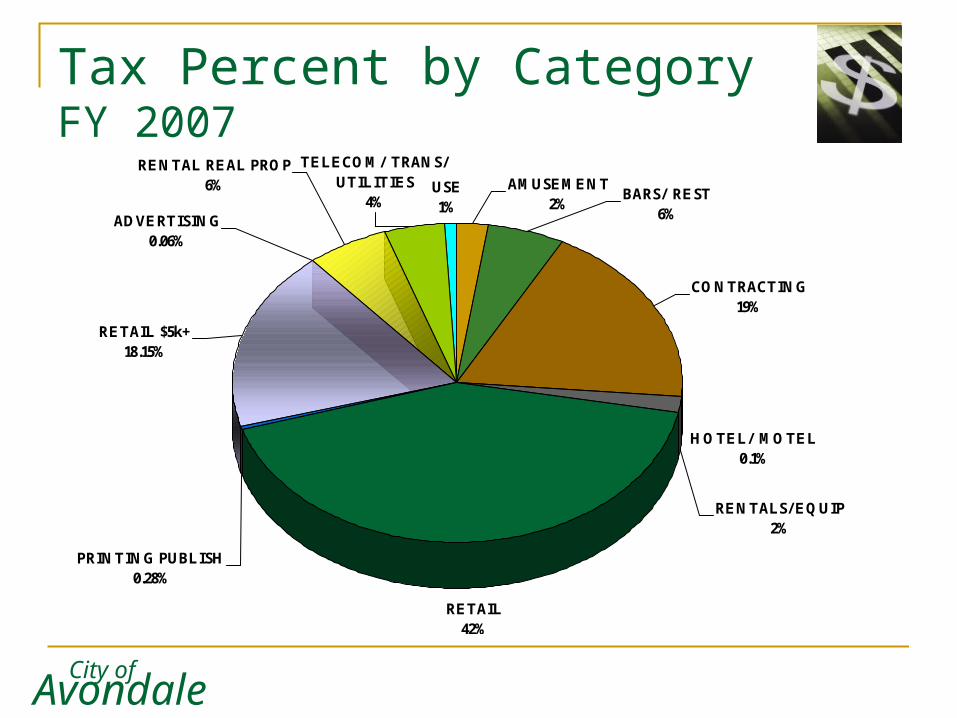
Tax Percent by CategoryFY 2007
RETAIL42%
USE1%
TELECOM/ TRANS/ UTILITIES
4%
HOTEL/ MOTEL0.1%
RENTALS/EQUIP2%
PRINTING PUBLISH0.28%
ADVERTISING0.06%
RETAIL $5k+18.15%
BARS/ REST6%
AMUSEMENT2%
CONTRACTING19%
RENTAL REAL PROP6%
Avondale
City of
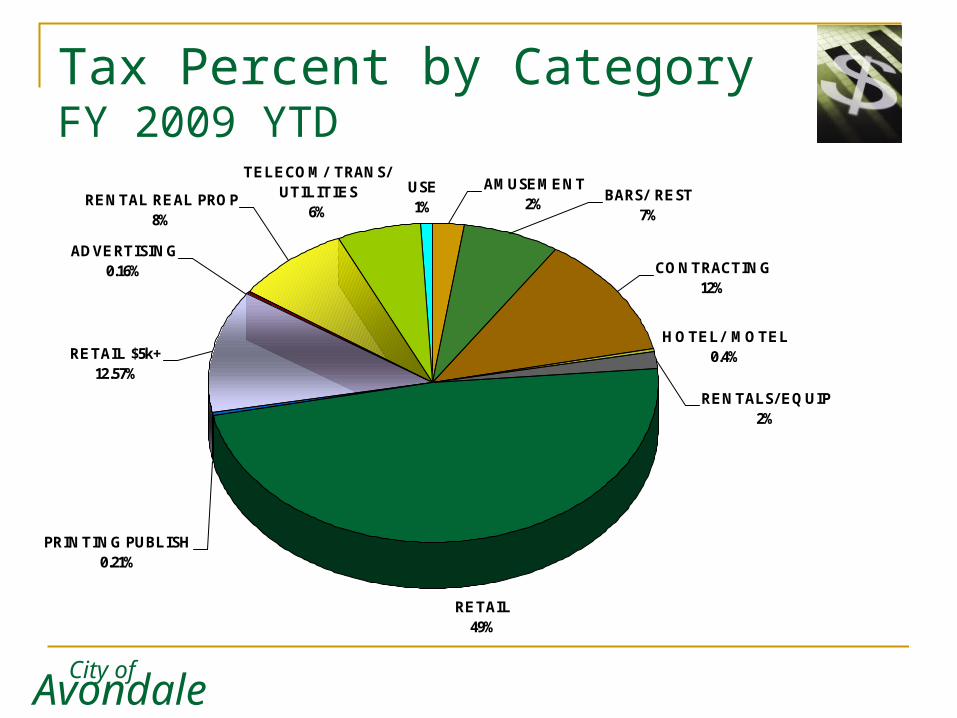
Tax Percent by CategoryFY 2009 YTD
RETAIL49%
TELECOM/ TRANS/ UTILITIES
6%
USE1%
HOTEL/ MOTEL0.4%
RENTALS/EQUIP2%
PRINTING PUBLISH0.21%
ADVERTISING0.16%
RETAIL $5k+12.57%
BARS/ REST7%
AMUSEMENT2%
CONTRACTING12%
RENTAL REAL PROP8%
Avondale
City of
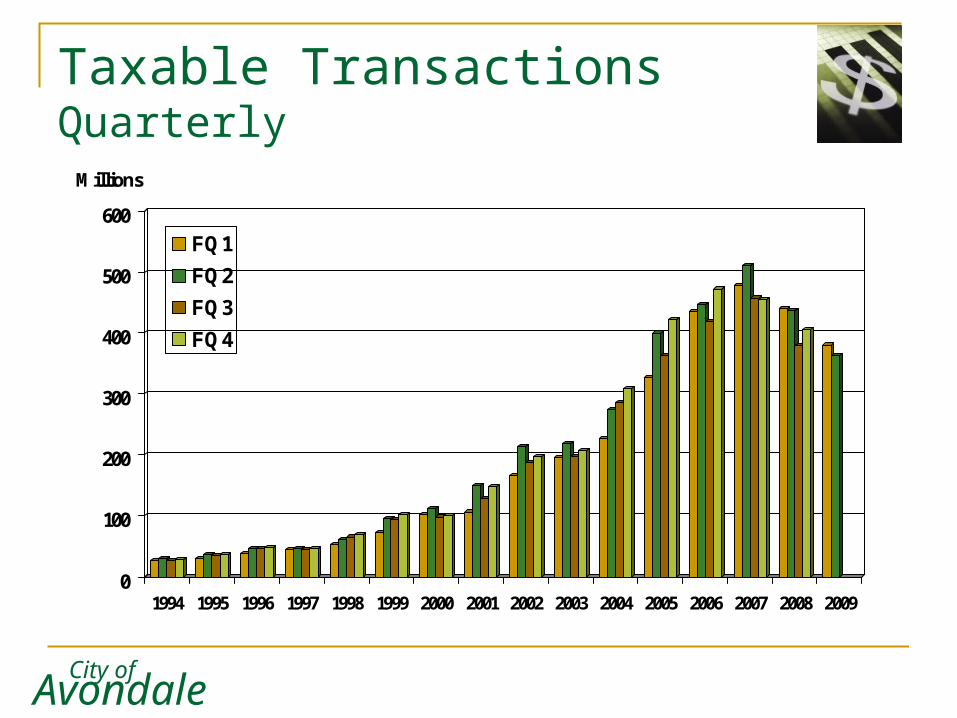
Taxable TransactionsQuarterly
0
100
200
300
400
500
600
Millions
1994 1995 1996 1997 1998 1999 2000 2001 2002 2003 2004 2005 2006 2007 2008 2009
FQ1
FQ2
FQ3
FQ4
Avondale
City of
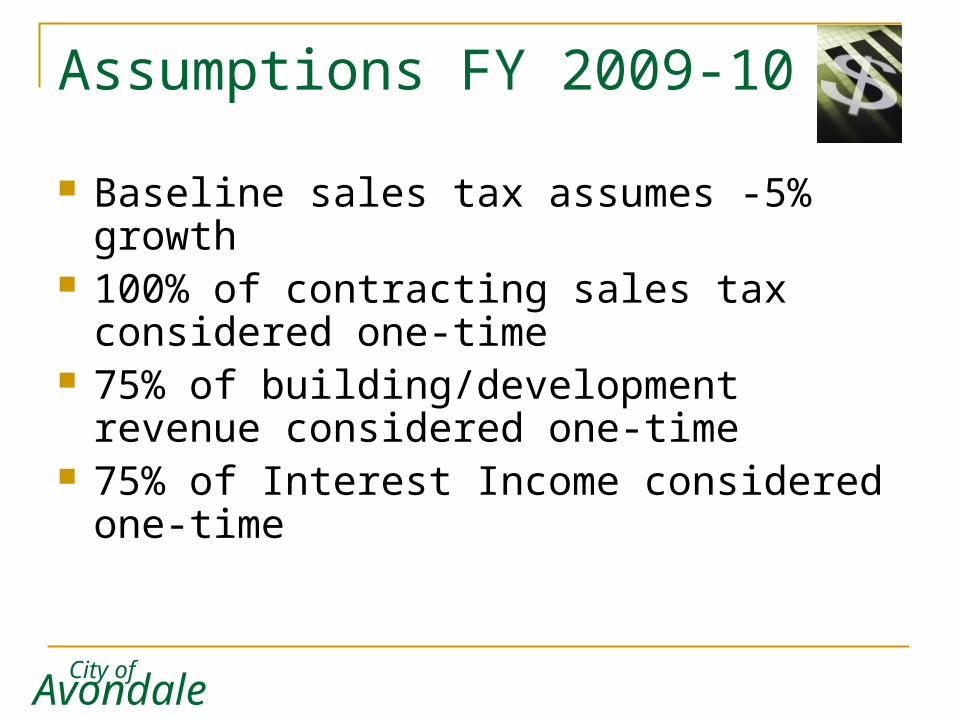
Assumptions FY 2009-10
Baseline sales tax assumes -5% growth 100% of contracting sales tax considered
one-time 75% of building/development revenue
considered one-time 75% of Interest Income considered one-time
Avondale
City of
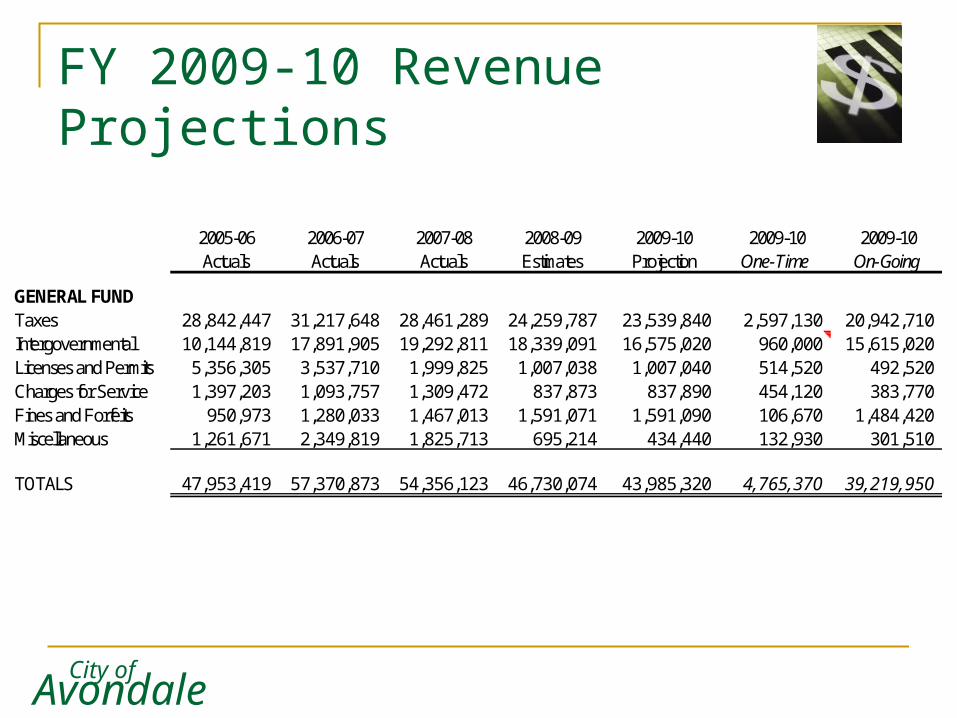
FY 2009-10 RevenueProjections
2005-06 2006-07 2007-08 2008-09 2009-10 2009-10 2009-10Actuals Actuals Actuals Estimates Projection One-Time On-Going
GENERAL FUNDTaxes 28,842,447 31,217,648 28,461,289 24,259,787 23,539,840 2,597,130 20,942,710 Intergovernmental 10,144,819 17,891,905 19,292,811 18,339,091 16,575,020 960,000 15,615,020 Licenses and Permits 5,356,305 3,537,710 1,999,825 1,007,038 1,007,040 514,520 492,520 Charges for Service 1,397,203 1,093,757 1,309,472 837,873 837,890 454,120 383,770 Fines and Forfeits 950,973 1,280,033 1,467,013 1,591,071 1,591,090 106,670 1,484,420 Miscellaneous 1,261,671 2,349,819 1,825,713 695,214 434,440 132,930 301,510
TOTALS 47,953,419 57,370,873 54,356,123 46,730,074 43,985,320 4,765,370 39,219,950
Avondale
City of
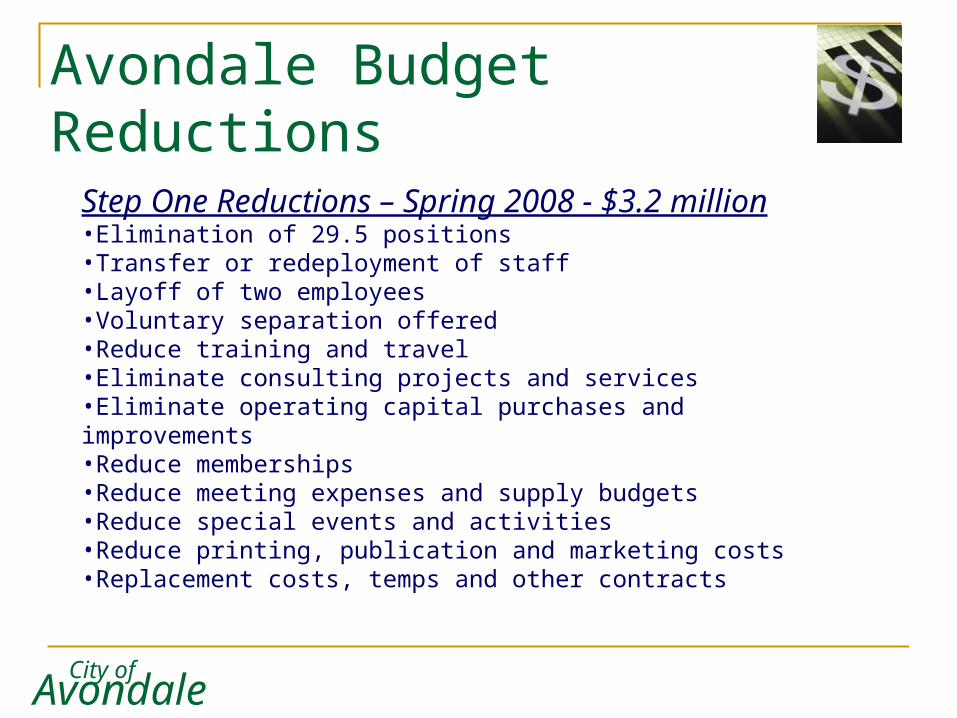
Avondale Budget Reductions
Step One Reductions – Spring 2008 - $3.2 million•Elimination of 29.5 positions•Transfer or redeployment of staff•Layoff of two employees•Voluntary separation offered•Reduce training and travel•Eliminate consulting projects and services•Eliminate operating capital purchases and improvements•Reduce memberships•Reduce meeting expenses and supply budgets•Reduce special events and activities•Reduce printing, publication and marketing costs•Replacement costs, temps and other contracts

Avondale
City of
Avondale Budget Reductions
Step Two Reductions – December 2008 - $3.6 millionContracting out for services – $153,000Reduction in force - $1,198,960Eliminating special events for one year $110,000 + O/T (not including RIF)State of the City $2,500Northwest Public Safety Facility $1,100,000 (net)Eliminating the Neighborhood Traffic Management Program (NTMP) $200,000Cashion Community Center Conversion $58,500Contributions Assistance Program $40,000Youth Non-Profit Sports Voucher Program $32,500New Life Center $25,000Line items/Other - $670,000Elimination of 46 positionsLayoff of 20 employees
Avondale
City of
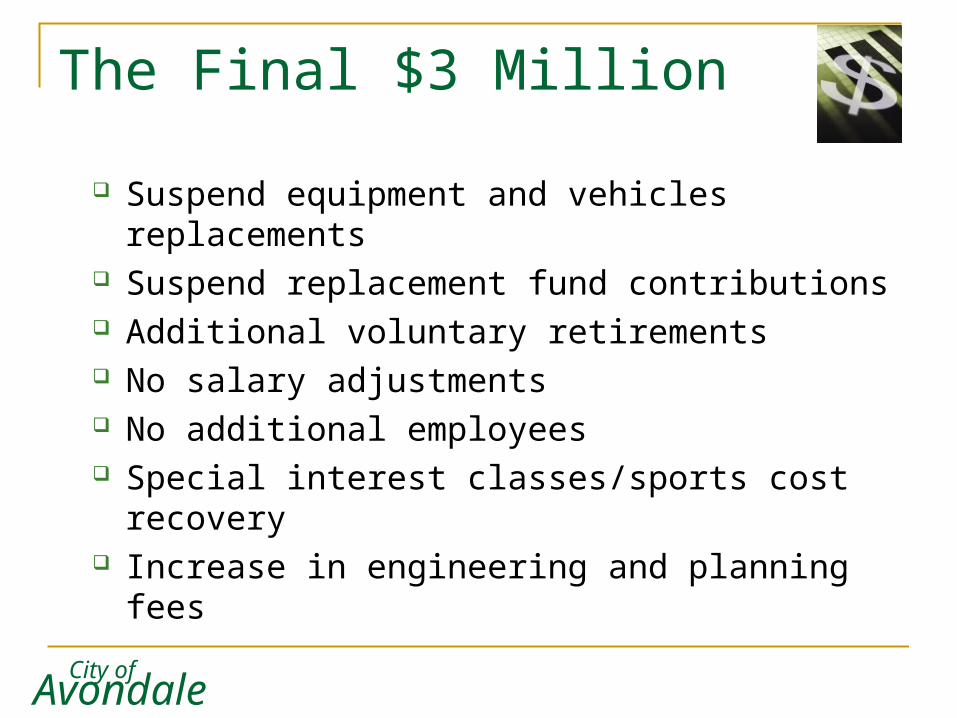
The Final $3 Million
Suspend equipment and vehicles replacements Suspend replacement fund contributions Additional voluntary retirements No salary adjustments No additional employees Special interest classes/sports cost recovery Increase in engineering and planning fees
Avondale
City of
Transition Assistance
2 weeks base pay + 1 week for each year capped at 12 weeks
$3,000 for 90 days of medical premiums Outplacement services including skills
training, professional resume service, interviewing assistance

Avondale
City of
Questions?
March 2009