Embed Size (px)
Citation preview
1
Awareness and necessity of the campaign RESEARCH REPORT 2012 may

2
Research goal
To probe the awareness and necessity of the advertising campaign “Protect me, I’m small”.
Method
Direct interview at the respondents home, using computer (CAPI – Computer Assisted Personal Interview).
Sample
15-74 aged inhabitants of Lithuania
Recruitment
Respondents were selected representatively: sampling is distributed geographically so that it’s proportions would correspond with data from Lithuania’s department of statistics.
Survey performed
2012 may 10 – 16
Client: "Paramos vaikams centras” Latvių g. 19A LT-08113 Vilnius www.pvc.lt
Executive: "Socialinės informacijos centras“ Greenhall, Upės g. 21, LT-08128 Vilnius www.sic.lt
Project manager: Dalia Olšauskė tel.: 5 205 4515 [email protected]
Report was prepared by:
Dalia Olšauskė
Agnė Šimkūnaitė
Dovilė Barauskaitė

3
Considering the fact that the campaign is not a typical TV commercial and that without TV and radio, more niche informational channels were chosen, awareness of the campaign is high. 39% of inhabitants of Lithuania have seen or heard either promotional or informational material of the campaign. Also 14% of inhabitants claim that they have heard about this campaign, though they have not came across to promotional or informational material.
The biggest part of audience was reached by radio advertisement. Overall, radio advertisement was heard by 22% of inhabitants.
The promotional message was clear. 76% of all respondents at least partially understood the message correctly. Totally correctly the message was comprehended by 55% of all respondents.
Inhabitants consider the campaign “Protect me, I’m small” to be necessary. 86% of respondents feel the need for this campaign.
Summary

4
Notice and perception of the advertisement

5
39% of Lithuania’s inhabitants have
seen or heard either promotional or
informational material of the
campaign. Also 14% of inhabitants
claim that they have heard about this
campaign, though they have not
came across to promotional or
informational material.
Mostly persons of 20-29 y.o. and
families with children under 3 y.o.
have seen the advertisement.
Women, persons of 40-49 y.o.,
respondents with higher education,
employed and families with children
over 3 y.o. more often claim that they
have heard about this campaign,
although particular promotional or
informational material they haven’t
seen/heard.
Look at: sectional information in the
appendix
Percentage is calculated from all respondents, N=503
Have seen promotional/infor
mational material39%
Have heard about the campaign,
although haven’t seen the material
14%
Do not have any knowledge about
the particular campaign
47%

6
Percentage is calculated from all respondents, N=503
The biggest party of audience was reached by the radio advertisement. 11% of respondents heard about this campaign only through this channel (unique channel attraction). Overall 22% of inhabitants have heard radio advertisement, yet a part of them came across to this information also in other ways.
The commercial was seen by 16% of respondents. In general, this promotional alternative attracted 7% of unique viewers. Considering the fact that advertisement didn’t have a wide grid in the television and more niche ways of reaching (public transport or internet) were used, the indicator is quite good.
The smallest part of audience was reached by booklets, posters and stickers.
14% of respondents heard about the campaign from several sources. It is so called the synergetic effect of advertisement. Information that reached inhabitants from several channels is more certain and more memorable.
In the appendix the sectional information is presented.
Unique channel attraction General channel attraction
16%
22%
11%
11%
14%
47%
7%
11%
4%
3%
14%
14%
47%
Saw the advertisement on TV/internet/publictransport
Heard the advertisement on the radio
Saw a booklet
Saw a sticker or a poster
Saw the advertisement through severalchannels
Heard about the campaign, although did notsee any material
Do not have any knowledge about theparticular advertisement

7
Percentage is calculated from all respondents, N=503
Regardless of whether the respondent has
ever came across to the informational
material of the campaign before the
research or not, he/she was asked to
indicate what this advertisement is about.
76% of all the respondents at least
partially understood the message
correctly. Totally correctly the message
was comprehended by 55% of all
respondents.
Most often respondents replied quiet
abstractedly that advertisement is about
the safety of children, their protection or
simply just about kids.
We must have in mind that each
respondent could have indicated several
answers, thus after coding their answers
the common expression of percentage is
higher than 100%. The proportion of
correct promotional message (ratings next
to the graph) is recorded only if at least
one answer of respondent indicates the
correct perception, thus the proportion is
converged into 100%.
21%
34%
At least partially comprehended message 76%
24%
Uncompre- hended message 24%
21%
8%
5%
5%
3%
3%
28%
12%
18%
2%
2%
0%
2%
5%
18%
Taking care of children, their
protection
Responsible, positive parenthood
About parenting, education,
training
More communications, attention
and love to children
About children weakness,
sensibility, gentle behaviour…
About children safety/protection
Violence against children
About children, childhood
About the relations of children
and their pareants, tpaternity,…
Other (advertisement
comprehended not correctly)
Negative response about the
advertisement
Positive response about the
advertisement
Incorrect comprehension of the
advertisement
Did not understand, did not know
or did not indicate

8
Percentage is calculated from those who have seen the advertisement, N=194
Respondents who have seen the
advertisement before the research
more often comprehended it
correctly.
79% of these persons at least
partially understood the message
correctly and 61% comprehended it
completely correctly.
24%
37%
At least partially comprehended message 79%
21%
Uncompre- hended message 21%
18%
8%
5%
5%
3%
3%
28%
12%
18%
2%
2%
0%
2%
5%
18%
Taking care of children, their
protection
Responsible, positive
parenthood
About parenting, education,
training
More communications,
attention and love to children
About children weakness,
sensibility, gentle behaviour…
About children
safety/protection
Violence against children
About children, childhood
About the relations of children
and their pareants,…
Other (advertisement
comprehended not correctly)
Negative response about the
advertisement
Positive response about the
advertisement
Incorrect comprehension of
the advertisement
Did not understand, did not
know or did not indicate
12%
5%
3%
4%
2%
32%
12%
15%
2%
3%
0,3%
2%
8%
10%
Taking care of children, their
protection
Responsible, positive parenthood
About parenting, education,
training
More communications, attention
and love to children
About children weakness,
sensibility, gentle behaviour with…
About children safety/protection
Violence against children
About children, childhood
About the relations of children and
their pareants, tpaternity,…
Other (advertisement
comprehended not correctly)
Negative response about the
advertisement
Positive response about the
advertisement
Incorrect comprehension of the
advertisement
Did not understand, did not know
or did not indicate

9
53%
68%
55%
41%
33%
21%
35%
42%
5%
4%
4%
5%
4%
2%
3%
5%
6%
5%
3%
7%
All respondents (N=503)
Those who have seen the promotional/ informationalmaterial (N=194)
Those who have heard about the campaign, thoughhaven't seen any material (N=70)
Haven't heard/ seen (N=239)
Very necessary Probably necessary Probably unnecessary Really unnecessary Hard to say
Inhabitants consider the campaign “Protect me, I’m small” to be necessary (86%).
Respondents who have seen the advertisement, persons under 39 y.o., employed, inhabitants that do not have a family and representatives of families with children more often than other inhabitants believe that the campaign “Protect me, I’m small” is necessary.
In the appendix sectional information is presented.
+
+ -
-
Percentage is calculated from those who have seen the advertisement, N=194

10
*Correct message comprehension is calculated from those who have seen the advertisement
In order to fully understand the indicators of the campaign, it is proper to compare them with other advertisements.
Unfortunately, available indicators of social sector advertisements cover very narrow target groups or their active period is very long, thus it’s not possible to compare data with them. However, we can use the available TV commercial indicators from financial an telecommunications sectors.
Data shows that the campaign have reached excellent results. Considering the fact that TV commercial in the campaign constituted only a small informational part, the notice of informational/ promotional material is quiet high. Moreover, although it is transmitted not a particular service or product, yet an abstract idea, the perception of promotional message is quiet high.
Noticed advertisement Correctly comprehended the message*
39%
61%
43%
63%
75%
65%
Advertisement "Protect me, I'm small" Financial sector advertisements Telecomunications sector advertisements

11
Appendix

12
Occupation
Employed
Not working
Martial status
Married/ living with a partner
Single
Divorced/ widowed
Children
Don't have children
Have children up to 3 y/o
Have just 4-16 y/o children
Income
Up to 500 Lt
501-800 Lt
801-1000 Lt
1001 Lt and more
Did not indicate
32%
46%
54%
52%
26%
23%
67%
12%
22%
29%
30%
15%
14%
12%
Percentage is calculated from all respondents, N=300
Gender
Male
Female
Age
15-19 y/o
20-29 y/o
30-39 y/o
40-49 y/o
50-59 y/o
60-74 y/o
Education
Primary, basic
Secondary
Advanced vocational education
Higher
Region
Vilnius
Other city
Other town
Village
47%
53%
9%
19%
16%
19%
16%
20%
22%
33%
19%
26%
18%
23%
27%
32%

13
Percentage presented in rows. Green color marks a statistically higher values, red – lower.
Sample Have seen promotional/ informational material
Have hear about the campaign, although
haven’t seen the material
Do not have any knowledge about the particular campaign
Gender Male 234 37% 11% 53%
Female 269 40% 17% 43%
Age
15-19 y/o 44 48% 13% 39%
20-29 y/o 97 49% 16% 35%
30-39 y/o 82 36% 11% 53%
40-49 y/o 97 39% 23% 37%
50-59 y/o 82 34% 15% 51%
60-74 y/o 100 29% 5% 66%
Education
Primary, basic 110 34% 8% 58%
Secondary 168 38% 9% 53%
Advanced vocational education 96 34% 19% 47%
Higher 129 46% 22% 32%
Region
Vilnius 92 42% 18% 40%
Other city 114 34% 10% 55%
Other town 135 36% 16% 48%
Village 162 41% 13% 46%
Occupation Employed 232 39% 18% 43%
None working 271 38% 10% 51%
Marital status
Married/living with a partner 260 40% 16% 44%
Single 130 41% 14% 45%
Divorced/widowed 113 33% 8% 59%
Children
Don’t have children 335 34% 13% 53%
Do have children up to 3 y/o 59 55% 8% 37%
Have just 4-16 y/o children 109 45% 20% 35%
Income
Up to 500 Lt 146 34% 12% 54%
501-800 Lt 152 41% 12% 47%
801-1000 Lt 77 30% 24% 46%
1001 Lt and more 69 46% 12% 41%
Did not indicate 59 48% 11% 41%
All respondents 503 39% 14% 47%
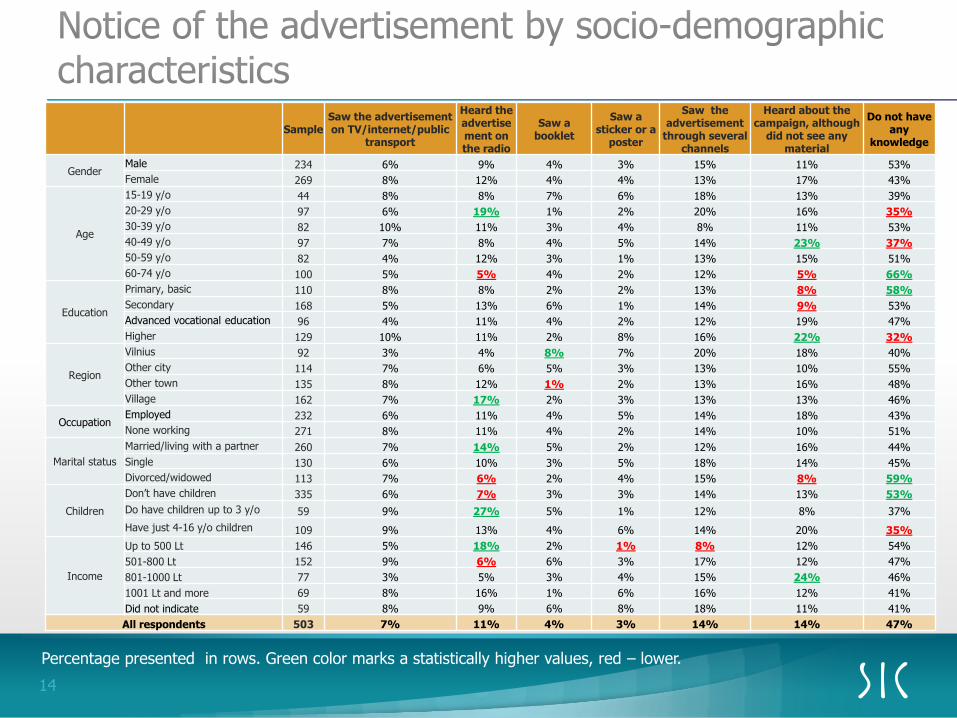
14
Sample Saw the advertisement on TV/internet/public
transport
Heard the advertisement on the radio
Saw a booklet
Saw a sticker or a
poster
Saw the advertisement
through several channels
Heard about the campaign, although
did not see any material
Do not have any
knowledge
Gender Male 234 6% 9% 4% 3% 15% 11% 53%
Female 269 8% 12% 4% 4% 13% 17% 43%
Age
15-19 y/o 44 8% 8% 7% 6% 18% 13% 39%
20-29 y/o 97 6% 19% 1% 2% 20% 16% 35%
30-39 y/o 82 10% 11% 3% 4% 8% 11% 53%
40-49 y/o 97 7% 8% 4% 5% 14% 23% 37%
50-59 y/o 82 4% 12% 3% 1% 13% 15% 51%
60-74 y/o 100 5% 5% 4% 2% 12% 5% 66%
Education
Primary, basic 110 8% 8% 2% 2% 13% 8% 58%
Secondary 168 5% 13% 6% 1% 14% 9% 53%
Advanced vocational education 96 4% 11% 4% 2% 12% 19% 47%
Higher 129 10% 11% 2% 8% 16% 22% 32%
Region
Vilnius 92 3% 4% 8% 7% 20% 18% 40%
Other city 114 7% 6% 5% 3% 13% 10% 55%
Other town 135 8% 12% 1% 2% 13% 16% 48%
Village 162 7% 17% 2% 3% 13% 13% 46%
Occupation Employed 232 6% 11% 4% 5% 14% 18% 43%
None working 271 8% 11% 4% 2% 14% 10% 51%
Marital status
Married/living with a partner 260 7% 14% 5% 2% 12% 16% 44%
Single 130 6% 10% 3% 5% 18% 14% 45%
Divorced/widowed 113 7% 6% 2% 4% 15% 8% 59%
Children
Don’t have children 335 6% 7% 3% 3% 14% 13% 53%
Do have children up to 3 y/o 59 9% 27% 5% 1% 12% 8% 37%
Have just 4-16 y/o children 109 9% 13% 4% 6% 14% 20% 35%
Income
Up to 500 Lt 146 5% 18% 2% 1% 8% 12% 54%
501-800 Lt 152 9% 6% 6% 3% 17% 12% 47%
801-1000 Lt 77 3% 5% 3% 4% 15% 24% 46%
1001 Lt and more 69 8% 16% 1% 6% 16% 12% 41%
Did not indicate 59 8% 9% 6% 8% 18% 11% 41%
All respondents 503 7% 11% 4% 3% 14% 14% 47%
Percentage presented in rows. Green color marks a statistically higher values, red – lower.

15
Sample Necessary Unnecessary Hard to say
Gender Male 234 85% 10% 5%
Female 269 88% 7% 6%
Age
15-19 y/o 44 99% 1%
20-29 y/o 97 93% 5% 1%
30-39 y/o 82 94% 2% 4%
40-49 y/o 97 78% 13% 9%
50-59 y/o 82 89% 6% 5%
60-74 y/o 100 75% 16% 10%
Education
Primary, basic 110 80% 14% 6%
Secondary 168 84% 7% 8%
Advanced vocational education 96 91% 6% 2%
Higher 129 91% 5% 4%
Region
Vilnius 92 93% 5% 2%
Other city 114 90% 6% 4%
Other town 135 89% 3% 8%
Village 162 77% 16% 7%
Occupation Employed 232 90% 8% 2%
None working 271 83% 8% 9%
Marital status
Married/living with a partner 260 85% 8% 6%
Single 130 94% 4% 2%
Divorced/widowed 113 80% 13% 7%
Children
Don’t have children 335 83% 10% 7%
Have children up to 3 y/o 59 91% 1% 8%
Have just 4-16 y/o children 109 94% 6% 0,5%
Income
Up to 500 Lt 146 83% 11% 6%
501-800 Lt 152 85% 9% 6%
801-1000 Lt 77 90% 3% 7%
1001 Lt and more 69 92% 7% 1%
Did not indicate 59 84% 9% 7%
All respondents 503 86% 8% 6%
Percentage presented in rows. Green color marks a statistically higher values, red – lower.
16
simplicity · intelligence · challenge