Embed Size (px)
Citation preview
35067 Mahogany Glen Drive, Winchester, CA 92596 951.294.0841 619.839.3980 fax
Axene Health Partners, LLC Health Actuaries & Consultants
www.axenehp.com
David V. Axene, FCA, FSA, MAAA [email protected]
August 25, 2010 Mr. Adam M. Cole General Counsel California Department of Insurance 45 Fremont Street Suite 2300 San Francisco, CA 94105 Re: Review of Blue Shield of California Rate Filing Dear Adam: We have completed our review of the BSC Rate Filing as requested. Our assignment was as follows:
Review current BSC rate filing to become familiar with them, the benefit plans, rating structure and methodologies used to develop rates and rate increases
Review correspondence between the Department and BSC regarding rates and rate filings
Familiarize ourselves with extensive data provided to the Department by BSC regarding these rates, rate filings, and rate increases
Develop list of additional information needed from BSC, communicate that to the Department, and request from BSC
Identify all key actuarial assumptions used by BSC to prepare information for rate filing
Evaluate all key actuarial assumptions
Independently develop sample rates for validation and comparison to BSC rates
Validate BSC calculations to determine appropriateness and accuracy
Test rates to determine whether they meet loss ratio requirements of the Department (i.e., the 70% lifetime loss ratio rule)
Clarify our understanding of Department’s position on loss ratio testing and what elements can be included to satisfy the loss ratio requirements.
Provide oral report as soon as information is available

Adam M. Cole August 25, 2010 Page 2 of 23
35067 Mahogany Glen Drive, Winchester, CA 92596 951.294.0841 619.839.3980 fax
Communicate with the department on a regular basis as to progress on project and any interim findings
Prepare written report for Department
Present findings of report as directed by department (i.e., hearing, etc.) We have accessed a significant number of materials for this review including multiple additional data requests from BSC. This information was collected by the California Department of Insurance and provided by them to us for our analysis. We independently reviewed this information without direct communication with or explanation by BSC staff. We developed multiple data requests and lists of questions that BSC responded to. We do not have any concern about our understanding of the information. If any of the information we reviewed was incomplete or inaccurate, our findings and conclusions may be affected. We have assumed that the responses provided by BSC are complete and accurate. We are not expressing an opinion about the accuracy of the information provided BSC. We are not aware of any effort by BSC to misrepresent any of the information we reviewed. Summary of Findings Our key findings are as follows:
BSC has priced these policies using a policy lifetime average duration which has the effect of increasing early year prices higher than they need to be to pay claims in anticipation of greater claims in later policy years. This "front loading" of policies is consistent with a pricing model that would establish active life reserves for these policies, essentially retaining excess funds until later policy years when required to pay claims greater than the average. Historically, BSC did not establish active life reserves. We recommend that BSC either remove this "front loading" or establish active life reserves. We are advised that BSC now is establishing active life reserves at the direction of the Department.
We found no material errors in the BSC rate filing, other than the previously mentioned information.
The BSC methodology used to both make rates and develop the lifetime loss ratio was straightforward and relatively easy to follow (i.e., much easier to follow and understand than other company filings)
With only a few minor exceptions, BSC sets premiums for each of their plans to achieve a specific lifetime durational factor. These exceptions have been associated with plans with limited sales volume. This practice is consistent with a practice that also establishes active life reserves. Because
Adam M. Cole August 25, 2010 Page 3 of 23
35067 Mahogany Glen Drive, Winchester, CA 92596 951.294.0841 619.839.3980 fax
the company has now agreed to establish these reserves, this practice is reasonable and acceptable to the Department.
With only a few minor exceptions, BSC sets premiums for each of their plans to achieve a specific lifetime durational factor. These exceptions have been associated with plans with limited sales volume. This practice is consistent with a practice that also establishes active life reserves. Since the company has not established these, this practice is not reasonable and not acceptable to the Department.
BSC has appropriately grouped plans without credible experience to comply with the Department requirements
BSC underlying PPO trend assumptions are reasonable and slightly below our assumptions. BSC has reasonably adjusted trend for the impact of deductible leveraging.
BSC’s overall lifetime loss ratio is 81.6% based upon a premium and claims trend of 18% in the outyears. Reducing this to a 10% level to be consistent with the Department’s recommendations in the Anthem Blue Cross filing reduces the lifetime loss ratio to 78.7%.
BSC’s assumption that future rate increases will be less than claim cost increases further increases the lifetime loss ratio above what is would be in an environment that matches rate increases to increases in claims cost. Adjusting for this results in lower rates. In the aggregate we would expect rates 2% - 3% lower than requested.
BSC used reasonable lapse rate assumptions.
Sensitivity analysis performed on BSC assumptions showed no major concern areas.
The filed rate structure does not meet the requirements of the Patient Protection and Affordable Care Act of 2010 and California Insurance Code, Section 10140.2(a) (i.e., gender specific rates) and will need additional adjustments to comply.
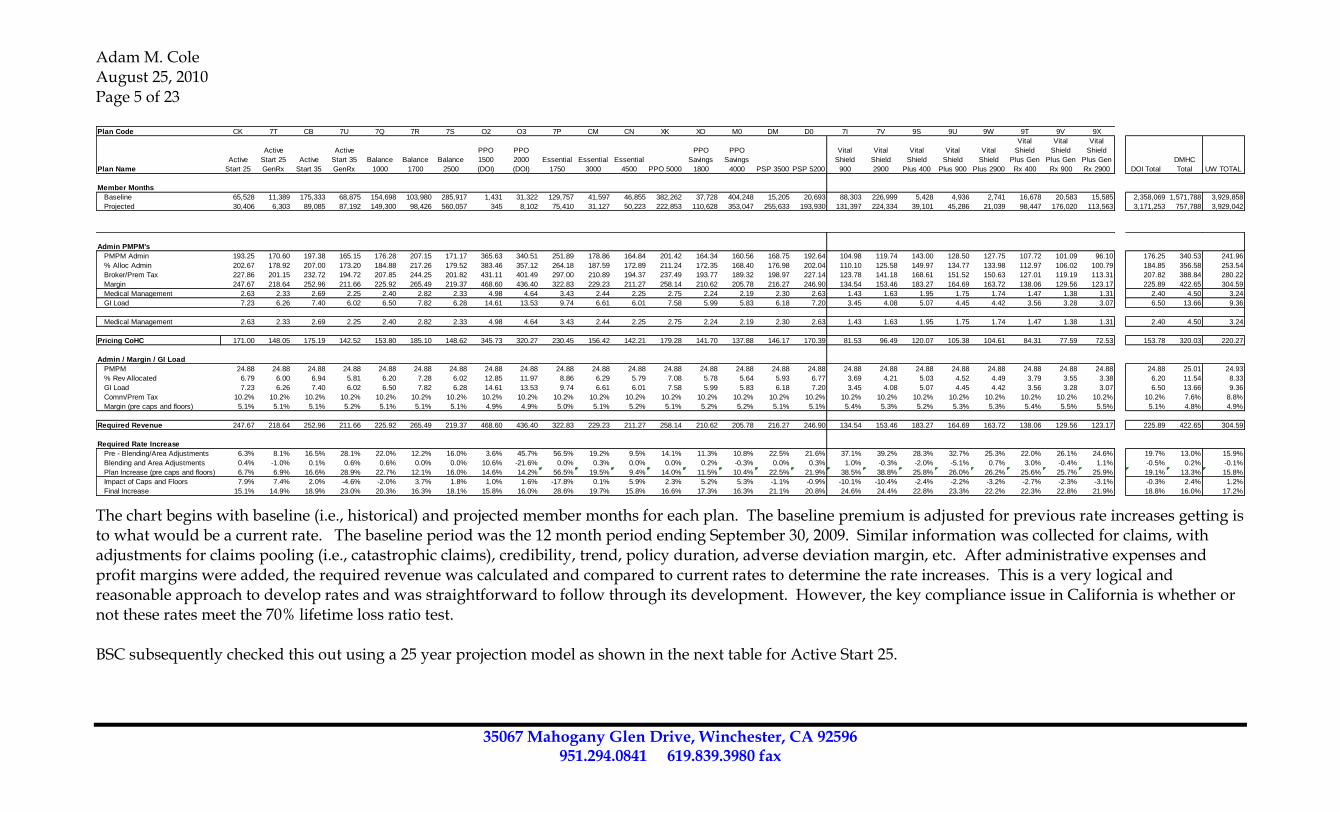
Overview of Rate Development Process BSC prepared a very useful summary exhibit summarizing the rate development process by plan. This is presented in the next few pages. The rate development process is shown for each plan on a consistent step-by-step process. We have used this form as a tool is walking through the rate development process.
Adam M. Cole August 25, 2010 Page 4 of 23
35067 Mahogany Glen Drive, Winchester, CA 92596 951.294.0841 619.839.3980 fax
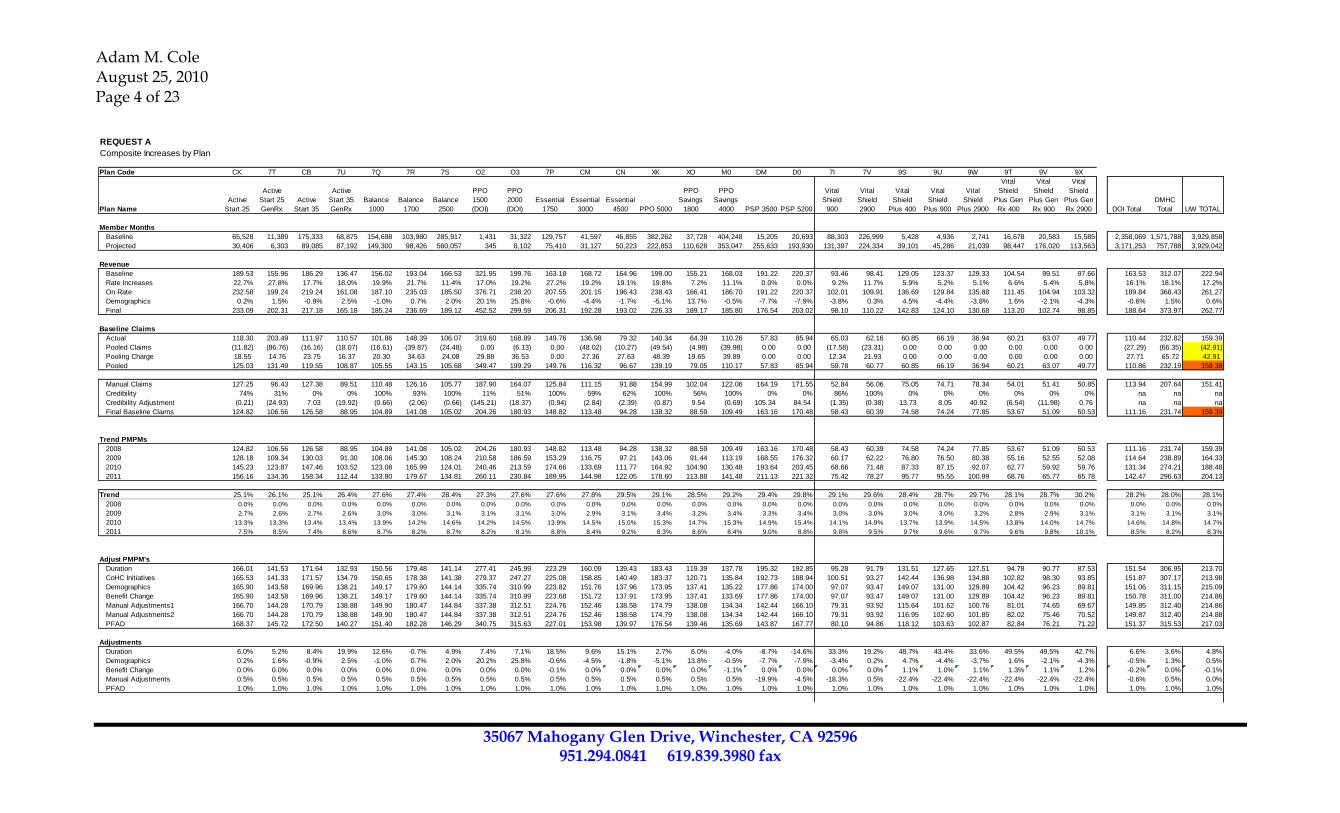
REQUEST A
Composite Increases by Plan
Plan Code CK 7T CB 7U 7Q 7R 7S O2 O3 7P CM CN XK XO M0 DM D0 7I 7V 9S 9U 9W 9T 9V 9X
Plan Name
Active
Start 25
Active
Start 25
GenRx
Active
Start 35
Active
Start 35
GenRx
Balance
1000
Balance
1700
Balance
2500
PPO
1500
(DOI)
PPO
2000
(DOI)
Essential
1750
Essential
3000
Essential
4500 PPO 5000
PPO
Savings
1800
PPO
Savings
4000 PSP 3500 PSP 5200
Vital
Shield
900
Vital
Shield
2900
Vital
Shield
Plus 400
Vital
Shield
Plus 900
Vital
Shield
Plus 2900
Vital
Shield
Plus Gen
Rx 400
Vital
Shield
Plus Gen
Rx 900
Vital
Shield
Plus Gen
Rx 2900 DOI Total
DMHC
Total UW TOTAL
Member Months
Baseline 65,528 11,389 175,333 68,875 154,698 103,980 285,917 1,431 31,322 129,757 41,597 46,855 382,262 37,728 404,248 15,205 20,693 88,303 226,999 5,428 4,936 2,741 16,678 20,583 15,585 2,358,069 1,571,788 3,929,858
Projected 30,406 6,303 89,085 87,192 149,300 98,426 560,057 345 8,102 75,410 31,127 50,223 222,853 110,628 353,047 255,633 193,930 131,397 224,334 39,101 45,286 21,039 98,447 176,020 113,563 3,171,253 757,788 3,929,042
Revenue
Baseline 189.53 155.96 186.29 136.47 156.02 193.04 166.53 321.95 199.76 163.18 168.72 164.96 199.00 155.21 168.03 191.22 220.37 93.46 98.41 129.05 123.37 129.33 104.54 99.51 97.66 163.53 312.07 222.94
Rate Increases 22.7% 27.8% 17.7% 18.0% 19.9% 21.7% 11.4% 17.0% 19.2% 27.2% 19.2% 19.1% 19.8% 7.2% 11.1% 0.0% 0.0% 9.2% 11.7% 5.9% 5.2% 5.1% 6.6% 5.4% 5.8% 16.1% 18.1% 17.2%
On Rate 232.58 199.24 219.24 161.08 187.10 235.03 185.50 376.71 238.20 207.55 201.15 196.43 238.43 166.41 186.70 191.22 220.37 102.01 109.91 136.69 129.84 135.88 111.45 104.94 103.32 189.84 368.43 261.27
Demographics 0.2% 1.5% -0.9% 2.5% -1.0% 0.7% 2.0% 20.1% 25.8% -0.6% -4.4% -1.7% -5.1% 13.7% -0.5% -7.7% -7.9% -3.8% 0.3% 4.5% -4.4% -3.8% 1.6% -2.1% -4.3% -0.6% 1.5% 0.6%
Final 233.09 202.31 217.18 165.18 185.24 236.69 189.12 452.52 299.59 206.31 192.28 193.02 226.33 189.17 185.80 176.54 203.02 98.10 110.22 142.83 124.10 130.68 113.20 102.74 98.85 188.64 373.97 262.77
Baseline Claims
Actual 118.30 203.49 111.97 110.57 101.86 148.39 106.07 319.60 168.89 149.76 136.98 79.32 140.34 64.39 110.26 57.83 85.94 65.03 62.16 60.85 66.19 36.94 60.21 63.07 49.77 110.44 232.82 159.39
Pooled Claims (11.82) (86.76) (16.16) (18.07) (16.61) (39.87) (24.48) 0.00 (6.13) 0.00 (48.02) (10.27) (49.54) (4.98) (39.98) 0.00 0.00 (17.58) (23.31) 0.00 0.00 0.00 0.00 0.00 0.00 (27.29) (66.35) (42.91)
Pooling Charge 18.55 14.76 23.75 16.37 20.30 34.63 24.08 29.88 36.53 0.00 27.36 27.63 48.39 19.65 39.89 0.00 0.00 12.34 21.93 0.00 0.00 0.00 0.00 0.00 0.00 27.71 65.72 42.91
Pooled 125.03 131.49 119.55 108.87 105.55 143.15 105.68 349.47 199.29 149.76 116.32 96.67 139.19 79.05 110.17 57.83 85.94 59.78 60.77 60.85 66.19 36.94 60.21 63.07 49.77 110.86 232.19 159.39
Manual Claims 127.25 96.43 127.38 89.51 110.48 126.16 105.77 187.90 164.07 125.84 111.15 91.88 154.99 102.04 122.06 164.19 171.55 52.84 56.06 75.05 74.71 78.34 54.01 51.41 50.85 113.94 207.64 151.41
Credibility 74% 31% 0% 0% 100% 93% 100% 11% 51% 100% 59% 62% 100% 56% 100% 0% 0% 86% 100% 0% 0% 0% 0% 0% 0% na na na
Credibility Adjustment (0.21) (24.93) 7.03 (19.92) (0.66) (2.06) (0.66) (145.21) (18.37) (0.94) (2.84) (2.39) (0.87) 9.54 (0.69) 105.34 84.54 (1.35) (0.38) 13.73 8.05 40.92 (6.54) (11.98) 0.76 na na na
Final Baseline Claims 124.82 106.56 126.58 88.95 104.89 141.08 105.02 204.26 180.93 148.82 113.48 94.28 138.32 88.59 109.49 163.16 170.48 58.43 60.39 74.58 74.24 77.85 53.67 51.09 50.53 111.16 231.74 159.39
Trend PMPMs
2008 124.82 106.56 126.58 88.95 104.89 141.08 105.02 204.26 180.93 148.82 113.48 94.28 138.32 88.59 109.49 163.16 170.48 58.43 60.39 74.58 74.24 77.85 53.67 51.09 50.53 111.16 231.74 159.39
2009 128.18 109.34 130.03 91.30 108.06 145.30 108.24 210.58 186.59 153.29 116.75 97.21 143.06 91.44 113.19 168.55 176.32 60.17 62.22 76.80 76.50 80.38 55.16 52.55 52.08 114.64 238.89 164.33
2010 145.23 123.87 147.46 103.52 123.08 165.99 124.01 240.46 213.59 174.66 133.69 111.77 164.92 104.90 130.48 193.64 203.45 68.66 71.48 87.33 87.15 92.07 62.77 59.92 59.76 131.34 274.21 188.48
2011 156.16 134.36 158.34 112.44 133.80 179.67 134.81 260.11 230.84 189.95 144.98 122.05 178.60 113.88 141.48 211.13 221.32 75.42 78.27 95.77 95.55 100.99 68.76 65.77 65.78 142.47 296.63 204.13
Trend 25.1% 26.1% 25.1% 26.4% 27.6% 27.4% 28.4% 27.3% 27.6% 27.6% 27.8% 29.5% 29.1% 28.5% 29.2% 29.4% 29.8% 29.1% 29.6% 28.4% 28.7% 29.7% 28.1% 28.7% 30.2% 28.2% 28.0% 28.1%
2008 0.0% 0.0% 0.0% 0.0% 0.0% 0.0% 0.0% 0.0% 0.0% 0.0% 0.0% 0.0% 0.0% 0.0% 0.0% 0.0% 0.0% 0.0% 0.0% 0.0% 0.0% 0.0% 0.0% 0.0% 0.0% 0.0% 0.0% 0.0%
2009 2.7% 2.6% 2.7% 2.6% 3.0% 3.0% 3.1% 3.1% 3.1% 3.0% 2.9% 3.1% 3.4% 3.2% 3.4% 3.3% 3.4% 3.0% 3.0% 3.0% 3.0% 3.2% 2.8% 2.9% 3.1% 3.1% 3.1% 3.1%
2010 13.3% 13.3% 13.4% 13.4% 13.9% 14.2% 14.6% 14.2% 14.5% 13.9% 14.5% 15.0% 15.3% 14.7% 15.3% 14.9% 15.4% 14.1% 14.9% 13.7% 13.9% 14.5% 13.8% 14.0% 14.7% 14.6% 14.8% 14.7%
2011 7.5% 8.5% 7.4% 8.6% 8.7% 8.2% 8.7% 8.2% 8.1% 8.8% 8.4% 9.2% 8.3% 8.6% 8.4% 9.0% 8.8% 9.8% 9.5% 9.7% 9.6% 9.7% 9.6% 9.8% 10.1% 8.5% 8.2% 8.3%
Adjust PMPM's
Duration 166.01 141.53 171.64 132.93 150.56 179.48 141.14 277.41 245.99 223.29 160.09 139.43 183.43 119.39 137.78 195.32 192.85 95.28 91.79 131.51 127.65 127.51 94.78 90.77 87.53 151.54 306.95 213.70
CoHC Initiatives 165.53 141.33 171.57 134.79 150.65 178.38 141.38 279.37 247.27 225.08 158.85 140.49 183.37 120.71 135.84 192.73 188.94 100.51 93.27 142.44 136.98 134.88 102.82 98.30 93.85 151.87 307.17 213.98
Demographics 165.90 143.58 169.96 138.21 149.17 179.60 144.14 335.74 310.99 223.82 151.76 137.96 173.95 137.41 135.22 177.86 174.00 97.07 93.47 149.07 131.00 129.89 104.42 96.23 89.81 151.06 311.15 215.09
Benefit Change 165.90 143.58 169.96 138.21 149.17 179.60 144.14 335.74 310.99 223.68 151.72 137.91 173.95 137.41 133.69 177.86 174.00 97.07 93.47 149.07 131.00 129.89 104.42 96.23 89.81 150.78 311.00 214.86
Manual Adjustments1 166.70 144.28 170.79 138.88 149.90 180.47 144.84 337.38 312.51 224.76 152.46 138.58 174.79 138.08 134.34 142.44 166.10 79.31 93.92 115.64 101.62 100.76 81.01 74.65 69.67 149.85 312.40 214.86
Manual Adjustments2 166.70 144.28 170.79 138.88 149.90 180.47 144.84 337.38 312.51 224.76 152.46 138.58 174.79 138.08 134.34 142.44 166.10 79.31 93.92 116.95 102.60 101.85 82.02 75.46 70.52 149.87 312.40 214.88
PFAD 168.37 145.72 172.50 140.27 151.40 182.28 146.29 340.75 315.63 227.01 153.98 139.97 176.54 139.46 135.69 143.87 167.77 80.10 94.86 118.12 103.63 102.87 82.84 76.21 71.22 151.37 315.53 217.03
Adjustments
Duration 6.0% 5.2% 8.4% 19.9% 12.6% -0.7% 4.9% 7.4% 7.1% 18.5% 9.6% 15.1% 2.7% 6.0% -4.0% -8.7% -14.6% 33.3% 19.2% 48.7% 43.4% 33.6% 49.5% 49.5% 42.7% 6.6% 3.6% 4.8%
Demographics 0.2% 1.6% -0.9% 2.5% -1.0% 0.7% 2.0% 20.2% 25.8% -0.6% -4.5% -1.8% -5.1% 13.8% -0.5% -7.7% -7.9% -3.4% 0.2% 4.7% -4.4% -3.7% 1.6% -2.1% -4.3% -0.5% 1.3% 0.5%
Benefit Change 0.0% 0.0% 0.0% 0.0% 0.0% 0.0% 0.0% 0.0% 0.0% -0.1% 0.0% 0.0% 0.0% 0.0% -1.1% 0.0% 0.0% 0.0% 0.0% 1.1% 1.0% 1.1% 1.3% 1.1% 1.2% -0.2% 0.0% -0.1%
Manual Adjustments 0.5% 0.5% 0.5% 0.5% 0.5% 0.5% 0.5% 0.5% 0.5% 0.5% 0.5% 0.5% 0.5% 0.5% 0.5% -19.9% -4.5% -18.3% 0.5% -22.4% -22.4% -22.4% -22.4% -22.4% -22.4% -0.6% 0.5% 0.0%
PFAD 1.0% 1.0% 1.0% 1.0% 1.0% 1.0% 1.0% 1.0% 1.0% 1.0% 1.0% 1.0% 1.0% 1.0% 1.0% 1.0% 1.0% 1.0% 1.0% 1.0% 1.0% 1.0% 1.0% 1.0% 1.0% 1.0% 1.0% 1.0%
Adam M. Cole August 25, 2010 Page 5 of 23
35067 Mahogany Glen Drive, Winchester, CA 92596 951.294.0841 619.839.3980 fax
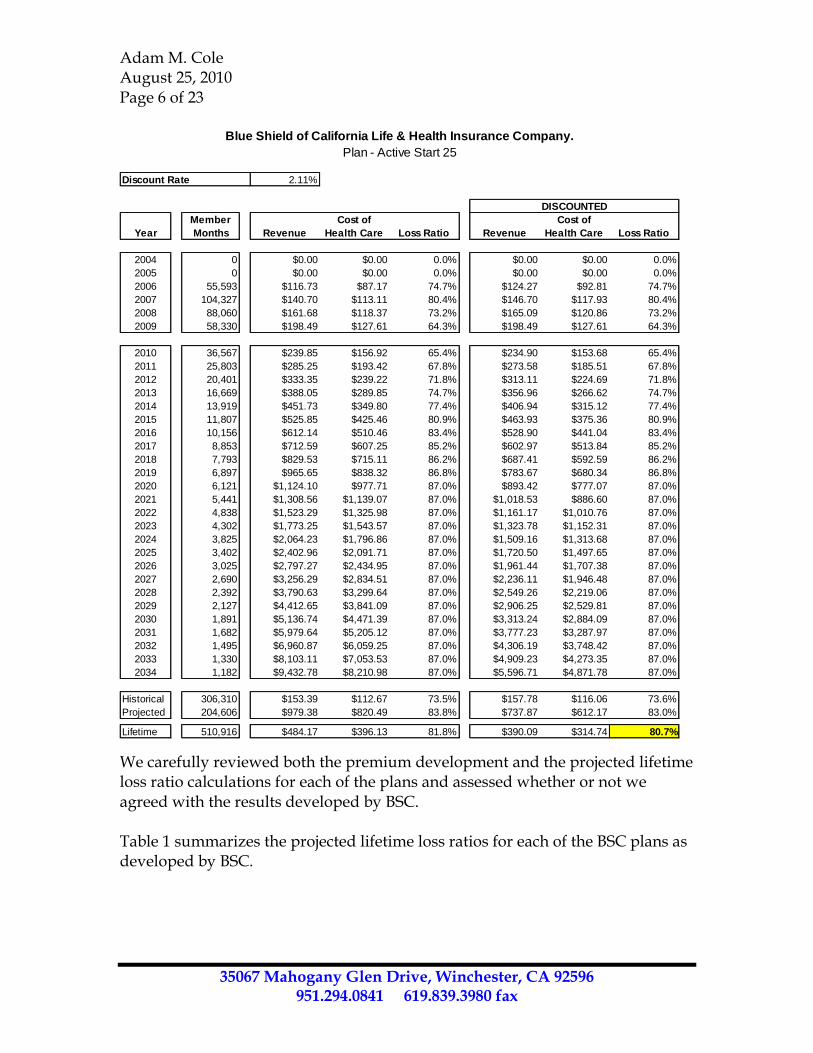
The chart begins with baseline (i.e., historical) and projected member months for each plan. The baseline premium is adjusted for previous rate increases getting is to what would be a current rate. The baseline period was the 12 month period ending September 30, 2009. Similar information was collected for claims, with adjustments for claims pooling (i.e., catastrophic claims), credibility, trend, policy duration, adverse deviation margin, etc. After administrative expenses and profit margins were added, the required revenue was calculated and compared to current rates to determine the rate increases. This is a very logical and reasonable approach to develop rates and was straightforward to follow through its development. However, the key compliance issue in California is whether or not these rates meet the 70% lifetime loss ratio test. BSC subsequently checked this out using a 25 year projection model as shown in the next table for Active Start 25.
Plan Code CK 7T CB 7U 7Q 7R 7S O2 O3 7P CM CN XK XO M0 DM D0 7I 7V 9S 9U 9W 9T 9V 9X
Plan Name
Active
Start 25
Active
Start 25
GenRx
Active
Start 35
Active
Start 35
GenRx
Balance
1000
Balance
1700
Balance
2500
PPO
1500
(DOI)
PPO
2000
(DOI)
Essential
1750
Essential
3000
Essential
4500 PPO 5000
PPO
Savings
1800
PPO
Savings
4000 PSP 3500 PSP 5200
Vital
Shield
900
Vital
Shield
2900
Vital
Shield
Plus 400
Vital
Shield
Plus 900
Vital
Shield
Plus 2900
Vital
Shield
Plus Gen
Rx 400
Vital
Shield
Plus Gen
Rx 900
Vital
Shield
Plus Gen
Rx 2900 DOI Total
DMHC
Total UW TOTAL
Member Months
Baseline 65,528 11,389 175,333 68,875 154,698 103,980 285,917 1,431 31,322 129,757 41,597 46,855 382,262 37,728 404,248 15,205 20,693 88,303 226,999 5,428 4,936 2,741 16,678 20,583 15,585 2,358,069 1,571,788 3,929,858
Projected 30,406 6,303 89,085 87,192 149,300 98,426 560,057 345 8,102 75,410 31,127 50,223 222,853 110,628 353,047 255,633 193,930 131,397 224,334 39,101 45,286 21,039 98,447 176,020 113,563 3,171,253 757,788 3,929,042
Admin PMPM's
PMPM Admin 193.25 170.60 197.38 165.15 176.28 207.15 171.17 365.63 340.51 251.89 178.86 164.84 201.42 164.34 160.56 168.75 192.64 104.98 119.74 143.00 128.50 127.75 107.72 101.09 96.10 176.25 340.53 241.96
% Alloc Admin 202.67 178.92 207.00 173.20 184.88 217.26 179.52 383.46 357.12 264.18 187.59 172.89 211.24 172.35 168.40 176.98 202.04 110.10 125.58 149.97 134.77 133.98 112.97 106.02 100.79 184.85 356.58 253.54
Broker/Prem Tax 227.86 201.15 232.72 194.72 207.85 244.25 201.82 431.11 401.49 297.00 210.89 194.37 237.49 193.77 189.32 198.97 227.14 123.78 141.18 168.61 151.52 150.63 127.01 119.19 113.31 207.82 388.84 280.22
Margin 247.67 218.64 252.96 211.66 225.92 265.49 219.37 468.60 436.40 322.83 229.23 211.27 258.14 210.62 205.78 216.27 246.90 134.54 153.46 183.27 164.69 163.72 138.06 129.56 123.17 225.89 422.65 304.59
Medical Management 2.63 2.33 2.69 2.25 2.40 2.82 2.33 4.98 4.64 3.43 2.44 2.25 2.75 2.24 2.19 2.30 2.63 1.43 1.63 1.95 1.75 1.74 1.47 1.38 1.31 2.40 4.50 3.24
GI Load 7.23 6.26 7.40 6.02 6.50 7.82 6.28 14.61 13.53 9.74 6.61 6.01 7.58 5.99 5.83 6.18 7.20 3.45 4.08 5.07 4.45 4.42 3.56 3.28 3.07 6.50 13.66 9.36
Medical Management 2.63 2.33 2.69 2.25 2.40 2.82 2.33 4.98 4.64 3.43 2.44 2.25 2.75 2.24 2.19 2.30 2.63 1.43 1.63 1.95 1.75 1.74 1.47 1.38 1.31 2.40 4.50 3.24
Pricing CoHC 171.00 148.05 175.19 142.52 153.80 185.10 148.62 345.73 320.27 230.45 156.42 142.21 179.28 141.70 137.88 146.17 170.39 81.53 96.49 120.07 105.38 104.61 84.31 77.59 72.53 153.78 320.03 220.27
Admin / Margin / GI Load
PMPM 24.88 24.88 24.88 24.88 24.88 24.88 24.88 24.88 24.88 24.88 24.88 24.88 24.88 24.88 24.88 24.88 24.88 24.88 24.88 24.88 24.88 24.88 24.88 24.88 24.88 24.88 25.01 24.93
% Rev Allocated 6.79 6.00 6.94 5.81 6.20 7.28 6.02 12.85 11.97 8.86 6.29 5.79 7.08 5.78 5.64 5.93 6.77 3.69 4.21 5.03 4.52 4.49 3.79 3.55 3.38 6.20 11.54 8.33
GI Load 7.23 6.26 7.40 6.02 6.50 7.82 6.28 14.61 13.53 9.74 6.61 6.01 7.58 5.99 5.83 6.18 7.20 3.45 4.08 5.07 4.45 4.42 3.56 3.28 3.07 6.50 13.66 9.36
Comm/Prem Tax 10.2% 10.2% 10.2% 10.2% 10.2% 10.2% 10.2% 10.2% 10.2% 10.2% 10.2% 10.2% 10.2% 10.2% 10.2% 10.2% 10.2% 10.2% 10.2% 10.2% 10.2% 10.2% 10.2% 10.2% 10.2% 10.2% 7.6% 8.8%
Margin (pre caps and floors) 5.1% 5.1% 5.1% 5.2% 5.1% 5.1% 5.1% 4.9% 4.9% 5.0% 5.1% 5.2% 5.1% 5.2% 5.2% 5.1% 5.1% 5.4% 5.3% 5.2% 5.3% 5.3% 5.4% 5.5% 5.5% 5.1% 4.8% 4.9%
Required Revenue 247.67 218.64 252.96 211.66 225.92 265.49 219.37 468.60 436.40 322.83 229.23 211.27 258.14 210.62 205.78 216.27 246.90 134.54 153.46 183.27 164.69 163.72 138.06 129.56 123.17 225.89 422.65 304.59
Required Rate Increase
Pre - Blending/Area Adjustments 6.3% 8.1% 16.5% 28.1% 22.0% 12.2% 16.0% 3.6% 45.7% 56.5% 19.2% 9.5% 14.1% 11.3% 10.8% 22.5% 21.6% 37.1% 39.2% 28.3% 32.7% 25.3% 22.0% 26.1% 24.6% 19.7% 13.0% 15.9%
Blending and Area Adjustments 0.4% -1.0% 0.1% 0.6% 0.6% 0.0% 0.0% 10.6% -21.6% 0.0% 0.3% 0.0% 0.0% 0.2% -0.3% 0.0% 0.3% 1.0% -0.3% -2.0% -5.1% 0.7% 3.0% -0.4% 1.1% -0.5% 0.2% -0.1%
Plan Increase (pre caps and floors) 6.7% 6.9% 16.6% 28.9% 22.7% 12.1% 16.0% 14.6% 14.2% 56.5% 19.5% 9.4% 14.0% 11.5% 10.4% 22.5% 21.9% 38.5% 38.8% 25.8% 26.0% 26.2% 25.6% 25.7% 25.9% 19.1% 13.3% 15.8%
Impact of Caps and Floors 7.9% 7.4% 2.0% -4.6% -2.0% 3.7% 1.8% 1.0% 1.6% -17.8% 0.1% 5.9% 2.3% 5.2% 5.3% -1.1% -0.9% -10.1% -10.4% -2.4% -2.2% -3.2% -2.7% -2.3% -3.1% -0.3% 2.4% 1.2%
Final Increase 15.1% 14.9% 18.9% 23.0% 20.3% 16.3% 18.1% 15.8% 16.0% 28.6% 19.7% 15.8% 16.6% 17.3% 16.3% 21.1% 20.8% 24.6% 24.4% 22.8% 23.3% 22.2% 22.3% 22.8% 21.9% 18.8% 16.0% 17.2%
Adam M. Cole August 25, 2010 Page 6 of 23
35067 Mahogany Glen Drive, Winchester, CA 92596 951.294.0841 619.839.3980 fax
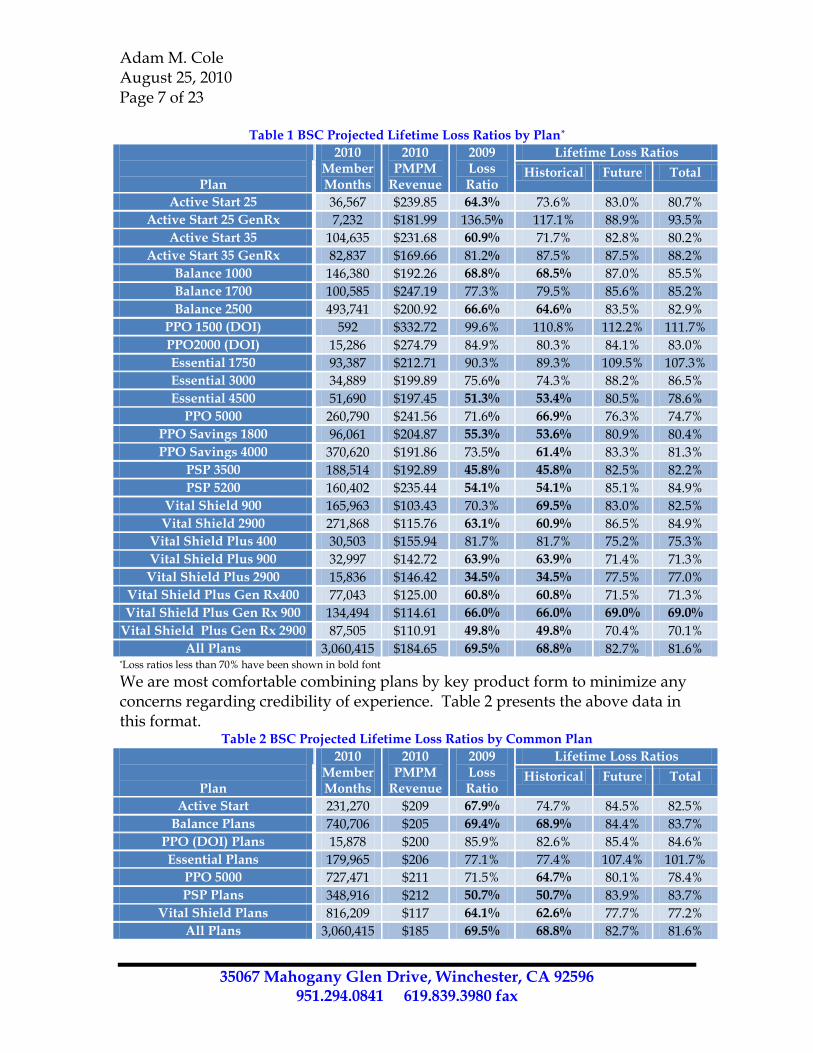
We carefully reviewed both the premium development and the projected lifetime loss ratio calculations for each of the plans and assessed whether or not we agreed with the results developed by BSC. Table 1 summarizes the projected lifetime loss ratios for each of the BSC plans as developed by BSC.
Blue Shield of California Life & Health Insurance Company.
Plan - Active Start 25
Discount Rate 2.11%
DISCOUNTED
Year
Member
Months Revenue
Cost of
Health Care Loss Ratio Revenue
Cost of
Health Care Loss Ratio
2004 0 $0.00 $0.00 0.0% $0.00 $0.00 0.0%
2005 0 $0.00 $0.00 0.0% $0.00 $0.00 0.0%
2006 55,593 $116.73 $87.17 74.7% $124.27 $92.81 74.7%
2007 104,327 $140.70 $113.11 80.4% $146.70 $117.93 80.4%
2008 88,060 $161.68 $118.37 73.2% $165.09 $120.86 73.2%
2009 58,330 $198.49 $127.61 64.3% $198.49 $127.61 64.3%
2010 36,567 $239.85 $156.92 65.4% $234.90 $153.68 65.4%
2011 25,803 $285.25 $193.42 67.8% $273.58 $185.51 67.8%
2012 20,401 $333.35 $239.22 71.8% $313.11 $224.69 71.8%
2013 16,669 $388.05 $289.85 74.7% $356.96 $266.62 74.7%
2014 13,919 $451.73 $349.80 77.4% $406.94 $315.12 77.4%
2015 11,807 $525.85 $425.46 80.9% $463.93 $375.36 80.9%
2016 10,156 $612.14 $510.46 83.4% $528.90 $441.04 83.4%
2017 8,853 $712.59 $607.25 85.2% $602.97 $513.84 85.2%
2018 7,793 $829.53 $715.11 86.2% $687.41 $592.59 86.2%
2019 6,897 $965.65 $838.32 86.8% $783.67 $680.34 86.8%
2020 6,121 $1,124.10 $977.71 87.0% $893.42 $777.07 87.0%
2021 5,441 $1,308.56 $1,139.07 87.0% $1,018.53 $886.60 87.0%
2022 4,838 $1,523.29 $1,325.98 87.0% $1,161.17 $1,010.76 87.0%
2023 4,302 $1,773.25 $1,543.57 87.0% $1,323.78 $1,152.31 87.0%
2024 3,825 $2,064.23 $1,796.86 87.0% $1,509.16 $1,313.68 87.0%
2025 3,402 $2,402.96 $2,091.71 87.0% $1,720.50 $1,497.65 87.0%
2026 3,025 $2,797.27 $2,434.95 87.0% $1,961.44 $1,707.38 87.0%
2027 2,690 $3,256.29 $2,834.51 87.0% $2,236.11 $1,946.48 87.0%
2028 2,392 $3,790.63 $3,299.64 87.0% $2,549.26 $2,219.06 87.0%
2029 2,127 $4,412.65 $3,841.09 87.0% $2,906.25 $2,529.81 87.0%
2030 1,891 $5,136.74 $4,471.39 87.0% $3,313.24 $2,884.09 87.0%
2031 1,682 $5,979.64 $5,205.12 87.0% $3,777.23 $3,287.97 87.0%
2032 1,495 $6,960.87 $6,059.25 87.0% $4,306.19 $3,748.42 87.0%
2033 1,330 $8,103.11 $7,053.53 87.0% $4,909.23 $4,273.35 87.0%
2034 1,182 $9,432.78 $8,210.98 87.0% $5,596.71 $4,871.78 87.0%
Historical 306,310 $153.39 $112.67 73.5% $157.78 $116.06 73.6%
Projected 204,606 $979.38 $820.49 83.8% $737.87 $612.17 83.0%
Lifetime 510,916 $484.17 $396.13 81.8% $390.09 $314.74 80.7%
Adam M. Cole August 25, 2010 Page 7 of 23
35067 Mahogany Glen Drive, Winchester, CA 92596 951.294.0841 619.839.3980 fax
Table 1 BSC Projected Lifetime Loss Ratios by Plan*
Plan
2010 Member Months
2010 PMPM
Revenue
2009 Loss Ratio
Lifetime Loss Ratios
Historical Future Total
Active Start 25 36,567 $239.85 64.3% 73.6% 83.0% 80.7%
Active Start 25 GenRx 7,232 $181.99 136.5% 117.1% 88.9% 93.5%
Active Start 35 104,635 $231.68 60.9% 71.7% 82.8% 80.2%
Active Start 35 GenRx 82,837 $169.66 81.2% 87.5% 87.5% 88.2%
Balance 1000 146,380 $192.26 68.8% 68.5% 87.0% 85.5%
Balance 1700 100,585 $247.19 77.3% 79.5% 85.6% 85.2%
Balance 2500 493,741 $200.92 66.6% 64.6% 83.5% 82.9%
PPO 1500 (DOI) 592 $332.72 99.6% 110.8% 112.2% 111.7%
PPO2000 (DOI) 15,286 $274.79 84.9% 80.3% 84.1% 83.0%
Essential 1750 93,387 $212.71 90.3% 89.3% 109.5% 107.3%
Essential 3000 34,889 $199.89 75.6% 74.3% 88.2% 86.5%
Essential 4500 51,690 $197.45 51.3% 53.4% 80.5% 78.6%
PPO 5000 260,790 $241.56 71.6% 66.9% 76.3% 74.7%
PPO Savings 1800 96,061 $204.87 55.3% 53.6% 80.9% 80.4%
PPO Savings 4000 370,620 $191.86 73.5% 61.4% 83.3% 81.3%
PSP 3500 188,514 $192.89 45.8% 45.8% 82.5% 82.2%
PSP 5200 160,402 $235.44 54.1% 54.1% 85.1% 84.9%
Vital Shield 900 165,963 $103.43 70.3% 69.5% 83.0% 82.5%
Vital Shield 2900 271,868 $115.76 63.1% 60.9% 86.5% 84.9%
Vital Shield Plus 400 30,503 $155.94 81.7% 81.7% 75.2% 75.3%
Vital Shield Plus 900 32,997 $142.72 63.9% 63.9% 71.4% 71.3%
Vital Shield Plus 2900 15,836 $146.42 34.5% 34.5% 77.5% 77.0%
Vital Shield Plus Gen Rx400 77,043 $125.00 60.8% 60.8% 71.5% 71.3%
Vital Shield Plus Gen Rx 900 134,494 $114.61 66.0% 66.0% 69.0% 69.0%
Vital Shield Plus Gen Rx 2900 87,505 $110.91 49.8% 49.8% 70.4% 70.1%
All Plans 3,060,415 $184.65 69.5% 68.8% 82.7% 81.6% *Loss ratios less than 70% have been shown in bold font
We are most comfortable combining plans by key product form to minimize any concerns regarding credibility of experience. Table 2 presents the above data in this format.
Table 2 BSC Projected Lifetime Loss Ratios by Common Plan
Plan
2010 Member Months
2010 PMPM
Revenue
2009 Loss Ratio
Lifetime Loss Ratios
Historical Future Total
Active Start 231,270 $209 67.9% 74.7% 84.5% 82.5%
Balance Plans 740,706 $205 69.4% 68.9% 84.4% 83.7%
PPO (DOI) Plans 15,878 $200 85.9% 82.6% 85.4% 84.6%
Essential Plans 179,965 $206 77.1% 77.4% 107.4% 101.7%
PPO 5000 727,471 $211 71.5% 64.7% 80.1% 78.4%
PSP Plans 348,916 $212 50.7% 50.7% 83.9% 83.7%
Vital Shield Plans 816,209 $117 64.1% 62.6% 77.7% 77.2%
All Plans 3,060,415 $185 69.5% 68.8% 82.7% 81.6%
Adam M. Cole August 25, 2010 Page 8 of 23
35067 Mahogany Glen Drive, Winchester, CA 92596 951.294.0841 619.839.3980 fax
Although Table 1 shows that one plan (i.e., Vital Shield Plus GenRx 900) is potentially out of compliance, the membership is not large enough to be credible for this plan. Combining the plans in Table 2, shows that each of the major plan combinations have a lifetime loss ratio above 70%. All of our analysis has been focused on the validation of the initial premium buildup and the analysis of lifetime loss ratios shown in Table 2. Analysis of Rate Development Beginning with the rate development process, we have reviewed in depth each of the key assumptions and adjustments as completed by BSC. We have included comments on each of the key items.
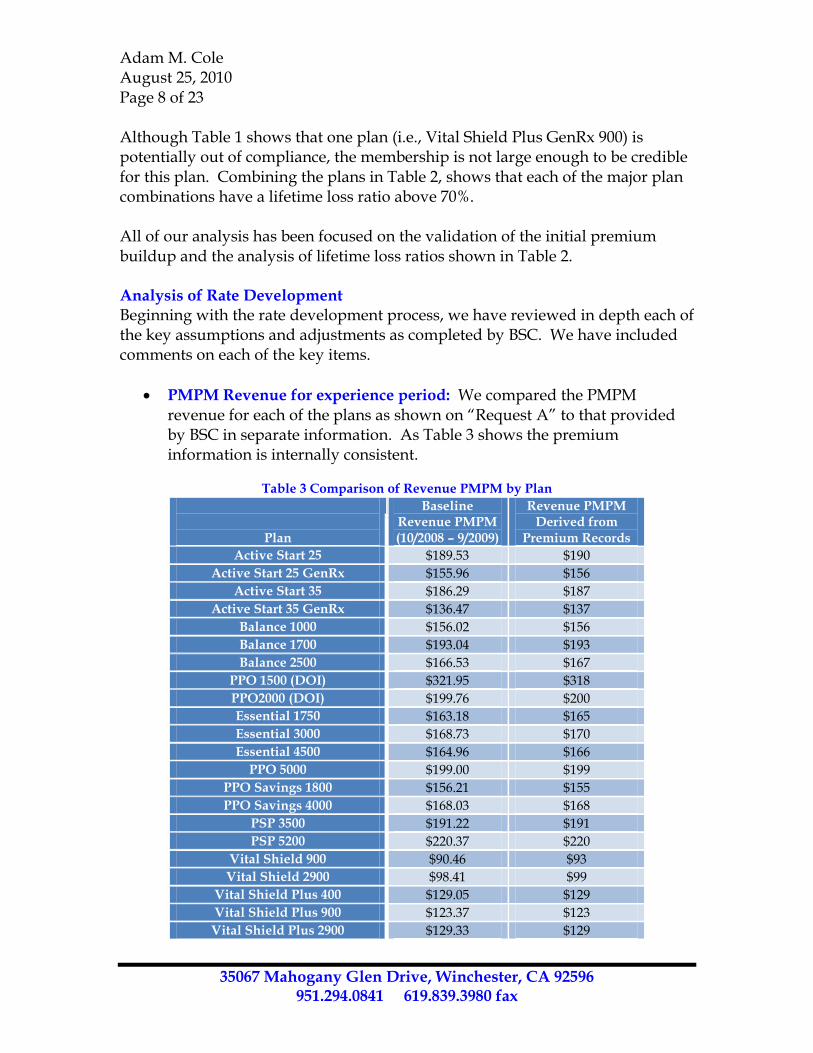
PMPM Revenue for experience period: We compared the PMPM revenue for each of the plans as shown on “Request A” to that provided by BSC in separate information. As Table 3 shows the premium information is internally consistent.
Table 3 Comparison of Revenue PMPM by Plan
Plan
Baseline Revenue PMPM (10/2008 – 9/2009)
Revenue PMPM Derived from
Premium Records
Active Start 25 $189.53 $190
Active Start 25 GenRx $155.96 $156
Active Start 35 $186.29 $187
Active Start 35 GenRx $136.47 $137
Balance 1000 $156.02 $156
Balance 1700 $193.04 $193
Balance 2500 $166.53 $167
PPO 1500 (DOI) $321.95 $318
PPO2000 (DOI) $199.76 $200
Essential 1750 $163.18 $165
Essential 3000 $168.73 $170
Essential 4500 $164.96 $166
PPO 5000 $199.00 $199
PPO Savings 1800 $156.21 $155
PPO Savings 4000 $168.03 $168
PSP 3500 $191.22 $191
PSP 5200 $220.37 $220
Vital Shield 900 $90.46 $93
Vital Shield 2900 $98.41 $99
Vital Shield Plus 400 $129.05 $129
Vital Shield Plus 900 $123.37 $123
Vital Shield Plus 2900 $129.33 $129
Adam M. Cole August 25, 2010 Page 9 of 23
35067 Mahogany Glen Drive, Winchester, CA 92596 951.294.0841 619.839.3980 fax
Vital Shield Plus Gen Rx400 $104.54 $104
Vital Shield Plus Gen Rx 900 $99.51 $99
Vital Shield Plus Gen Rx 2900 $97.66 $97
All Plans $163.53 $164
BSC developed a summary of previous rate increases and adjustments to transition the above premium rates to current rate levels. These adjustments were reasonable and correctly completed.
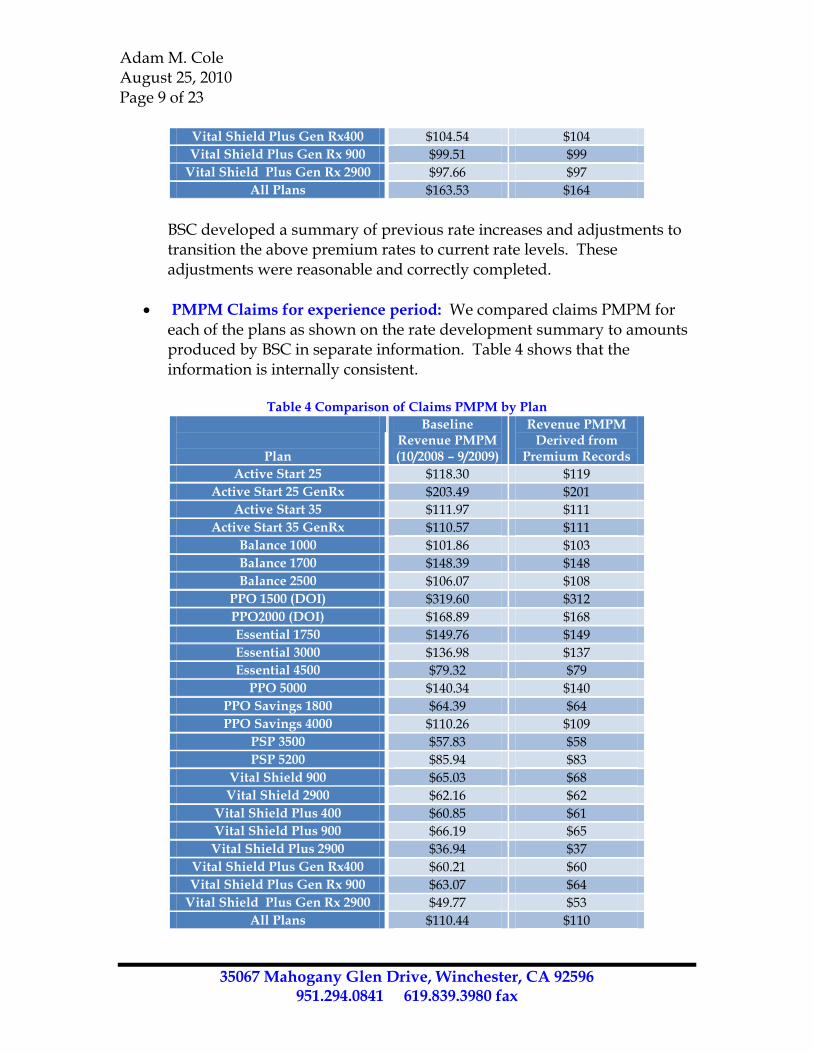
PMPM Claims for experience period: We compared claims PMPM for each of the plans as shown on the rate development summary to amounts produced by BSC in separate information. Table 4 shows that the information is internally consistent.
Table 4 Comparison of Claims PMPM by Plan
Plan
Baseline Revenue PMPM (10/2008 – 9/2009)
Revenue PMPM Derived from
Premium Records
Active Start 25 $118.30 $119
Active Start 25 GenRx $203.49 $201
Active Start 35 $111.97 $111
Active Start 35 GenRx $110.57 $111
Balance 1000 $101.86 $103
Balance 1700 $148.39 $148
Balance 2500 $106.07 $108
PPO 1500 (DOI) $319.60 $312
PPO2000 (DOI) $168.89 $168
Essential 1750 $149.76 $149
Essential 3000 $136.98 $137
Essential 4500 $79.32 $79
PPO 5000 $140.34 $140
PPO Savings 1800 $64.39 $64
PPO Savings 4000 $110.26 $109
PSP 3500 $57.83 $58
PSP 5200 $85.94 $83
Vital Shield 900 $65.03 $68
Vital Shield 2900 $62.16 $62
Vital Shield Plus 400 $60.85 $61
Vital Shield Plus 900 $66.19 $65
Vital Shield Plus 2900 $36.94 $37
Vital Shield Plus Gen Rx400 $60.21 $60
Vital Shield Plus Gen Rx 900 $63.07 $64
Vital Shield Plus Gen Rx 2900 $49.77 $53
All Plans $110.44 $110
Adam M. Cole August 25, 2010 Page 10 of 23
35067 Mahogany Glen Drive, Winchester, CA 92596 951.294.0841 619.839.3980 fax
Claims were adjusted for pooling of catastrophic claims, individually by plan adjusted for credibility with company rating manual, trended to the middle of the projection period (i.e., varied by plan based upon actual distribution of business by renewal date) to determine an adjusted base period claims level. Table 4 shows that the claims values were reasonable compared to independent data.
Health Care Trend Adjustment: Trend adjustments were based upon underlying trend assumptions for each calendar year time period between the center of the experience period (i.e., middle of 10/1/2008 – 9/30/2009) to the projection period (i.e., rates effective beginning 7/1/2010 through 12/31/2010). The trend assumptions for these three time periods ranged from 10.7% for trend between 2008 and 2009 to 12.4% for the trend between 2010 to 2011. These trend values were for the underlying trend assumption prior to any adjustment for plan design (i.e., trend leveraging), wear-off of selection, aging, etc. As described in the previously prepared report for the Anthem Blue Cross rate filing, our firm’s trend assumption for projecting 2010 to 2011 is 13.5% (i.e., underlying assumption of 11.5% with a 2% margin). The 12.4% assumption is very reasonable in light of this. BSC includes an explicit 1% margin (i.e., called PFAD or Provision for Adverse Deviation) in another adjustments for claims. This adjustment if included in the trend assumption would raise the 12.4% trend assumption to 13.4%, very close to our 13.5% assumption. Since BSC includes an additional margin later in the calculations it is reasonable to allocate this 1% PFAD margin with the trend assumption for comparison purposes.
In addition to the underlying trend assumption, BSC appropriately incorporates a deductible leveraging adjustment to reflect the anticipated effect of plan design on the underlying trends. The values were based upon internal claims probability distributions based upon BSC experience. The values were reasonable and appropriately applied to the underlying trend assumptions referred to above.
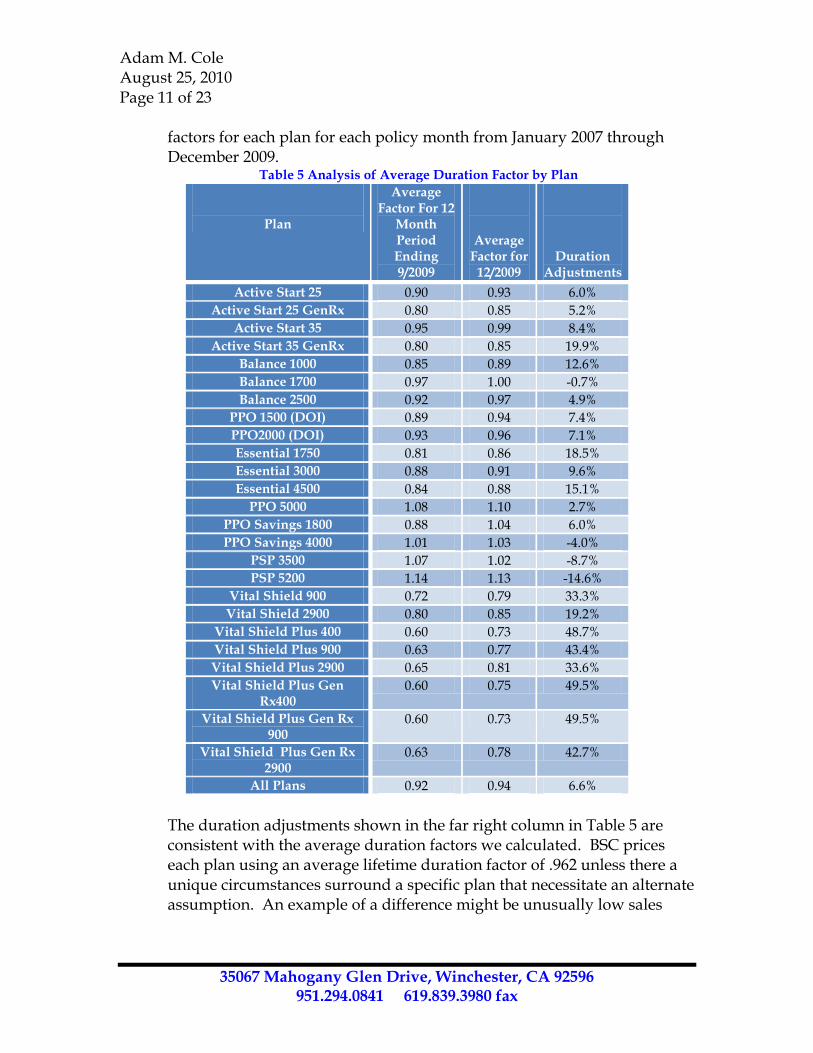
Policy Duration Adjustment: BSC has developed selection factors by policy duration (i.e., by month through 10 years post-issue). The non-maternity factors range from about .40 in the first month to about 1.30 for duration 120 months and beyond. Using actual distribution of enrollees by month and policy duration, we calculated composite policy duration
Adam M. Cole August 25, 2010 Page 11 of 23
35067 Mahogany Glen Drive, Winchester, CA 92596 951.294.0841 619.839.3980 fax
factors for each plan for each policy month from January 2007 through December 2009.
Table 5 Analysis of Average Duration Factor by Plan
Plan
Average Factor For 12
Month Period Ending 9/2009
Average Factor for
12/2009
Duration Adjustments
Active Start 25 0.90 0.93 6.0%
Active Start 25 GenRx 0.80 0.85 5.2%
Active Start 35 0.95 0.99 8.4%
Active Start 35 GenRx 0.80 0.85 19.9%
Balance 1000 0.85 0.89 12.6%
Balance 1700 0.97 1.00 -0.7%
Balance 2500 0.92 0.97 4.9%
PPO 1500 (DOI) 0.89 0.94 7.4%
PPO2000 (DOI) 0.93 0.96 7.1%
Essential 1750 0.81 0.86 18.5%
Essential 3000 0.88 0.91 9.6%
Essential 4500 0.84 0.88 15.1%
PPO 5000 1.08 1.10 2.7%
PPO Savings 1800 0.88 1.04 6.0%
PPO Savings 4000 1.01 1.03 -4.0%
PSP 3500 1.07 1.02 -8.7%
PSP 5200 1.14 1.13 -14.6%
Vital Shield 900 0.72 0.79 33.3%
Vital Shield 2900 0.80 0.85 19.2%
Vital Shield Plus 400 0.60 0.73 48.7%
Vital Shield Plus 900 0.63 0.77 43.4%
Vital Shield Plus 2900 0.65 0.81 33.6%
Vital Shield Plus Gen Rx400
0.60 0.75 49.5%
Vital Shield Plus Gen Rx 900
0.60 0.73 49.5%
Vital Shield Plus Gen Rx 2900
0.63 0.78 42.7%
All Plans 0.92 0.94 6.6%
The duration adjustments shown in the far right column in Table 5 are consistent with the average duration factors we calculated. BSC prices each plan using an average lifetime duration factor of .962 unless there a unique circumstances surround a specific plan that necessitate an alternate assumption. An example of a difference might be unusually low sales
Adam M. Cole August 25, 2010 Page 12 of 23
35067 Mahogany Glen Drive, Winchester, CA 92596 951.294.0841 619.839.3980 fax
volume on a particular plan. This is a reasonable approach and assures more appropriate pricing for most plans.
Provision for Adverse Deviation: BSC adds a 1% margin to projected claims costs for all plans. As discussed above, we had assumed that this adjustment can be viewed as being similar to the “trend miss” margin we have included with our underlying trend assumption. Shifting this to the trend creates a trend assumption that is almost identical to what we have estimated. BSC adds a separate profit and risk margin later in the calculations.
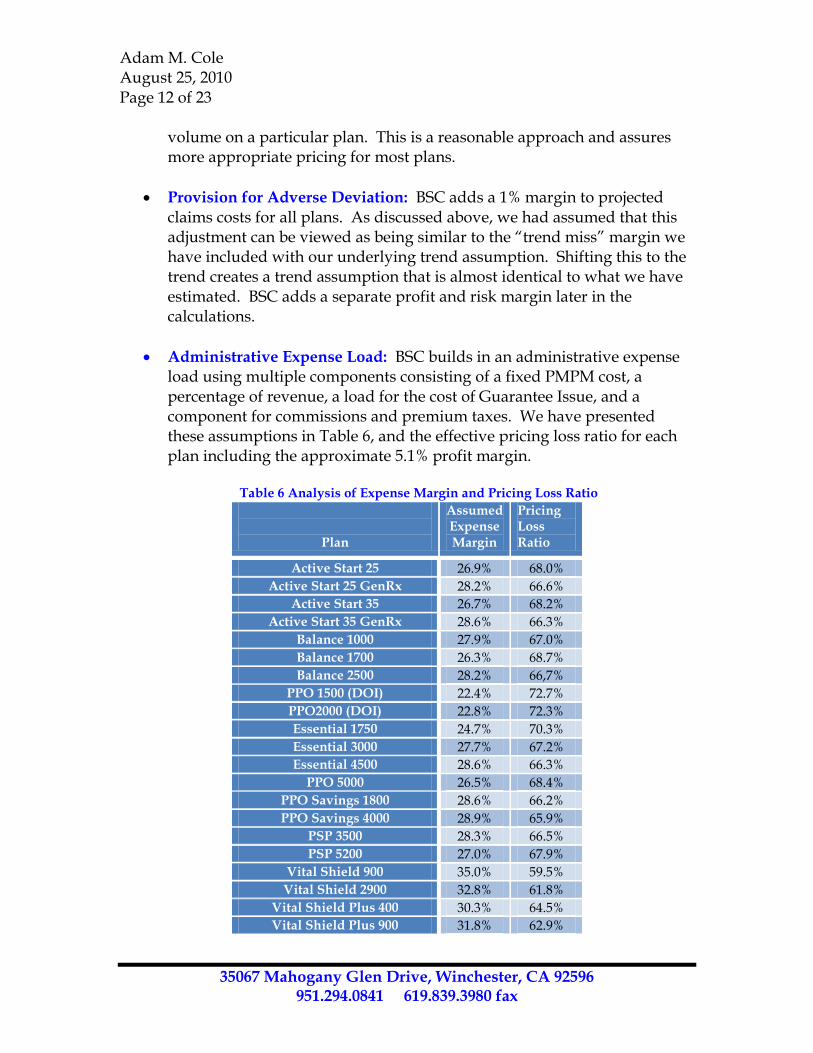
Administrative Expense Load: BSC builds in an administrative expense load using multiple components consisting of a fixed PMPM cost, a percentage of revenue, a load for the cost of Guarantee Issue, and a component for commissions and premium taxes. We have presented these assumptions in Table 6, and the effective pricing loss ratio for each plan including the approximate 5.1% profit margin.
Table 6 Analysis of Expense Margin and Pricing Loss Ratio
Plan
Assumed Expense Margin
Pricing Loss Ratio
Active Start 25 26.9% 68.0%
Active Start 25 GenRx 28.2% 66.6%
Active Start 35 26.7% 68.2%
Active Start 35 GenRx 28.6% 66.3%
Balance 1000 27.9% 67.0%
Balance 1700 26.3% 68.7%
Balance 2500 28.2% 66,7%
PPO 1500 (DOI) 22.4% 72.7%
PPO2000 (DOI) 22.8% 72.3%
Essential 1750 24.7% 70.3%
Essential 3000 27.7% 67.2%
Essential 4500 28.6% 66.3%
PPO 5000 26.5% 68.4%
PPO Savings 1800 28.6% 66.2%
PPO Savings 4000 28.9% 65.9%
PSP 3500 28.3% 66.5%
PSP 5200 27.0% 67.9%
Vital Shield 900 35.0% 59.5%
Vital Shield 2900 32.8% 61.8%
Vital Shield Plus 400 30.3% 64.5%
Vital Shield Plus 900 31.8% 62.9%
Adam M. Cole August 25, 2010 Page 13 of 23
35067 Mahogany Glen Drive, Winchester, CA 92596 951.294.0841 619.839.3980 fax
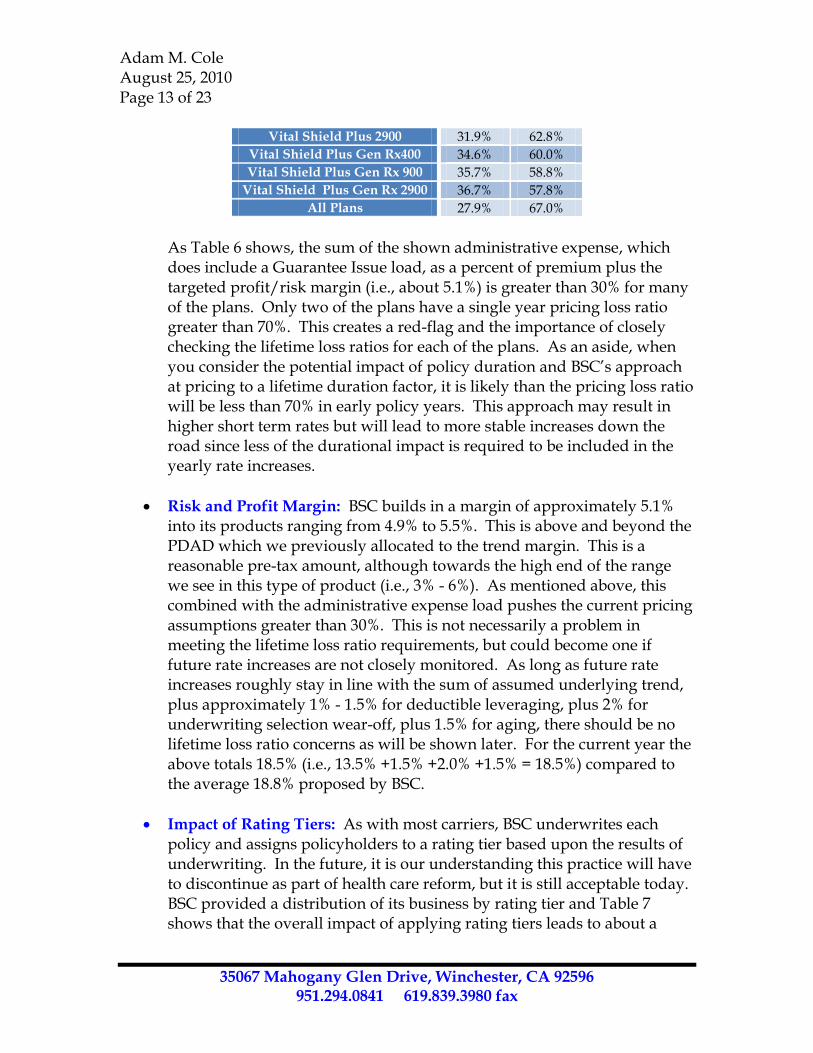
Vital Shield Plus 2900 31.9% 62.8%
Vital Shield Plus Gen Rx400 34.6% 60.0%
Vital Shield Plus Gen Rx 900 35.7% 58.8%
Vital Shield Plus Gen Rx 2900 36.7% 57.8%
All Plans 27.9% 67.0%
As Table 6 shows, the sum of the shown administrative expense, which does include a Guarantee Issue load, as a percent of premium plus the targeted profit/risk margin (i.e., about 5.1%) is greater than 30% for many of the plans. Only two of the plans have a single year pricing loss ratio greater than 70%. This creates a red-flag and the importance of closely checking the lifetime loss ratios for each of the plans. As an aside, when you consider the potential impact of policy duration and BSC’s approach at pricing to a lifetime duration factor, it is likely than the pricing loss ratio will be less than 70% in early policy years. This approach may result in higher short term rates but will lead to more stable increases down the road since less of the durational impact is required to be included in the yearly rate increases.
Risk and Profit Margin: BSC builds in a margin of approximately 5.1% into its products ranging from 4.9% to 5.5%. This is above and beyond the PDAD which we previously allocated to the trend margin. This is a reasonable pre-tax amount, although towards the high end of the range we see in this type of product (i.e., 3% - 6%). As mentioned above, this combined with the administrative expense load pushes the current pricing assumptions greater than 30%. This is not necessarily a problem in meeting the lifetime loss ratio requirements, but could become one if future rate increases are not closely monitored. As long as future rate increases roughly stay in line with the sum of assumed underlying trend, plus approximately 1% - 1.5% for deductible leveraging, plus 2% for underwriting selection wear-off, plus 1.5% for aging, there should be no lifetime loss ratio concerns as will be shown later. For the current year the above totals 18.5% (i.e., 13.5% +1.5% +2.0% +1.5% = 18.5%) compared to the average 18.8% proposed by BSC.
Impact of Rating Tiers: As with most carriers, BSC underwrites each policy and assigns policyholders to a rating tier based upon the results of underwriting. In the future, it is our understanding this practice will have to discontinue as part of health care reform, but it is still acceptable today. BSC provided a distribution of its business by rating tier and Table 7 shows that the overall impact of applying rating tiers leads to about a
Adam M. Cole August 25, 2010 Page 14 of 23
35067 Mahogany Glen Drive, Winchester, CA 92596 951.294.0841 619.839.3980 fax
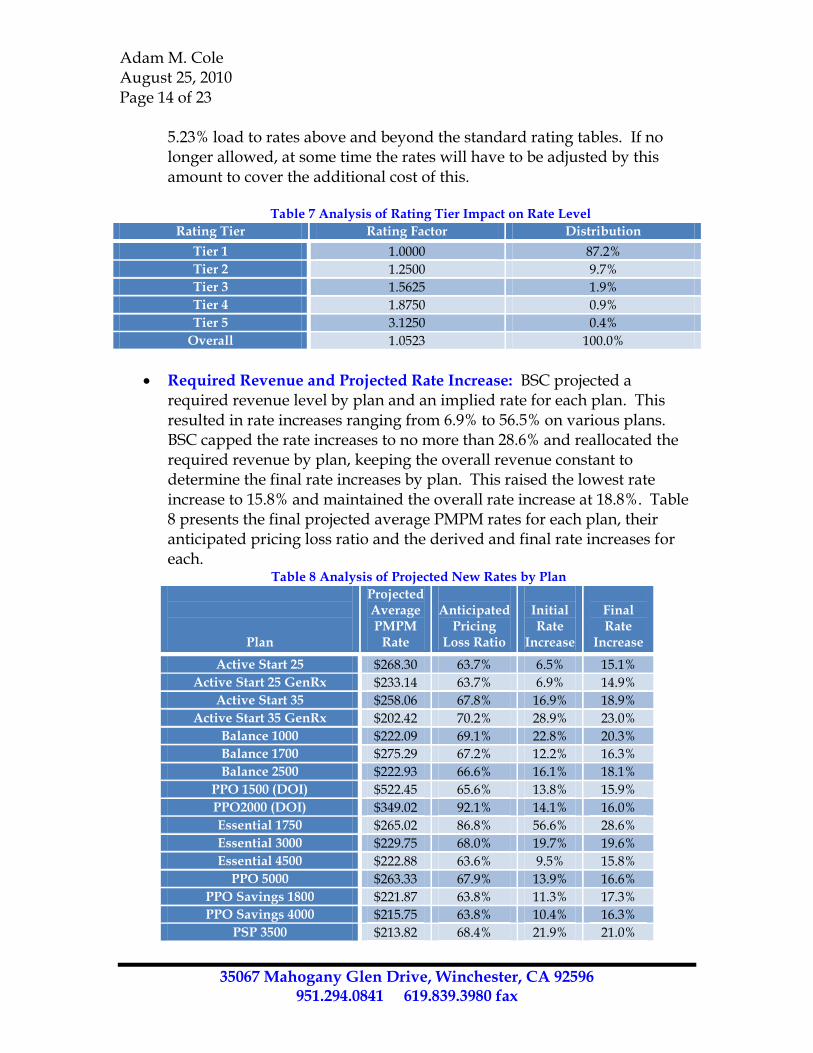
5.23% load to rates above and beyond the standard rating tables. If no longer allowed, at some time the rates will have to be adjusted by this amount to cover the additional cost of this.
Table 7 Analysis of Rating Tier Impact on Rate Level
Rating Tier Rating Factor Distribution
Tier 1 1.0000 87.2%
Tier 2 1.2500 9.7%
Tier 3 1.5625 1.9%
Tier 4 1.8750 0.9%
Tier 5 3.1250 0.4%
Overall 1.0523 100.0%
Required Revenue and Projected Rate Increase: BSC projected a required revenue level by plan and an implied rate for each plan. This resulted in rate increases ranging from 6.9% to 56.5% on various plans. BSC capped the rate increases to no more than 28.6% and reallocated the required revenue by plan, keeping the overall revenue constant to determine the final rate increases by plan. This raised the lowest rate increase to 15.8% and maintained the overall rate increase at 18.8%. Table 8 presents the final projected average PMPM rates for each plan, their anticipated pricing loss ratio and the derived and final rate increases for each.
Table 8 Analysis of Projected New Rates by Plan
Plan
Projected Average PMPM
Rate
Anticipated
Pricing Loss Ratio
Initial Rate
Increase
Final Rate
Increase
Active Start 25 $268.30 63.7% 6.5% 15.1%
Active Start 25 GenRx $233.14 63.7% 6.9% 14.9%
Active Start 35 $258.06 67.8% 16.9% 18.9%
Active Start 35 GenRx $202.42 70.2% 28.9% 23.0%
Balance 1000 $222.09 69.1% 22.8% 20.3%
Balance 1700 $275.29 67.2% 12.2% 16.3%
Balance 2500 $222.93 66.6% 16.1% 18.1%
PPO 1500 (DOI) $522.45 65.6% 13.8% 15.9%
PPO2000 (DOI) $349.02 92.1% 14.1% 16.0%
Essential 1750 $265.02 86.8% 56.6% 28.6%
Essential 3000 $229.75 68.0% 19.7% 19.6%
Essential 4500 $222.88 63.6% 9.5% 15.8%
PPO 5000 $263.33 67.9% 13.9% 16.6%
PPO Savings 1800 $221.87 63.8% 11.3% 17.3%
PPO Savings 4000 $215.75 63.8% 10.4% 16.3%
PSP 3500 $213.82 68.4% 21.9% 21.0%
Adam M. Cole August 25, 2010 Page 15 of 23
35067 Mahogany Glen Drive, Winchester, CA 92596 951.294.0841 619.839.3980 fax
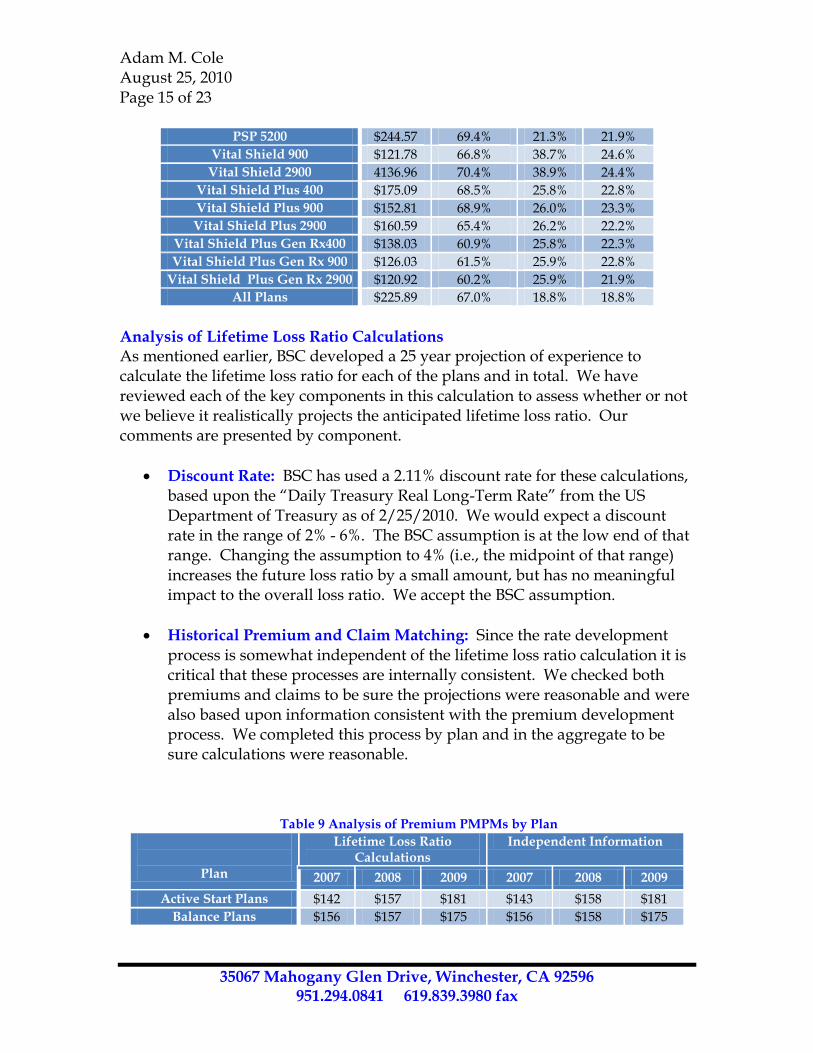
PSP 5200 $244.57 69.4% 21.3% 21.9%
Vital Shield 900 $121.78 66.8% 38.7% 24.6%
Vital Shield 2900 4136.96 70.4% 38.9% 24.4%
Vital Shield Plus 400 $175.09 68.5% 25.8% 22.8%
Vital Shield Plus 900 $152.81 68.9% 26.0% 23.3%
Vital Shield Plus 2900 $160.59 65.4% 26.2% 22.2%
Vital Shield Plus Gen Rx400 $138.03 60.9% 25.8% 22.3%
Vital Shield Plus Gen Rx 900 $126.03 61.5% 25.9% 22.8%
Vital Shield Plus Gen Rx 2900 $120.92 60.2% 25.9% 21.9%
All Plans $225.89 67.0% 18.8% 18.8%
Analysis of Lifetime Loss Ratio Calculations As mentioned earlier, BSC developed a 25 year projection of experience to calculate the lifetime loss ratio for each of the plans and in total. We have reviewed each of the key components in this calculation to assess whether or not we believe it realistically projects the anticipated lifetime loss ratio. Our comments are presented by component.
Discount Rate: BSC has used a 2.11% discount rate for these calculations, based upon the “Daily Treasury Real Long-Term Rate” from the US Department of Treasury as of 2/25/2010. We would expect a discount rate in the range of 2% - 6%. The BSC assumption is at the low end of that range. Changing the assumption to 4% (i.e., the midpoint of that range) increases the future loss ratio by a small amount, but has no meaningful impact to the overall loss ratio. We accept the BSC assumption.
Historical Premium and Claim Matching: Since the rate development process is somewhat independent of the lifetime loss ratio calculation it is critical that these processes are internally consistent. We checked both premiums and claims to be sure the projections were reasonable and were also based upon information consistent with the premium development process. We completed this process by plan and in the aggregate to be sure calculations were reasonable.
Table 9 Analysis of Premium PMPMs by Plan
Plan
Lifetime Loss Ratio Calculations
Independent Information
2007 2008 2009 2007 2008 2009
Active Start Plans $142 $157 $181 $143 $158 $181
Balance Plans $156 $157 $175 $156 $158 $175
Adam M. Cole August 25, 2010 Page 16 of 23
35067 Mahogany Glen Drive, Winchester, CA 92596 951.294.0841 619.839.3980 fax
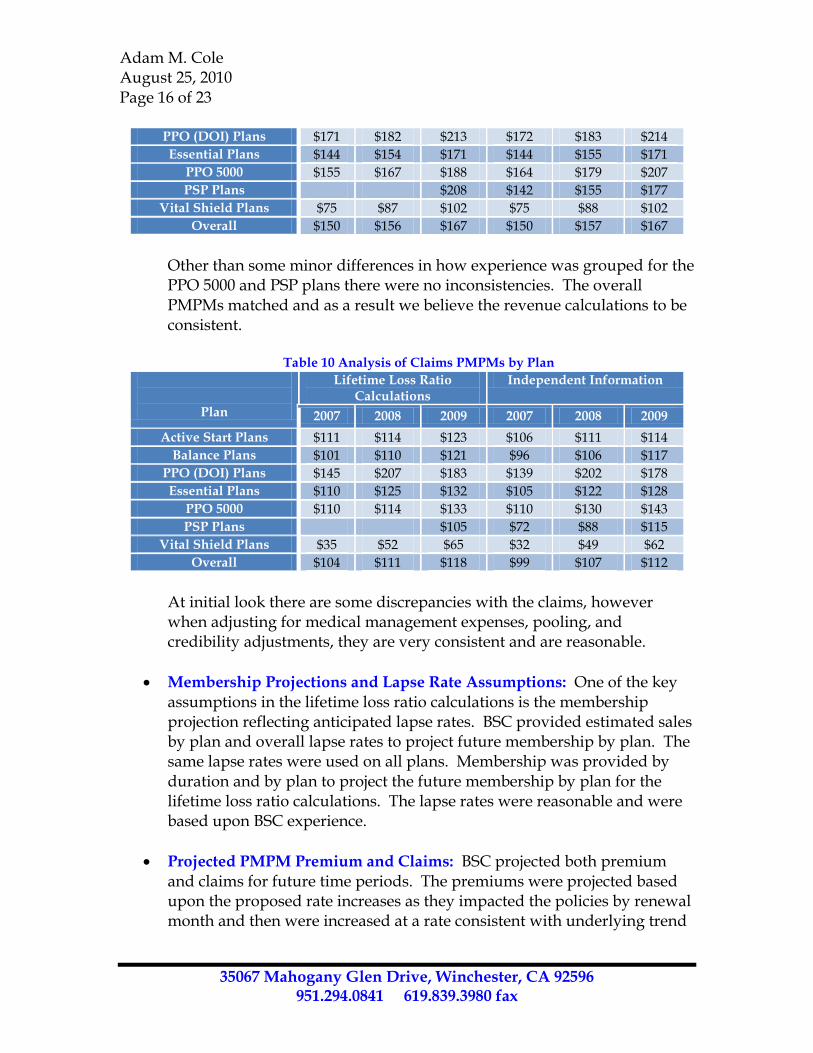
PPO (DOI) Plans $171 $182 $213 $172 $183 $214
Essential Plans $144 $154 $171 $144 $155 $171
PPO 5000 $155 $167 $188 $164 $179 $207
PSP Plans $208 $142 $155 $177
Vital Shield Plans $75 $87 $102 $75 $88 $102
Overall $150 $156 $167 $150 $157 $167
Other than some minor differences in how experience was grouped for the PPO 5000 and PSP plans there were no inconsistencies. The overall PMPMs matched and as a result we believe the revenue calculations to be consistent.
Table 10 Analysis of Claims PMPMs by Plan
Plan
Lifetime Loss Ratio Calculations
Independent Information
2007 2008 2009 2007 2008 2009
Active Start Plans $111 $114 $123 $106 $111 $114
Balance Plans $101 $110 $121 $96 $106 $117
PPO (DOI) Plans $145 $207 $183 $139 $202 $178
Essential Plans $110 $125 $132 $105 $122 $128
PPO 5000 $110 $114 $133 $110 $130 $143
PSP Plans $105 $72 $88 $115
Vital Shield Plans $35 $52 $65 $32 $49 $62
Overall $104 $111 $118 $99 $107 $112
At initial look there are some discrepancies with the claims, however when adjusting for medical management expenses, pooling, and credibility adjustments, they are very consistent and are reasonable.
Membership Projections and Lapse Rate Assumptions: One of the key assumptions in the lifetime loss ratio calculations is the membership projection reflecting anticipated lapse rates. BSC provided estimated sales by plan and overall lapse rates to project future membership by plan. The same lapse rates were used on all plans. Membership was provided by duration and by plan to project the future membership by plan for the lifetime loss ratio calculations. The lapse rates were reasonable and were based upon BSC experience.
Projected PMPM Premium and Claims: BSC projected both premium and claims for future time periods. The premiums were projected based upon the proposed rate increases as they impacted the policies by renewal month and then were increased at a rate consistent with underlying trend

Adam M. Cole August 25, 2010 Page 17 of 23
35067 Mahogany Glen Drive, Winchester, CA 92596 951.294.0841 619.839.3980 fax
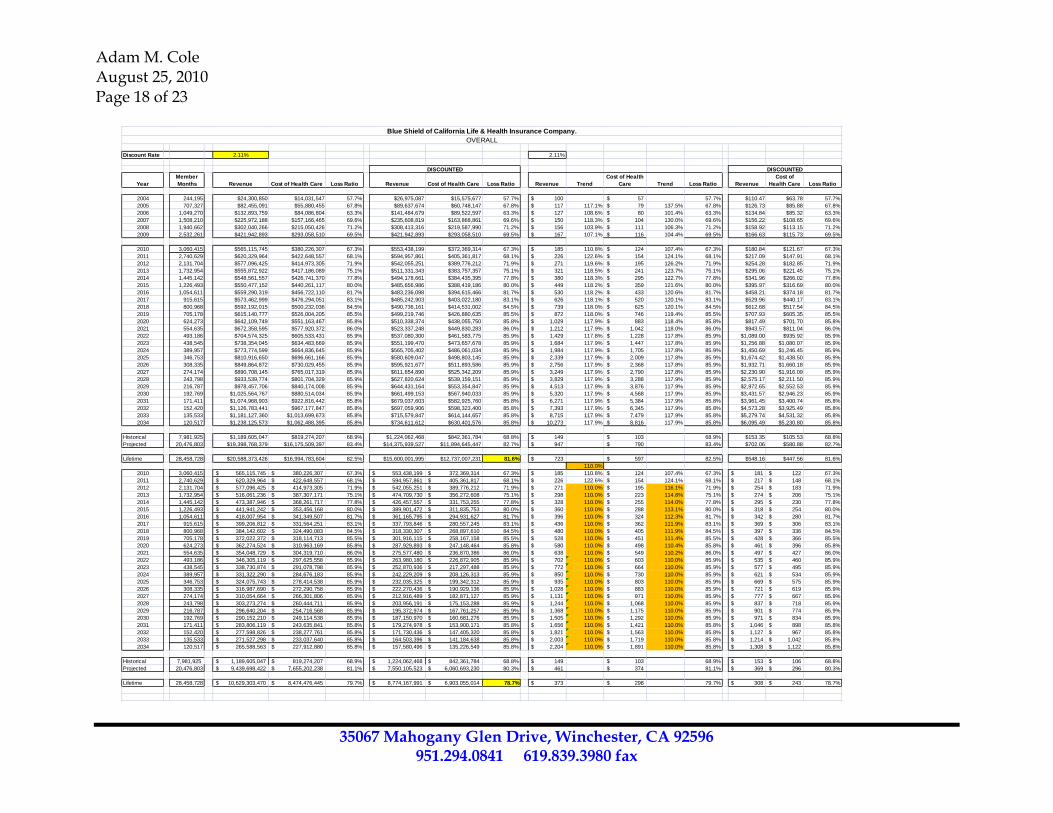
assumptions approximating 18% per year. The claims projection included the impact of inflation in addition to aging and the wear-off of selection (ie., the duration factor). BSC calculated durational adjustments by plan based upon selection factors and projected members by year by duration. The assumed impact of duration above and beyond inflation wore off by 2018. In other rate filings, specifically Anthem’s filing, the Department had encouraged Anthem to use an assumption of 8% or 10% for the out years of the projection. We modeled this for the BSC projections using a 10% assumption and this had the impact of lowering the overall lifetime loss ratio by 3 percentage points (i.e., 81.6% vs. 78.7%). We kept the durational impact in the claims projection. The table on the next page shows this calculation for the overall policies. The orange highlighted area shows the alternative increases that were applied. This durational impact (i.e., where claims are projected at a higher near term rate than premiums) is how the pricing loss ratio increases over time to produce a lifetime loss ratio that meets the 70% requirement even though the pricing loss ratio is less than 70%. This implies that BSC plans to increase future rates at a rate less than the increases in claims costs. This is consistent with saying that BSC has “prefunded” some of the future rate increases. In situations such as this some carriers choose to establish an active life reserve to in effect retain some of the earnings associated with these plans to a later day when needed to fund subsequent claims. We do not believe that BSC has established such reserves. As a result it will be critical to be sure that future rate increases are closely monitored to be sure that the lifetime loss ratio is maintained within projected ranges. BSC projection of lifetime loss ratio is not consistent with their practice to not establish active life reserves. As a result their calculations do not accurately reflect what will likely happen on this business. There are two alternatives here: establish active life reserves or modify projections and rate levels to reflect an alternate rating strategy.
Adam M. Cole August 25, 2010 Page 18 of 23
35067 Mahogany Glen Drive, Winchester, CA 92596 951.294.0841 619.839.3980 fax
Blue Shield of California Life & Health Insurance Company.
OVERALL
Discount Rate 2.11% 2.11%
DISCOUNTED DISCOUNTED
Year
Member
Months Revenue Cost of Health Care Loss Ratio Revenue Cost of Health Care Loss Ratio Revenue Trend
Cost of Health
Care Trend Loss Ratio Revenue
Cost of
Health Care Loss Ratio
2004 244,195 $24,300,850 $14,031,547 57.7% $26,975,087 $15,575,677 57.7% 100$ 57$ 57.7% $110.47 $63.78 57.7%
2005 707,327 $82,455,091 $55,880,455 67.8% $89,637,674 $60,748,147 67.8% 117$ 117.1% 79$ 137.5% 67.8% $126.73 $85.88 67.8%
2006 1,049,270 $132,893,759 $84,086,804 63.3% $141,484,679 $89,522,597 63.3% 127$ 108.6% 80$ 101.4% 63.3% $134.84 $85.32 63.3%
2007 1,508,210 $225,972,188 $157,166,465 69.6% $235,608,819 $163,868,861 69.6% 150$ 118.3% 104$ 130.0% 69.6% $156.22 $108.65 69.6%
2008 1,940,662 $302,040,266 $215,050,426 71.2% $308,413,316 $219,587,990 71.2% 156$ 103.9% 111$ 106.3% 71.2% $158.92 $113.15 71.2%
2009 2,532,261 $421,942,893 $293,058,510 69.5% $421,942,893 $293,058,510 69.5% 167$ 107.1% 116$ 104.4% 69.5% $166.63 $115.73 69.5%
2010 3,060,415 $565,115,745 $380,226,307 67.3% $553,438,199 $372,369,314 67.3% 185$ 110.8% 124$ 107.4% 67.3% $180.84 $121.67 67.3%
2011 2,740,629 $620,329,964 $422,648,557 68.1% $594,957,861 $405,361,817 68.1% 226$ 122.6% 154$ 124.1% 68.1% $217.09 $147.91 68.1%
2012 2,131,704 $577,096,425 $414,973,305 71.9% $542,055,251 $389,776,212 71.9% 271$ 119.6% 195$ 126.2% 71.9% $254.28 $182.85 71.9%
2013 1,732,954 $555,872,922 $417,186,089 75.1% $511,331,343 $383,757,357 75.1% 321$ 118.5% 241$ 123.7% 75.1% $295.06 $221.45 75.1%
2014 1,445,142 $548,561,557 $426,741,370 77.8% $494,178,661 $384,435,395 77.8% 380$ 118.3% 295$ 122.7% 77.8% $341.96 $266.02 77.8%
2015 1,226,493 $550,477,152 $440,261,117 80.0% $485,656,986 $388,419,186 80.0% 449$ 118.2% 359$ 121.6% 80.0% $395.97 $316.69 80.0%
2016 1,054,611 $559,290,319 $456,722,110 81.7% $483,236,098 $394,615,466 81.7% 530$ 118.2% 433$ 120.6% 81.7% $458.21 $374.18 81.7%
2017 915,615 $573,462,999 $476,294,051 83.1% $485,242,903 $403,022,180 83.1% 626$ 118.1% 520$ 120.1% 83.1% $529.96 $440.17 83.1%
2018 800,968 $592,192,015 $500,232,036 84.5% $490,736,161 $414,531,002 84.5% 739$ 118.0% 625$ 120.1% 84.5% $612.68 $517.54 84.5%
2019 705,178 $615,140,777 $526,004,205 85.5% $499,219,746 $426,880,635 85.5% 872$ 118.0% 746$ 119.4% 85.5% $707.93 $605.35 85.5%
2020 624,273 $642,109,749 $551,163,467 85.8% $510,338,374 $438,055,750 85.8% 1,029$ 117.9% 883$ 118.4% 85.8% $817.49 $701.70 85.8%
2021 554,635 $672,358,595 $577,920,372 86.0% $523,337,248 $449,830,283 86.0% 1,212$ 117.9% 1,042$ 118.0% 86.0% $943.57 $811.04 86.0%
2022 493,186 $704,574,325 $605,533,431 85.9% $537,080,300 $461,583,775 85.9% 1,429$ 117.8% 1,228$ 117.8% 85.9% $1,089.00 $935.92 85.9%
2023 438,545 $738,354,045 $634,483,669 85.9% $551,199,470 $473,657,678 85.9% 1,684$ 117.9% 1,447$ 117.8% 85.9% $1,256.88 $1,080.07 85.9%
2024 389,957 $773,774,599 $664,836,645 85.9% $565,705,402 $486,061,034 85.9% 1,984$ 117.9% 1,705$ 117.8% 85.9% $1,450.69 $1,246.45 85.9%
2025 346,753 $810,916,650 $696,661,166 85.9% $580,609,047 $498,803,145 85.9% 2,339$ 117.9% 2,009$ 117.8% 85.9% $1,674.42 $1,438.50 85.9%
2026 308,335 $849,864,872 $730,029,455 85.9% $595,921,677 $511,893,586 85.9% 2,756$ 117.9% 2,368$ 117.8% 85.9% $1,932.71 $1,660.18 85.9%
2027 274,174 $890,708,145 $765,017,319 85.9% $611,654,890 $525,342,209 85.9% 3,249$ 117.9% 2,790$ 117.8% 85.9% $2,230.90 $1,916.09 85.9%
2028 243,798 $933,539,774 $801,704,329 85.9% $627,820,624 $539,159,151 85.9% 3,829$ 117.9% 3,288$ 117.9% 85.9% $2,575.17 $2,211.50 85.9%
2029 216,787 $978,457,706 $840,174,008 85.9% $644,431,164 $553,354,847 85.9% 4,513$ 117.9% 3,876$ 117.9% 85.9% $2,972.65 $2,552.53 85.9%
2030 192,769 $1,025,564,767 $880,514,034 85.9% $661,499,153 $567,940,033 85.9% 5,320$ 117.9% 4,568$ 117.9% 85.9% $3,431.57 $2,946.23 85.9%
2031 171,411 $1,074,968,903 $922,816,442 85.8% $679,037,603 $582,925,760 85.8% 6,271$ 117.9% 5,384$ 117.9% 85.8% $3,961.45 $3,400.74 85.8%
2032 152,420 $1,126,783,441 $967,177,847 85.8% $697,059,906 $598,323,400 85.8% 7,393$ 117.9% 6,345$ 117.9% 85.8% $4,573.28 $3,925.49 85.8%
2033 135,533 $1,181,127,360 $1,013,699,673 85.8% $715,579,847 $614,144,657 85.8% 8,715$ 117.9% 7,479$ 117.9% 85.8% $5,279.74 $4,531.32 85.8%
2034 120,517 $1,238,125,573 $1,062,488,395 85.8% $734,611,612 $630,401,576 85.8% 10,273$ 117.9% 8,816$ 117.9% 85.8% $6,095.49 $5,230.80 85.8%
Historical 7,981,925 $1,189,605,047 $819,274,207 68.9% $1,224,062,468 $842,361,784 68.8% 149$ 103$ 68.9% $153.35 $105.53 68.8%
Projected 20,476,803 $19,398,768,379 $16,175,509,397 83.4% $14,375,939,527 $11,894,645,447 82.7% 947$ 790$ 83.4% $702.06 $580.88 82.7%
Lifetime 28,458,728 $20,588,373,426 $16,994,783,604 82.5% $15,600,001,995 $12,737,007,231 81.6% 723$ 597$ 82.5% $548.16 $447.56 81.6%
110.0%
2010 3,060,415 565,115,745$ 380,226,307$ 67.3% 553,438,199$ 372,369,314$ 67.3% 185$ 110.8% 124$ 107.4% 67.3% 181$ 122$ 67.3%
2011 2,740,629 620,329,964$ 422,648,557$ 68.1% 594,957,861$ 405,361,817$ 68.1% 226$ 122.6% 154$ 124.1% 68.1% 217$ 148$ 68.1%
2012 2,131,704 577,096,425$ 414,973,305$ 71.9% 542,055,251$ 389,776,212$ 71.9% 271$ 110.0% 195$ 116.1% 71.9% 254$ 183$ 71.9%
2013 1,732,954 516,061,236$ 387,307,171$ 75.1% 474,709,730$ 356,272,608$ 75.1% 298$ 110.0% 223$ 114.8% 75.1% 274$ 206$ 75.1%
2014 1,445,142 473,387,946$ 368,261,717$ 77.8% 426,457,557$ 331,753,255$ 77.8% 328$ 110.0% 255$ 114.0% 77.8% 295$ 230$ 77.8%
2015 1,226,493 441,941,242$ 353,456,168$ 80.0% 389,901,472$ 311,835,753$ 80.0% 360$ 110.0% 288$ 113.1% 80.0% 318$ 254$ 80.0%
2016 1,054,611 418,007,954$ 341,349,507$ 81.7% 361,165,795$ 294,931,627$ 81.7% 396$ 110.0% 324$ 112.3% 81.7% 342$ 280$ 81.7%
2017 915,615 399,206,812$ 331,564,251$ 83.1% 337,793,846$ 280,557,245$ 83.1% 436$ 110.0% 362$ 111.9% 83.1% 369$ 306$ 83.1%
2018 800,968 384,142,602$ 324,490,083$ 84.5% 318,330,307$ 268,897,610$ 84.5% 480$ 110.0% 405$ 111.9% 84.5% 397$ 336$ 84.5%
2019 705,178 372,022,372$ 318,114,713$ 85.5% 301,916,115$ 258,167,158$ 85.5% 528$ 110.0% 451$ 111.4% 85.5% 428$ 366$ 85.5%
2020 624,273 362,274,524$ 310,963,169$ 85.8% 287,929,893$ 247,148,464$ 85.8% 580$ 110.0% 498$ 110.4% 85.8% 461$ 396$ 85.8%
2021 554,635 354,048,729$ 304,319,710$ 86.0% 275,577,480$ 236,870,386$ 86.0% 638$ 110.0% 549$ 110.2% 86.0% 497$ 427$ 86.0%
2022 493,186 346,305,119$ 297,625,558$ 85.9% 263,980,180$ 226,872,905$ 85.9% 702$ 110.0% 603$ 110.0% 85.9% 535$ 460$ 85.9%
2023 438,545 338,730,874$ 291,078,798$ 85.9% 252,870,936$ 217,297,488$ 85.9% 772$ 110.0% 664$ 110.0% 85.9% 577$ 495$ 85.9%
2024 389,957 331,322,290$ 284,676,183$ 85.9% 242,229,209$ 208,126,313$ 85.9% 850$ 110.0% 730$ 110.0% 85.9% 621$ 534$ 85.9%
2025 346,753 324,075,743$ 278,414,538$ 85.9% 232,035,325$ 199,342,312$ 85.9% 935$ 110.0% 803$ 110.0% 85.9% 669$ 575$ 85.9%
2026 308,335 316,987,690$ 272,290,758$ 85.9% 222,270,436$ 190,929,136$ 85.9% 1,028$ 110.0% 883$ 110.0% 85.9% 721$ 619$ 85.9%
2027 274,174 310,054,664$ 266,301,806$ 85.9% 212,916,489$ 182,871,127$ 85.9% 1,131$ 110.0% 971$ 110.0% 85.9% 777$ 667$ 85.9%
2028 243,798 303,273,274$ 260,444,711$ 85.9% 203,956,191$ 175,153,288$ 85.9% 1,244$ 110.0% 1,068$ 110.0% 85.9% 837$ 718$ 85.9%
2029 216,787 296,640,204$ 254,716,568$ 85.9% 195,372,974$ 167,761,257$ 85.9% 1,368$ 110.0% 1,175$ 110.0% 85.9% 901$ 774$ 85.9%
2030 192,769 290,152,210$ 249,114,538$ 85.9% 187,150,970$ 160,681,276$ 85.9% 1,505$ 110.0% 1,292$ 110.0% 85.9% 971$ 834$ 85.9%
2031 171,411 283,806,119$ 243,635,841$ 85.8% 179,274,978$ 153,900,171$ 85.8% 1,656$ 110.0% 1,421$ 110.0% 85.8% 1,046$ 898$ 85.8%
2032 152,420 277,598,826$ 238,277,761$ 85.8% 171,730,436$ 147,405,320$ 85.8% 1,821$ 110.0% 1,563$ 110.0% 85.8% 1,127$ 967$ 85.8%
2033 135,533 271,527,298$ 233,037,640$ 85.8% 164,503,396$ 141,184,638$ 85.8% 2,003$ 110.0% 1,719$ 110.0% 85.8% 1,214$ 1,042$ 85.8%
2034 120,517 265,588,563$ 227,912,880$ 85.8% 157,580,496$ 135,226,549$ 85.8% 2,204$ 110.0% 1,891$ 110.0% 85.8% 1,308$ 1,122$ 85.8%
Historical 7,981,925 1,189,605,047$ 819,274,207$ 68.9% 1,224,062,468$ 842,361,784$ 68.8% 149$ 103$ 68.9% 153$ 106$ 68.8%
Projected 20,476,803 9,439,698,422$ 7,655,202,238$ 81.1% 7,550,105,523$ 6,060,693,230$ 80.3% 461$ 374$ 81.1% 369$ 296$ 80.3%
Lifetime 28,458,728 10,629,303,470$ 8,474,476,445$ 79.7% 8,774,167,991$ 6,903,055,014$ 78.7% 373$ 298$ 79.7% 308$ 243$ 78.7%
Adam M. Cole August 25, 2010 Page 19 of 23
35067 Mahogany Glen Drive, Winchester, CA 92596 951.294.0841 619.839.3980 fax
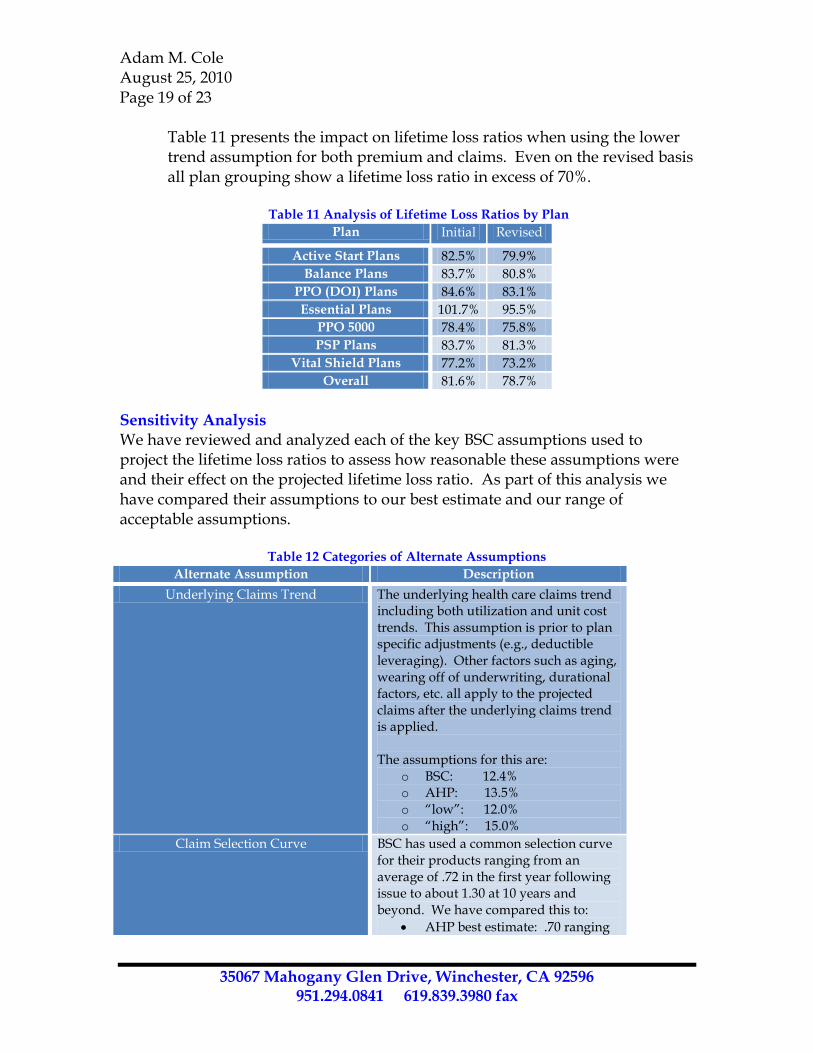
Table 11 presents the impact on lifetime loss ratios when using the lower trend assumption for both premium and claims. Even on the revised basis all plan grouping show a lifetime loss ratio in excess of 70%.
Table 11 Analysis of Lifetime Loss Ratios by Plan
Plan Initial Revised
Active Start Plans 82.5% 79.9%
Balance Plans 83.7% 80.8%
PPO (DOI) Plans 84.6% 83.1%
Essential Plans 101.7% 95.5%
PPO 5000 78.4% 75.8%
PSP Plans 83.7% 81.3%
Vital Shield Plans 77.2% 73.2%
Overall 81.6% 78.7%
Sensitivity Analysis We have reviewed and analyzed each of the key BSC assumptions used to project the lifetime loss ratios to assess how reasonable these assumptions were and their effect on the projected lifetime loss ratio. As part of this analysis we have compared their assumptions to our best estimate and our range of acceptable assumptions.
Table 12 Categories of Alternate Assumptions
Alternate Assumption Description
Underlying Claims Trend The underlying health care claims trend including both utilization and unit cost trends. This assumption is prior to plan specific adjustments (e.g., deductible leveraging). Other factors such as aging, wearing off of underwriting, durational factors, etc. all apply to the projected claims after the underlying claims trend is applied. The assumptions for this are:
o BSC: 12.4% o AHP: 13.5% o “low”: 12.0% o “high”: 15.0%
Claim Selection Curve BSC has used a common selection curve for their products ranging from an average of .72 in the first year following issue to about 1.30 at 10 years and beyond. We have compared this to:
AHP best estimate: .70 ranging
Adam M. Cole August 25, 2010 Page 20 of 23
35067 Mahogany Glen Drive, Winchester, CA 92596 951.294.0841 619.839.3980 fax
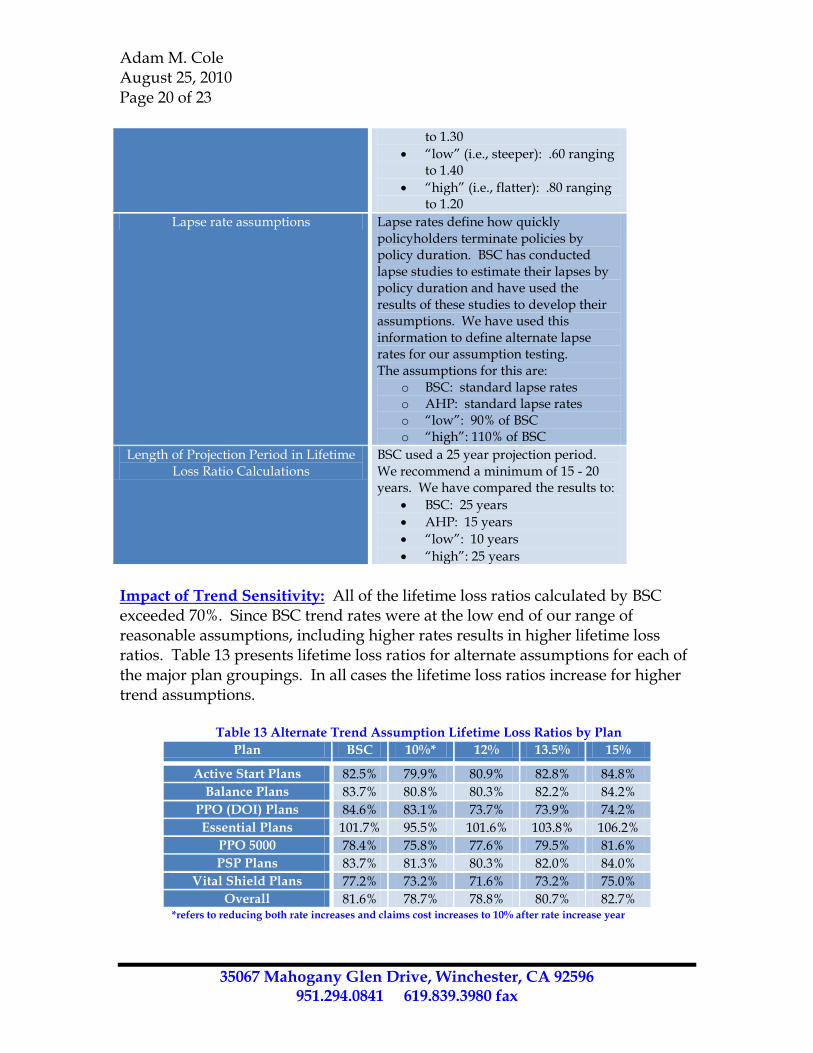
to 1.30
“low” (i.e., steeper): .60 ranging to 1.40
“high” (i.e., flatter): .80 ranging to 1.20
Lapse rate assumptions Lapse rates define how quickly policyholders terminate policies by policy duration. BSC has conducted lapse studies to estimate their lapses by policy duration and have used the results of these studies to develop their assumptions. We have used this information to define alternate lapse rates for our assumption testing. The assumptions for this are:
o BSC: standard lapse rates o AHP: standard lapse rates o “low”: 90% of BSC o “high”: 110% of BSC
Length of Projection Period in Lifetime Loss Ratio Calculations
BSC used a 25 year projection period. We recommend a minimum of 15 - 20 years. We have compared the results to:
BSC: 25 years
AHP: 15 years
“low”: 10 years
“high”: 25 years
Impact of Trend Sensitivity: All of the lifetime loss ratios calculated by BSC exceeded 70%. Since BSC trend rates were at the low end of our range of reasonable assumptions, including higher rates results in higher lifetime loss ratios. Table 13 presents lifetime loss ratios for alternate assumptions for each of the major plan groupings. In all cases the lifetime loss ratios increase for higher trend assumptions.
Table 13 Alternate Trend Assumption Lifetime Loss Ratios by Plan
Plan BSC 10%* 12% 13.5% 15%
Active Start Plans 82.5% 79.9% 80.9% 82.8% 84.8%
Balance Plans 83.7% 80.8% 80.3% 82.2% 84.2%
PPO (DOI) Plans 84.6% 83.1% 73.7% 73.9% 74.2%
Essential Plans 101.7% 95.5% 101.6% 103.8% 106.2%
PPO 5000 78.4% 75.8% 77.6% 79.5% 81.6%
PSP Plans 83.7% 81.3% 80.3% 82.0% 84.0%
Vital Shield Plans 77.2% 73.2% 71.6% 73.2% 75.0%
Overall 81.6% 78.7% 78.8% 80.7% 82.7% *refers to reducing both rate increases and claims cost increases to 10% after rate increase year
Adam M. Cole August 25, 2010 Page 21 of 23
35067 Mahogany Glen Drive, Winchester, CA 92596 951.294.0841 619.839.3980 fax
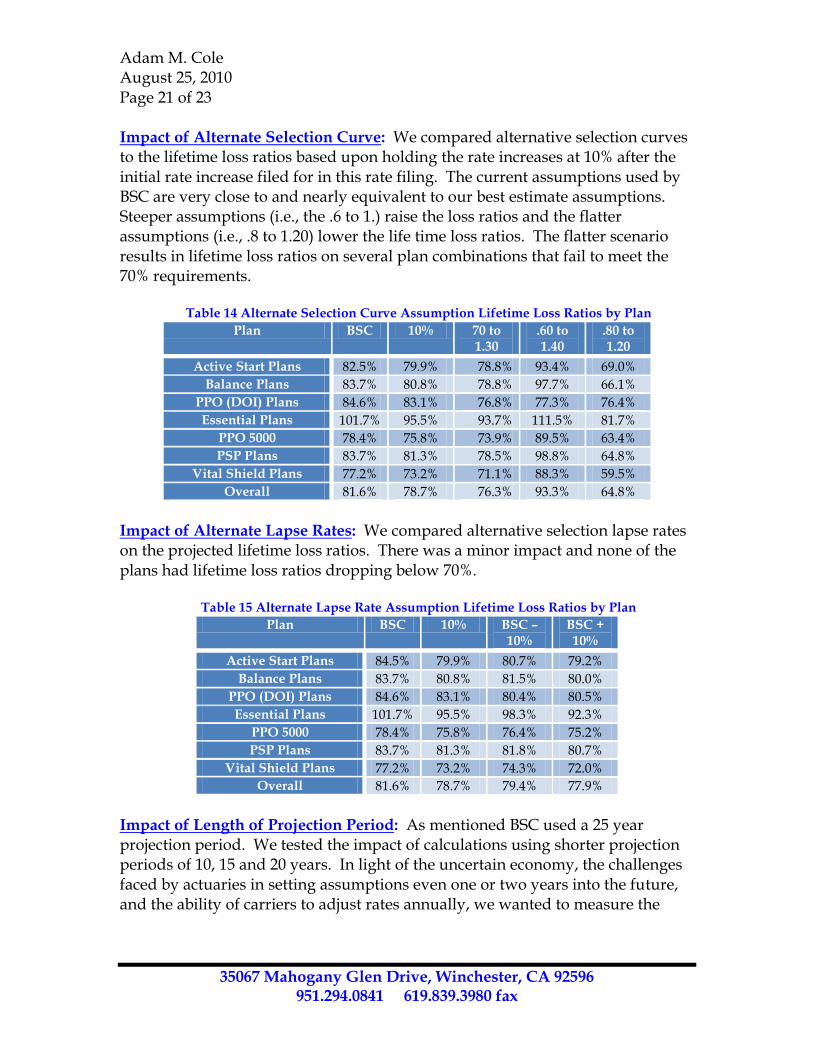
Impact of Alternate Selection Curve: We compared alternative selection curves to the lifetime loss ratios based upon holding the rate increases at 10% after the initial rate increase filed for in this rate filing. The current assumptions used by BSC are very close to and nearly equivalent to our best estimate assumptions. Steeper assumptions (i.e., the .6 to 1.) raise the loss ratios and the flatter assumptions (i.e., .8 to 1.20) lower the life time loss ratios. The flatter scenario results in lifetime loss ratios on several plan combinations that fail to meet the 70% requirements.
Table 14 Alternate Selection Curve Assumption Lifetime Loss Ratios by Plan
Plan BSC 10% 70 to 1.30
.60 to 1.40
.80 to 1.20
Active Start Plans 82.5% 79.9% 78.8% 93.4% 69.0%
Balance Plans 83.7% 80.8% 78.8% 97.7% 66.1%
PPO (DOI) Plans 84.6% 83.1% 76.8% 77.3% 76.4%
Essential Plans 101.7% 95.5% 93.7% 111.5% 81.7%
PPO 5000 78.4% 75.8% 73.9% 89.5% 63.4%
PSP Plans 83.7% 81.3% 78.5% 98.8% 64.8%
Vital Shield Plans 77.2% 73.2% 71.1% 88.3% 59.5%
Overall 81.6% 78.7% 76.3% 93.3% 64.8%
Impact of Alternate Lapse Rates: We compared alternative selection lapse rates on the projected lifetime loss ratios. There was a minor impact and none of the plans had lifetime loss ratios dropping below 70%.
Table 15 Alternate Lapse Rate Assumption Lifetime Loss Ratios by Plan
Plan BSC 10% BSC – 10%
BSC + 10%
Active Start Plans 84.5% 79.9% 80.7% 79.2%
Balance Plans 83.7% 80.8% 81.5% 80.0%
PPO (DOI) Plans 84.6% 83.1% 80.4% 80.5%
Essential Plans 101.7% 95.5% 98.3% 92.3%
PPO 5000 78.4% 75.8% 76.4% 75.2%
PSP Plans 83.7% 81.3% 81.8% 80.7%
Vital Shield Plans 77.2% 73.2% 74.3% 72.0%
Overall 81.6% 78.7% 79.4% 77.9%
Impact of Length of Projection Period: As mentioned BSC used a 25 year projection period. We tested the impact of calculations using shorter projection periods of 10, 15 and 20 years. In light of the uncertain economy, the challenges faced by actuaries in setting assumptions even one or two years into the future, and the ability of carriers to adjust rates annually, we wanted to measure the
Adam M. Cole August 25, 2010 Page 22 of 23
35067 Mahogany Glen Drive, Winchester, CA 92596 951.294.0841 619.839.3980 fax
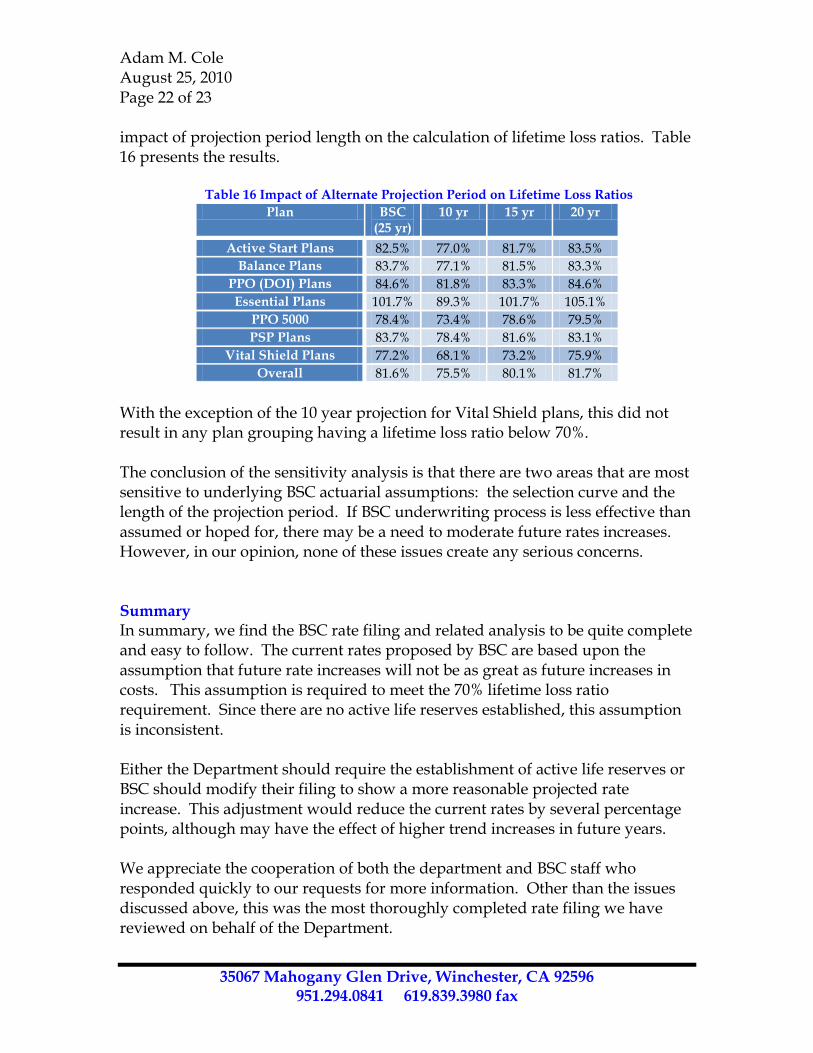
impact of projection period length on the calculation of lifetime loss ratios. Table 16 presents the results.
Table 16 Impact of Alternate Projection Period on Lifetime Loss Ratios
Plan BSC (25 yr)
10 yr 15 yr 20 yr
Active Start Plans 82.5% 77.0% 81.7% 83.5%
Balance Plans 83.7% 77.1% 81.5% 83.3%
PPO (DOI) Plans 84.6% 81.8% 83.3% 84.6%
Essential Plans 101.7% 89.3% 101.7% 105.1%
PPO 5000 78.4% 73.4% 78.6% 79.5%
PSP Plans 83.7% 78.4% 81.6% 83.1%
Vital Shield Plans 77.2% 68.1% 73.2% 75.9%
Overall 81.6% 75.5% 80.1% 81.7%
With the exception of the 10 year projection for Vital Shield plans, this did not result in any plan grouping having a lifetime loss ratio below 70%. The conclusion of the sensitivity analysis is that there are two areas that are most sensitive to underlying BSC actuarial assumptions: the selection curve and the length of the projection period. If BSC underwriting process is less effective than assumed or hoped for, there may be a need to moderate future rates increases. However, in our opinion, none of these issues create any serious concerns. Summary In summary, we find the BSC rate filing and related analysis to be quite complete and easy to follow. The current rates proposed by BSC are based upon the assumption that future rate increases will not be as great as future increases in costs. This assumption is required to meet the 70% lifetime loss ratio requirement. Since there are no active life reserves established, this assumption is inconsistent. Either the Department should require the establishment of active life reserves or BSC should modify their filing to show a more reasonable projected rate increase. This adjustment would reduce the current rates by several percentage points, although may have the effect of higher trend increases in future years. We appreciate the cooperation of both the department and BSC staff who responded quickly to our requests for more information. Other than the issues discussed above, this was the most thoroughly completed rate filing we have reviewed on behalf of the Department.
Adam M. Cole August 25, 2010 Page 23 of 23
35067 Mahogany Glen Drive, Winchester, CA 92596 951.294.0841 619.839.3980 fax
If you have any questions, please don’t hesitate to call Sincerely,
David V. Axene, FSA, CERA, FCA, MAAA President & Consulting Actuary cc: Perry Kupferman, FSA, MAAA, DOI John Fritz, FSA, MAAA, AHP Josh Axene, AHP