Embed Size (px)
Citation preview

Page 1 of 53
Axial and Extraaxial Skeletal Tuberculosis :Patterns andMimics on imaging
Poster No.: C-0922
Congress: ECR 2011
Type: Educational Exhibit
Authors: C. Kakkar1, A. M. Polnaya2, C. M. shetty3, K. Rajagopal1, P.
Koteshwara1, N. M. MULIMANI1, S. Sripathi1, V. R. K. Rao1;1Manipal, Karnataka/IN, 2Mangalore, Karnataka/IN, 3manipal, ka/IN
Keywords: Tropical diseases, Infection, Diagnostic procedure, Digitalradiography, CT, MR, Musculoskeletal spine, Musculoskeletaljoint, Musculoskeletal bone
DOI: 10.1594/ecr2011/C-0922
Any information contained in this pdf file is automatically generated from digital materialsubmitted to EPOS by third parties in the form of scientific presentations. Referencesto any names, marks, products, or services of third parties or hypertext links to third-party sites or information are provided solely as a convenience to you and do not inany way constitute or imply ECR's endorsement, sponsorship or recommendation of thethird party, information, product or service. ECR is not responsible for the content ofthese pages and does not make any representations regarding the content or accuracyof material in this file.As per copyright regulations, any unauthorised use of the material or parts thereof aswell as commercial reproduction or multiple distribution by any traditional or electronicallybased reproduction/publication method ist strictly prohibited.You agree to defend, indemnify, and hold ECR harmless from and against any and allclaims, damages, costs, and expenses, including attorneys' fees, arising from or relatedto your use of these pages.Please note: Links to movies, ppt slideshows and any other multimedia files are notavailable in the pdf version of presentations.www.myESR.org

Page 2 of 53
Learning objectives
1. To illustrate the various patterns of skeletal tuberculosis on imagingmodalities with emphasis on MR imaging.
2. To discuss the diagnostic features of skeletal tuberculosis at various sites.3. To illustrate the patterns of multifocal skeletal tuberculosis and discuss the
differential diagnosis.
Background
Extra-pulmonary tuberculosis occurs in 20% cases of tuberculosis with musculoskeletaltuberculosis occurring in 1-3% of cases.
Spine is the most common site of skeletal tuberculosis accounting for 50% cases ofskeletal tuberculosis followed by knee or hip in 30% cases.
Pubis, wrist, shoulder, and sacroiliac joint are rarer sites.
Extra-axial manifestations:
1.Tubercular arthritis 2. Osteomyelitis 3.Tenosynovitis and bursitis 4.Pyomyositis.
Multifocal skeletal tuberculosis is an even rarer entity accounting for 10% of total cases ofskeletal tuberculosis and should suggest an immunocompromised status of the patient.
Active pulmonary focus in skeletal tuberculosis is seen in less than 50% of cases.
Imaging plays a significant role in diagnosis and knowing the extent of disease.
Radiography:
Insensitive to early changes of disease. Late stages characteristic manifestations canbe seen as Phemister's triad in tubercular arthritis, spina ventosa in cases of tuberculardactylitis , spondylodiscitis with paraspinal abscesses especially with evidence ofcalcification.
Sonography useful for assessment of soft tissue involvement particularly tenosynovitis

Page 3 of 53
Cross sectional imaging in the form of CT and MRI sensitive for detection of early disease.
Detection of marrow changes and better contrast makes MRI the modality of choice atvarious sites.
Final diagnosis requires either histopathology , culture or PCR assay.
Imaging findings OR Procedure details
Patterns of spinal Involvement : Spondylitis and Spondylodiscitis , Discal sparing ,posterior elements involvement . Various forms can be paradiscal , central ,subligamentous and neural arch tuberculosis.
Tubercular osteomyelitis : Difficult to distinguish from other causes of osteomyelitis.
Tubercular arthritis : Characteristic findings like Phemister's triad, late stages fibrousankylosis can occur.
Tenosynovitis and bursitis:Compound palmar ganglion characterized by a swelling inthe distal part of volar aspect of wrist and communicating with another swelling over palmacross the flexor retinaculum.
Joint tuberculosis :
Tubercular arthritis or synovitis.
Sacroiliitis:
Unilateral involvement.On imaging may be indistinguishable from Brucellosis.
Multifocal tuberculosis:
Multifocal spondylitis or osteomyelitis. Strong mimic of aggressive pathologies suchas Langerhans cell histiocytosis , haematological and lymphoreticular malignancies inpediatric age group .In adults may be indistinguishable from secondaries or lymphoma.
Images for this section:

Page 4 of 53
Fig. 1: A) Lateral radiograph in adult patient showing a kyphotic deformity atthoracolumbar junction(gibbus)with intervertebral disc space reduction (Black arrow).B) Lateral radiograph in a child showing significant reduction in vertebral height withdestruction of intervertebral disc(White arrow).

Page 5 of 53
Fig. 2: Lateral radiograph of thoracolumbar spine showing disc space reduction and endplate irregularity (arrowhead).Paravertebal soft tissue noted on AP projection (arrows)

Page 6 of 53
Fig. 3: A) Paradiscal Spondylodiscitis: Lateral radiograph of Lumbosacral spine showsdisc space reduction with end plate irregularities at L4-L5 (arrow).

Page 7 of 53
Fig. 4: B contd.)T1 weighted sagittal image shows marrow hypointensity with reductionin the disc space (dotted arrow). C and D) On T2 and STIR images the marrow ishyperintense (arrows) with discal hyperintensity.There is reduction in the anterior heightof the L5 vertebra. E) Post contrast there is marrow enhancement , discal enhancementand epidural abscess (arrowhead).

Page 8 of 53
Fig. 5: Central Tuberculosis: A and B)T1 and T2 images shows altered signal intensityin the marrow of L3 vertebra(arrow).

Page 9 of 53
Fig. 6: C(contd.) Fat saturated image shows marrow hyperintensity(arrow) with a rightparavertebral soft tissue(arrowhead) .

Page 10 of 53
Fig. 7: D and E (contd.):Post contrast sagittal and coronal image shows marrowenhancement(arrow) with enhancing paravertebral soft tissue (arrowhead).
Fig. 8: Subligamentous spondylodiscitis: A,B,C and D) Sagittal T1,T2, STIR and postcontrast images show altered marrow signal intensity with prevertebral soft tissue(arrowhead) discal changes (dotted arrow)and epidural soft tissue (arrow). Post contrastsequence shows discal enhancement, peripherally enhancing prevertebral soft tissueand enhancing epidural soft tissue

Page 11 of 53
Fig. 9: E)contd.Coronal post contrast sequence shows peripherally enhancingsubphrenic collection (asterisk) with multiple small paravertebral collections (arrows)anddisc enhancement(arrowhead).

Page 12 of 53
Fig. 10: Subligamentous Tuberculosis: A)T2 fat saturated image shows prevertebral softtissue(arrow)with marrow hyperintensity (arrowhead). B) The prevertebral soft tissue isshowing peripheral enhancement on post contrast T1 image(arrow).
Fig. 11: C and D(contd.):Pre and Post contrast T1 images shows peripherally enhancingprevertebral soft tissue(arrow).

Page 13 of 53
Fig. 12: A and B) T1 and T2 Sag images show prevertebral soft tissue(arrow) ,epiduraltissue(arrowhead) with vertebral marrow changes(asterisk). C)Post contrast imageshows enhancing marrow ,prevertebral and epidural soft tissue.
Fig. 13: D and E (contd) : Pre and Post contrast T1 images show enhancingprevertebral,paravertebral soft tissue (arrow) with associated epidural component(arrowhead).Final Diagnosis : B-cell Lymphoma.

Page 14 of 53
Fig. 14: Neural Arch Tuberculosis: A and B) T1 and T2 axial images show altered signalintensity in the region of pedicle and lamina(arrowhead).Posterior element involvementcan lead to a diagnostic dilemma between an infective versus malignant process.

Page 15 of 53
Fig. 15: A and B: STIR sagittal image shows altered marrow signal intensity in the lowerlumbar vertebrae(arrow)with compression fracture of L4. There is hyperintensity notedinvolving the posterior elements(arrowhead).

Page 16 of 53
Fig. 16: C and D (contd.): T1 pre and post contrast image shows marrow hypointensityin L3 and L4 vertebra(arrow) with homogenous post contrast enhancement in bodyand posterior elements (dotted arrow). There is an enhancing epidural soft tissueposteriorly(arrowhead). No discal enhancement noted.
Fig. 17: A and B) Craniovertebral Junction Tuberculosis: Sagittal STIR image showsa hyperintense prevertebral soft tissue (arrowhead) which is isointense on T1. C)

Page 17 of 53
Post contrast enhancement with a non enhancing area suggestive of necrosis.Subtleenhancement of the marrow of dens noted(arrow).
Fig. 18: D and E(contd.): Post contrast enhancement noted in the right lateral mass ofC1(arrow) with prevertebral abscess at C2-C3 level (dotted arrow).
Fig. 19: Elderly patient with severe back ache.A and B) T1, T2 images show apathological fracture with convex posterior bulge (arrowhead) at L2 vertebra with alteredmarrow signal intensity(arrow).

Page 18 of 53
Fig. 20: C and D (contd.):On STIR sequence the marrow is hyperintense withenhancement post contrast(arrow).Diagnostic possibility of malignant pathology wasconsidered.Final diagnosis:Tubercular osteomyelitis

Page 19 of 53
Fig. 21: A) T1 coronal images show marrow hypointensity in the left iliac bone (arrows)with a small focal hypointensity in the right sacral ala (arrow) B) T2 fat saturated imageshows marrow hyperintensity in the sacrum and iliac bone with fluid in sacroiliac thejoint(arrowhead).
Fig. 22: C (contd.): T2 fat saturated image shows obliteration of the left sacroiliac joint(arrowhead). D) Post contrast enhancement of the marrow in the iliac bone and and rightsacral ala (arrow).Tubercular sacroiliitis with osteomyelitis. Close mimic at this site canbe Brucella osteomyelitis.

Page 20 of 53
Fig. 23: Tubercular synovitis A and B): T2 fat saturated images show nodular synovialthickening (arrows) with minimal effusion. Subtle bone changes also noted at the articularsurface(dotted arrow). A few enlarged lymph nodes noted on the posterior aspect of thethigh(arrowhead).
Fig. 24: C and D (contd): T1 sagittal pre-contrast image shows isointense synoviumwhich thickened and showing homogenous enhancement (arrow) on post contrast axialT1 with minimal effusion

Page 21 of 53
Fig. 25: Phemister's triad - Tubercular arthritis: A and B )Coronal soft tissuewindow image shows juxtarticular osteopenia (arrowhead) and joint space reduction(arrow).Bone window image shows a large juxtarticular erosion (dotted arrow).
Fig. 26: C(contd.) Fat saturated image shows joint space reduction (arrowhead).D,E)T1 axial images showing joint effusion (dotted arrow) with multiple juxtarticularerosions(arrow).

Page 22 of 53
Fig. 27: A)Lateral Radiograph showing obliteration of suprapatellar fat pad (arrowhead).B)Reduction of the medial joint space(arrow)and irregularity over the tibial plateau (dottedarrow)
Fig. 28: C and D (contd.) T2 fat saturated images sag and axial show joint effusion(arrow) with multiple erosions(arrowhead).E) Post contrast enhancing synovium with softadjacent myositis (dotted arrow). Final Diagnosis : Bacterial (Non -Tubercular arthritis)
Page 23 of 53
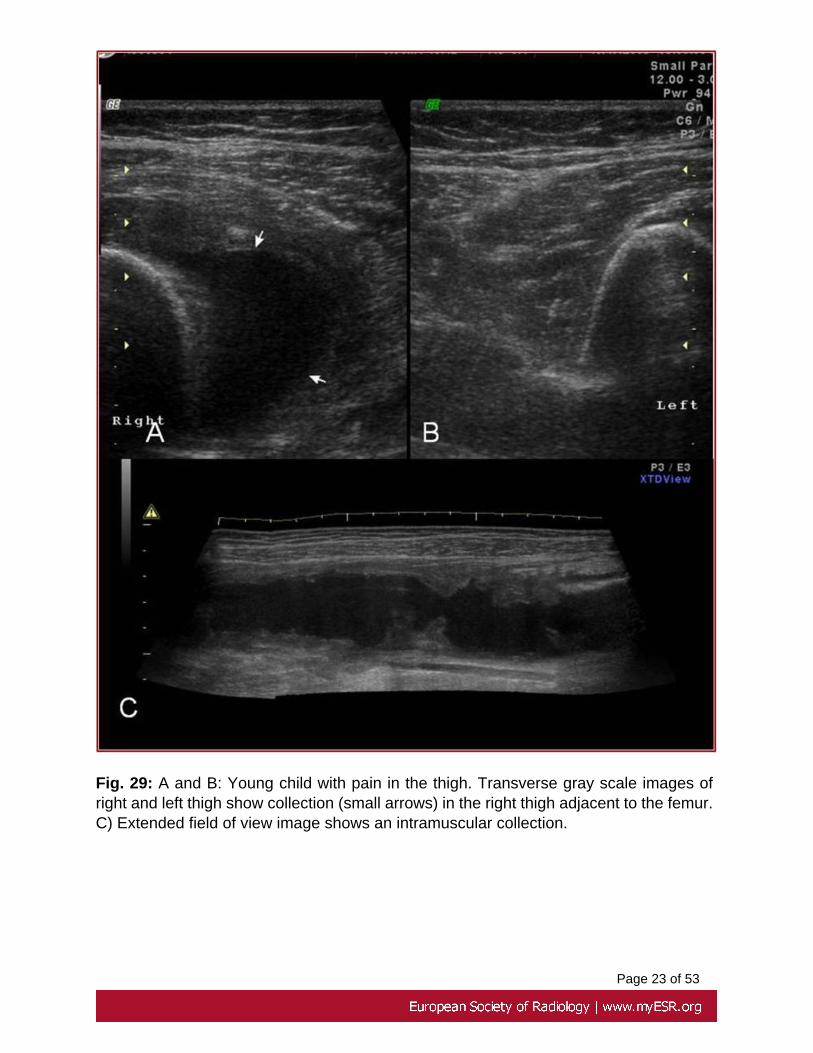
Fig. 29: A and B: Young child with pain in the thigh. Transverse gray scale images ofright and left thigh show collection (small arrows) in the right thigh adjacent to the femur.C) Extended field of view image shows an intramuscular collection.

Page 24 of 53
Fig. 30: D(contd.)Radiograph of femur shows solid periosteal reaction (arrow).

Page 25 of 53
Fig. 31: E )Fat saturated image shows a subperiosteal collection along the anterioraspect with indistinctness of the cortex in the region of collection.(arrow). F) Peripherallyenhancing intramuscular collections (dotted arrow). Tubercular osteomyelitis withpyomyositis.

Page 26 of 53
Fig. 32: A)Radiograph shows joint space reduction (arrowhead) with small lucencies.(arrow). B and C) T1 and T2 fat saturated images shows focal marrow changes (arrow)in the femoral head with minimal effusion along the inferior aspect of the joint.
Fig. 33: D and E(contd.) : Post contrast fat saturated T1 coronal and axial image showmarrow enhancement (arrow) with abscess formation in the soft tissue (arrowhead).

Page 27 of 53
Fig. 34: A and B) T2 fat saturated images show altered marrow signal in the lower tibiaand fibula(asterisk).

Page 28 of 53
Fig. 35: C(contd): T2 fat saturated image shows altered signal intensity in the talus andcalcaneum

Page 29 of 53
Fig. 36: D and E(contd.) T1 pre and post contrast image show marrow enhancement(arrowhead)and enhancing soft tissue (arrow).

Page 30 of 53
Fig. 37: A)Radiograph showing a lytic lesion in the calcaneum (arrow).Radiographicallydifferentials can be a primary calcaneal neoplasm,cyst,lipoma.

Page 31 of 53
Fig. 38: B(Contd):T1 image showing marrow signal change in the calcaneum (arrow)with cortical breach along the lateral aspect (dotted arrow). C,D) T2 image showsmarrow hyperintensity in the calcaneum. Post contrast the lesion showed peripheralenhancement .Tuberculous abscess.
Fig. 39: A and B) Bone window axial and coronal CT images showing increasedlucency in the proximal shaft of the humerus (arrow) with a cavity in the left upper lobe(arrowhead).C) Soft tissue window shows a hypodense collection in the anterior aspectof the joint(asterisk).

Page 32 of 53
Fig. 40: D and E(contd): T1 and T2 coronal image shows altered marrow signalintensity(arrows) with joint effusion(arrowhead) F and G: Post contrast there isenhancement of the marrow(arrow) with peripherally enhancing fluid collections in thejoint space. Tuberculous synovitis with osteomyelitis.

Page 33 of 53
Fig. 41: A and B) PA and Lateral radiograph of the hand shows periarticular osteopenia inhand and wrist bones with soft tissue swelling around the wrist joint. There is subluxationof distal ulna.

Page 34 of 53
Fig. 42: C and D(contd.) Compound ganglion: There is complex collection in theradiocarpal joint (arrows)with internal echoes(asterisk). There is subtle irregularity in thedistal radius(dotted arrow). (C:carpal bones,R:Radius)
Fig. 43: E(contd.)Longitudinal sonogram shows the complex collection is deep to theflexor tendon (arrow). F) Transverse sonogram shows collection around the flexortendons (arrows). The median nerve (discontinuous arrow) and ulnar nerve (arrowhead)are superficial to the collection.

Page 35 of 53
Fig. 44: Rib osteomyelitis: A ) There is small lytic lesion along the posterior aspect ofthe rib (arrow).B) There is a well defined lucent lesion with adjacent sclerosis along theposterior aspect of the rib.
Fig. 45: Disseminated Tuberculosis with rib involvement:A)Bone window image showslytic lesion in the anterior rib with multiple nodules in the lung (arrowhead). B)Soft tissuewindow image shows rib destruction with adjacent soft tissue. Consolidatory changes inthe posterior segments bilaterally(arrowhead).

Page 36 of 53
Fig. 46: Multifocal Spondylodiscitis: A and B ) STIR coronal ( Stitched images) revealmultifocal marrow changes in vertebra in upper and mid thoracic region (dotted arrow)with discal involvement and paravertebral soft tissue in thoracic region(arrows). Largesoft tissue noted in the region of right sacral ala(arrowhead).

Page 37 of 53
Fig. 47: C(contd.)Correlated sagittal CT shows lytic lesions in the vertebrae at multiplelevels(arrowhead)and a prevertebral soft tissue(arrows).
Page 38 of 53
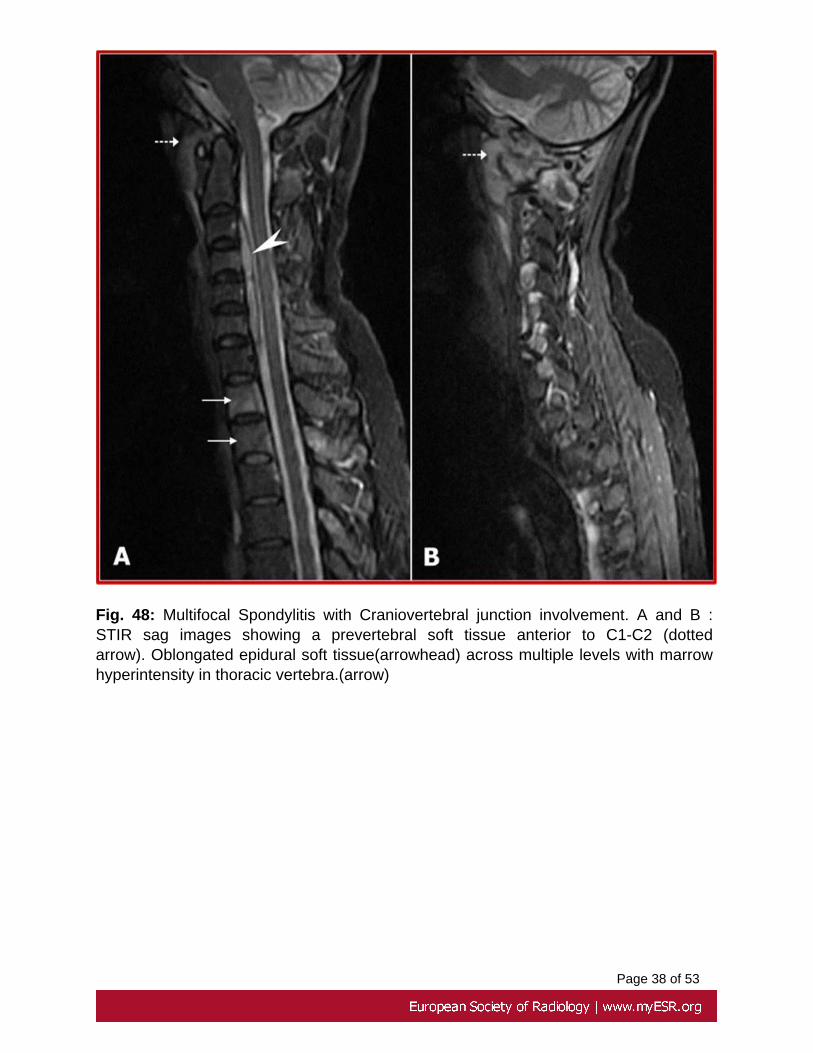
Fig. 48: Multifocal Spondylitis with Craniovertebral junction involvement. A and B :STIR sag images showing a prevertebral soft tissue anterior to C1-C2 (dottedarrow). Oblongated epidural soft tissue(arrowhead) across multiple levels with marrowhyperintensity in thoracic vertebra.(arrow)

Page 39 of 53
Fig. 49: C and D(contd.): Post contrast prevertebral abscess at C1-C2 (dotted arrow)and epidural abscess across multiple levels(arrowhead).Enhancing marrow in thoracicvertebrae(arrow).
Fig. 50: A:T1 weighted image shows collapsed vertebra (arrow) with heterogeneousmarrow signal intensity B:STIR images show collapsed vertebra(arrow) with marrowhyperintensity at different levels(arrowheads) C and D : Post contrast enhancement notedin the collapsed vertebra with marrow enhancement at different levels with magnifiedimage showing the detailed features. In Pediatric age group,Langerhans cell histiocytosisis a close differential for such appearance.

Page 40 of 53
Fig. 51: A and B: T1 weighted images of cervical and dorsal spine show marrow changesat multiple levels (arrows) with involvement of posterior elements(arrowhead).

Page 41 of 53
Fig. 52: C and D (contd.): Fat saturated images showing marrowhyperintensity(arrow)with paravertebral soft tissue(arrowhead).
Fig. 53: Multifocal Osteomyelitis : A) Radiograph of the pelvis showing multiple lyticlesions (arrows) in the left iliac bone and ischial tuberosity (arrowhead)B) Radiograph ofspine showing lytic destruction of the L3 vertebra involving the body.

Page 42 of 53
Fig. 54: C and D(contd.) :Fat saturated images show altered marrow signal intensity witha large soft tissue component (dotted arrow) in the iliac bone with multiple well definedhyper intensities (arrow) .
Page 43 of 53
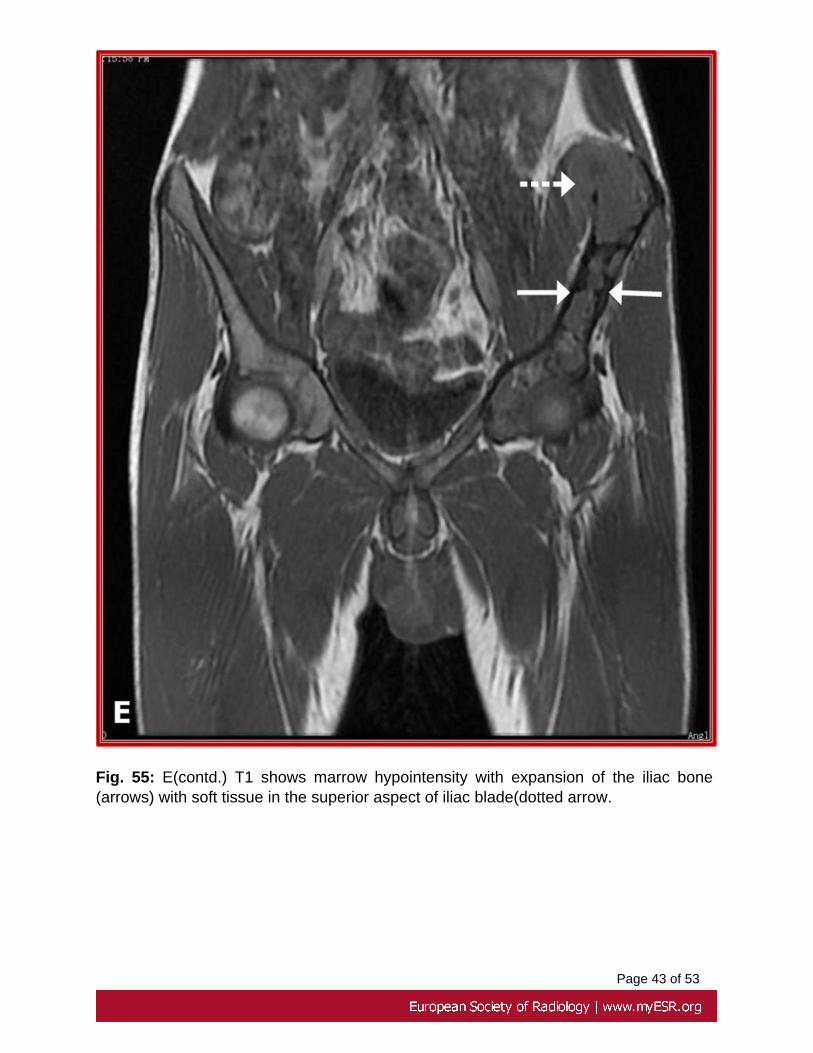
Fig. 55: E(contd.) T1 shows marrow hypointensity with expansion of the iliac bone(arrows) with soft tissue in the superior aspect of iliac blade(dotted arrow.

Page 44 of 53
Fig. 56: F and G(contd.) Post contrast multiple small peripherally enhancing lesions inthe acetabular roof (arrows) and a large peripherally enhancing collection in the left iliacbone (dotted arrows) .

Page 45 of 53
Fig. 57: A and B : Young girl with multiple well defined lytic lesions in lower femur andfibular head(arrows) and cortical thickening along the posterolateral cortex(arrowhead).

Page 46 of 53
Fig. 58: C and D(contd.): T1 and T2 fat sat show well defined lesions(arrows) in the lowerfemur and proximal tibia with marrow changes.
Fig. 59: E and F(contd.): Fat saturated T2 shows medullary signal change in the fibulawith cortical disruption (dotted arrow) and sinus track in the subcutaneous tissue(arrow).

Page 47 of 53
Fig. 60: G,H and I ) : Multiple peripherally enhancing lesions in femur , tibia and fibularhead (arrows) with an enhancing focus also in the lateral femoral condyle of contra laterallimb.
Fig. 61: A and B: T1 and T2 images show marrow signal intensity changes infemurs bilaterally with soft tissue on the left side.Serpigenous lesions with peripheralhypointensity noted within the meduallry cavity suggestive of infarcts.

Page 48 of 53

Page 49 of 53
Fig. 62: C(contd.) Fat saturated image reveals marrow hyperintensity in the femoralshafts bilaterally
Fig. 63: D and E(contd.): Post contrast images show intramedullary abscess formation(asterisk) with pyomyositis.
Fig. 64: Multifocal osteomyelitis of small bones of foot: A and B) T2 fat sat axial showsmarrow hyperintensity in medullary cavity of metatarsals and tarsal bones (arrows)

Page 50 of 53
Fig. 65: C and D(contd.):T2 fat sat sag shows altered signal intensity in the tarsal andmetatarsal (arrowhead)

Page 51 of 53
Fig. 66: E and F (contd.) : Post contrast sequence shows marrow enhancement(arrowhead) and enhancing thickened synovium (arrow)

Page 52 of 53
Conclusion
• Skeletal tuberculosis has an extensive spectrum of clinical and imagingmanifestations , can virtually involve any bone , joint or soft tissues.
• Imaging especially MRI has an important role in early detection andcharacterization of the disease at all sites and is the most preferred imagingmodality.
• Sonography is useful in superficial locations like wrist and ankle to look fortaenosynovitis and bursitis.
• Sonology can be used in guidance for therapeutic as well as diagnosticaspirations.
• Due to the variable appearance of the disease particularly multifocal formor atypical spinal tuberculosis the final diagnosis may not be possible onimaging alone and requires histopathological confirmation.
Personal Information
Dr Chandan Kakkar
Senior Resident
Department of Radiodiagnosis and Imaging
Kasturba Medical College and Hospital
Manipal, Karnataka
India.
ZIP code:576104
References
1.Adelard I De Backer, Filip M Vanhoenacker, Darshana A Sanghvi TUBERCULOSIS:Imaging features of extraaxial musculoskeletal tuberculosis. IJRI,. 2009, 19(3) ; 176-189
2.Morris B. S., Varma R., Garg A., Awasthi M., Maheshwari M. Multifocal musculoskeletaltuberculosis in children : appearances on computed tomography. Skeletal Radiol, 2002,31 : 1-8.
Page 53 of 53
3.De Vuyst D., Vanhoenacker F., Gielen J., Bernaerts A., and de Schepper A.M.:Imaging features of musculoskeletal tuberculosis. European Journal of Radiology 2003;13: 1809-1819.
4.Boachie-Adjei O, Squillante RG. Tuberculosis of the spine. Orthop Clin North Am.1996;27:95-103
5.Saleem S, Dab RH, Farooq T Hameed S Compound palmar ganglion with carpal tunnelsyndrome. J Coll Physicians Surg Pak. 2007 Apr;17(4):230-1.