Embed Size (px)
Citation preview

. A & & Z L z L 4 / C tD z55e AL4&
BX'JL-CC 1159 6
INFLUENCE OF C I R O N I C R E S T R A I N T OX GASTP.OIhTESTINAL FUNCTION I N THE RAT
F.!. F. Su l l ivan
Biology DeymXment, B a t t e l l e Irenorial I n s t i t u t e Pacific Northwest Laboratory, Richland, Washington
( 8 (ACCESSION NUMBER)
Fina l Technical Report
https://ntrs.nasa.gov/search.jsp?R=19680021878 2018-09-21T18:03:29+00:00Z

BNN,-CC:'l159 G
INFLUENCE OF CHROKIC RESTFAINT (33 CASTROIYl'ESTIXAL . FUXCTION I N THE RAT
BY
?.4. F. S u l l i v a n
F i n a l Technical Report
In t roduc t ion
I t wzs prev ious ly shown by Pfeiffer ' a t t h e Pxes Laboratory, and
again i n t h i s l abo ra to ry ,2 t h a t when t h e body novement of rats vias
seve re ly r e s t r i c t e d growth was impaired. Our previous s t u d i e s under t h i s
c o n t r a c t on t he a b s o r p i o n of sodium, ch lo r ide , calcium and water d i d not
indicate t h a t chronic r e s t r a i n t adversely affected t h a t funct ion. That
does no t , however, i n d i c a t e t h a t a l l func t ions under cond i t ions of r e s t r a i n t
are nornal , only that t h e i n t e s t i n e i s capable of absorbing n u t r i e n t s
presented t o it.
re spons ib l e f o r making n u t r i e n t s a v a i l a b l e t o t h e absorbing s u r f a c e of
t h e small . i n t e s t i n e which could exp la in t h e effect of r e s t r a i n t OR growth.
Those func t ions r e spons ib l e f o r t h a t process , g a s t r i c empying and i n t e s t i n e
There n i g h t s t i l l be a d e f e c t induced i n t h e func t ion I
m o t i l i t y were evaluated i n the p resen t s t u d i e s along wi th t h e e f f e c t of'
d i e t a r y a l t e r a t i o n s on those func t ions .
S ince space t r a v e l e r s may a l s o be exyosed t o r a d i a t i o n of varying
i n t e n s i t i e s and doses, and since it is a l r ezdy known t h a t a c u t e irradiaXiort
of t h e \thole body, t h e abdomen o r t h e head r e s u l t s i n a d e l a y i n g a s t r i c
?

2 -1
emptying af ter as small a dose a s 25 I?,3 t h e effect of both chkonic
i r r a d i a t i o n and r e s t r a i n t upon i n t e s t i n a l func t ion should be determined,
p a r t i c u l a r l y when it i s r e a l i z e d t h a t such exposures cay be encountered
over
body
time
a pe r iod of days r a t h e r t h a n i n a s i n g l e a c u t e exposure,
Experiments were performed such t h a t t h e effect o f r e s t r a i n t upon
xe igh t and upon g a s t r o i n t e s t i n a l func t ion (i .e., g a s t r i c emptying
and/or i n t e s t i n a l movenent) could be s tud ied . Restrained and non-
r e s t r a i n e d r a t s were Flaced on a normal d i e t , a h igh - fa t content d i e t , o r
a low-fat con ten t d i e t from t h e beginning of r e s t r a i n t u n t i l t h e animal
was s a c r i f i c e d i n o r d e r t o observe consequent effects . Additional
r e s t r a i n e d and non-restrained rats on a normal d i e t were subjected t o
continuous 6oCo exposure t o t a l i n g e i t h e r %SO R/day ('S3) o r %300 R/day (6%)
fron t h e beginning of r e s t r a i n t u n t i l . t h e time of s a c r i f i c e .
The animals used i n t h i s experiment were nale Charles River s t r a i n
CD r a t s .
t o determine t h e presence o f any d i s e a s e be fo re being placed i n s tock o r
experinienthl animal rooms.
A l l ra ts were held i n i s o l a t i o n q u a r t e r s f o r 2 weeks a f t e r r e c e i p t
The rats were then caged individuwl l y f o r
a t least 1 t o 2 weeks p r i o r t o being placed on exyerin?ent. R e s t r a i n t
1 cages were of t h e sane des ign as t h o s e uscd by Dfeiffer and t h e procedures 2 enrloyed have been r e r o r t e d ?reviously ,
of e q e r i m e n t s t h e non- re s t r a in ing ra t cages were a l t e r n a t e d with the
.4t a l l times and i n a l l series
r e s t r a i n t cages. Water was permit ted ad l i b i tum; food ms permit ted
ad l i b i tum except when ind ica t ed otherwise

- 1 3
A l l rats were weighed d a i l y , including week-ends. The spi.ce i n
the r e s t r a i n i n g cage was co r rec t ed d a i l y , i f necessary, according t o t h e
weight of t h e animal.
and water were changed d a i l y .
P e r t i n e n t c l i n i c a l parameters were noted, and food
Three sets of experiments were undertaken:
1, In f luence o f chronic r e s t r a i n t u3on g a s t r o i n t e s t i n a l func t ion
Restrained and non-restrained r a t s were caged i n d i v i d u a l l y f o r
pe r iods of time varying from 1 t o 31 days as shown i n Table I.
a was commenced i n t h e morning, w i th p e l l e t s of normal ra t d i e t
ad l ib i tum u n t i l t h e evening p r i o r t o t h e last morning of r e s t r a i n t , a t
R e s t r a i n t
permitted
which time a11 food was rerioved from the animals.
overnight i n an attempt t o i n s u r e r e l a t i v e l y uniform c o n d i t i o n s i n t h e
g a s t r o i n t e s t i n a l tract.
They were f a s t e d
On t h e morning of t h e func t ion t e s t t h e rats were alloi.red food
ad l i b i tum f r o n 30 min p r i o r t o t h e i n t r a g a s t r i c adriinis ' tration of ~0.5 m l
of lo6Ru c h l o r i d e and throughout t h e remainder of t h e e x p e r i m n t , (1n6,
is a non-absorbed beta-emit t ing i s o t o p e o f 0.04 *le!' naximum energy.)
c h a r a c t e r i s t i c s and t h e metabolism of 1"6Ru c h l o r i d e have been i n v e s t i g a t e d
and p b l i ~ h e d . ~ ' ~ One m l of H20 was used t o f l u s h t h e stomach tube be fo re
The
t h e animals were returned t o t h e i r cages. Restrained and non-restrained
animals were s a c r i f i c e d a t s e q u e n t i a l i n t e r v a l s fol lowing a d n i n i s t r a t ion
of t h e isotope.
Rats were k i l l e d by d e c a p i t a t i o n a t t h e i n t e r v a l s i nd icz t ed i n Table
The e n t i r e g a s t r o i n t e s t i n a l t r a c t was c z r e f u l l y renoved from each a n i n a l ,
%orma1 Rat Diet: Baked DGG Research Animal Laboratory Diet fsr F a t s and Mice, The Price-Wilhoite Co. , Frederick, Kcl.
1.

4
placed on wax paper and f rozen , thereby prevent ing t r a n s l o c a t i on of luminal
con ten t s and p rese rv ing t h e t i s s u e f o r l a t e r use . A t a l a te r t ime each
gut was placed upon a shee t of Kodak No-Screen Readi-Pal., X-ray f i l m f o r
autoradiogra.phy.
upon t h e pos t admin i s t r a t ion t ime i n t e r v a l T r i o r t o s a c r i f i c e .
These exposures va r i ed i n time from 90 t o 9GO min, depending
Subsequently, each gut was d iv ided i n t o a t least 10 s e c t i o n s €or
de te rmina t ion of t h e i so tope con ten t . The small i n t e s t i n e was d iv ided
i n t o fou r equal l eng ths , and t h e l a r g e i n t e s t i n e was d iv ided i n t o two
segments of equal length. Both t h e stomach and the cecum were d iv ided
i n t o a t least two s e c t i o n s each; however, counts were combined such t h a t
s i n g l e t o t a l s were obtained f o r t h e stomach and f o r t h e cecum. Cross-
contamination of t h e sec t ion ing process was minimized by us ing a c l ean
r azo r b l ade f o r each cut. Scc t ions were placed i n ind iv idua l count ing
tubes and t h e '06Ru con ten t determined by d i r e c t count u s ing a 3"
sodium iod ide t h a l l i u n - a c t i v a t e d c r y s t a l wel l -counter sh ie lded by lead .
The amount of r a d i o a c t i v i t y i n each seevent o f t h e gut was compared
t o t h e t o t a l q u a n t i t y i n j e c t e d and a percentage was obtained; t h e t o t a l
percentage of i so tope r e t a i n e d i n t h e e n t i r e g a s t r o i n t e s t i n a l t r a c t was
a l s o ca l cu la t ed .
2. Inf luence of a l t e r e d d i e t - - e i t h e r loit--fnt conten t o r high-fat content-- on g a s t r o i n t e s t i n a l func t ion of r e s t r a i n e d and of non-res t ra ined rats
Rats were t r e a t e d as ind ica t ed p rev ious ly except t h a t a t t h e time at
which r a t s were placed on experiment ( i n e i t h e r r e s t r a i n t o r i n non-
r e s t r a i n t cages) t h e i r d i e t was changed from t h a t o f normal ra t food

5
p e l l e t s ( 5 % f a t ) t o ' e i t h e r a low-fat content dieta(O% fat) o r a high-fa t
conten t d i e t b (45.5% f a t ) .
and t h e r e f o r e presented no unique problens i n feeding .
conten t d i e t , however, could not be given i n p e l l e t form because t h e high
q u a n t i t y of fa t i n t h e d i e t r e s u l t e d i n a s l u r r y which, upon s tanding ,
separa ted i n t o s o l i d material and o i l .
mixed d a i l y p r i o r t o feeding t h e ra ts ,
The low-fat conten t d i e t was i n a p e l l e t e d form
The h igh - fa t
T h i s food was t h e r e f o r e thoroughly
Because of t h i s t h e r e s t r a i n t cages had t o be modified s l i g h t l y .
In s t ead of being a b l e t o p l ace t h e food d i r e c t l y i n t h e cage, as i n t h e
case of t h e p e l l e t e d normal d i e t and t h e low-fat conten t d i e t , o r i n a
srnall c o n t a i n e r w i th in t h e cage, as i n the case of t h e non-restrained
r a t s on a high-fat content d i e t , a metal b in was cons t ruc ted such t h a t i
could be placed on t h e s i d e of t h e r e s t r a i n t ' c a g e , r e m i t t i n g t h e ra t t o
reach t h e food wi th h i s head, bu t e s s e n t i a l l y r e t a i n i n g t h e same Fhysica
dimensions as t h e o t h e r r e s t r a i n t cages.
Restrained and non-res t ra ined ra ts were maintained on t h e s e d i e t s
f o r per iods of time conparable t o t h o s e r a t s on a normal d i e t ( s ee Table I)
and were s a c r i f i c e d a t t h e p o s t a d n i n i s t r a t i o n t i n e s i n d i c a t e d , Adminis t ra t ion
of l o 6 ~ u , s z c r i f i c e of t h e rat and a n a l y s i s of i ts g a s t r o i n t e s t i n a l t r a c t
were i d e n t i c a l t o t h a t i nd ica t ed above.
The d i e t s were coi;?paratlle wi th r e s p c t t o t h e p r o t e i n , v i t m i n and s a l t
conten t . The h igh- fa t d i e t contained l e s s carbohydrate than d i d t h e normal
. d i e t (29% vs. 51%), 2nd t h e low-fat d i e t contained increased q u a n t i t i e s
o f both carbohydrate (SS.5% vs. 51%) and c e l l u l o s e (16.5% YS. 4.5%).
a '!Fat Free" Tes t Diet, N u t r i t i o n a l Biochemicals Cory., Cleve la id , Ohio btlIIigh Fa t" Test Diet, N u t r i t i o n a l Biochemicals Corp, , Cleveland, Ohio

-1 6
3 . In f luence of continuous i r r a d i a t i o n on t h e g a s t r o i n t e s t i n a l func t ion o f r e s t r a i n e d pad non-res t ra ined ra ts
Rats were placed i n r e s t r a i n t and c o n t r o l cages which were pos i t ioned
around a 6oCo source and exrosed t o e i t h e r 0 Tz, 50 F! o r 300 !?/day cont inuous
“Co exposure fo r va r ious pe r iods of t ime as indica ted i n Table I , Dosi,metry
measurenents were based upon Victoreen R-chanher readings and upon 1 ithiurn
f l o u r i d e capsu le s which were c a l i b r a t e d a g a i n s t t h e R-chambers. Lithium
f l o u r i d e capsules were irnplanted subcutaneously under t h e abdoxinal s k i n
i n a number o f animals i n o r d e r t o v e r i f y t h a t t h e dose a c t u a l l y received
was comparable t o t h a t measured i n air . The rats were i r r a d i a t e d f o r 23 h r
d a i l y , w i t h t h e source being lowered f o r one hour f o r an ina l c a r e and
weighing,
room, t h e neecl f o r us ing d i f f e r e n t sources f o r t h e two dose l e v e l s , t h e
Because o f phys ica l l i m i t a t i o n s ( t h e s i z e of t h e “Co exposwe
s i z e o f t h e cages and racks i n r e l a t i o n s h i p t o t h e dose d i s t r i b u t i o n i n t h e
exposure room, e t c . ) t h e number of a n i n a l s which could be ?laced on
experiment a t any one til-ilc was n e c e s s a r i l y r e s t r i c t e d ,
t h e r e f o r e had t o be cxyosed s e p a r a t e l y a t d i f f e r e n t t i n e s .
Crouas of a n i n a l s
A t , t h e corx lus ion o f t h e exposure ?er iod , t h e r e s t r a i n e d and t h e non-
r e s t r a i n e d r a t s were i n j e c t e d in t raduodenal ly wi th ‘“Iiu c h l o r i d e t o avoid
t h e coxy l i ca t ions due t o p o s s i b l e g a s t r i c re tc f i t ion a t t h e s e dose l e v e l s .
Two o r t h r e e s u t u r e s and a s k i n c l i p were u s u a l l y adeqxxte t o c l o s e t h e
mid-line i n c i s i m . A r e s t r a i n e d and a non-res t ra ined rat were s z c r i f i c e d
a t var ious i n t e r v a l s a f t e r i n j e c t i o n (Table I ) , a d t h e G I t r a c t was t r e a t e d
as nrevious ly ind ica t ed

' I 7
I n t e s t i n a l Flora: In f luence of R e s t r a i n t
Counts of col i form b a c t e r i a were made on j e j u n a l and i l ea l segments
of t h e i n t e s t i n e of rats as r epor t ed by FIahony, e t al.7
and non-restrained a n f n a l s were k i l l e d e i t h e r 7 days o r 21 days a f t e r being
Eoth r e s t r a i n e d
placed on r e s t r a i n t while on a normal d i e t and af ter 21 days o f r e s t r z i n t
wh i l e on a h igh - fa t con ten t d i e t .
divided i n t o t h r e e equal segments w i t h t h e upper and lower segnents being
u t i l i z e d fo r b a c t e r i a l counts , Using s t e r i l e technique, t h e l o n g i t u d i n a l l y
After sacrifice t h e i n t e s t i n e was
- opened i n t e s t i n e and i t s con ten t s were placed Tn a 10 cc. s t e r i l e s a l i n e
b o t t l e and a g i t a t e d f o r a t least 20 rnin i n a cons t an t temperature water b a t h
shaker after which f o u r ser ia l d i l u t i o n s of t h e lunen content were nade, each
d i l u t i o n being t h a t of 100 t o 1,
i n t o a Pe t r i d i s h t o which was added about -20 cc. o f XcConkey's Eiedium.
One cc. from each d i l u t i o n was t hen placed
Contents were well-mixed and were permit ted t o s t and overnight i n a
temperature c o n t r o l l e d incubator before being counted the fol lowing day. A.
Resu l t s
The d a i l y weight was compared t o t h e pre-exposure weight, and 2n
increase (>loo%) o r dec rease (<loo%) o f weight was c a l c u l a t e d f o r each
animal f o r each day. A mean percentage va lue was then obtained u s i n g va lues
from a l l animals on ex7eriment du r ing a given day o f r e s t r a i n t . These data
are plotted i n Fig. 1 fo r t h e animals on a normal d i e t , a low-fat con ten t
d i e t , o r a high-fat content d i e t , and i n Fig. 3 f o r the aniKals on a norval
d i e t which were sham-irradiated o r exposed t o 5U R o r 300 !?/day. The
number of rats a v a i l a b l e f o r such a mean d e t e r n i n a t i o n decreased wi th
increased time because a n i m l s were removed p e r i o d i c a l l y f o r i s o t o p e
admin i s t r a t ion and sacrifice. I t should be noted t h a t t h e weight of animals
n

8
obtained on t he i r f i n a l morning of r e s t r a i n t ( j u s t p r i o r t o i s o t o p e
admin i s t r a t ion ) was n o t included i n t h e data because they had been fasted
dur ing t h e previous n igh t .
The d i f f e r e n c e s between t h e mean percentage va lues were t e s t e d f o r
s ta t is t ical s i g n i f i c a n c e by a n a l y s i s of va r i ance (F t e s t ) .
is analogous t o a two-tai led t - t e s t [i.e., JIp= t).
s ta t is t ical test was not independent ( i . e , , d a t a from a l l animals was
pooled at each day) animals s a c r i f i c e d a t s p e c i f i c i n t e r v a l s were t e s t e d s e p a r a t e l y
(Mann-Nhitney I'U" t e s t ) ,6 These r e s u l t s were i n agreement with t h o s e shown
i n Tables 11-11.
This procedure
S ince each ind iv idua l
-
The percentage weight changes between t h e r e s t r a i n e d and t h e non-
r e s t r a i n e d rats on a r e g u l a r d i e t (Fig. 1 ar?d T a b l e H ) were s t a t i s t i c a l l y
s i g n i f i c a n t up t o and including t h e twenty-third day of r e s t r a i n t ,
non-signif icance o f t h e d i f f e r e n c e between t h e two groups of animals t h e r e -
The
after was due mainly t o t h e l a r g e s tandard e r r o r i n t h e non-restrained
animals caused n r i n a r i l y by one rat which d i d n e t ga in weight as r a y i d l y
as d i d ' t h e remaining ra ts i n t ha t group (as ind ica t ed by t h e comparatively
large standard e r ror a t t h e s e t imes ) .
The mean percentage weight ga in o r l o s s betweer, groups o f r e s t r a i n e d
and of non-restrained r a t s f e d a low-fat content d i e t c o n s i s t e n t l y was
s i g n i f i c a n t l y d i f f e r e n t a t a l l excegit i n t e r n i t t a n t time i n t e r v a l s .
Restrained and non-restrained rats on a high-Cat content d i e t showed
a s t a t i s t i c a l l y s i g n i f i c a n t d i f f e r e n c e i n weight changes a t a l l t i n e s
throughout t h e experiment.

9
The mean percentage d i f f e r e n c e between t h e weight changes of r e s t r a i n e d
and non-restrained ra ts on a normal d i e t , and on a low-or a high-fat content
d i e t are shown i n Fig. 2. 'While a s ta t i s t ica l comparison o f t h e s e va lues
was not p o s s i b l e , it can r e a d i l y be noted t h a t there wa-s l i t t l e d i f f e r e n c e
i n t h e mean percentage d i f f e r e n c e s betvieen t h e animals on a n o m a 1 d i e t and
t h o s e an a low-fat d i e t , and t h a t there was a considerably g r e a t e r difference
i n t h e nean pe rcen taee d i f f e r e n c e s between t h o s e animals on a high-fat
con ten t d i e t and those on either of t h e o t h e r tiso d ie t s . The s tandard e r r o r
. of t h e d i f f e r e n c e between t h e means was included a t 5-day i n t e r v a l s .
A t a l l ' i n t e r v a l s t h e mean percentage inc rease i n weight of non-restrained
aninals on a low-fat content d i e t was less than t h a t of t h e non-restrained
ra ts on a normal d i e t , whereas t h e non-restrained animals on a
content d i e t showed a percentage weight i n c r e a s e comparable t o t h e non-
r e s t r a i n e d animals on a r e g u l a r d i e t .
h igh - fa t
The r e s t r a i n e d ra t s showed t h e
g r e a t e s t mean percentage i n c r e a s e i n weight while on a r e g u l a r d i e t ,
t h e r e s t r a i n e d - ra ts on a high-fet content d i e t c o n s i s t a n t l y showed a weight
which was less than t h e i r i n i t i a l weight (<loo%), and t h e r e s t r a i n e d rats on
a low-fat content d i e t showed weight changes i n t e r m a i a t e between t h e s e two
p a t t e r n s : a d e c r e a s e i n weight u n t i l about t h e t w e l f t h day, a f t e r which
time t h e r e tias g e n e r a l l y an inc rease i n weight above t h e i n i t i a l weight,
al though a t no t i r e d i d t h i s i nc rease approach t h e weight i n c r e a s e s shown by
t h e corresponding non-restrained rats
I t i s o f i n t e r e s t t o n o t e t h e r e l a t i v e i 'ncreases o r changes i n weight
of t h e v a r i o u s
shown i n Table
groups. The decreasing o rde r of r e l a t i v e weight g a i n is
V I .

1 0
TABLE VI
RELATIVE I'iEIGIF GAIN AS A FUNCTION OF D I E T AND BODY IJOVEafENT . [Decreasing Order)
Diet Body Movement
High f a t o r normal Non-restrained
Normal Res t r a i n e d
L o w fa t Non-res t r a ined
Low f a t Res t r a i n e d
High f a t F k s t r a ined
The d a i l y weights o f r e s t r a i n e d and non-restrained rats p1,aced i n t h e
6oCo room arid exposed t o 0 R, %SO I? o r %300 R/day are shown i n Fig, 3
as a percentage oE t h e i r i n i t i a l m i g h t . There was l i t t l e d i f f e r e n c e i n
weight changes during days 1-9 between t h e 0 R c o n t r o l ra ts and t h e r a t s
exposed t o 50 R/day. Not u n t i l day 9 d i d t h e non-restrained ra t s r ece iv ing
50 D./day begin t o d i f f e r froin t h e non-restrained sham-irradiated rats.
S imi l a r ly , it was not u n t i l day 8 t h a t t h e r e s t r a i n e d ra t s r e c e i v i n g 50 Wday
d i f f e r e d from t h e r e s t r a i n e d sham-irradiated r a t s . In both t h e 0 E? and
50 R/day g r o u p t h e weight of t h e r e s t r a i n e d ra ts as a percentnge of
t h e i r i n i t i a l weight was s i g n i f i c a n t l y d i f f e r e n t from t h e sane parameter i n
t h e r e s p e c t i v e c o n t r o l groups on almost a l l days. The animals r e c e i v i n g
30@ R/day c o n s i s t e n t l y l o s t g r e a t e r amounts OF weight than d i d e i t h e r of
t h e other two groups. There was no s i g n i f i c a n t d i f f e r e n c e between t h e
response of t h e r e s t r a i n e d and t h e non-restrained r a t s a t t h i s dosage level ,
11
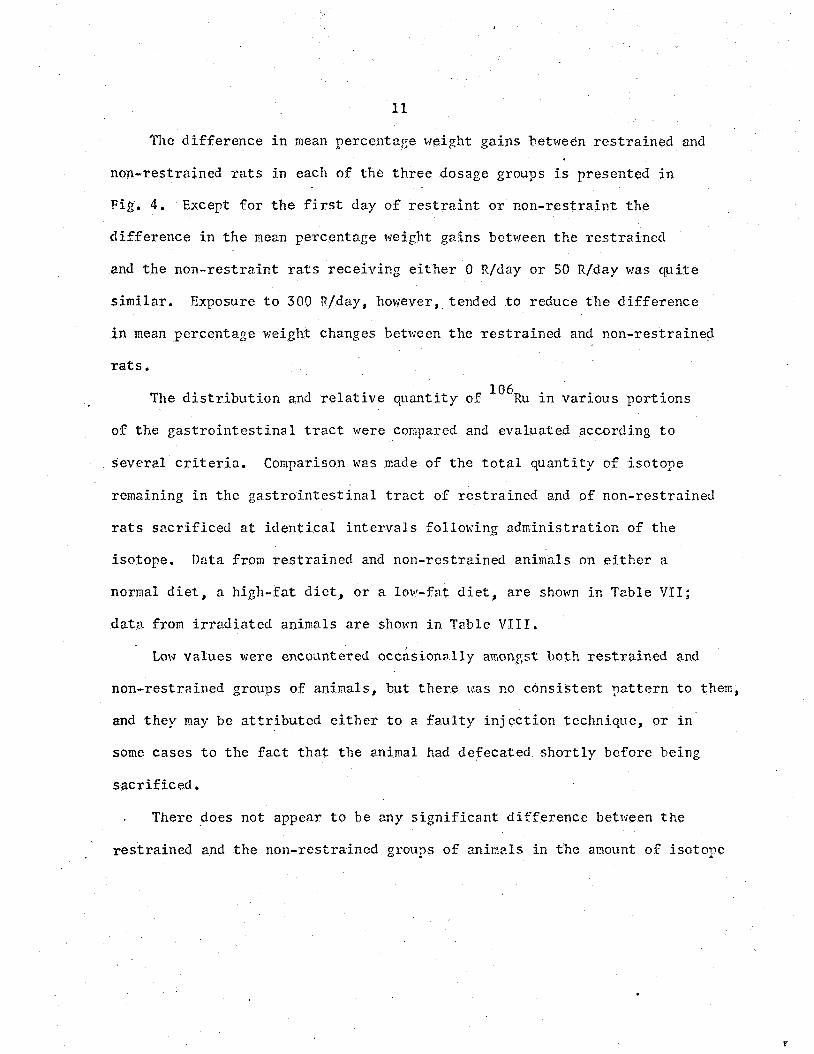
Tlie d i f f e r e n c e i n mean percentage weight g a i n s between r e s t r a i n e d and
non-restrained rats i n each of t h e t h r e e dosage groups is presented i n
Fig. 4. Except f o r t h e first day of r e s t r a i n t o r Eon- re s t r a in t t h e
d i f f e r e n c e i n t h e mean percentage weight g a i n s between the r e s t r a i n e d
and t h e non- re s t r a in t ra ts r e c e i v i n g e i ther 0 !?/day or 50 R/day was q u i t e
similar. Exposure t o 300 !?/day, however, tended t o reduce t h e d i f f e r e n c e
i n mean percentage weight changes between t h e r e s t r a i n e d and non-restrained
rats.
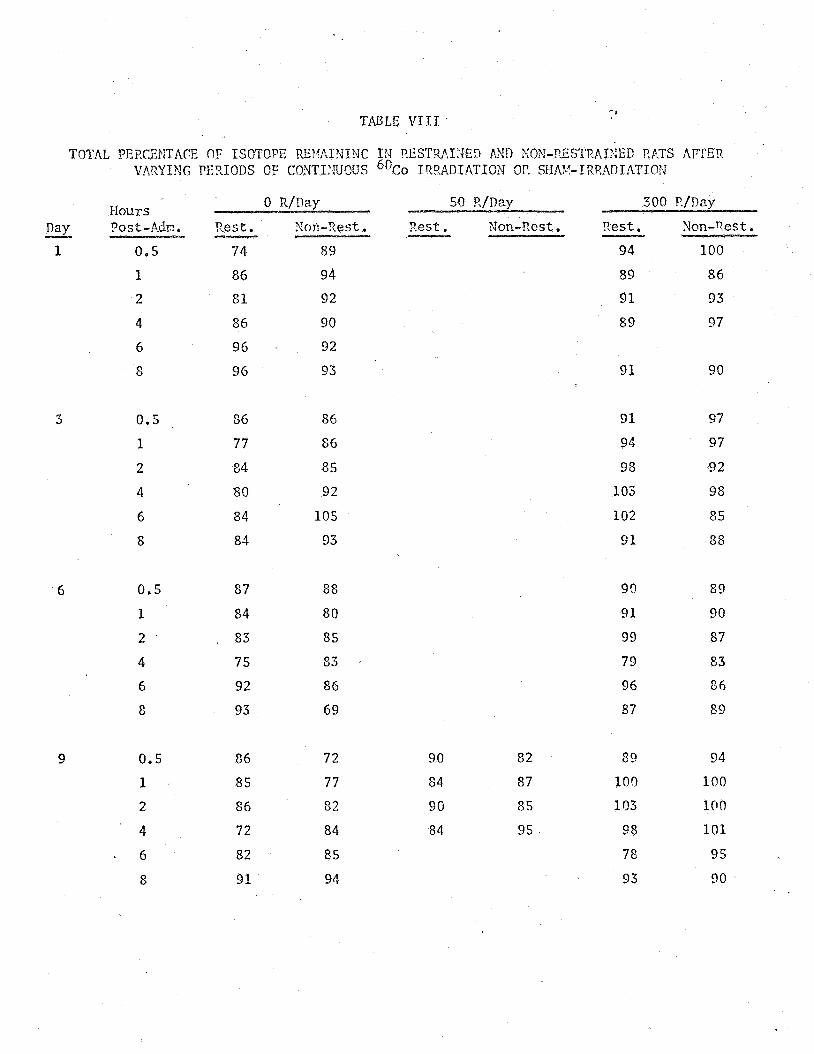
The d i s t r i b u t i o n and r e l a t i v e q u a n t i t y of "'Ru i n v a r i o u s p o r t i o n s
of t h e g a s t r o i n t e s t i n a l t r a c t were compared and evaluated according t o
several c r i t e r i a .
remaining i n t h e g a s t r o i n t e s t i n a l t r a c t of r e s t r a i n e d and of non-restrained
ra ts sacrificed a t i d e n t i c a l i n t e r v a l s fol lowing a d m i n i s t r a t i o n of t h e
i so tope .
normal d i e t , a h igh - fa t d i e t , o r a low-fat d i e t , are shown i n Table VII;
d a t a from i r r a d i a t e d animals are shown i n Table VIII.
Comparison was made of t h e t o t a l q u a n t i t y of i s o t o p e
Data from r e s t r a i n e d and non-rcstrzined animals on e i t h e r a
Low va lues were encountered occas iona l ly amongst both r e s t r a i n e d and
non-restrained groups of animals, but t h e r e 7m.s no c o n s i s t e n t F a t t e r n t o theR,
and t h e y may be a t t r i b u t e d e i t h e r t o a f a u l t y i n j e c t i o n technique, o r i n
some cases t o t h e fact t h a t t h e animal had de feca ted s h o r t l y before being
sacrificed.
. There does not appear t o be any s i g n i f i c a n t d i f f e r e n c e between t h e
r e s t r a i n e d and t h e non-restrained g r o u p of a n i s a l s i n t h e amount of iscztoqe

b
12
r e t a ined i n t h e animals a f t e r va r ious time i n t e r v a l s fo l lowing i s o t o p e
admin i s t r a t ion r e g a r d l e s s of t h e p a r t i c u l a r d i e t regimen. S i m i l a r l y t h e r e
does not appear t o be any p rogres s ive o r c o n s i s t e n t change as t h e length of
t h e r e s t r a i n t per iod was increased.
s i g n i f i c a n t d i f f e r e n c e between e i t h e r t h e res t ra ined . o r t h e non-restrained
animals on t h e va r ious d i e t s .
Fur ther t h e r e appears t o be no
Animals r e c e i v i n g 0, 50 o r 300 R/day l ikewise show no obvious o r c o n s i s t e n t
d i f f e r e n c e s , e i t h e r between r e s t r a i n e d o r non-res t ra ined animals a t a given
dosage l e v e l , o r between r e s t r a i n e d animals a t d i f f e r e n t dosage l e v e l s , or
between non-res t ra ined a n i n a l s a t d i f f e r e n t dosage l e v e l s . There l i kewise
appears t o be no d i f f e r e n c e between t h e r e s t r a i n e d and t h e non-res t ra ined
-
rats e i t h e r w i th inc reas ing time a f t e r i n j e c t i o n of t h e i so tope o r wi th
inc reas ing pe r iods of r e s t r a i n t and exposure t o continuous 6oCo i r r a d i a t i o n ,
Experiments were not c a r r i e d out beyond the 9-day exposure per iod because
t h e ma jo r i ty of t h e animals r ece iv ing 300 P,/day d ied on t h e t e n t h and
e leventh day of exposure.
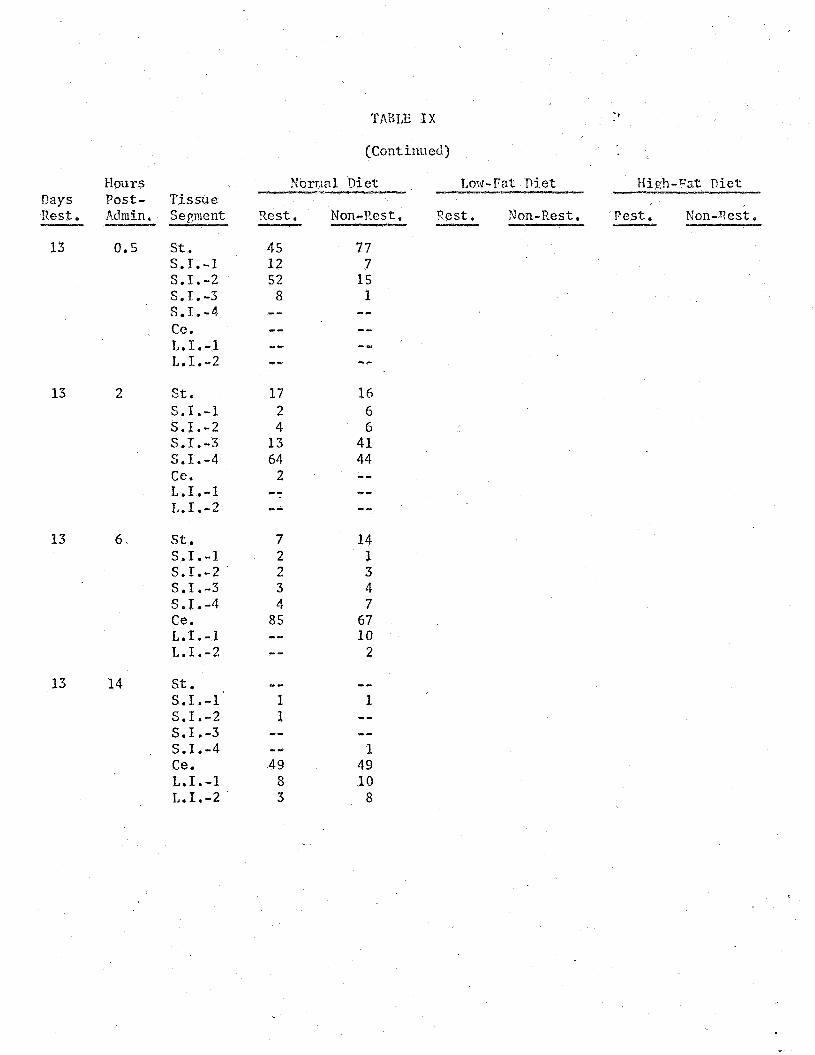
The q u a n t i t y of i s o t o p e r e t a i n e d i n stomachs i n t h o s e groups of animals
which were given t h e i s o t o p e v i a a stomach tube i s an i n d i c a t i o n of a func t ion
which nay be a f f e c t e d . T h i s d a t a , p resented i n Table I X , shows t h a t animals
e i t h e r on a h igh- fa t con ten t d i e t o r a low-fat conten t d i e t u s u a l l y
r e t a i n e d a s u b s t a n t i a l po r t ion of the con ten t s wi th in t h e stomach f o r a
longer per iod of time than d i d those animals 01: a normal d i e t . T h i s was
t r u e both f o r r e s t r a i n e d and f o r non-restrained animals. For example, a t

'I 13
6 h r af ter i n j e c t i o n fol lowing 3 days of r e s t r a i n t , r e s t r a i n e d . a n d non-
r e s t r a i n e d animals on a normal d i e t had 2% and 0% of t h e i so tope , r e s p e c t i v e l y ,
remaining i n t h e i r stomachs, whereas t h e r e s t r a i n e d and non-restrained
- i n
an(
animals on a low-fat con ten t d i e t r e t a i n e d 35% and 32%, r e s y e c t i v e l y , and
the animals on a high-fat content d i e t r e t a i n e d 22% and 47%, r e s p e c t i v e l y .
T h i s obse rva t ion was most n o t i c e a b l e beyond t h e 2-hr sacrifice per iod
fol lowing t h z i s o t o p e a d n i n i s t r a t i o n .
I
There d i d not appear t o be any s i g n i f i c a n t o r c o n s i s t e n t d i f f e r e n c e
t h e ariount of i s o t o p e r e t a i n e d i n t h e stomach \%/hen c o n p r i n g r e s t r a i n e d
non-restrained animals on a n o m a 1 d i e t . Although there are a nur.lber o f
s t r i k i n g exceptions, t h e non-restrained animals g e n e r a l l y r e t a i n e d an
amount approximately equal t o , o r g r e a t e r than, t h e r e s t r a i n e d animals
f o r t h e same t i n e per iod.
t h e t i n e of sacr i f ice a f t e r admin i s t r a t ion of t h e i so tope , and t h e d i s t r i b u t i o n
Nevertheless, cons ide r ing t h e dnys of r e s t r a i n t ,
of t h o s e comparisons i n which there was a l a r g e d i f f e r e n c e , t h e r e d i d not
appear t o be any p a t t e r n from which one could g e n e r a l i z e with r e s p e c t t o
t h e e f f e c t of r e s t r a i n t upon g a s t r i c r e t e n t i o n .
On t h e o t h e r hand, t h e non-restrained animals on t h e 101s-fat content
d i e t almost uniformly showed a g r e a t e r g a s t r i c r e t e n t i o n a t a l l tirlies a f t e r
i so tope a d n i n i s t r a t i o n t h a n d i d t h e r e s t r a i n e d a n i m l s on a low-fat con ten t
d i e t , I t l i t h t h e exception of t h o s e a n i m l s res t ra . ined f o r a per iod of 31 days
and/or t h o s e a n i n a l s s a c r i f i c e d 0.5 hr af ter i so tope a d n i n i s t r a t i o n .
t h e r e are a few except ions t o t h i s g e n e r a l i z a t i o n , t h e s e except ions between
Although

14
t h e r e s t r a i n e d and non-restrained anirnals are, f o r t h e most p a r t , small i n
magnitude and wi th in t h e range of experimental e r r o r .
Those animals on a high-fat content d i e t even more c l e a r l y decons t r a t ed
t h a t the non-restrained rats r e t a ined a h ighe r percentage of t h e administered
i so tope i n t h e stomach than d i d t h e r e s t r a i n e d ra t s .
c o n s i s t e n t exception t o t h i s statement:
high-fat d i e t , t h e r e s t r a i n e d a n i m l s sIicwel-: a g r e a t e r r e t e n t i o n t h m d i d
There was one
a f t e r 5 days o f r e s t r a i n t on n
t h e non-restrained animals. Af t e r a l l o t h e r periods o f r e s t r a i n t , and
at a l l time i n t e r v a l s fol lowing i s o t o r e admin i s t r a t ion , with t h e s i n g l e I
exce?tion of the 1/2-hour sacr i f ice per iod z%er 1s days r e s t r a i n t , t h e
non-restrained r a t s showed an increased r e t e n t i o n of t h e i s o t c r e coymrecl
t o t h e r e t e n t i o n exhibi ted by the r e s t r a i n e d a n i n a l s .
Comparisons u t i l i z i n g t h i s clata show tEtnt, i n a d d i t i o n t o t h e general ized
s t a t e n e n t p rev ious ly macle with r e s p e c t t o t h e r e t e n t i o n of the i s o t o p e
between r e s t r a i n e d and non-restrained anima 1s on a hiEh-fat o r a low-fat
d i e t a s compared t o those mir.ials on a no rca l d i e t , it can a l s o be s t a t e d '
t h a t t h e non-restrained animals on a high-Eat content d i e t exhibi ted
g r e a t e r g a s t r i c r e t e n t i o n a f te r 1 and 3 days on experiment t han d i d
corresponding groups o f non-restrained animals on a low-fat content regimen.
After 5 days of r e s t r a i n t t h e non-restrained a n i n a l s on a low-fat d i e t showed
g r e a t e r g a s t r i c r e t e n t i o n t h a n d i d t h e a n i m l s on a low-fat d i e t . After
longer pe r iods of r e s t r a i n t t h e r e was no obvious d i f f e r e n c e i n t h e g a s t r i c
r e t e n t i o n o f non-restrained aninials.
n

1 5
The c o q m r a b l e s i t u a t i o n with r e s p c c t t o t h e r e s t r a i n e d a n i n a l s d i d not
fol low t h e sane p a t t e r n s . The r e s t r a i n e d anirnals on a low-fat content d i e t
exh ib i t ed co ixp rab le o r g r e a t e r i so tope g a s t r i c r e t e n t i o n than d i d t h e
r e s t r a i n e d a n i n a l s on a h igh - fa t content d i e t . There were only two o r t h r e e
s i g n i f i c a n t d e v i a t i o n s from t h i s s ta tement , nanely t h e values i n d i c a t e d on
day 1 at 0.5 h r and 2 hr EollowinZ i s o t o p e admin i s t r a t ion and a t 2 h r
fol lowing a d n i n i s t r a t i o n af ter 3 days o f r e s t r a i n t .
The e i g h t s e c t i o n s o f t h e g a s t r o i n t e s t i n a l tract were examined f o r
- t h e d i s t r i b u t i o n of t h e i s o t o p e down t h e l eng th of t h e gut a t s equen t i a l
i n t e r v a l s fol lowing admin i s t r a t ion of t h e i so tope a € t e r va r ious pe r iods
of r e s t r a i n t . Conparisons were made between r e s t r a i n e d and non-restrained
animals on t h e va r ious d i e t s (Table I X ) and a f t e r v a r i o u s doses of
i r r a d i a t i o n (Table X) and among r e s t r a i n e d a n i n a l s under t h e s e v e r a l
experimental cond i t ions and among non-restrained n n i m l s under t h e s e v e r a l
experimental cond i t ions .
l i t t l e d i f f e r e n c e between r e s t r a i n e d and non-restrained animals on a normal
d i e t with r e s p e c t t o t h e d i s t r i b u t i o n of t h e ''%.Q i n t h e g a s t r o i n t e s t i n a l
t ract r e g a r d l e s s o f t h e hours elapsed since t h e time of a d m i n i s t r a t i o n of
t h e i s o t o p e . o r o f t h e l e n g t h of r e s t r a i n t p r i o r t o admin i s t r a t ion o f t h e
isotope.
r e s t r a i n e d animals a t .s?ecific t i n e i n t e r v a l s a f te r admin i s t r a t ion of t h e
Analyses of t h e data i n d i c a t e t h a t t h e r e was
Although d i f f e r e n c e s were noted between r e s t r a i n e d and non-
isotope, no tab ly z t 0.5 hr and a t 2 h r fol lowing admin i s t r a t ion , there d id
. n o t appear t o be any c o n s i s t e n t p a t t e r n i n t h e s e d e v i a t i o n s ; a t times
t h e r e s t r a i n e d animals showed more r a p i d movement of t h e i s o t o p e whi le a t

16
o t h c r t i n c s t h e non-restrained animals showed more rap id movement of t h e
isotoFe. The l a r g e s t and most cons i s t en t d i f f e r e n c e between r e s t r a i n e d
and non-restrained animals was seen at 9 days after r e s t r a i n t and a t
0.5 h r and 2 h r a f t e r i so tope adminis t ra t ion .
i n most ca ses t h e r e was com?aratively l i t t l e i so tope i n thk first segment
I t should be noted t h a t
o f t h e small i n t e s t i n e 0.9 h r a f t e r i n t r a g a s t r i c adminis t ra t ion of t h e
i so tope , t h e majori ty of t h e i so tope being e i t h e r i n t h e stomach o r
i n t h e seccnd o r t h i r d segments of t h e s n a l l i n t e s t i n e . A t 2 hr t h e aniinals
on a normal d i e t e x h i b i t t h e i r g r e a t e s t i so tope concent ra t ion i n e i t h e r t h e
t h i r d o r fou r th segment of t h e small i n t e s t i n e .
remained mainly i n t h e cecum of t h e an ina l s , with gene ra l ly l i t t l e
Beyond 2 h r t h e i so tope
d i f f e rence between r e s t r a i n e d and non-restrained animals.
Comparison of i so tope d i s t r i b u t i o n i n t h e gut of r e s t r a i n e d and non-
r e s t r a i n e d animals on a h igh- fa t content d i e t o f t e n showed t h a t t h e i so tope
moved dobm t h e g a s t r o i n t e s t i n a l tract sore r a p i d l y i n t h e r e s t r a i n e d
animrrls t han i n t h e non-restrained an iaa l s , p a r t i c u l a r l y on days 1, 6 and
9, and t o a l e s s e r ex ten t on day 18.
time period a f te r i n j e c t i o n on day 3 . Anifiials s a c r i f i c e d a f t e r 5 days of
r e s t r a i n t d id not show o r e x h i b i t t h i s effect.
This was a l s o noted a t t h e 0.5 hr
It should a l s o be noted t h a t , similar t o t h e animals on t h e normal
d i e t , 0.5 h r a f t e r adminis t ra t ion t h e major i ty of t h e i so tope was loca ted
e i t h e r i n t h e stomach o r i n t h e second or t h i r d segment of t h e sinall
i n t e s t i n e ; whereas, a t 2 h r t h e ma jo r i ty of t h e i so tope , a s i d e from stomach
content , was found almost exc lus ive ly i n t h e f o u r t h segment o f t h e small
i n t e s t i n e i n t h e animals on a h igh- fa t content d i e t .

17
The r e s t r z i n e d and non-restrained animals on a low-fat content d i e t
d i d not e x h i b i t c o n s i s t e n t d i f f e r e n c e s wi th r e spec t t o movement of t h e
i so tope dorm t h e i n t e s t i n e dur ing t h e first half-hour fol lowing i n j e c t i o n
of t h e i so tope . As with t h e o t h e r two d i e t s , t h e ma jo r i ty of t h e i so tope
i n t h e i n t e s t i n e was found i n t h e second and t h i r d , and i n some cases , fou r th ,
segment o f t h e small i n t e s t i n e .
Two h r a f t e r i so tope adminis t ra t ion both t h e r e s t r a i n e d and non-
r e s t r a i n e d animals on a low-fat d i e t showed t h a t a cons iderable percentage
of t h e i so tope WES r e g u l a r l y loca ted not only i n t h e f o u r t h segment: of
t h e small i n t e s t i n e , bu t a l s o i n t h e cecum of t h e animal.
c o n t r a s t t o t h e animals on t h e o t h e r two d i e t s ; seldom were s i g n i f i c a n t
percentages o f t h e i so tope seen i n t h i s segment t h a t e a r l y i n any of t h e
animals on e i t h e r a normal or h igh- fa t content d i e t ,
T h i s is i n
Furthermore, it
was not unusual t o d e t e c t s i g n i f i c a n t q u a n t i t i e s of t h e i so tope i n t h e
f i rs t segment of t h e l a r g e i n t e s t i n e a t t h i s time i n r e s t r a i n e d low-fat
animals.
between t h e passage t imes of r e s t r a i n e d and non-restrained animals on t h e
Beyond t h i s time, however, no apprec iab le d i f f e r e n c e was noted
low-fat content d i e t o r between animals on t h i s d i e t and those on o t h e r
d i e t regimens.
The passage of i n t e s t i n a l con ten t s of animals exposed t o e i t h e r SO R/day
or 300 R/day 6oCo i r r a d i a t i o n was not obviously d i f f e r e n t than thzt of sham-
i r r a d i a t e d animals (Table X). A comparison o f r e s t r a i n e d wi th non-restrained

18
a n i n a l s a t each r a d i a t i o n dosage level, of r e s t r a i n e d animals w i th each o t h e r
at a l l dosage l e v e l s , o r of non-restrained animals w i t h each o t h e r a t a l l
dosage l e v e l s f a i l e d t o show any c o n s i s t e n t d i f f e r e n c e s t h a t could be
a t t r i b u t e d e i t h e r t o expe r inen ta l t reatment o r t o d u r a t i o n of r e s t r a i n t
o r n o n - r e s t r a i n t arid concomitant exposure o r t o t i m e of sacrifice a f t e r I ,
i s o t o p e admin i s t r a t ion .
Co l i fo rn Counts
The r e s u l t s of t h e b a c t e r i a l counts on t h e i n t e s t i n a l f l o r a are shown
i n Table X I . I n a l l cases, as expected, t h e col i form counts contained i n
t h e j e j u n a l segncnt were l e s s than counts observed i n t h e i l e a l s e g m n t .
Excert f o r one of f o u r animals, t h e j e j u n a l counts i n a l l of h igh - fa t
con ten t animals, both r e s t r a i n e d and non-restrained, vas cons ide rab ly less
than i n t h o s e animals which were on a n o r m a l ' d i e t . There was no d i f f e r e n c e
between t h e i l e a l counts of a n i n a l s on a high-fat content d i e t and those
on a s t o c k d i e t . fJei ther was t h e r e any d i f f e r e n c e between t h e i l e a l co l i fo r r .
counts of r e s t r a i n e d and non-restrained animals r e g a r d l e s s of t h e frit content
i n t h e d i e t ,
Behavioral Tests
Add i t iona l ly , t h e r e were no bel-iavioral d i f f e r e n c e s noted betwceri t h e
behavior of t h e r e s t r a i n e d rats and t h e behavior of t h e non-restrained rats
when t h e animals were on (1) a n o r m 1 d i e t , (2) a low-fat content d i e t , o r
(3) when they were exposed t o r z d i a t i o n ,
r e s t r a i n t dic! affect t h e behavior of animals placed on a h igh- fa t content
d i e t , but not t h a t o f non-restrained rats
I t was, however, obvious t h a t
Restrained. a n i n a l s b e c m c

19
extremely aggres s ive dur ing t h e f irst 5 t o 6 days they were on r e s t r a i n t ,
a f t e r which t i n e they bec0m.e somewhat more d o c i l e , r e v e r t i n g t o near
normal behavior. Th i s f i n d i n g was extremely c o n s i s t e n t , l ead ing u s t o
test t h e response of a nuEber of animals by sub jec t ing them t o an audiogenic
stress.
parameter f o r measuring neuro logica l stress.8
d i e t or Jiigh-fat conten t d i e t were subjec ted t o r e s t r a i n t o r t o non- re s t r a in t
cond i t ions f o r a per iod of e i t h e r 6 o r 9 days.
per iod, each animal was subjec ted t o an audiogenic s t r e s s f o r a per iod of
2 min. Th i s s t r e s s cons i s t ed o f p l ac ing each animal i n t o a 1 cub ic f o o t
b lack box con ta in ing a f i r e alarm b e l l which, when a c t i v a t e d , produced a
Previous work i n t h i s l a b o r a t o r y has ind ica t ed t h a t t h i s is a u s e f u l
bimals on e i t h e r a noma1
A t t h e end of t h i s t ime
minimum sound l e v e l of 125 d e c i b e l s i n s i d e t h e box. None of t h e animals so
t e s t e d , r e g a r d l e s s of r e s t r a i n t o r d i e t , exh ib i t ed a r e a c t i o n t o t h e
audiogenic stress.
Discussion
The r e s u l t s of t h e s e experiments i n d i c a t e t h a t r e s t r a i n e d animals,
r e g a r d l e s s of whether they are on a n o r m 1 d i e t , a low-fat conten t d i e t ,
o r a h igh- fa t conten t d i e t , experience a r e t a r d a t i o n of growth i n comparison
t o t h e r e s p e c t i v e non-res t ra ined animals, Although animals on a low-fat
conten t d i e t d i d not ga in weight as r a ? i d l y a s - d i d t h e r e s p e c t i v e m i m a l s
on a normal d i e t , t h e r e t a r d a t i o n i n growth between r e s t r a i n e d and non-
r e s t r a i n e d animals i n each d i e t was approximately equiva len t .
given a h igh- fa t conten t d i e t exh ib i t ed a much wider divergence of growth-
r a t e between r e s t r a i n e d and non-res t ra ined than t h o s e maintained on t h e
low-fat o r s tock d i e t s .
Animals
k

20 -1
Although cau t ion must be exe rc i sed i n a t t r i b u t i n g d i f f e r e n c e s between
o r among e i t h e r r e s t r a i n e d or non-restrained rats on t h e d i f f e r e n t d i e t s
s o l e l y t o fa t content , s e v e r a l observat ions can be made. The non-restrained
h igh - fa t animals gained weight as r a p i d l y as d id t h e non-restrained aniinals
on a regular d i e t . flowever, t h e r e s t r a i n e d animals on a high-fat content
d i e t not only d i d not g a i n weight bu t more g e n e r a l l y l o s t weight; t h i s
was t h e only grou:, t o do so.
imFortance of such an observat ion, it should be pointed out t h a t t h e c o n t a i n e r
Although it is t e n p t i n g t o s r e c u l a t e on t h e
of food tras placed i n a d i f f e r e n t n o s i t i o n t h m t h a t used i n t h e o t h e r groups
because o f t h e food consis tency.
d i f f e r e n c e i n e a t i n g h a b i t s , t h e s e a n i n a l s d i d n o t e a t less ( i n e i t h e r
Although t h i s nay account f o r some
q u a n t i t y or frequency) than t h e o t h e r groups cf a n i m l s .
There w3s no d i f f e r e n c e between t h e growth r a t e o f t h e non-restrained
sham-irradiated animals and t h a t of t h e non-restrained a n i n n l s vhicln
received 50 !?/day.
r e s t r a i n e d sham-irradiated and t h e r e s t r a i n e d i r r a d i a t e d (SO !?/day) ani.nals.
Ne i the r was t h e r e a d i f f e r e n c e i n growth-rate between
I n both t h e s h m - i r r a d i a t e d animals and SO R/day animals t h e growth-rate
of t h e r e s t r a i n e d a n i a a l s was soclewhat less than v;as t h e groISth-rate of
t h e non-restrained anirnals
however, t h e d i f f e r e n c e between t h e weights o f non-restrained anirnals
As t h e d a i l y r a d i a t i o n dose was increased,
and t h e r e s t r a i n e d animals decrezsed such t h a t a t 300 R/day t h e r e was
e s s e n t i a l l y no d i f f e r e n c e between t h e non-restrained and t h e r e s t r a inc i l
a n i m l s i n t h e growth-rate o r weight l o s s . Thus, t h e h ighe r
P

21
dose of r a d i a t i o n appeared t o overcome any d i f f e r e n c e i n weight which might
have been due t o t h e e f f e c t of r e s t r a i n t . That p o r t i o n of t h e data which
can be conpared t o t h e r e s u l t s obtained by nfe i f fe r l o r Su l l ivan2 ( t h e
d a i l y weights of r e s t r a i n e d and non-restrained animals on normal d i e t )
i n d i c a t e t h a t our r e s u l t s are c o m p r a b l e t o t h o s e previously obtained.
The t o t a l r a d i o a c t i v i t y r e t a ined i n t h e g a s t r o i n t e s t i n a l t rac t d i d
n o t appear t o be increased o r decreased by r e s t r a i n t . Th i s was gene ra l ly
t r u e r e g a r d l e s s of t h e d i e t o r t h e r a d i a t i o n dose o r t o t h e l eng th of
r e s t r a i n t and/or i r r a d i a t i o n o r t o t h e p o s t i n j c c t i o n time period.
I t i s i n t c r e s t i n g t o n o t e thtit animals on e i t h e r a low-fat con ten t d i e t
o r a h igh - fa t con ten t d i e t seemed t o experience some degree cf g a s t r i c
r e t e n t i o n when compared t o anirials 011 a n o r m 1 d i e t .
observed i n t h e a l t e r e d d i e t s was g e n e r a l l y more p reva len t i n t h e non-
Gastric r e t e n t i o n
r e s t r a i n e d animals t han it was j n t h e r e s t r a i n e d anirials. Th i s is no doubt
r e spons ib l e f o r t h e observat ion t h a t among t h e animals on t h e h igh - fa t
content ciiet t h e stomach c o n t e n t s of t h e r e s t r a i n e d animals u s u a l l y
t r a v e r s e d t h e i n t e s t i n e s l i g h t l y faster than d i d t h e con ten t s i n t h e
non-restrained animals. This observat ion IMS o f t e n noted a l s o among t h e
animals on a low-fat d i e t .
It should be pointed o u t , furthermore, t h a t among t h e animals on a low-
f a t d i e t , almost without except ion, t h e r e s t r a i n e d a n i n a l s i nd ica t ed t h a t
a s i g n i f i c a n t percentage o f t h e i n j e c t e d i so toye , a d hence of t h e stoctach
. con ten t s , had t r a v e r s e d t h e i n t e s t i n e t o t k e cecun: and/or t h e f irst segment
of t h e Large i n t e s t i n e wi th in 2 h r a f t e r .x lminis t ra t ion of t h e i so tope .
a

22
Rad ioac t iv i ty was u s u a l l y p re sen t i n t h e cecun of non-restrained a n i n a l s
a t t h a t time a l so . The i s o t o p e had u s u a l l y not t r a v e r s e d t h e l e n g t h of
t h e i n t e s t i n e and t h e cecum i n e i t h e r the r e s t r a i n e d o r t h e i ion-restrained
animals t h a t were f e d e i t h e r a noma1 d i e t o r on a high-fat content d i e t
w i th in t h a t t i n e .
I t i s i n t e r e s t i n g t o speci t la te atorit t h e weight i n c r e a s e of r e s t r a i n c d
animals on t h e high-fat content d i e t
behavior, wliicli was no t u n l i k e previous observat ions with hypertensive r a t s ,
Fron t h e i r untisual and aggres s ive
it i s p o s s i b l e t h a t t h e rietnbolic ra te i n t h e s e animals vas increased t o
t h e y o i n t where, although they \:ere e a t i n g a nornal q u a n t i t y o f food (exceyt
f o r t h e f i rs t day of r e s t r a i n t ) , t hey were j u s t as r a p i d l y o r even nore
s a p i d l y d i s s i p a t i n g t h e b e n e f i t s t h e r e o f .
down t h e length of t h e gut i n t h e s e anismls, although p e r h q s s l i g h t l y
more ra?id i n some cases than i n t h e non-rcstrained h igh - fa t content animals,
does not a rpca r t o j u s t i f y any thoughts t h a t t h e inges t ed food MBS being
excreted any n o r e r a p i d l y than would normally be t h e case .
exhaled a i r f o r CO
n o t these animals had a normal o r an increased metabol ic ra te .
The passage o f t h e gut con ten t s
Analysis of
con ten t n i g h t g ive some i n d i c a t j o n as t o whether o r 2
Previously p 5 1 i s h e d s t u d i e s have shown t h a t r a t s do experience a
g a s t r i c r e t e n t i o n a f t e r low doses (SO R) of r a d i a t i o n . Castric r e t e n t i o n
was not measured, however, i n t h e s e i r r a d i a t e d and sham-irradiated animals
because of o u r nethod of i s o t o p e i n j e c t i o n .
Although it has been shown9 t h a t upon exposure t o 200 t o 600 R o f a c u t e
r a d i a t i o n t h e r e is an almost i n s t a n t a n e o u s , i n c r e z s e i n tone and m o t i l i t y i n

23
ra t small i n t e s t i n e , t h e i n c r e a s e i n a c t i v i t y r a p i d l y r e t u r n s t o normal.
If t h i s i n c r e a s e i n t h e i n t e s t i n a l I r ,ot i l i ty was presen t i n t h e i r r a d i a t e d
animals i n t h e s e experiments, it d id not manifest i t s e l f by a consequent
increased r a t e o f passage of t h e i n t e s t i n a l conten ts .
sugges ts t h a t exposure t o continuous 6oCo i r r a d i a t i o n does no t s u b s t a n t i a l l y
a l ter t h e movement of t h e i s o t o p e through t h e i n t e s t i n a l t rac t i n e i t h e r
The p re sen t d a t a
r e s t r a i n e d o r non-res t ra ined animals,. S i z i l a r l y t h e r e vas no observable
o r c o n s i s t e n t d i f f e r e n c e between t h e passage of g a s t r o i n t e s t i n a l con ten t s
i n r e s t r a i n e d o r non-res t ra ined animals whether they were s h a m i r r a d i a t e d ,
exposed t o 50 R/day o r exposed t o 300 !?/day.
out t h a t wi th intraduoderial i n j e c t i o n some of t h e i s o t o p e occas iona l ly
entered t h e stonach.
I t should a l s o b e pointed
This amount was, however, u s u a l l y l e s s than 10%
of t h e i n j e c t e d dose.
i n which more than 10% of t h e i n j e c t e d i s o t o p e en tered t h e stomach were
I t may be f o r t u i t o u s t h a t a h o s t a l l of t h e zniinals
animals which had been exposed t o 300 R/day o f continuous i r r a d i a t i o n f o r
a per iod of at l e a s t 3 days p r i o r t o i n j e c t i o n of t h e i so tope .
Although every at tempt was made t o keep t h e i n j e c t e d dose of i so tope
f o r any s i n g l e group o f animals cons t an t , it was q u i t e p o s s i b l e t h a t minor
v a r i a t i o n s i n i s o t o p e quGantity occurred. S ince t h e s p e c i f i c a c t i v i t y of
t h e isotoTe was ex t r eve ly h igh i n order t o minimize t h e volume i n j e c t e d ,
small volume d i f f e r e n c e s i n t h e volume adminis tered could account f o r
s u b s t a n t i a l v a r i a t i o n s i n r e t e n t i o n .
The gross au toradiografhs prepared i n t h e s e s t u d i e s showed no d i f f e r e n c e
between r e s t r a i n e d and non-res t ra ined animals i n e i t h e r t h e concent ra t ion
P
24
or t h e l o c a t i o n of t h e i so tope with r e spec t t o v a r i o u s tizes of sacrifice,
pe r iods of r e s t r a i n t and d i e t comparisons and/or exposure rates.
born out by t h e comparatively small d i f f e r e n c e s observed i n t h e counting
This was
rates o f t h e va r ious g a s t r o i n t e s t i n a l segnents ,
Conclusions
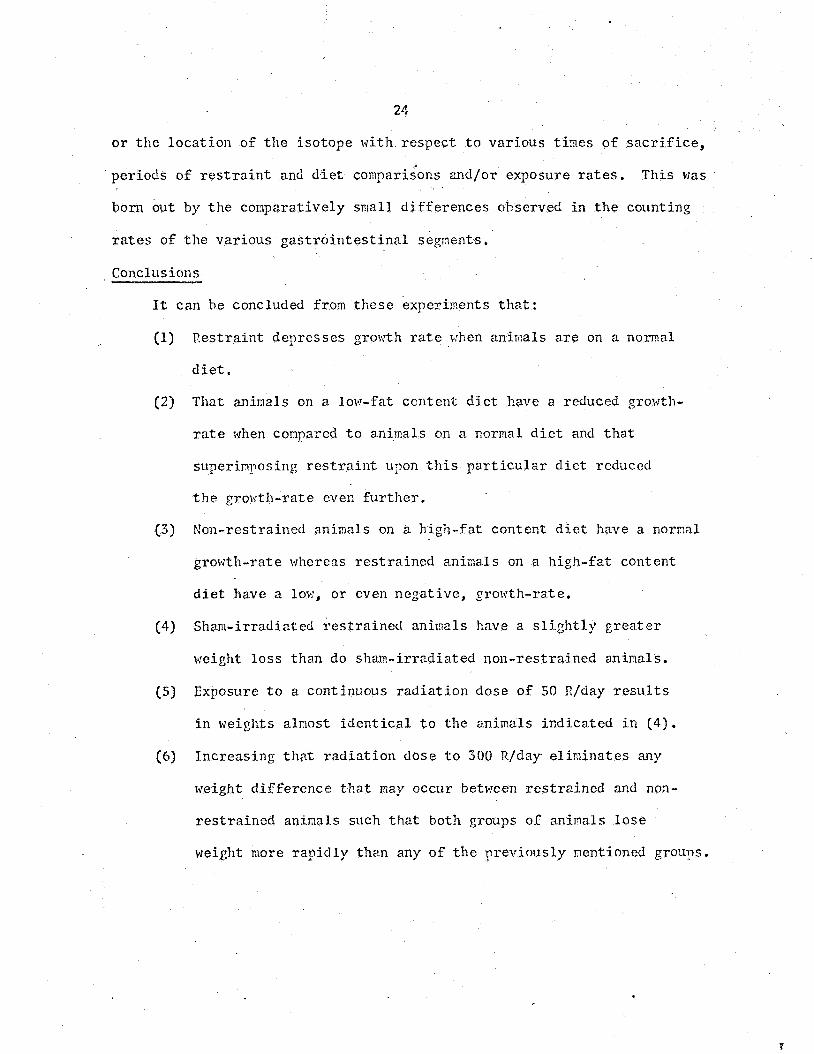
I t can be concluded from t h e s e experiments t h a t :
R e s t r a i n t dep res ses growth rate when a n i e a l s are on a normal
d i e t ,
That a n i n a l s on a low-Eat content d i e t have a reduced growth-
r a t e when conpared t o animals on a normal d i e t and t h a t
supe r in ros ing r e s t r a i n t uron t h i s p a r t i c u l a r d i e t reduced
the growth-rate even f u r t h e r .
Son-restrained animals on a high-fat conter,t d i e t have a no rca l
growth-rate whereas r e s t r a i n e d anicials on a h i g h - f a t content
d i e t have a low, o r even negat ive, grorcth-rate.
Sham-irradiated r e s t r a i n e d animals have a s l i g h t l y g r e a t e r
weight l o s s than do sham-irradiated non-restrained animals.
Exposure t o a continuous r a d i a t i o n dose of SO R/day r e s u l t s
i n weights a l n o s t i d e n t i c a l t o t h e animals i xd ica t ed i n (4) .
Inc reas ing that r a d i a t i o n dose t o 300 R/day e1irr:inates any
weight diEference t h a t may occur between r e s t r a i n e d and non-
r e s t r a i n e d a n i n a l s such that both groups of animals l o s e
weight more r a p i d l y than any o f t h e p rev ious ly nentioncd grou?s.
P

25
(7) There was l i t t l e o r no d i f f e r e n c e between t h e passage tiEes
of i n t e s t i n a l con ten t s of r k s t r a i n e d and non-restrained
animals f e d a s tock d i e t .
(8) Both r e s t r a i n e d and non-restrained animals on e i t h e r a low-
fa t o r h igh - fa t content d i e t exh ib i t ed more g a s t r i c r e t e n t i o n
than animals on a s t o c k d i e t and t h a t w i th in t h e s e groups
t h e non-restrained animals seemed t o e x h i b i t t h i s more
o f t e n than d i d t h e r e s t r a i n e d animals.
P<ovener,t o f t h e g a s t r i c con ten t s through t h e i n t e s t i n a l t ract
i n t h e r e s t r a i n e d h i @ - f a t a n i n a l s was u s u a l l y a l i t t l e
(9)
faster than i n t h e non-restrained animals.
Passage t i n e i n t h e r e s t r a i n e d animals on a lot,.:-fat content
d i e t was s l i g h t l y Easter than t h a t . of t h e non-restrained
animals on a lot+fat content d i e t , both of which were
considerably more r q i d at 2 h r aFter i s o t o r e admin i s t r a t ion
, than were t h o s e ariimals on a stock o r a high-fat d i e t .
(IO)
(11) The r e s t r a i n e d and t h e non-restrained animals which were e i t h e r
s h m - i r r a d i a t e d o r cont inuously exposed t o 50 R/day o r 300 I?/day
6oCo i r r a d i a t i o n showed l i t t l e d i f f e r e n c e i n t h e novement o f t h e
i n t e s t i n a l con ten t s
(12) Although t h e r e s t r a i n e d a n i n a l s on a h igh - fa t content d i e t
exh ib i t ed an aggres s ive behavior similar t o a hy-pertensive
s ta te , n e i t h e r t h e y no r any of t h e o t h e r grouys of animals
so t e s t e d showed any response t o a neuro log ica l stress such
as an audiogenic i n s u l t ,

26 - 1
(13) There was l i t t l e change i n bacter ia l count of t h e i n i e s t i n a l
segments exanined with r e s p e c t t o r e s t r a i n t o r Eon- re s t r a in t ,
o r l eng th of time of r e s t r a i n t , o r between t h e two d i e t s
t e s t e d .

1.
2.
3 .
4.
5.
6 .
7.
8.
9.
E I OG ?.A PI-IY
P f e i f f e r , C, J., Personal connunicat ion.
Su l l ivan , M. F., s e e F ina l Report, 1966.
Hulse, E. V., V b s e r v a t i o n s on t h e Delay i n G a s t r i c Emptying a f t e r
X- i r r ad ia t ion i n t h e Rat and t h e Effect of Adrenalectomy Upon It",
B r i t . J. Exptl. Pathol. , 1957, 38, 493-503.
Thompson, R. C. and H o l l i s , 0. L., " I r r a d i a t i o n of the G a s t r o i n t e s t i n a l
Tract of t h e Rat by Ingested Ruthenium-106", Am. J. Physiol . , 1955, - 194,
-
308-312.
Thompson, R. C., Weeks, PI. € I . , H o l l i s , 0. L., Bal lou, J. E . and Cakley, W. D.,
9Ietabol isrn of Radio-Ruthenium i n t h e Rat", fm. J . Roent., Rad. Tlier. and - NuCl. Fled. , 1958, 79, 1026-1044. - Mann, € I . B. and !iJhitncy, D. R., "On a Test of Whether One of Two F.andor;
Var iab les i s S t o c h a s t i c a l l y Larger Than t h e Other", Ann. ?lath. S t a t . ,
1947, 18, 50-60, - Flahony, T. D . , Be r l in , J . D., Pekas, .J . C. and Su l l ivan , 7.1. F , , "The
Effec t of B i l e on t h e Mucosa of t h e Small In t e s t ine" , pp. 42-55,
In: El. F. Su l l ivan , (ed.) , I n t e r n a t i o n a l FlonograFhs on Nuclear Vedicine
and E i o 1 ogy , Rich1 and, illas h i ngt on, 19 G 6 , Exc e r? t a bled i c a Found a t ion ,
Amsterdam, The Nether lands, 1968.
Sikov, X. R., Personal comunica t ion
Conard, R. A,, "Sone E f f e c t s of Ion iz ing Radiat ion 011 t h e Physiology of
t h e G a s t r o i n t e s t i n a l Trac t : A Review", P.ad. Research, 1956, 5, 167-18s. -
r

f z c C
v r 7 h r i F G C
X
x 3::
x x i: x x x $.: x x $.: $.:
c, 0 .d 0
x r: Y.
x x x x x x
>: Y. x x r: $.:
%.
Y , Y , % %
x $.:
>:
x
00 t4

: x
X
x
X
X
X
x
x
X
X
X
X
M W
0 v
X
x
X
X
X
X
CR
>:
x
x
X
3 d G
C 0 M W
‘-P a, .A
sc sc
x
x
sc
X
x
M
$.;
x
X
sc
W
x
’A
$.:
x

r . 0
A N . .
+ I + * c o Q G . .
In
2 .,-I E
Ln
3
+ !c,
?.I
b C I C c n
o o t - r c . . . . +I +I + I + I
W M y V
C n I n r l G , . . . .
b
d
+I b
Ln
r - i l n E r :
r 4 C V P - I . . .
+ I + I +I + I + I + I +
Y ? 5 ?
+ I + I +I + I c c c c
r'* c. ci N N
+I + I + I +I +I
. . . . C C O r - i d
. . . . . & Q L n G b d C C C 0 r - i r l d r t d r t
M . ? v i v i ?
+ I + I + I + 1 +I r ( d 4 d r - l
H H
UT c m 4 t-.
r-. d rt
c. b In
o c h l N
O l n t n N d d
ln I+
d v: b c4 s C O C C G . . . . .
+ I + I + I + I +I . . . . . C tr) IA P- 0. c c c c c 4 r - i d r l r l
W N
r i d . .
4 1 + I
cc 4
+ I -e N d
. . tc, r. ?-id r- ld
* co d d

c c c d d d
C' 0 0
N N E') . . . +I + I +I . . .
r-4 Cf M c r ) M M d d d
* * * l n c o G 3 m Lc, \o . . .
'I
I--
I-.
+ I \o
i-.
N
h: n' -1 cu N . . . . . +I + I + I + I + I
r-- N d
c c c v , 4 d 4
+ I + I + I + . . . .
L.2
M.
+ I IZ\
-3- M 4
In N
6;".
+I + I - I - -
m o 0 0
r-4
. .
? 4 M M
+ I + I +I + 1 . + 1 . . . . .
+ I + I + I +I +I

' ,
o, s x 3 C
=?
c.
of N r( . . O d d
+ I + t + I b o w M e w
. . *
k 0 k
3 k m vi 0 03 cn a t * . . . . c 0 0 0 0 0
.rl
k+, + , m . . . . . r . t - - \ C L n \ c
6 + I + I + I + I + I
o + I m 0 a cn 0
cd v: ~ rcT.
d d N c-4
LA cf
m d
c,
l n a b c z c a 0 0 0 0 0 . . . . .
+ I + I + I + I + I . . . . . w G l 0 a C , n a c c a c n
4
0
(u
+ d
d
N' 4
+ I + I
. . N N
r - m - 3 - u , . .
d a m . . . d ,r - i d
+ I + I + I
- 1
o a N N . .
+ I + I a d 0 0 . .
+ I + I + b Q N
T t m m . . .
m m m c 3 c i ' d d d l 4 d . . . . .
+ I + I + I + I + I . . . . . N \ T ) c a G , c n o c c o o d d d d r - 4

Lo
M
+ I rl
M rl
m M
+ I G: d r-i
0
.=?
+ I r- M d
+ i + I + I + I + I + O N r -
\c c. c . . .
l-i
N L 9 N C d
d N N M C4 . . . . . N C . C - . C N
d d r - i N N . . e . .
9 1 + I + I + I + I b 0 d
d - ( C 3 N O > d
C4 d N 4 CJ . . . . . + I + I + I + I + I . .
e a d d r " i 4
+ I + I +I + I + I . . . . .
n 'j u 2
.r(
M M W M M M
"1 4 M
+ I + I 4.
* . M M M
. . . M b m N N N 4 4 4
V I M
M M . .
+ I + I . . a b N N r l d
d
rr) + I + + I
* * * * C n C \ 3 M c C
r- L1 G-l M e== . . . . 4
CQ d m ( U N N

c a d
c.1 M . .
+ I + 0
d- N
1.
a N
+ 4
0 N
N O
M tr) . .
+ I + I m r - 4 a m N N
e .
+ I + f + C J m m tO d u) tO M M
. . 0
0 N tr)
M M M . . . + I + I + I . . e CB c3 ci3 c c # o 3
- M I 4
N N n i . . .
+ t + I + I * .
c j r - i 0 0
+ I + I +I + 1 N CI
. . . c o r n 0 GI G3
M- M M C3 rt
L7 Ln Gi d 4
tr) M
N d
N N . .
+I + + I + I . . a .
O N f i O r - 4 d F I N t - t r - 4 r - 4 r - i
00 GI a 01
( V C U N N N . . . . .
+ I + I + i + I +I

O P - C I O W
d O O d P - 4 . . . . .
+ I + I + I + I + I
b G t - 0 1 r - i
o o o o r ( . . . . .
+ I +I c l + I + I
r . e m e c 2 0 0 0 0 0 . . . . .
+ I + I + I + I + I . . . . . U 3 W W r . b D . o o G ) c s
+ I + I + I + I . . . . N C r t C C I c I C - r c I
+ I + I + I + I . . . . b b b W cn ci; ci a
4
c\i
+ I M
In
e. 4
+ I + I + I + I + I . . . . . 03 Q U, d tr) 0, c, cn 0: a
b b t - . c o C - l
0 0 0 0 0 . . . . .
+ I + l + I + I + I . . . . . G a C C T i 0 3 N 0 , O G l c n C T i
l-4
E
VI ,--i 5s
f

I
Z
3 *-, o? +
t r , ri Lp. * N ( U r l c - 4 . . . .
+ I + I + I + I O e d N . . . .
F l u 3
c-I d . .
+ I + I . . 4 c C' c-
o o N N . .
+ I + I
0 0
N N . .
+ I + I
+ I i t + I + I . . . . a3G2be r 3 0 ? 3 G ,
0
+ C r-l
r. C .
~ c m o o r-icl-4r-i . . . .
+ I + I + I + I
LQ r. r- r. r. . . . . . c o c c c + I + I + I + I + I . . . . . 6 - 4 - 4 - I c . a a GI rn G'j a
+I + I + I + J . . . . d C ; 3 L n N C 0 r . b r .
W r - i d r - 4 N 4 4 - l
+ I + I + I + I . . . . M t 4 b I . n C 3 M r . h
F

- Day 1
2
3
TOTAL PERCENTAGE OF ISOTOPE REP.i.4lh’TNG IK RESTPAINEI! ARil N!TII-RESTRAI?IED k4TS ON VARIOUS DIETS AFTER VARYIFIG PERIODS OF PESTRAIVl‘ AVD ISOTOPE ADI~fINISTPATION
Normal Diet Low-Fat M e t H i g h -F 2-t Il i e t Hours Po s t -&In. P.est . Xon-Rest. Rest. Kon-flest e P.est. ?Ion - Re s t
0.5 106 112 89 97 99 104 P ____.
1 87 112 85 1 os 2 113 98 111 99
4 97 106 96 90
6 104 106 107 95
8 80 58
14 85 48
24 16 2s
0.5
2
6
14
24
0.5 1
2
4
6
8
9
12
14
24
115 9 1
54 105
107 107
76 67
27 N D
109 112
106 107
99 97
106 100
103 9 1
102 93
70 39
32 4 1
11 26
105 98
93 55
94 99
94 109
l o 0 109
44 67
96 93
100 10s
92 99
NI, = No Data

TA.BLE VI1
Normal Diet tow-Fat Diet High-Fat: Diet Hours
Day Post -Adn Rest. Non-Rest . R k s t Non-Pest . Rest Non-??est . 1__1_ ___. P u_
4 0.5 1 os 101
2 107 107
6 99 102
14 52 59
24 7 39
5 0.5 75 105 103 121 105 104
1 107 105 97 102 90 107
2 102 1 03 109 104 110 92
4 103 102 112 99 112 98
6 107 112 105 103 78 106 s 91 89 30 45 97 92
6
9
0.5
2
6
14
24
0.5
2
6
14
24
105
1111
93
59
44
IO8
93
102
57
12
109
107
I03
78
31
113
11s 102
54
24
104
96
74
106
55 100
100 113
3.03 101
85 101
106
103
97
85
107
99

_I Day 13
18
24
3 1
Hours Post-Adn.
0.5
2
6
14
24
0.5
2
6
1 4
24
0.5
2
6 14
24
0.5
2
G 14
24
Noma1 Diet
T G L E VI1
[Continued)
Rest.
116
100
103
63
27
103
102
98
53
13
107
110
104
45
16
109
104
125
44
10
??on - Re s t
100
113
108
69
21
94
96
104
66
13
109
91
111
65
32
107
i 04 106
53
26
Low - F a t n i e t I-I i ??I- Fa t Diet
Rest, P
113
59
94
Yon-Rest . ?est. Non-Y.est
100
116
74
101
95
88
44 100
95
103
82
87
98 102
GS
' I
TABLE vm
i-Iours Do s t -AdC! . Day
I_
1 0.5
S
0 R/Prv
Rest. Yon-?est. P
74 89
86 94
61 92
86 90
96 92
96 93
3 0.5 GG 86
1 77 86
2 84 85
4 80 92
6 84 105
8 84 93
6 0.5 87 88
1 84 80
50 !?/my 300 f./9ay
?.est. ?:on-Rest e R e s t , Non-'Zest. __o___
94 100
89 85
9 1 93
89 97
9 1 90
91 97
94 97
98 92 103 98
102 85
3 1 38
90
9 1
89
90
2 . 83 85 99 87
4 75 83
6 92 86
8 93 69
79 83
96 86
87 89
0 0.5 86 72 90 82 89 94
1 85 77 a4 87 100 1 eo 2 86 82 90 55 103 100
4 72 84 84 95 98 101
. 6 82 85 78 95
8 91 9 1 93 90

-1 TABLE I X
DISTF.IBUTIDN IN TdIE GASTROINTESTIGAL TRKT CAS % OF D9SE AW'INISTEPEQ]. OF RATS ON EACH DIET AT TIFE INTERVALS POST ISOTOPE A~?!INLSTRPITICIN MTER VARYING PERIODS OF
RESTRAINT OR NON-RFYTPAIFIT
€!ou r s Normal Diet Low- F a t Diet t . I i yh -Fa t Diet Pays Post- Tissue Rest, Admin. Segrzent Non-!lest P Rest. Elon-fr est Rest * Non -Res t
_I___
Rest.
10 1 4 1 6 48
2 -- _s --
1 0.5 S t . S . I , -1 s.1.-2 S . I . - 3 S.I . -4 Cc . L.1 . -1 L.I*-2
39 36 32 --
40 14 37 22
1 1 St. S.I . -1 S.I.-2 S.1.-3 S . I . 4 C e . L . I . - l L.I.-2
65 7 2
10 28 -- --
1 2 23 3 3 4
52 '
65 5 2 4
27 5
St. S.I . - l S,I.-2 S.I.-3 S . I . 4 Ce . 1,. I * -1 L*I.-2
7 7 4 6
50 30
7 --
3s 4 2 1
52 1
*- -- 1 4 7
4 2 1 1
76 6 --
2 1 4 2 4
59 m...
54:. S.I.-1 S,I . -2 s.1.-3 S,1.-4 Ce. L.1.-1 L.1.-2
1 9 4 2 2 4
57 19 --
5 5 2 --
19 66

Hours Days Post- Re st . b.dmin, P
1 6
1 8
1 14
1 24
Tissue Segment
st. S.I.-l s.1.-2 S.I.-3 S.I.-4 Ce L.1.-1 L,I.-2
St. s.1.-1 S.I.-2 S.Ie-3 S.I.4 Ce. L.1.-1 L . I . - ~
St. s.1;-1 S,I.-2 S.I.-3 S . I . 4 Ce. L.1.-1 L,I.-2
St: s.1.-1 s.1.-2 S.1.-3 S.1,-4 Ce. L.1.-1 L.I.-2
TAELE IX
(Ccnt inued)
Normal Diet
h'on-Rest . -- Rest. lpDII
1 2 1 1 1
71 11 17
"- 1
-- 24
--
High-Fat Diet - Low-kat Diet
R-est. Son-Pest . Rest, Non -F e s t ____. -____I
6 20 4 2 3 2 1 1 2 3
38 53 18 9 36 5
3 4 2 1 1
45 11 12
11 2 3 1 ' 4 49 9 8

TABLE IX
Hours Dzys Post- Ti s u e Rest , A6xi.n. Segment -
2 0 . 5 St, SoI*-l S,I.-2 S,I.-3 S.1,-4 Ce. L*I*-l L.I,-2
2 2
2 6
S t . s01*-1 S.I,-2 S.1,-3 S.I.-4 Ce. L.1.-1 L.I.-2
St,
S.I.-2 S.1.-3 S.1.-4 Ce . c.1.-1 L.I.-2
s.r.-1
2 14 St. s.1.-1 S.I.-2 S.I.-3 S.I.-4 Ce L.I.-l L,I.-2
(Con t i nuccrl )
Normal Diet Low-Fat Diet fI i gh -Fat P i e t
bst. Non-Rest , ___I
Rest >ion-Pest . Rest. Non-Rest. s___. __L
5s 9 37 11
69 6 16 1 --
I-
20 13 4 3 7 3 12 21 12 55 -- 6 -- 1 -- -- 4 12 1 1 1 4 4 4 22 17 74 64 1 6

TABLE IX - 1
(Continued)
Normal Diet tor;r- Fat i e t High -Fat Diet
Rest. Non -D e s t . Yon-Rest , _I_y
Rest. uI1_I
Hours Days Past- T i s sue Rest. Admin. Segment P
2 24 St. s.1.-1 S.I.-2
. - S.I.-3 s.r.-4 Ce. L.1,-1 L. r e -2
Mon-9est.
3 0.5 S t . s.r.-i S.I.-2 S.I.-3 S.I.-4 Ce. I,. T ' -1 L.I.-2
57 15 18 17 4
72 4 3
18 8
66 10 16 3 3
54 '
6 5 26 6
87 5 1
I- ..- e..
3 1 S t . S.I.-1 S.I.-2 S.I.-3 S . I.-4 Ce e
L.I.-1 ' L.I.-2
64 3 7
31 3 --
38 2 1 7 9
35 3 5
13 37
3 2 S t . S.I.-l s.1.-2 S.1,-3 S. I, -4 Ce . L . I . - l ~.r.-2
19 4 5
40 27 8
2s 3 3 7
15 28 10 -s
39 21 2 3 8 27
53 3 3 5
36
54 3 3 12 31 1

' I TABLE I X
(Cont inucd)
Nornal Dict Low-Fat Diet -- Itigh-Fat Diet Hours Days Post- Tissue Rest. Adnin. - Seyacrit &-*- -
3 4 St. S.I,-l S.I.-2 S.I,-3
cc. L.I.-l L.1.-2
s.r.-4
1- ..LSt
24 2 7 7
11 55
P
--
X on -?.e s t . Pest e P
Non-Pest. Rests Non-?est . I___
22 2 3 4 5 62 3
35 3 2 3 4 47 -_
65 2 1 1 3 25 3
e..
3 6 47 2
St. S.I.-l S.T.-2 S . T . 4 S.I.4 Ce. L.1.-1 L.1.-2
2 3
3s 1 2 3 4 34 5
15
32 2
22 3 2 7 9
49
..- 3
2 2 4 1 12 3 69 07
7 16 4 --
3 4 5
36 1s 10
1 1 4
38 6 --
3 8 S t . S.I.-l S.I.-2 S.I.-3 s.1.-4 Ce L.1.-1
' L.I.-2
4 2 -
20 2
. 4 2 5 25 11
3 2 1
26 s
3 9 St. s.1.-1 S.I.-2 S.I.-3 s. I. -4 Ce. L.1.-1 r,. I. -2
5 1 2
1 74
S 9
1 ,
5 1 2 3 9
63 7 3

TAELE IS
(Continued) ,
?iorr?al Diet L O W - F L F ~ Diet
?est. Ron-Rest . P.cst. Yon-!?est. _D_.__
Hours Days P o s t - T i s sue Rest Adnin. S e p e n t ___I
3 12 St. S.I.-l S.I.-2 5.1.-3 S,I.-4 Ce e
L.I.-l L.I.-2
Rest. Non-Pest . P
L 2 2 1 1 50
. 13 1
-- 1 1 1 1 22 11 2
14 3 St. S.I,-l S.I.-2 s.1.-3 S.I . - .? Ce e
L.1.-1 L.I*-2
1 1 --
e-
26 5
3 24 St. s.1.-I. S.I.-2 S.1.-3 S.I.4 Ce. L*I.-l L . I . 2
-- -.. 1 3 10 13
4 0.5 S t , s.1.-1 s.1.-2 S.1.-3 S*I.-? Ce L.1,-1 L.I.-2
60 4 13 31
80 7 10 4
-- e-

TAGLE IX ‘ I
f-Iours Days Post- Tissue Rest. Adlnin Segment P
4 2 St. s.1.-1
S.I.-3 S . 1 . - 4 Ce. L.1.-1 L.I.-2
s.1.-2
4 6
4 14
4 24
S t . s.1.-1 s.1.-2 S.I.-3 S.I.-4 Ce. L.I.-l L.1.-2
St. s.1.-1 s.1.-2
S.I.-4 Ce L.I.-l L.1.-2
s.r.-3
St.
s.1.-2 S . I. -3 S.I.-4 Ce 0
L.I.-l L.f.-2
s.r.-i
(Con t inil ed)
Nom.al Diet Low-Fat Diet
Rest * Non-Rest Rest, Yon -Rest . _____I
33 6 17 51 -- .,,e
-- 4 1 1 1 69 6
1G
-- 1 1
-.. 32 9 7
-- 4 1 1
42 5 13 39 9
3 2 2 1 8 79 I;
-- 2 1
-- 39 9 8
5 1 1 1 1 22 3 7
High-Pa t Piet
?Ion-n e s t . Rest I___

T M L E I X
(Cont i wed)
Lon-Fat Diet Nornal Diet
Rest. Eon-Rest . _L___ -
!-i A sh -I: a t !7 i et Hours Days ?05t- Rest. Adnin,
Tissue Secncnt Rest Rest
35 17 1 8 35 1
_1_1_
-- -- --
Nnn-Yest.
53 6 8
29 4 --
Y-
L-
28 6 6
20 37
5 0.5 St. S.I.-l S,I.-2 S.I.-3 S.I.-4 Ce. L.1.-I L.I.-2
39 5 21 11 --
57 5 10 33 1
5 1 St. S.I.- l s.1.-2
S.I.-4 Ce. L,I.-l L.1.-2
5.1.-3
20 3 5 10 69
39 4 6
4 49 .
--
39 4 4
42 13
-- --
-- -- -- 3 1
6 7 7
22 26 10 -- 37
3 4 3 3
44 1 6 1
5 2 St, S.I.-l s.1.-2 S.1.-3 S.I.-4 Ce. L.I.-l L.1.-2
29 4 4 4
5G 7 1 --
22 5 4 5 64 10 -.. -- --
4 3 5 5 9 47 30 ..-
5 4 St, S.1.-1 S,I.-2 S.I.-3 S*I*-'4 Ce . L.1.-1 L.1.-2
20 3 4 6 . 10 60
46 2 2 3 4
26 17 -_
2 6 4 2
52 45 1 --

Hours nzys Post- Rest. Admin. LII
5 6
5 8
G 0.5
6 2
Ti s su e Segment
St. s.1.-1 S,I.-2 S.1.-3 S.I.-4 Ce L.1.-1 L.I,-2
St. S.I.-l S.I.-2 S.1,-3 S . I . 4 Ce. L.I.-l I,. I . -2 St. s.1.-1 S.I,-2 S.I.-3 S.I.-4 Ce. L.1.-1 L.I.-2
St. s.1.-1 s.1.-2 S.1,-3 S.I.-4 Ce. I, I. -1 I, * f . -2
TABLE IX
(Continued)
Norm1 Diet
Rest.
3 3 4 4 4 74 13
3
9 2 3 3 5 59 12
___s
-- 70
5 11 20 ..- -- -I
-- 20
4 6 25 44 -- -- --
Non-Rest . 11
3 4 7 9
56 15 8
7 3 4 5 9
47 13 -- 44 20 35 10 -.. -- -- *-
37 5 9 50
6 .._ -- --
Low-Fat Diet High - Fa t I3 i. e t
Rest.
14 3 4 4 5
35 19 2 1
7 2 3 4 4 9 2
_I_
--
Rest. P
N on -?.e s t ,
25 2 4 4 4 3 5 2 9 4 54 64 1 -- 2 -- 8 1 2 4 3 1 3 1 10 3 12 07 7 2 -- 18
61 10 6
26 2
--
4 5 5 2 26 14
Non-Rest a
8 3 2 1 4 73 15 2
-*
3 1 1 2 OS 16 -- 92 4 6 5 --
83 3 1 2
1 6 -I

TABLE IX
(Continued)
Hours Days Post- Tissue 2cs t . Adxiin. SeRment __.____
6 6 St. S.I,-l s.1.-2 S.I.-3 S.I.-4 Ce L.1.-1 L.1 -2
6 14 SI. s.1.-1 s.1.-2 S.I.-3 S,T.-4 Ce e
L . I . - l L.1.-2
6 24 S t . s.1.-1 S.I.-2 S,I.-3 S.I.-4 Ce L.I*-1 L.1.-2
9 0.5 S t . S.I.-1 S.I,-2 S.I.-3 S.1.-4 Ce. L.I.-1 L.1.-2
Normal Diet
P x s t * Non-Rest . 18
2 1 3 3 4 9 6 14
65 51 14 S
1 1 1 3 1
--
I- 1 -- 4 4 1 4s 13 9 1 13
4 -e
1 1 3 --
-I -- 26 2 2
3s 11 17 38
9 -- -- --
Low-Fat Diet High-Fat Diet
Rest I Non-Rest , Rest, Son-Rest . ___I_
15 35 4 3 3 -- 3 2 6 10 31 46 39 I-
1 --
75 5 5 14 6
-..
64 3 6 27 --
47 7 10 40 10
61 5 4 15
-I

TABLE I X ‘ I
(Continued)
Normal Diet COW-"^^ n i e t Hours Post- Admin.
T i s sue S egn ent
S t r s.l-.-1 S.I.-2 S.I.-3 S.1.-4 Ce. L.1.-1 1,*1*-2
?.est. Non-P,est, Rest. Yon-Pest. _1ps_
R.est tion -?.es t
7 43 7 5 4 4 8 7
7 5 4s 1 --
9 2 1s 4 5 69
36 3 6 14 20 35 5
51 1 1 3 8 13 18
60 2 2 4 13 22
9 6 S t .
S.I.-2
S.1.-4 Ce. 1,. I .-1 I,. I. -2
s.r.-i
s.1.-3
2 2 20 5 7 52 11 3
4 2
46 44 1 2 2 2
13 47 3 3 2 2 2 3 1 3
h l 4Q 13 2
1 3 7
69 16 ..-
2 3 3 5 11 13 6 6 4 11
9 14 St. s.1.-1 s.i.-2 S.T.-J S.I.-4 Ce. L.X.-l L.1.-2
-- 45 8 3
9 24 St. S*I.-l s.1.-2 s.1.-3 S*I,-4 Ce. L.1.-1 L.I.-2
Hours Days Post- T i s s u e Rest. Admin, Segment - 13 0.5 St.
S.1.-1 s.1.-2 S.1,-3 S,I.-4 Cc L.I.-l L.1.-2
13 2
13
St 0
s.1.-1 S.I.-2
S.1.-4 s.1.-3
L.r.-i L.r.-2
Ce.
6. St S.I.-1
S.T.-3 S.I.-rf Ce.
L.I.12
s.r.-2
L.r.-i
13 14 st s.1.-2 S.1 . -3 S.1.-4 Ce L.1.-1 L.1.-2
s.1*-1-
TABLE IX
(Continual)
Normal Diet ?,ci\r-Fat Diet
Test. Non-Rest __p___
Rest, Non-Rest * __I_
45 12 52 8
17 2 4 13 64 2
7 2 2 3 4
85
-- 1 1 ..- --
49 8 3
77 7 15 1
16 6 G
41 44
-- -a
14 1 3 4 7
67 10
2
-- I
-- 1
49 10
8
Rest. Eon-Vest. _I_p_

TABLE IX
(Cont i. nc ed)
IIours Post -
Normal Diet Low-F a t D i e t _- ~ i g h - F a t Diet Days
’ Rest e P
13
Tissue Rest. Yon-Rest . I___LI_
Rest , Non-Rest , P
Rest Yon-Rest. __._I_
Adrilin. Segmnt
24 SI. -.. S , I . - l 1 S.I.-2 _- S,I.-3 I -- S.I.-4 -- Cc. 21 L.I.-l 5 I,. I. -2 --
e-
18 0.5 St, S.I.-1 S.I.-2 S.I.-3 S.I.-4 Ce. L*I.-l L.1.-2
47 17 3 37
47 6 9 37 1
66 4 5 23 4
53 5 6
23 1
18 2 St. s.1.-1 S.I.-2 S.1.-3 S.I.-4 Ce. L.I.-l L.1.-2
9 4 8 49 33
50 4 4 8 36
7 8
39 3
54 4
3 2 39 5 11 37 -.. 1
18 6 St. s.1.-1 s.1.-2 S.I.-3 S.1.-4 Ce,
. L.I.-2 L.r. -1
1 3 1 2 5
86 1 --
-- 2 1 6 11 69 14 --
17 2 2 3 8
20 15 28
41 2 2 3 2
1s 6
33 3 3 5 4 33 13
-.. 4 1 1 4 57 20 I.. --

Days Rest.
18
II___.
Hours Post- Adtnin ,
Tissue Seenent
14
18 24
24
24
0.5
2
St * s.1.-1 S.I.-2 S.I.-3 S.I.-4 Ce . t.1.-1 L,I.-2
S t . s.1.-1 s.1.-2 S.I.4 S.I.-4 Ce L.1.-I L.1,-2
S t . s.1.-1 S.I.-2 S.I.-3 s.1.-4 Ce . L.1.-1 L.I.-2
S t . s.1.-1 s.1.-2 S.1.-3 S . I . 4 Ce. L.1.-1 L.I.-2
TABLE IS
(Cont i nu ed)
Normal Eiet Low -I: a t D i et €1 igh -Fa t Diet
Rest. Ron-Rest . __I_.
Rest. Non-Rest . Rest. ?lon-R.est I_____
16 4 15 36 21 --

Days Rest.
24
- Houss Pos t - Admin .
6
24 14
24 24
31 0.5
Tissue Seznent
St. S,I.-l S,I.-2 S.I.-3 S.I.-4 Ce. L. I .-1 L.I.-2
S t * s.1.-1 s.1.-2 S.I.-3 S.I.-4 Ce L.I.-1 L.I.-2
St. S.I.-l s.1.-2 S,I.-3 S.I.-4 Ce. L.1.-1 C.I.-2
st . s.l.-1 s.1.-2 S.I.-3 S.I.-4 Ce. L.I.-l L.I.-2
'I TABLE IX
. (Continued)
P.!ormal Diet Low- F a t D i et High-Fat ? i e t
Pest.
1 2 1 2 13 70 16
P
4
1 1
8 2 1
-..
--
Yest. ?Ton-Pest . Rest. Nan - r? e s t , _I__ _I__
Kon-P.est ________I_
63 1 19 11 5 --
-..

Days Rest *
€bars Post- hdm i n *
31
31
31
31
14
24
Tissue Segment
st. s.1.-1 S.I.-2 S.I.-3 S.I.-L: Ce,
L.1.-2 L.r.-i
S t , s.1 .-I S.I.-2 S.I.-3 S.I.-4 Ce L.1.-1 L.I.-2
St. S.I.-l S.I.-2 S.I.-S S.1,-4 Ce . L.I.-1 L.1.-2
S t . S.I.-l S.I.-2 S . I . - 3 S.I.-4 Ce. I,.I.-l L.I.-2
TAiiLE IX
(Cont imeci f
B!ornal Diet Low-Fat Diet €1 igh-Fat Diet
?,Ton-Dest. _p_
Rest. P
Rest. NOR - I’, es t Rest, ?Jon-Res t . P P
1 1
-- 34
5 2
32 2 2 3 39
4
44 2 2 4 7
12 13
4
26 2 3 5
37 29 -- -- 26
2 2 2 5 E 23 2

- 1 TABLE X
DISTRIBUTIC?-I IN TiIE GASTROINTESTIYAL TRACT (AS % OF DSSE Rf)lfINISTEPET! AT T I t E INTEPVALS AFTER ISClTOPE x4DXI?JISTR.4TION) I N RATS SUaJECTED TC VARYIYG ?ER.IODS OF 6*Co IP.PJ.3IATI9J
OR SiI.M4-IRRADIATION LYD RESTRAIKT OR >!@N-RESTRRI?JT
Hours Days Post- T i s s u e Rest. Admin. Semen t
1 0.5 st. s.1.-1 s. 1.-2 S.I.-3 S.1.-4 cc * L.1.-1 L.I . -2
1 1
1 2
1 4
St. S,I.-l S.J.-2 S.I.-3 S.I.-4 Ce L. I .-1 I,. I. -2
St. s.1.-1 S.I.-2 S.I.-3 S.I.-4 Ce L . 1 , - 1 L.1.-2
St. S.I.-l s . l . -2 S.I.-3 S.I.4 Ce. L . I . - l L.I.-2
1 5 St. s.1,-1 S.I.-2 5.1.-3 S.I.-4 Gee L.1 . -1 L.I.-2
0 R/Day 50 !?:/nay 3@0 P./Day
Rest Non-Rest a ??est. $:on-Rest . Rest. Non-P.est, P ____r_ P

TABLE X
( C o n t inueri)
Hours Post- Admin .
0 R/Day 50 ?./Day 300 ?/Day Days Rest,
T i s su c S e :ne II t Rest.
P
Yon-Rest . !lon-?.c s t . P I_
Rest Yon-Rcst. Rest _I__.
8
0 . 5
4
St. s.1.-1 S.I.-2 S . I . 4
C e . I,. I * -1 L.1.-2
s,r.-4
5 3 1 1 2
66 1
15
-- 4 2 14 70 _- I- --
St. s. I .-1
S.T. -3 S .1 , -4 C e L.1.-1 L.1.-2
s.r.-z 3 42 52
I- --
3 1 2 . 36 39 -_
7 13 34 41 --
3 1.5 13 40 2.6 -., --
S t . s.1.-1 S.I.-2 S,I.-3 s, T . -4 CC. L.1.-1 1,.1.-2
3 2 St. S.I,-1 s.1.-2 S.1.-3 S,I.-4 Ce L.1 . -1 L.1.-2
7 13 13 56 9
10 10 3
36 33 -- --
3 14 5 2 21 51 11 --
6 10 3 27 33 19 --
St * S.I*-l S,I,-2 S.I.-3 S.I.-4 Ce. L*I.-l L.1.-2 -- *I

'I TABLE X
(Continued]
I lour s Post- Adm i n .
300 !?/9av 0 R/Day 50 R/Day __1_D
Days Rest,
Tissue Segrient
S t , S.I , -1 S.I.-2 S.I.-3 S.I.-4 C@ * L.1.-1 L.1.-2
Rest.
4 3 1 6 51 20
_c__I
-- --
Rest, _y___y
Rest. Non-Rest . ___I__
Non-Rest . 1s
5 5 6
23 42 5 1
31 on - P. e s t e
6 3 1 2 3 5 75
3 St. S. I , - l s.1.-2 S.I.-3 S,I.-4 Ce. I,.I.-I I,.I.-2
1 3
2 2 1 4 8 71
5 --
1 2 1 1
69 15 1
I..
I-
1 14
17 5s
0.5 St, S.I.-l S,I.-2 S.I.-3 S.I.-4 Ce. L.I,-l L.1,-2
10 67 11 --
G
6 1 St s.1.-1 s.1.-2 S.1.-3 S.I.-4 Ce. L.1.-1 L.1.-2
2 41 56
1 21 23 41
5 -- I-
-- ..- -.a.
St. s.1.-1 S,I,-2 S,I.-3 S.I.-4 Ce e
L,I.-1 I,. 1 * -2
2 11 5 62,
21 11 *
15 37 16 I- --
11 9 6
35 28 -- -- -I
6 2
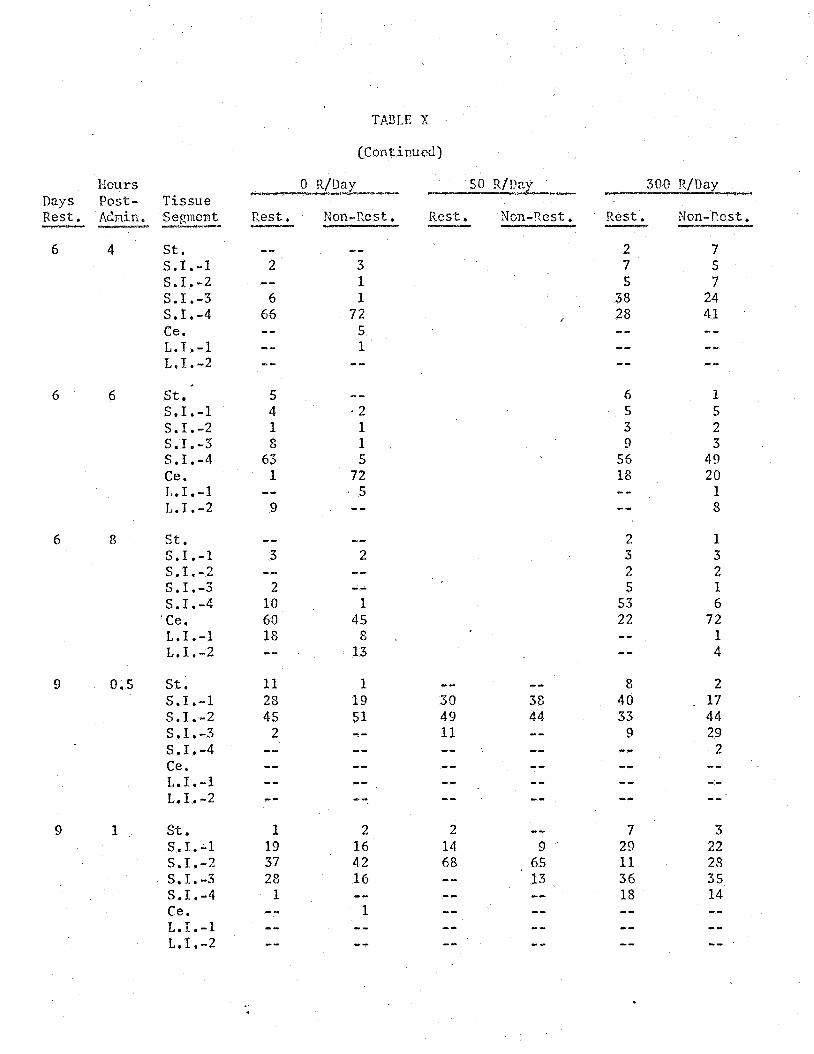
TA3tE X
cconat inucd)
__I__
0 R/Day 50 R/Erry 300 R/Day Hours Days Post- T i s s u e Rest. Aclnin. Segment
6 4 St. S.I.-l S,I.-2 S.I.-3 S.I.-4 Ce e
L.1.-1 L.1.-2
St s.1.-1 S,I.-2
S.I.-4 cc * L.1.-1 L.1.-2
s.r.-3
Rest . N m - R e s t . _I___p_
Rest, Non-Rest I____
Non-Rest. YI
?.est. _yI
2 7 7 5 5 7 38 24 28 41
1 1 72
-- 6
66 5 1 -- -- --
-- I-
6 6 5 4 1 8 63 1
6 1 5 5 3 2 9 3
56 49 18 20
-- '2 1 1 5
72 1 8
-.. 9
6 2 3 2 5
53 22
1 3 2 1 6 72 1 4
8 St. S.I.-l S.I,-2 S.I.-3 S.1,-4
L.1.-1 L.1.-2
'Ce.
-- I..
3 -..
2 ..e
2 10 60 18
-- 1
45 8 13
9 0.5 St. s.1.-1 s.1.-2 S.1.-3 S . 1 , - 4 Ce L.1.-1 L.1.-2
11 2s 45
2 -.. --
1 19 51 --
8 40 33
9
2 17 44 29 2
-- 30 49 11
-- e..
9 1 St. s.1.-1 S.I.-2 S.I.-.3 S.I.-4 Ce. L.1.-1 L*I,-2
1 19 37 28 1
2 16 42 16
2 14 68 -...
7 29 11 36 18
3 22 23 35 14
..I
9 65 13 --

TABLE X
(Cont inu ed)
Days Rest. o _ l _ s l
9
Hours Post- T i s s u e Admin. Segnent
2
9 4
9 6
9 8
St. S.1.-I S.I.-2 S.I.-3 S.I.-4 Ce . L.1.-1 L.I.-2
S t . S.I.-l S.I.-2 S.I,-3 S.I.-4 Ce . L.1.-1 L.1.-2
St. S.I.-l S.I.-2 S.I.-3 S.I.-4 Ce . L.1.-1 L.1.-2
St. S.I.-l s.1.-2 S.I.-3 S.1.-4 Ce. I., I. - 1 L.I.-2
0 R/Day
Rest
6 11 52 17 --
1 - 4 3 64 --
-- 1 5 1 14 53 8 -- -- 5 1
1 1 54
4 25
--
Non-Res t . 1 5 6 66
5 -_ -- --
-- 2 1 4 10 66 1 2
1 2
1 3
46 39 2
-"
50 R/Day
Rest. Non-Rest a ___q_x
1 15 2 60 12
. 2 16 18 47 --
300 R/Day
Rest. P
30 16 21 27 11 -- I* -- 15 19 10 22 32
-- 3 2 2 11 33 31 12
!?on - R e st
16 21 8 37 19 -- -- -- 8 7 32 28 25 -- -- --
2 9 8 26 50 -- -- -- 3 2 3
23 42 14 2 1

T .B E XI
BACTERIAL COU?:TS AFTER I?JI)ICRTED D.4YS OF FESTRAINT OR NON-RESTP.AINT
I n t e s t i n a l Days S e gme n t Restraint Yon-Restraint _I
Normal Diet 7 Jejunum 16600 20000 I1 eum 100800 380000
21 Jejunum 24500 13700 I 1 eun 289000 333000
High-Fat 21 Je j unun 20100(") 4 54 I 1 eum 1790000 260000
One r e s t r a i n e d ra t had a high j e j u n a l count; hence, t h e d i f f e r e n c e between r e s t r a i n e d and non-restrained rats on this d i e t .

'I
U w S .r
- 3 - w i e o .r u1 I a w L C Z o V I o w o D L Z . .
I I I 1
o O L - a
c, w o L I a L 0
ELL Ia w w r *c w - m c SI- cro
w u- lncr 0- Ia
Ia .- W 2 - L L L Q o w 0 L c r L L S Q W H a
< uz, L m Q -0 - u 3 s m v)
o w 0 m Q V
ar
A n
m s
.. W k- 0 z
0 hl - 0
0 c
0 m
-rl
0 3.1 a 0 fa

50
1 0
5
1 0
A R e g u l a r D i e t
El L o w F a t D i e t
0 H i g h F a t D i e t
I I I I I I 1 0 20
Days R e s t r a i n e d
FIGURE 2
30
Mean Percentage D i f f e r e n c e B e t w e e n R e s t r a i n e d and N o n - R e s t r a i n e d R a t s on a N o r m a l , Low F a t o r H i g h F a t D i e t

0 N r-
c i a z z c i c z
c i c i c i c i 0 0 0 0
LD Lo
ci 2 c i
c i a : 0 0 0 0 m m
0 0 - 0
CO
U 01 c, m .r U rd L L c-(
L 0 .
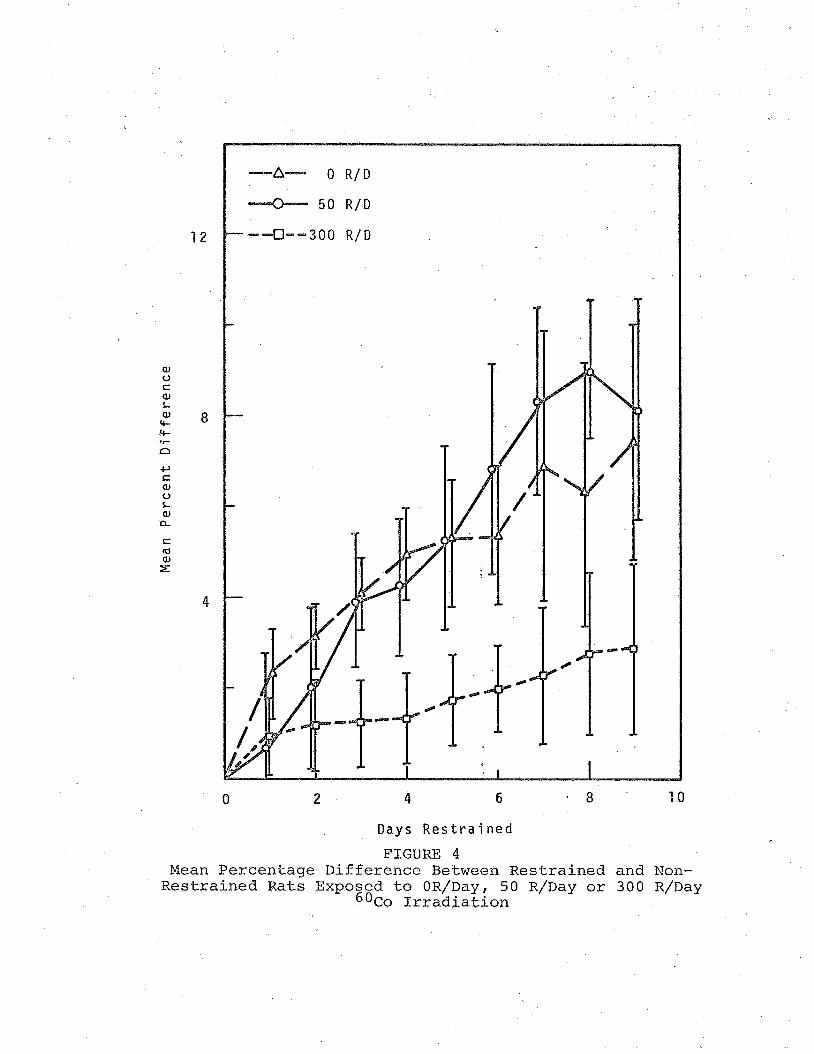
aJ 0 t: aJ L W cc cc .r n c, S aJ u L aJ a S a W E
1 2
8
4
-A=-- 0 R I D
50 R/D
- --a-- 300 R I D
0 2 4 6 a 8 10
D a y s R e s t r a i n e d FIGURE 4
Mean Percentage D i f f e r e n c e B e t w e e n R e s t r a i n e d and Non- R e s t r a i n e d R a t s E x p o s e d t o OR/Day, 50 R/Day o r 300 R/Day
6oCo I r r a d i a t i o n


![1159 voronka[1]](https://img.pdfslide.net/doc/110x75/55ab94061a28abda158b47d4/1159-voronka1.jpg)