Embed Size (px)
Citation preview
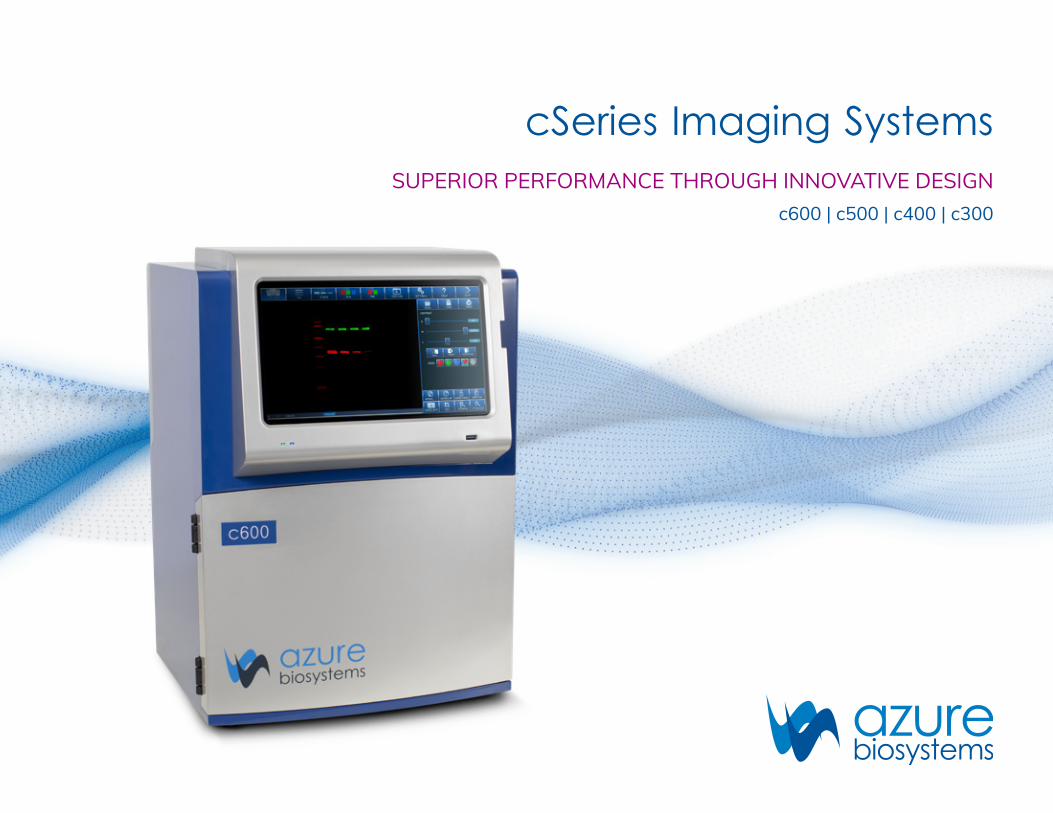
cSeries Imaging SystemsSUPERIOR PERFORMANCE THROUGH INNOVATIVE DESIGN
c600 | c500 | c400 | c300

Big performance, small footprint, incomparable value
Great science starts with high-quality data, and when it comes to imaging gels, blots, plates, and even intact tissues and small animal models, high-quality data starts with the cSeries.
Leveraging Azure Biosystems’s deep expertise in imaging system engineering, the cSeries delivers best-in-class sensitivity, dynamic range, and signal-to-noise ratio in an easy-to-use, compact instrument.
• Get high-quality data from an expertly-engineered system
• Perform a wide range of imaging applications with a single, versatile instrument
• Choose a system for today’s needs and upgrade as your detection methodologies change
• Seamlessly integrate the cSeries into your studies with easy-to-use image acquisition and analysis workflows
• Save space with our compact design
• Rest easy with a dedicated team ready to answer questions, troubleshoot, and provide on-site support
In-gel Fluorescence with GFP and TAMRA
IR FLUORESCENCE | VISIBLE FLUORESCENCE | UV FLUORESCENCE | CHEMILUMINESCENCE VISIBLE IMAGING | BLUE LIGHT EXCITATION
Gels | Blots | Plates | Tissues | Small Animal Models | Plants
Stain-Free™ Gels Western Blot with Cy3 and Cy5 Dyes
Escherichia coli
Chemiluminescent Western blot Mouse brain sections Mouse with RFP-labeled subcutaneous tumor
Arabidopsis thaliana
See How We Deliver High-Quality, Multimodal Imaging
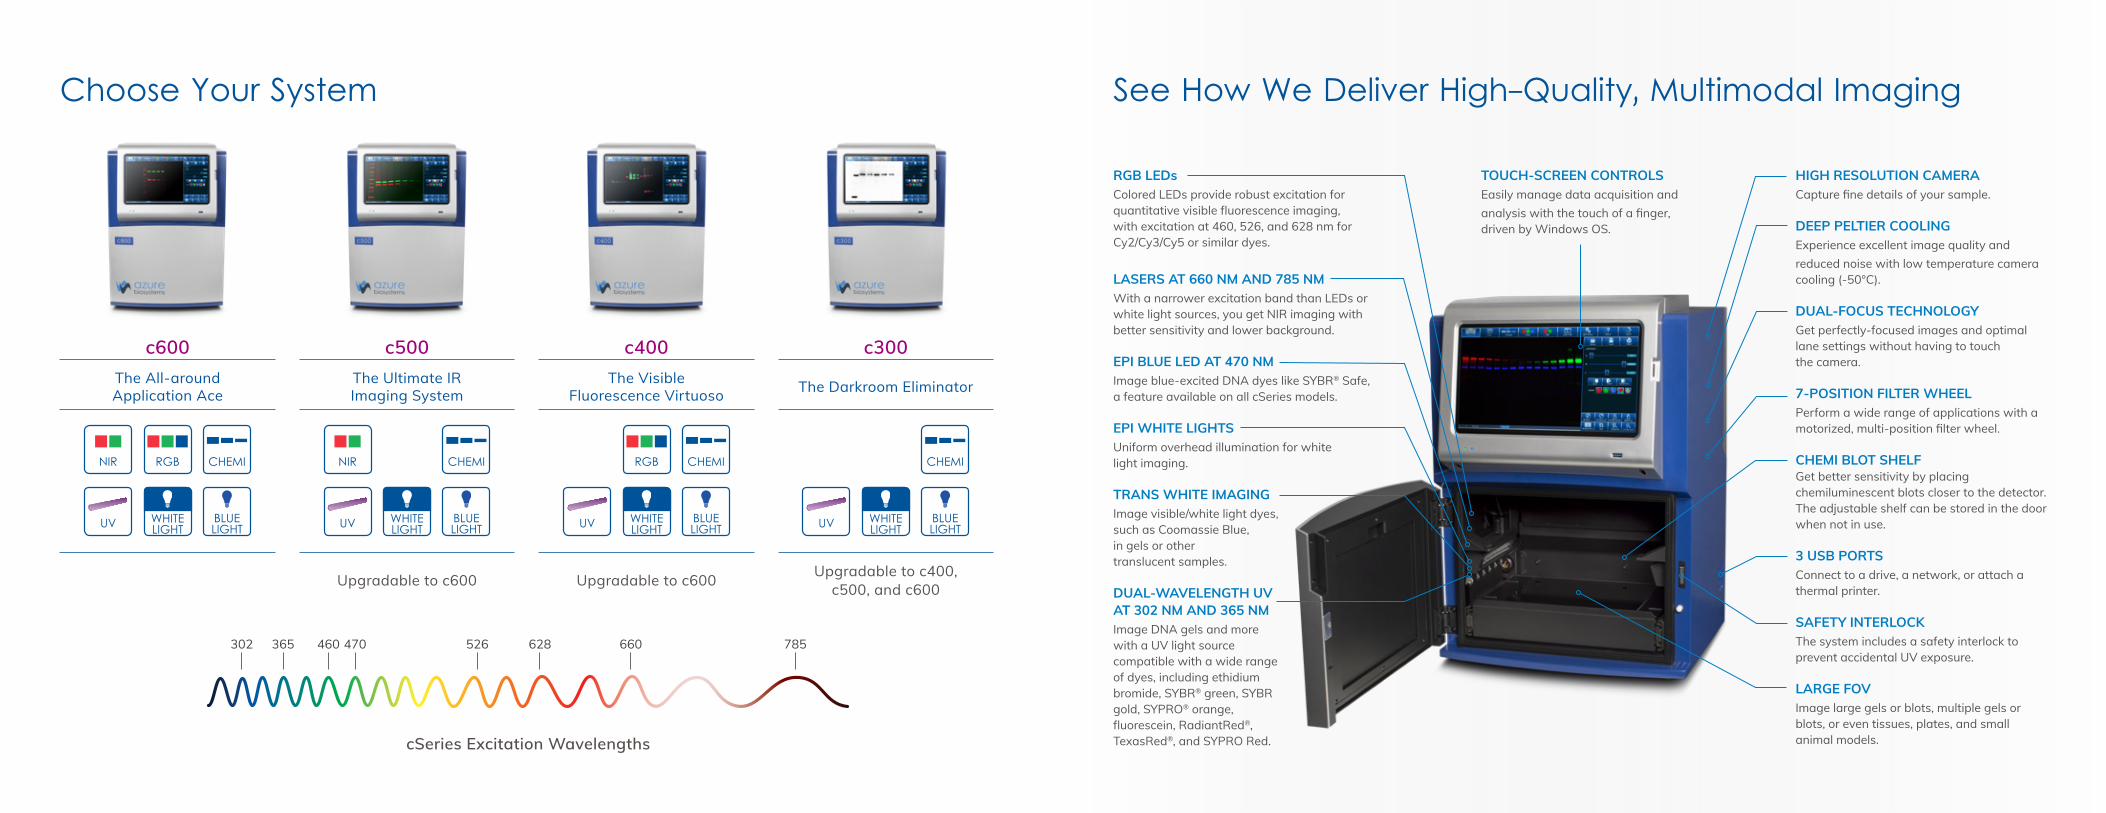
RGB LEDsColored LEDs provide robust excitation for quantitative visible fluorescence imaging, with excitation at 460, 526, and 628 nm for Cy2/Cy3/Cy5 or similar dyes.
LASERS AT 660 NM AND 785 NMWith a narrower excitation band than LEDs or white light sources, you get NIR imaging with better sensitivity and lower background.
EPI BLUE LED AT 470 NMImage blue-excited DNA dyes like SYBR® Safe, a feature available on all cSeries models.
EPI WHITE LIGHTSUniform overhead illumination for white light imaging.
TRANS WHITE IMAGINGImage visible/white light dyes, such as Coomassie Blue, in gels or other translucent samples.
DUAL-WAVELENGTH UV AT 302 NM AND 365 NMImage DNA gels and more with a UV light source compatible with a wide range of dyes, including ethidium bromide, SYBR® green, SYBR gold, SYPRO® orange, fluorescein, RadiantRed®, TexasRed®, and SYPRO Red.
Choose Your System
c600 c500 c400 c300The All-around Application Ace
The Ultimate IR Imaging System
The Visible Fluorescence Virtuoso The Darkroom Eliminator
Upgradable to c600 Upgradable to c600 Upgradable to c400, c500, and c600
HIGH RESOLUTION CAMERACapture fine details of your sample.
DEEP PELTIER COOLINGExperience excellent image quality and reduced noise with low temperature camera cooling (-50°C).
DUAL-FOCUS TECHNOLOGYGet perfectly-focused images and optimal lane settings without having to touch the camera.
7-POSITION FILTER WHEELPerform a wide range of applications with a motorized, multi-position filter wheel.
CHEMI BLOT SHELFGet better sensitivity by placing chemiluminescent blots closer to the detector. The adjustable shelf can be stored in the door when not in use.
3 USB PORTSConnect to a drive, a network, or attach a thermal printer.
SAFETY INTERLOCKThe system includes a safety interlock to prevent accidental UV exposure.
LARGE FOVImage large gels or blots, multiple gels or blots, or even tissues, plates, and small animal models.
TOUCH-SCREEN CONTROLSEasily manage data acquisition and analysis with the touch of a finger, driven by Windows OS.
NIR RGB CHEMI
WHITELIGHT
BLUELIGHTUV
NIR CHEMI
WHITELIGHT
BLUELIGHTUV
RGB CHEMI
WHITELIGHT
BLUELIGHTUV
CHEMI
WHITELIGHT
BLUELIGHTUV
cSeries Excitation Wavelenths
302 365 460 470 526 628 660 785
cSeries Excitation Wavelengths
c600 | c500 | c400
Dig Deeper: Visible Fluorescence Imaging
With high resolution, high sensitivity, and low background fluorescence imaging, the cSeries enables quantitative Western blotting and a whole lot more. Choose the c400 for visible fluorescence, the c500 for NIR fluorescence, or the c600 for both visible and NIR fluorescence.
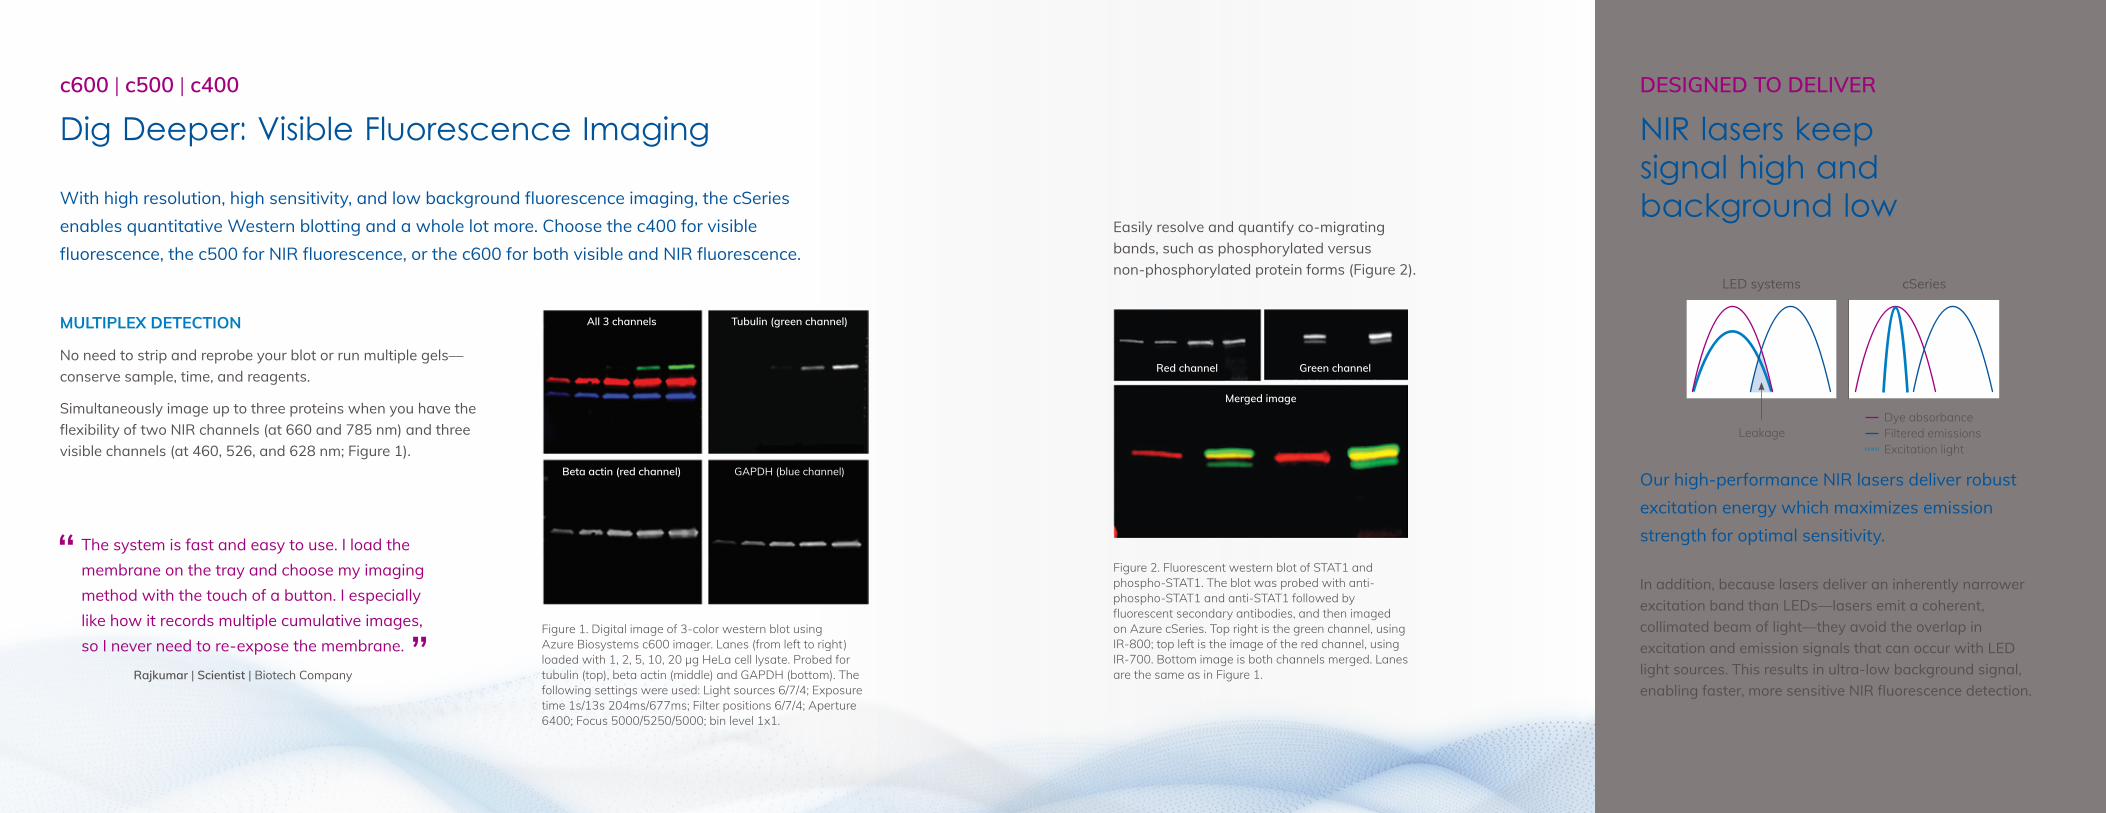
Figure 1. Digital image of 3-color western blot using Azure Biosystems c600 imager. Lanes (from left to right) loaded with 1, 2, 5, 10, 20 μg HeLa cell lysate. Probed for tubulin (top), beta actin (middle) and GAPDH (bottom). The following settings were used: Light sources 6/7/4; Exposure time 1s/13s 204ms/677ms; Filter positions 6/7/4; Aperture 6400; Focus 5000/5250/5000; bin level 1x1.
All 3 channels Tubulin (green channel)
Beta actin (red channel) GAPDH (blue channel)
MULTIPLEX DETECTION
No need to strip and reprobe your blot or run multiple gels—conserve sample, time, and reagents.
Simultaneously image up to three proteins when you have the flexibility of two NIR channels (at 660 and 785 nm) and three visible channels (at 460, 526, and 628 nm; Figure 1).
Figure 2. Fluorescent western blot of STAT1 and phospho-STAT1. The blot was probed with anti-phospho-STAT1 and anti-STAT1 followed by fluorescent secondary antibodies, and then imaged on Azure cSeries. Top right is the green channel, using IR-800; top left is the image of the red channel, using IR-700. Bottom image is both channels merged. Lanes are the same as in Figure 1.
Easily resolve and quantify co-migrating bands, such as phosphorylated versus non-phosphorylated protein forms (Figure 2).
DESIGNED TO DELIVER
NIR lasers keep signal high and background low
Our high-performance NIR lasers deliver robust excitation energy which maximizes emission strength for optimal sensitivity.
In addition, because lasers deliver an inherently narrower excitation band than LEDs—lasers emit a coherent, collimated beam of light—they avoid the overlap in excitation and emission signals that can occur with LED light sources. This results in ultra-low background signal, enabling faster, more sensitive NIR fluorescence detection.
LED systems cSeries
Dye absorbanceFiltered emissions Excitation light
Red channel Green channel
Merged image
Leakage
The system is fast and easy to use. I load the membrane on the tray and choose my imaging method with the touch of a button. I especially like how it records multiple cumulative images, so I never need to re-expose the membrane.
Rajkumar | Scientist | Biotech Company
c600 | c500 | c400
Dig Deeper: Visible Fluorescence Imaging (continued)
DESIGNED TO DELIVER
RGB LEDs maximize flexibility and value
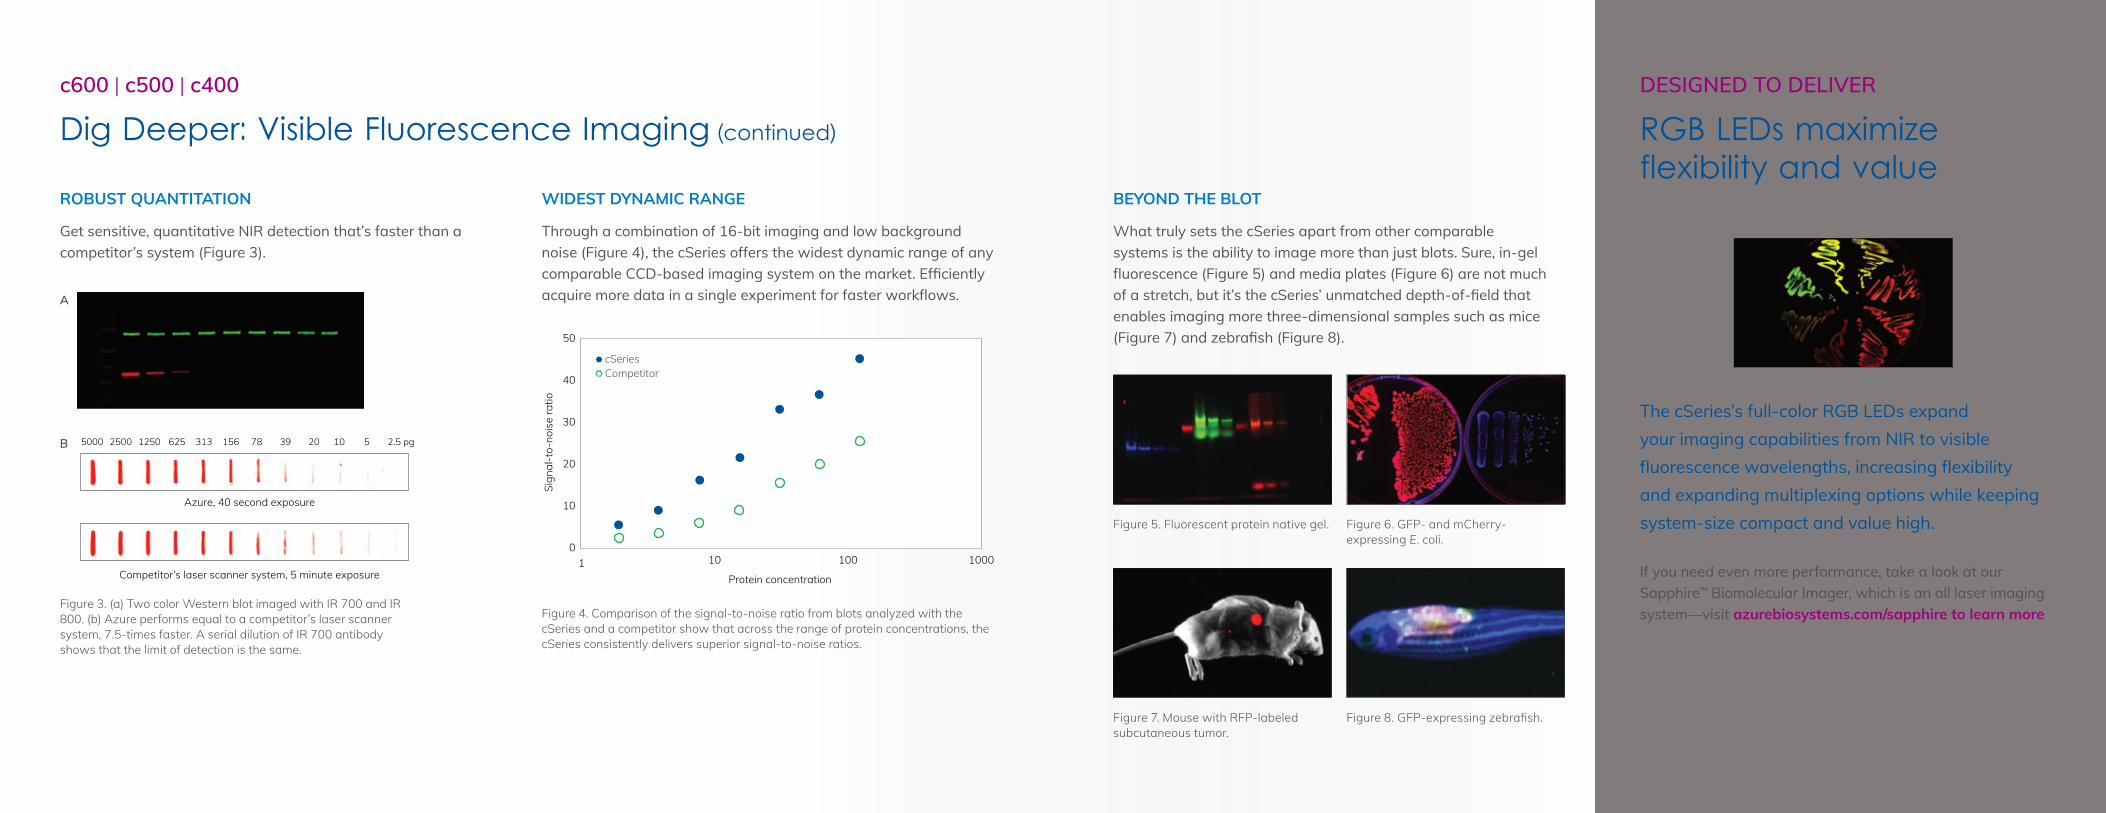
BEYOND THE BLOT
What truly sets the cSeries apart from other comparable systems is the ability to image more than just blots. Sure, in-gel fluorescence (Figure 5) and media plates (Figure 6) are not much of a stretch, but it’s the cSeries’ unmatched depth-of-field that enables imaging more three-dimensional samples such as mice (Figure 7) and zebrafish (Figure 8).
Figure 5. Fluorescent protein native gel.
Figure 3. (a) Two color Western blot imaged with IR 700 and IR 800. (b) Azure performs equal to a competitor’s laser scanner system, 7.5-times faster. A serial dilution of IR 700 antibody shows that the limit of detection is the same.
A
Azure, 40 second exposure
5000 2500 1250 625 313 156 78 39 20 10 5 2.5 pg
Competitor’s laser scanner system, 5 minute exposure
B
Figure 6. GFP- and mCherry-expressing E. coli.
Figure 7. Mouse with RFP-labeled subcutaneous tumor.
Figure 8. GFP-expressing zebrafish.
ROBUST QUANTITATION
Get sensitive, quantitative NIR detection that’s faster than a competitor’s system (Figure 3).
WIDEST DYNAMIC RANGE
Through a combination of 16-bit imaging and low background noise (Figure 4), the cSeries offers the widest dynamic range of any comparable CCD-based imaging system on the market. Efficiently acquire more data in a single experiment for faster workflows.
The cSeries’s full-color RGB LEDs expand your imaging capabilities from NIR to visible fluorescence wavelengths, increasing flexibility and expanding multiplexing options while keeping system-size compact and value high.
If you need even more performance, take a look at our Sapphire™ Biomolecular Imager, which is an all laser imaging system—visit azurebiosystems.com/sapphire to learn moreFigure 4. Comparison of the signal-to-noise ratio from blots analyzed with the
cSeries and a competitor show that across the range of protein concentrations, the cSeries consistently delivers superior signal-to-noise ratios.
• cSeries• Competitor
Sign
al-t
o-no
ise
ratio
Protein concentration
50
40
30
20
10
01000100101
c600 | c500 | c400 | c300
Dig Deeper: Chemiluminescent Imaging
Just as sensitive as film, but easier and more quantitative, our cSeries imaging systems will revolutionize your chemiluminescent workflows and virtually eliminate your darkroom.
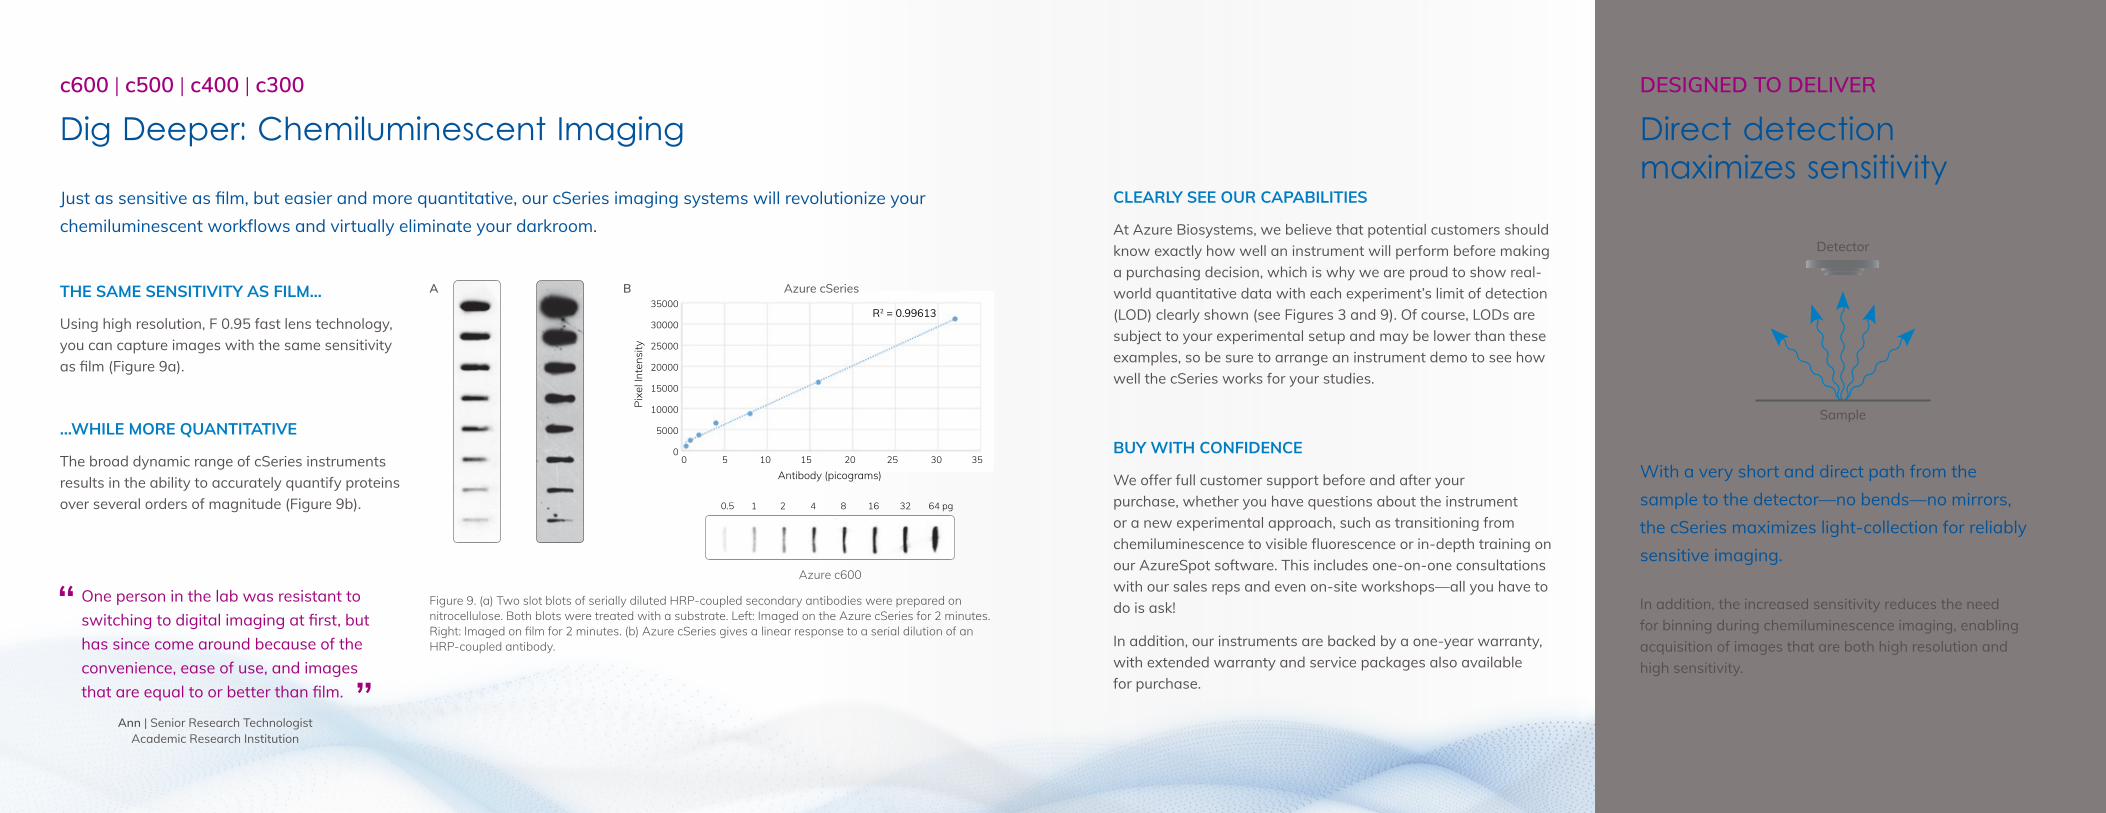
THE SAME SENSITIVITY AS FILM…
Using high resolution, F 0.95 fast lens technology, you can capture images with the same sensitivity as film (Figure 9a).
…WHILE MORE QUANTITATIVE
The broad dynamic range of cSeries instruments results in the ability to accurately quantify proteins over several orders of magnitude (Figure 9b).
0 5 10 15 20 25 30 35
35000
30000
25000
20000
15000
10000
5000
0
R2 = 0.99613
Azure cSeries
Pixe
l Int
ensi
ty
Antibody (picograms)
Azure c600
0.5 1 2 4 8 16 32 64 pg
BA
Figure 9. (a) Two slot blots of serially diluted HRP-coupled secondary antibodies were prepared on nitrocellulose. Both blots were treated with a substrate. Left: Imaged on the Azure cSeries for 2 minutes. Right: Imaged on film for 2 minutes. (b) Azure cSeries gives a linear response to a serial dilution of an HRP-coupled antibody.
CLEARLY SEE OUR CAPABILITIES
At Azure Biosystems, we believe that potential customers should know exactly how well an instrument will perform before making a purchasing decision, which is why we are proud to show real-world quantitative data with each experiment’s limit of detection (LOD) clearly shown (see Figures 3 and 9). Of course, LODs are subject to your experimental setup and may be lower than these examples, so be sure to arrange an instrument demo to see how well the cSeries works for your studies.
DESIGNED TO DELIVER
Direct detection maximizes sensitivity
With a very short and direct path from the sample to the detector—no bends—no mirrors, the cSeries maximizes light-collection for reliably sensitive imaging.
In addition, the increased sensitivity reduces the need for binning during chemiluminescence imaging, enabling acquisition of images that are both high resolution and high sensitivity.
Detector
Sample
BUY WITH CONFIDENCE
We offer full customer support before and after your purchase, whether you have questions about the instrument or a new experimental approach, such as transitioning from chemiluminescence to visible fluorescence or in-depth training on our AzureSpot software. This includes one-on-one consultations with our sales reps and even on-site workshops—all you have to do is ask!
In addition, our instruments are backed by a one-year warranty, with extended warranty and service packages also available for purchase.
One person in the lab was resistant to switching to digital imaging at first, but has since come around because of the convenience, ease of use, and images that are equal to or better than film.
Ann | Senior Research TechnologistAcademic Research Institution

1X1 Binning
5.4 µ
5.4 µ
2X2 Binning
10.8 µ
10.8 µ
40 seconds, unbinned 40 seconds, 2X2 bin
DESIGNED TO DELIVER
Flexibility maximizes image acquisition
BINNING: OPTIMIZE SENSITIVITY AND RESOLUTION
With a CCD camera, you can combine multiple pixels into a single larger pixel or “super pixel,” to collect more light, a technique known as binning. An unbinned image (also known as a “1X1”), uses the full resolution of the camera during image capture. A binning of 2X2 means that the areas of 4 adjacent pixels are combined into one larger pixel, and so on. On-chip binning enables significant increases in signal without increasing noise, for highly sensitive detection.
Figure 10. The cSeries’s high resolution and flexible binning capabilities—up to 5 levels of binning—ensures optimal image acquisition for chemiluminescent Western imaging.
DESIGNED TO DELIVER
Reagents optimized for quantitation
CHEMILUMINESCENCE
All reagents are not created equal. Azure’s Radiance chemiluminescent Western blot substrate is clearly better optimized for quantitation than the alternatives, with high sensitivity and a wider linear range than other chemiluminescent reagents.
We also offer Radiance PLUS for applications where you need even greater sensitivity.
FLUORESCENCE
We also offer fluorescently-labeled secondary antibodies that deliver unparalleled sensitivity and performance for immunoblotting applications when used in conjunction with Azure’s Western blotting systems. Choose from AzureSpectra 550-, 650-, 700- and 800-labeled antibodies in the following formats:
• Goat-anti-rabbit• Goat-anti-mouse• Goat-anti-human• Goat-anti-chicken
• Goat-anti-rat• Goat-anti-guinea pig• Donkey-anti-goat
Sign
al in
tens
ity
10000
1000
100
10
100001000100101
Substrate R2
• Radiance 0.993• Reagent A 0.981• Reagent B 0.988 • Reagent C 0.988
Providing tools to analyze gels, blots, and more, AzureSpot software makes complex analysis a simple process. Designed to be either fully automated or manual, AzureSpot provides flexibility and accuracy for data analysis.
• Automatic lane creation
• Band detection
• Background subtraction
• Molecular size/pI calibration
• Quantity calibration
• Colony counting
• Array analysis (for 96-well plates and microarrays)
• Annotation for comments and highlighting the image
Powerful AzureSpot Analysis Software
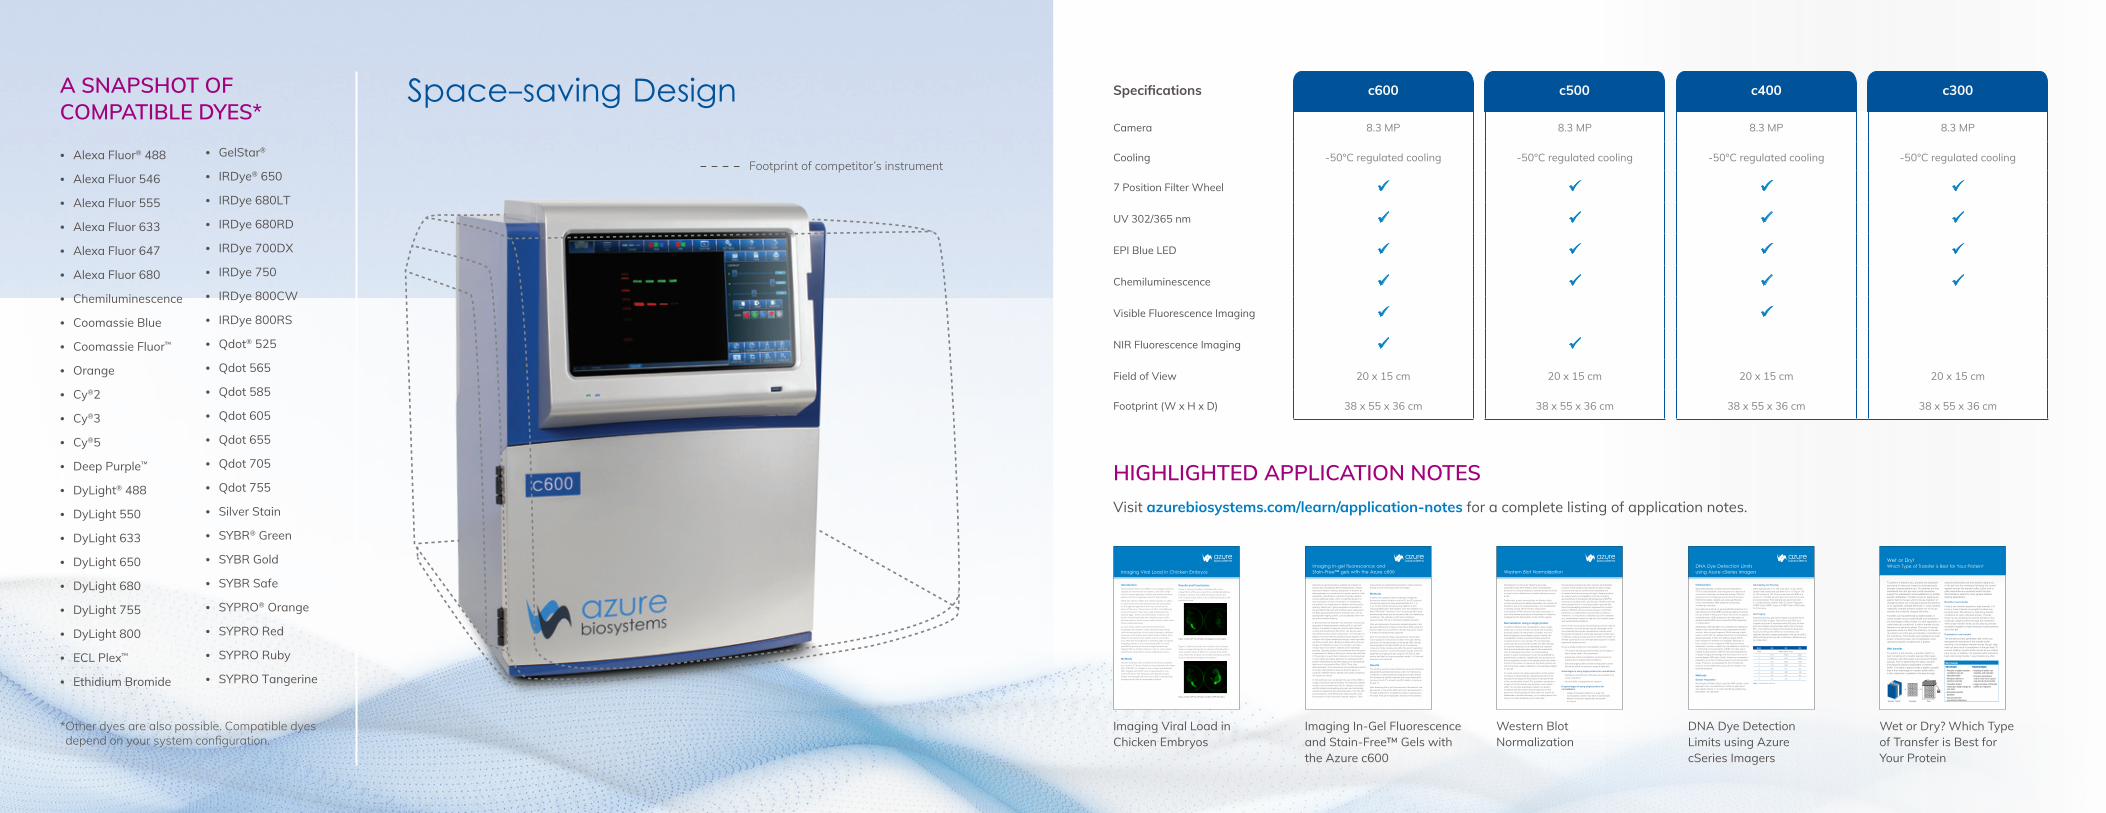
Space-saving Design
• Alexa Fluor® 488
• Alexa Fluor 546
• Alexa Fluor 555
• Alexa Fluor 633
• Alexa Fluor 647
• Alexa Fluor 680
• Chemiluminescence
• Coomassie Blue
• Coomassie Fluor™
• Orange
• Cy®2
• Cy®3
• Cy®5
• Deep Purple™
• DyLight® 488
• DyLight 550
• DyLight 633
• DyLight 650
• DyLight 680
• DyLight 755
• DyLight 800
• ECL Plex™
• Ethidium Bromide
A SNAPSHOT OF COMPATIBLE DYES*
• GelStar®
• IRDye® 650
• IRDye 680LT
• IRDye 680RD
• IRDye 700DX
• IRDye 750
• IRDye 800CW
• IRDye 800RS
• Qdot® 525
• Qdot 565
• Qdot 585
• Qdot 605
• Qdot 655
• Qdot 705
• Qdot 755
• Silver Stain
• SYBR® Green
• SYBR Gold
• SYBR Safe
• SYPRO® Orange
• SYPRO Red
• SYPRO Ruby
• SYPRO Tangerine
* Other dyes are also possible. Compatible dyes depend on your system configuration.
Camera 8.3 MP 8.3 MP 8.3 MP 8.3 MP
Cooling -50°C regulated cooling -50°C regulated cooling -50°C regulated cooling -50°C regulated cooling
7 Position Filter Wheel ü ü ü ü
UV 302/365 nm ü ü ü ü
EPI Blue LED ü ü ü ü
Chemiluminescence ü ü ü ü
Visible Fluorescence Imaging ü ü
NIR Fluorescence Imaging ü ü
Field of View 20 x 15 cm 20 x 15 cm 20 x 15 cm 20 x 15 cm
Footprint (W x H x D) 38 x 55 x 36 cm 38 x 55 x 36 cm 38 x 55 x 36 cm 38 x 55 x 36 cm
Specifications c600 c500 c400 c300
HIGHLIGHTED APPLICATION NOTESVisit azurebiosystems.com/learn/application-notes for a complete listing of application notes.
Imaging Viral Load in Chicken Embryos
IntroductionNewcastle Disease Virus (NDV) is a contagious disease, capable of transmission to humans, and with a high risk of a severe epizootic in birds, particularly domestic poultry which are typically reared at high density.
While the effects of NDV are mild in humans, its effect in avian hosts are more pronounced and vary based on the age and species of the host, as well as the strain of the virus. Three strains of NDV, with differing levels of virulence, have been well characterized in chicken eggs. Strains of intermediary virulence are known to infect primarily the umbilical tissue of the chicken embryo, whilst more virulent strains infect other tissues indiscriminately.
As such many studies have been performed to investigate the impacts of the varying strains along with the mechanisms of viral load in domestic chickens. However, such studies have often been limited in their ability to accurately and rapidly assess viral load in vivo. With the development of sensitive high-resolution imaging systems, such as the Azure c600, it is now possible to quickly and easily image fluorescently tagged NDV in chicken embryos, and, to some extent, quantify the viral load in various embryonic tissues.
MethodsChicken embryos were infected at E10 and incubated for a further 72 hours. Embryos were infected with either 100-1000 PFU of virulent or non-virulent recombinant NDV tagged with eGFP, and compared with a non-infected control. The embryos were placed on petri dishes and imaged with the Azure c600 using Epi Blue imaging mode with an automated capture.
Imaging Viral Load in Chicken Embryos
Results and ConclusionsFigure 1 shows an embryo infected with a non-virulent form of the virus next to an uninfected embryo (negative control). The infected embryo shows the non-virulent strain of the virus confined primarily in the umbilical tissue.
Figure 1. NDV eGFP No-VIR (left) and Negative Control (right).
Figure 2 shows the same non-virulent virus-infected embryo imaged alongside an embryo infected with a more virulent strain of NDV. The virulent form of the virus infects the embryo more indiscriminately, and the virus is detected throughout the embryo.
Figure 2. NDV eGFP No-VIR (left) and NDV eGFP VIR (right).
Imaging In-Gel Fluorescence and Stain-Free™ Gels with the Azure c600
Detecting in-gel fluorescence enables the analysis of protein gels immediately after electrophoresis, without staining or Western blotting. Separation of proteins by electrophoresis is a cornerstone of protein analysis. After separation, identification of proteins typically requires several additional steps, either incubating the gel in a staining solution to stain the proteins, or transferring the proteins to a membrane for Western blotting and/or staining. Stain-Free™ gels incorporate compounds in the gel matrix that react with proteins upon exposure to UV light, generating fluorescent products that, with an appropriate imaging system, can be detected within the gel without further staining.
In-gel fluorescence detection also presents a timesaving approach to electrophoretic mobility shift or “gel shift” assays. The assays, frequently used to detect protein-nucleic acid interactions (Rio 2014), can also be used also detect protein-protein interactions. The technique is based on the fact that two proteins bound together in a complex will migrate differently through a native gel than will either protein alone. Binding is observed by staining the gel and detecting a band in a sample of a protein mixture that is not seen in samples of the individual proteins. Typically, proteins are transferred from the gel to a membrane for Western blotting to confirm the identities of the proteins in each band observed on the stained gel. A much faster and easier approach to studying protein-protein interactions by gel shift assays is to fluorescently label one of the proteins (Park, 2004). Then, after electrophoresis, the fluorescence can be detected directly in the gel, eliminating the need to stain the gel or to conduct a Western blot to identify new bands containing the protein of interest.
In this technical note, we present the use of the c600 to image a fluorescent gel-shift assay. Fluorescently labeled ubiquitin was incubated with the E1 ubiquitin-activating and E2 ubiquitin-conjugating enzymes, and the binding reactions analyzed by gel electrophoresis. First, free and bound ubiquitin were detected by capturing the in-gel fluorescence of the fluorescein-labeled ubiquitin. Then,
Imaging in-gel fluorescence and Stain-Free™ gels with the Azure c600
total protein was detected fluorescently, without staining the gel or even removing it from the imager.
MethodsA series of incubations were conducted combining fluorescein-labeled ubiquitin and the E1 and E2 proteins. The binding reactions were quenched after 0.5, 1, 2, 4, 8, 16, 30, and 60 minutes by the addition of non-reducing SDS buffer. The samples were then loaded on a Mini-PROTEAN® TGX Stain-Free™ precast gel (Bio-Rad) and electrophoresis was conducted under non-denaturing conditions. The samples in each lane contained approximately 200 ng of fluorescein-labeled ubiquitin.
After electrophoresis, fluorescein-labeled ubiquitin in the gel was detected by imaging in the Azure c600, using the epi blue light source and filter in the gel acquisition mode. A 6–second exposure was captured.
After the fluorescein image was captured, total protein was imaged per instructions for Stain-Free gels. Briefly, using the UV transilluminator of the Azure c600, the gel was exposed to UV light at 302 nm for 5 minutes to cross-link trihalo compounds within the gel to tryptophan residues in proteins. Fluorescent protein bands were then detected by imaging the gel using the UV 365 nm light source and filter in the gel acquisition mode. A 10-second exposure was captured.
ResultsThe binding reactions were loaded onto a gel and proteins separated by gel electrophoresis under non-denaturing conditions. In-gel fluorescent imaging of the gel reveals free fluorescein-labeled ubiquitin and a time-dependent increase in both E1-ubiquitin and E2-ubiqitin complexes (Figure 1).
After detecting the in-gel fluorescence of fluorescein, the gel was left in the Azure c600 instrument and exposed to UV light at 302 nm to crosslink the trihalo compounds in the Stain-Free gel to tryptophan residues in the proteins.
Normalization is critical for obtaining accurate, quantitative data from Western blots. Normalization accounts for unequal loading of samples across the lanes on a gel, and for differences in transfer efficiency across a blot.
Traditionally, protein normalization for Western blots involves comparing the relative abundance of a protein of interest to that of an unrelated protein, the normalization or loading control. More recently, total protein normalization (TPN) methods have been developed, in which the relative abundance of the protein of interest is compared to the total protein content of the sample.
Normalization using a single proteinTo perform Western blot normalization using a single protein as a control, the blot is probed with a primary antibody specific for the protein of interest, and one directed against a normalization control. Ideally, the normalization control is a protein that is present at constant levels in every sample. The normalization control can be a pure protein spiked into each sample, or a protein expected to be expressed at a constant level across all sample types used in the experiment, such a housekeeping protein. If a housekeeping protein is used, its expression must not be affected by experimental conditions. Additionally, the abundance of the normalization control in the sample should be similar to that of the protein of interest so that both proteins are within the linear range of detection in the samples loaded on the gel.
For each sample, the relative abundance of the protein of interest is determined by calculating the ratio of the intensity of the signal for the protein of interest to that of the normalization control. For qualitative comparison, images of the two bands may be shown next to each other. For accurate quantitative results, the protein of interest and the control must be detected on the same blot. Probing duplicate blots does not control for differences in transfer efficiency, or for loading errors that may occur when preparing one or both gels.
Western Blot Normalization
Housekeeping proteins are often used as normalization controls. These proteins are required for basic cellular functions and may be constitutively expressed at a consistent level across many cell types. Several proteins are widely used as normalization controls, including glyceraldehyde 3-phosphate dehydrogenase (GADPH), actins (such as beta-actin), and tubulins. Recent work has demonstrated that it is not always safe to assume that these housekeeping proteins are expressed at constant levels in different cell lines or tissue types, or that their expression is unaffected by experimental conditions.1-5 Therefore, it is important to validate any protein selected as a normalization control for use with your sample types and experimental conditions.
Some of the more popular housekeeping proteins used as normalization controls are abundantly expressed, which may preclude their use as normalization controls when the protein of interest is much less abundant. Under such conditions, loading enough protein to detect the protein of interest could result in an over-saturated signal for a highly expressed loading control.
To use a single protein as a normalization control:
• The protein should be present across all cell types or tissue types used in the experiment
• Expression of the normalization control should not change due to experimental conditions
• Both the target protein and the normalization control should be within the dynamic range of detection.
Advantages to using single proteins for normalization • Validated, cost-effective antibodies are available from
many companies
• No new skills or equipment are required
Disadvantages to using single proteins for normalization • Unless fluorescent detection is used, the
normalization control must have a substantially different molecular weight than the protein of interest
IntroductionGel-based detection of DNA was first described in 1972 by Aaij and Borst1 and has gone on to become a cornerstone technique of molecular-biology. With the development of increasingly advanced and sensitive DNA technologies, reliable, accurate quantification of low concentration DNA products is becoming increasingly desirable.
The traditional method for gel-based DNA detection is to add ethidium bromide (EtBr) during gel casting. However, the use of EtBr is falling out of favor due to the mutagenic characteristics of EtBr arising from its intercalation of double stranded DNA which may affect DNA replication or transcription.
Additionally, although EtBr is not classified as hazardous waste at low concentrations many organizations treat it as such, often at great expense. Whilst staining of gels post-run with EtBr can reduce the amount of hazardous waste generated, it does not address issues arising from exposure of workers to a mutagen. Because of this a variety of non-mutagenic DNA dyes have been developed; however, unless they are capable of matching, or improving on the sensitivity of EtBr then their use is unlikely to gain traction. With the rise and advancement of digital imaging technology and techniques, the use of non-mutagenic DNA dyes (“safe” stains) has increased in popularity do to their combined ease of use and dynamic range. Therefore, we assessed the limit of detection (LoD) for various DNA dyes using cSeries imagers from Azure Biosystems.
MethodsSample PreparationNew England Biolabs Quick Load 1kb DNA Ladder, which features known concentrations of DNA for each band, was serially diluted 1:1 in water and 6X gel loading dye (See Table 1 for dilutions).
DNA Dye Detection Limits using Azure cSeries Imagers
Gel Casting and Running0.8% agarose gels in 1x TAE were cast, 10 µL of each dilution was loaded and gels were run in 1x TAE for 120 to 150 minutes at 70V. One gel was cast with EtBr at a dilution of 1:10,000, all other gels were cast without dye and post-stained. Post-staining was performed with a 1:10,000 dilution of either EtBr, EZ-Vision® Bluelight, SYBR® Gold, SYBR® Green or SYBR® Safe in TAE buffer for 30 minutes.
Gel ImagingFollowing staining, gels were imaged on both the Azure c200 and c600 imagers. Gels stained with EtBr were imaged using the UV transilluminator (302 nm), all other gels were imaged using Epi-Blue lights with an orange filter. In all instances images were captured using auto-exposure settings. No difference in sensitivity was detected between images generated by the Azure c200 or c600 confirming that any limit of detection differences are dye dependent.
Table 1. DNA ladder dilutions.
Band 4kb 3kb 2kb
Lane Mass (pg) in 10 µL
1 4125 15625 6000
2 2063 7813 3000
3 1031 3906 1500
4 516 1953 750
5 258 977 375
6 129 488 188
7 64 244 94
8 32 122 47
Wet transferAdvantages Disadvantages
• Flexible: multiple transfer conditions can be adjusted easily
• Multiple buffers to optimize transfer
• Transfers broad molecular weight range at one time
• Extended transfer possible
• Can be used for quantitative Westerns
• Heating of buffer can interfere with transfer
• Cooling mechanism and/or cold room space required during transfer
• Large volumes of transfer buffer are required
Western Blot Normalization
DNA Dye Detection Limits using Azure cSeries Imagers
Wet or Dry? Which Type of Transfer is Best for Your Protein
Footprint of competitor’s instrument

6747 Sierra Court, Suites A-B • Dublin, CA 94568 USAPhone: 925.307.7127 • Fax: [email protected] • www.azurebiosystems.com
Copyright © 2018 Azure Biosystems. All rights reserved. The Azure Biosystems logo, Azure Biosystems™, and Sapphire™ are trademarks of the Company. Alexa Fluor®, Coomassie Fluor™, DyLight®, Qdot®, SYBR®, and SYPRO® are trademarks of Thermo Fisher Scientific. Cy3®, Cy5® and Cy2® are registered trademarks of Amersham Biosciences. ECL Plex™ is a trademark of GE Healthcare. GelStar® is a trademark of FMC Corporation. IRDye® is a trademark of LI-COR, Inc. Stain-Free™ is a trademark of Bio-Rad Laboratories, Inc. All other trademarks, service marks and trade names appearing in this brochure are the property of their respective owners.