Embed Size (px)
Citation preview

4 July 2018
Level 1, 34 Colin Street, West Perth, Western Australia, 6005 | T: +61 8 9481 2555 | F: +61 8 9485 1290
www.azureminerals.com.au | ABN: 46 106 346 918 | ASX: AZS
AZURE DELIVERS ROBUST INITIAL MINERAL RESOURCE AT OPOSURA
HIGHLIGHTS:
Initial Mineral Resource estimate of 2.9 million tonnes @ 5.0% Zn + 2.8% Pb
Contained metal: 146,000 tonnes of zinc, 82,000 tonnes of lead and 1.6M ounces of
silver
75% of contained metal is in the Indicated Mineral Resource category
Mineral Resource remains open for extensions with further drilling planned for 2018
Easily accessible, near-surface mineralisation provides multiple open pit and
underground mine scheduling options
Pit optimisation and underground stope design studies are in progress as part of the
Preliminary Economic Assessment due in September
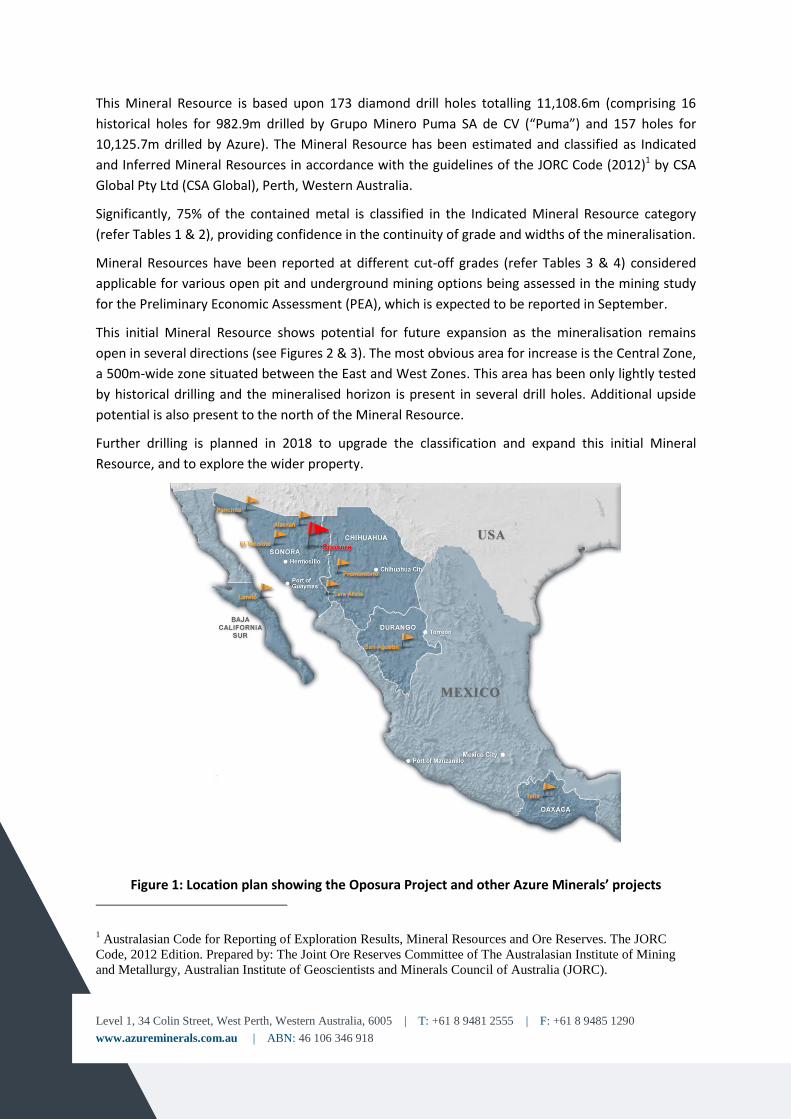
Azure Minerals Limited (ASX: AZS) (“Azure” or “the Company”) is pleased to report the initial
Mineral Resource estimate for its 100%-owned Oposura zinc-lead-silver project (“Oposura”) located
(see Figure 1) in Sonora, Mexico, of:
Table 1: Oposura Mineral Resource Estimate* Tonnes Zn Pb Zn+Pb Ag Mt % % % g/t Indicated 2.1 5.3 2.9 8.2 17.2 Inferred 0.8 4.3 2.5 6.8 16.5 TOTAL 2.9 5.0 2.8 7.8 17.0 *Refer Tables 2, 3 & 4 for full details of the Mineral Resource
Azure’s Managing Director, Mr Tony Rovira, commented: “This initial Oposura Mineral Resource is
a very positive outcome for the Company’s development and production strategy. Containing over
220,000 tonnes of zinc and lead and 1.6 million ounces of silver in near-surface, high-grade
mineralised zones, Oposura is presenting a strong case for mine development.
“Open pit and underground mine planning and scheduling are now underway. The schedules will be
used to optimise the proposed plant throughput rate and finalise the capital and operating cost
estimates. Further information on the results of these studies will become available during the third
quarter of 2018.
“Since acquiring Oposura less than a year ago, the Company has significantly advanced and de-
risked the project. Potential risks that have been positively addressed include the Mineral Resource,
metallurgical performance and process route, concentrate marketing and transport, environmental
baseline studies and access to infrastructure.”
Level 1, 34 Colin Street, West Perth, Western Australia, 6005 | T: +61 8 9481 2555 | F: +61 8 9485 1290
www.azureminerals.com.au | ABN: 46 106 346 918
This Mineral Resource is based upon 173 diamond drill holes totalling 11,108.6m (comprising 16
historical holes for 982.9m drilled by Grupo Minero Puma SA de CV (“Puma”) and 157 holes for
10,125.7m drilled by Azure). The Mineral Resource has been estimated and classified as Indicated
and Inferred Mineral Resources in accordance with the guidelines of the JORC Code (2012)1 by CSA
Global Pty Ltd (CSA Global), Perth, Western Australia.
Significantly, 75% of the contained metal is classified in the Indicated Mineral Resource category
(refer Tables 1 & 2), providing confidence in the continuity of grade and widths of the mineralisation.
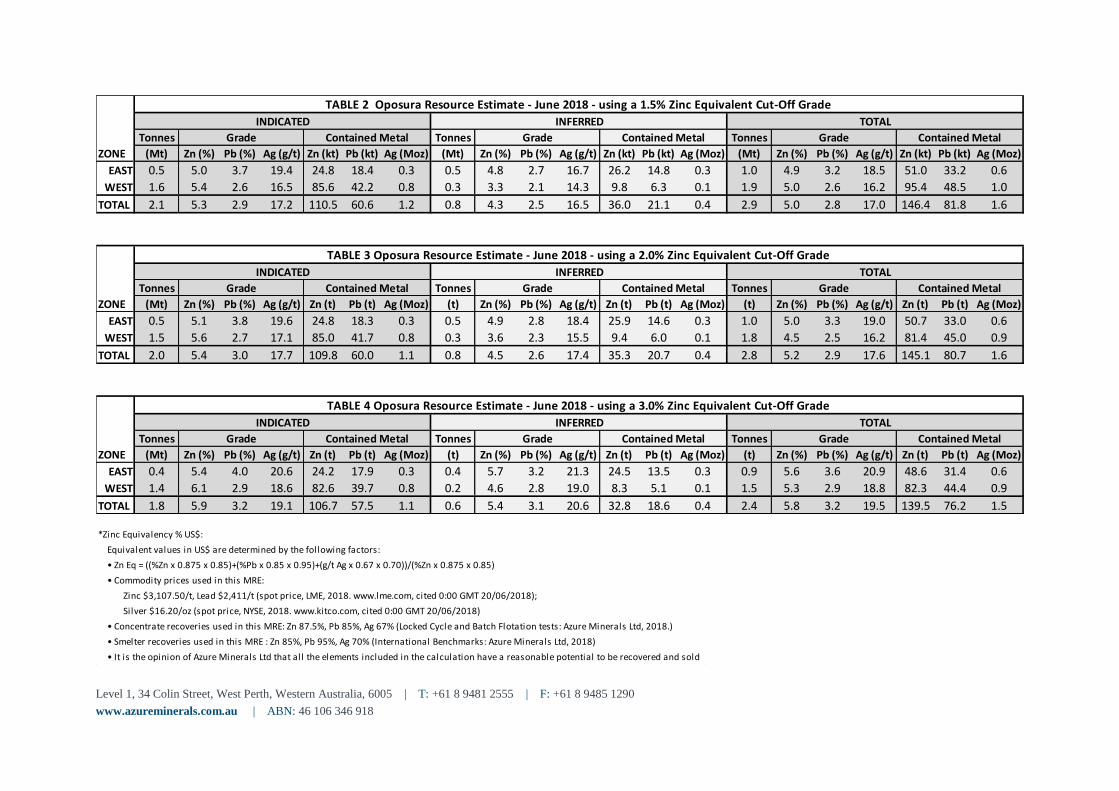
Mineral Resources have been reported at different cut-off grades (refer Tables 3 & 4) considered
applicable for various open pit and underground mining options being assessed in the mining study
for the Preliminary Economic Assessment (PEA), which is expected to be reported in September.
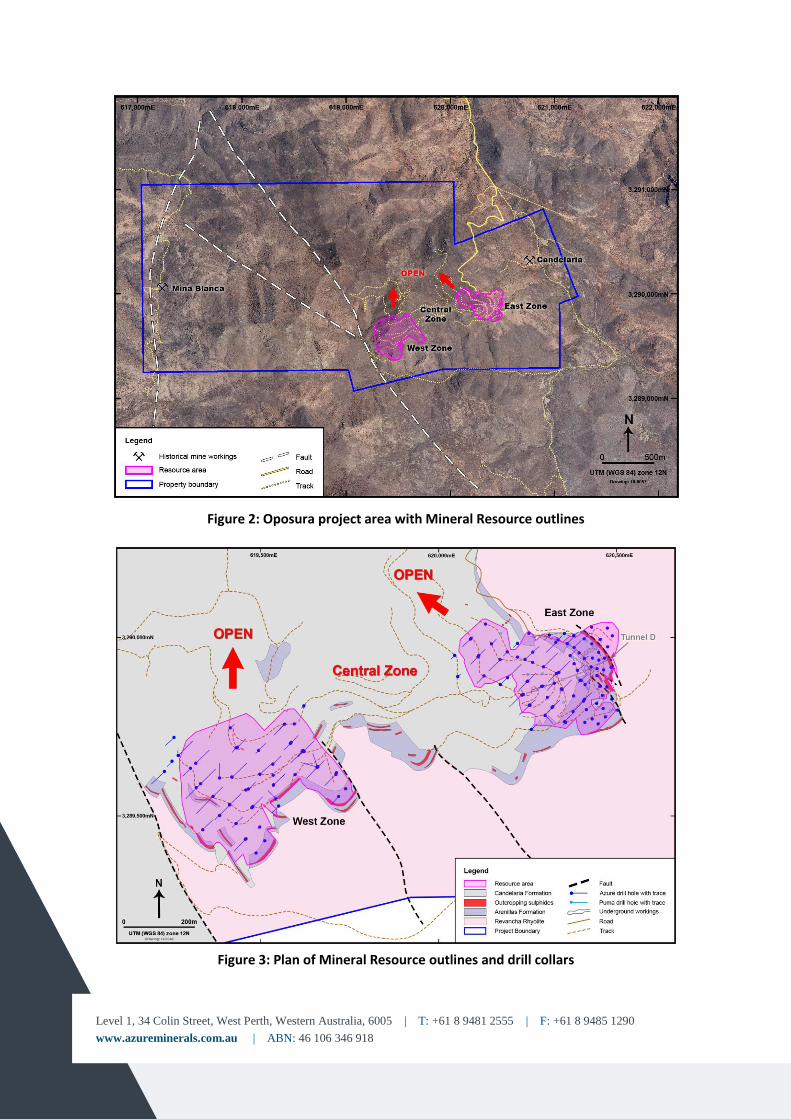
This initial Mineral Resource shows potential for future expansion as the mineralisation remains
open in several directions (see Figures 2 & 3). The most obvious area for increase is the Central Zone,
a 500m-wide zone situated between the East and West Zones. This area has been only lightly tested
by historical drilling and the mineralised horizon is present in several drill holes. Additional upside
potential is also present to the north of the Mineral Resource.
Further drilling is planned in 2018 to upgrade the classification and expand this initial Mineral
Resource, and to explore the wider property.
Figure 1: Location plan showing the Oposura Project and other Azure Minerals’ projects
1 Australasian Code for Reporting of Exploration Results, Mineral Resources and Ore Reserves. The JORC
Code, 2012 Edition. Prepared by: The Joint Ore Reserves Committee of The Australasian Institute of Mining
and Metallurgy, Australian Institute of Geoscientists and Minerals Council of Australia (JORC).
Level 1, 34 Colin Street, West Perth, Western Australia, 6005 | T: +61 8 9481 2555 | F: +61 8 9485 1290
www.azureminerals.com.au | ABN: 46 106 346 918
Tonnes Tonnes Tonnes
ZONE (Mt) Zn (%) Pb (%) Ag (g/t) Zn (kt) Pb (kt) Ag (Moz) (Mt) Zn (%) Pb (%) Ag (g/t) Zn (kt) Pb (kt) Ag (Moz) (Mt) Zn (%) Pb (%) Ag (g/t) Zn (kt) Pb (kt) Ag (Moz)
EAST 0.5 5.0 3.7 19.4 24.8 18.4 0.3 0.5 4.8 2.7 16.7 26.2 14.8 0.3 1.0 4.9 3.2 18.5 51.0 33.2 0.6
WEST 1.6 5.4 2.6 16.5 85.6 42.2 0.8 0.3 3.3 2.1 14.3 9.8 6.3 0.1 1.9 5.0 2.6 16.2 95.4 48.5 1.0
TOTAL 2.1 5.3 2.9 17.2 110.5 60.6 1.2 0.8 4.3 2.5 16.5 36.0 21.1 0.4 2.9 5.0 2.8 17.0 146.4 81.8 1.6
Tonnes Tonnes Tonnes
ZONE (Mt) Zn (%) Pb (%) Ag (g/t) Zn (t) Pb (t) Ag (Moz) (t) Zn (%) Pb (%) Ag (g/t) Zn (t) Pb (t) Ag (Moz) (t) Zn (%) Pb (%) Ag (g/t) Zn (t) Pb (t) Ag (Moz)
EAST 0.5 5.1 3.8 19.6 24.8 18.3 0.3 0.5 4.9 2.8 18.4 25.9 14.6 0.3 1.0 5.0 3.3 19.0 50.7 33.0 0.6
WEST 1.5 5.6 2.7 17.1 85.0 41.7 0.8 0.3 3.6 2.3 15.5 9.4 6.0 0.1 1.8 4.5 2.5 16.2 81.4 45.0 0.9
TOTAL 2.0 5.4 3.0 17.7 109.8 60.0 1.1 0.8 4.5 2.6 17.4 35.3 20.7 0.4 2.8 5.2 2.9 17.6 145.1 80.7 1.6
Tonnes Tonnes Tonnes
ZONE (Mt) Zn (%) Pb (%) Ag (g/t) Zn (t) Pb (t) Ag (Moz) (t) Zn (%) Pb (%) Ag (g/t) Zn (t) Pb (t) Ag (Moz) (t) Zn (%) Pb (%) Ag (g/t) Zn (t) Pb (t) Ag (Moz)
EAST 0.4 5.4 4.0 20.6 24.2 17.9 0.3 0.4 5.7 3.2 21.3 24.5 13.5 0.3 0.9 5.6 3.6 20.9 48.6 31.4 0.6
WEST 1.4 6.1 2.9 18.6 82.6 39.7 0.8 0.2 4.6 2.8 19.0 8.3 5.1 0.1 1.5 5.3 2.9 18.8 82.3 44.4 0.9
TOTAL 1.8 5.9 3.2 19.1 106.7 57.5 1.1 0.6 5.4 3.1 20.6 32.8 18.6 0.4 2.4 5.8 3.2 19.5 139.5 76.2 1.5
TOTAL
Grade Contained Metal
TABLE 4 Oposura Resource Estimate - June 2018 - using a 3.0% Zinc Equivalent Cut-Off Grade
TOTAL
Grade Contained Metal
TOTAL
Grade Contained Metal
TABLE 3 Oposura Resource Estimate - June 2018 - using a 2.0% Zinc Equivalent Cut-Off Grade
INDICATED INFERRED
Grade Contained Metal Grade Contained Metal
INDICATED INFERRED
Grade Contained Metal Grade Contained Metal
TABLE 2 Oposura Resource Estimate - June 2018 - using a 1.5% Zinc Equivalent Cut-Off Grade
INDICATED
Grade Contained Metal
INFERRED
Grade Contained Metal
*Zinc Equivalency % US$:
Equivalent values in US$ are determined by the following factors:
• Zn Eq = ((%Zn x 0.875 x 0.85)+(%Pb x 0.85 x 0.95)+(g/t Ag x 0.67 x 0.70))/(%Zn x 0.875 x 0.85)
• Commodity prices used in this MRE:
Zinc $3,107.50/t, Lead $2,411/t (spot price, LME, 2018. www.lme.com, cited 0:00 GMT 20/06/2018);
Silver $16.20/oz (spot price, NYSE, 2018. www.kitco.com, cited 0:00 GMT 20/06/2018)
• Concentrate recoveries used in this MRE: Zn 87.5%, Pb 85%, Ag 67% (Locked Cycle and Batch Flotation tests: Azure Minerals Ltd, 2018.)
• Smelter recoveries used in this MRE : Zn 85%, Pb 95%, Ag 70% (International Benchmarks: Azure Minerals Ltd, 2018)
• It is the opinion of Azure Minerals Ltd that all the elements included in the calculation have a reasonable potential to be recovered and sold
Level 1, 34 Colin Street, West Perth, Western Australia, 6005 | T: +61 8 9481 2555 | F: +61 8 9485 1290
www.azureminerals.com.au | ABN: 46 106 346 918
Figure 2: Oposura project area with Mineral Resource outlines
Figure 3: Plan of Mineral Resource outlines and drill collars
Level 1, 34 Colin Street, West Perth, Western Australia, 6005 | T: +61 8 9481 2555 | F: +61 8 9485 1290
www.azureminerals.com.au | ABN: 46 106 346 918
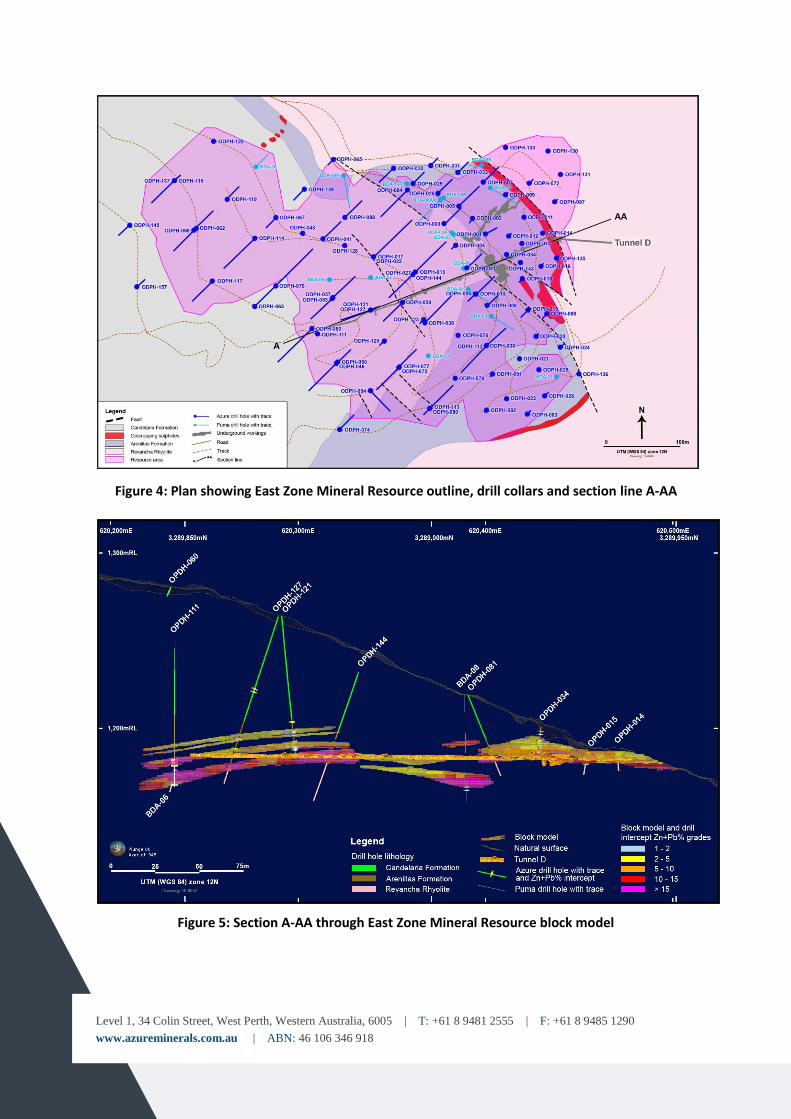
Figure 4: Plan showing East Zone Mineral Resource outline, drill collars and section line A-AA
Figure 5: Section A-AA through East Zone Mineral Resource block model
Level 1, 34 Colin Street, West Perth, Western Australia, 6005 | T: +61 8 9481 2555 | F: +61 8 9485 1290
www.azureminerals.com.au | ABN: 46 106 346 918
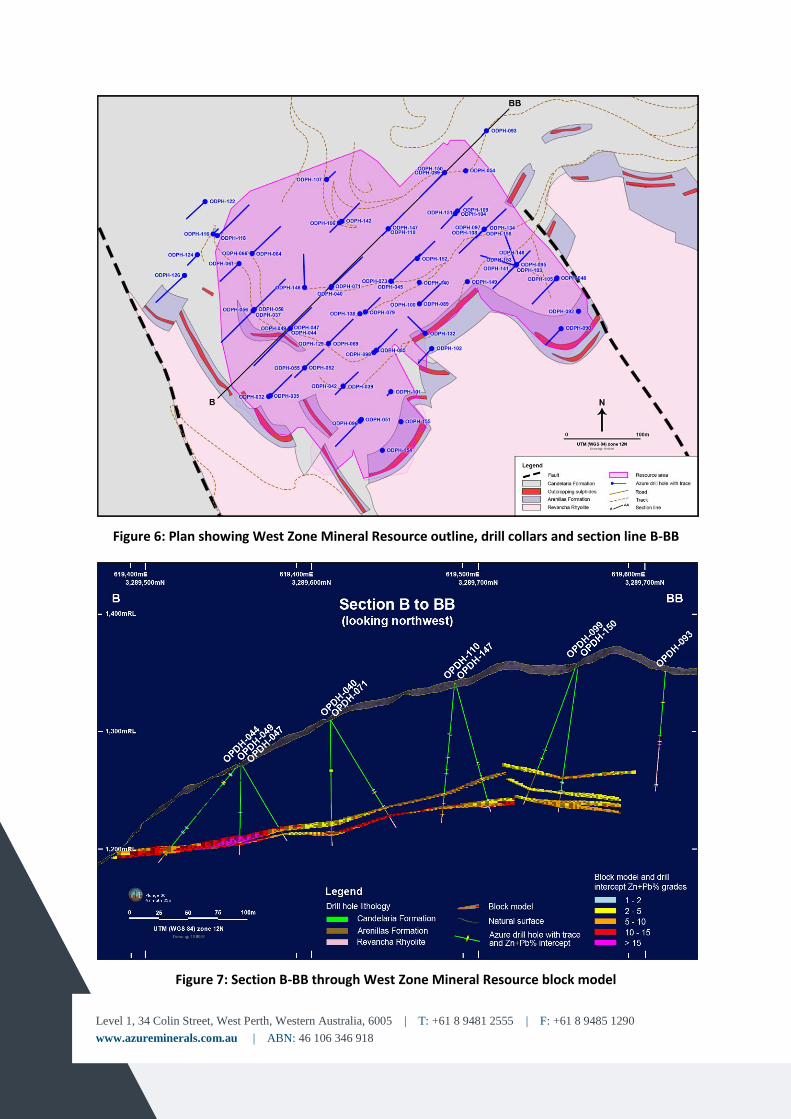
Figure 6: Plan showing West Zone Mineral Resource outline, drill collars and section line B-BB
Figure 7: Section B-BB through West Zone Mineral Resource block model
Level 1, 34 Colin Street, West Perth, Western Australia, 6005 | T: +61 8 9481 2555 | F: +61 8 9485 1290
www.azureminerals.com.au | ABN: 46 106 346 918
OPOSURA MINERAL RESOURCE ESTIMATE
The Oposura Mineral Resource estimate (MRE) has been prepared in accordance with the
requirements and guidelines of the JORC Code (2012) and is detailed in the JORC Code summary
tables appended to this release.
Mr Alex Whishaw, Senior Resource Geologist at CSA Global in Perth, Western Australia has prepared
the Mineral Resource estimate under the direct supervision of Dr Matthew Cobb. Dr Cobb is a
Principal Resource Geologist at CSA Global in Perth, Western Australia, and qualifies as an MRE
Competent Person, as defined under the JORC Code.
Geological Setting
Oposura is hosted by the Cretaceous-age Mesa Formation, a volcano-sedimentary sequence that extends across northern Mexico.
At Oposura, the host lithology is a felsic volcano-sedimentary sequence. Mineralisation predominantly occurs within the Arenillas Formation, a mixed unit of volcanic tuffs and limestone intervals sandwiched between two volcanic welded tuff units. The footwall unit is the Revancha Rhyolite and the hangingwall unit is the Candelaria Formation.
Based on the observed alteration mineralogy, Oposura fits the characteristics of a distal skarn, carbonate replacement style deposit, with skarn alteration and sulphide mineralisation replacing limestone horizons within the Arenillas Formation.
Mineralisation comprises zinc, lead and silver-bearing sulphides and iron sulphides (pyrite) occurring
as massive to semi-massive stratabound lenses that replace limestone horizons in the sedimentary
sequence. Higher grade zinc and lead mineralisation is correlated with elevated silver
concentrations. The most extensive mineralised horizon replaces a well-developed, clean, massive to
laminated limestone unit near the base of the Arenillas Formation. Extensive skarn alteration of
limestone and of calcareous volcanoclastic sedimentary rocks is associated with the sulphide
mineralisation and is characterised by manganese-rich calc-silicate minerals with strong, late-stage
retrogression.
Massive sulphide mineralisation commences at surface with little evidence of oxidation or
weathering.
Dimensions and Geometry
The mineralised horizon crops out discontinuously over approximately two kilometres on the
eastern, southern and western slopes of the Oposura mountain (see Figures 3, 4 & 6) and displays
sub-horizontal to shallow dips (refer Figures 5 & 7). Mineral Resource definition drilling defined two
separate mineralised zones - East Zone and West Zone.
The sub-horizontal dip of the mineralised zones results in vertical thickness being very similar to true
thickness. The vertical thicknesses of individual sulphide mineralisation lenses average 7m in East
Zone and 3m in West Zone, with maximum vertical thicknesses of 20m in East Zone and 10m in West
Zone (see Figures 5 and 7). The mineralised zones demonstrate good internal continuity of zinc, lead
and silver grades appropriate to the Mineral Resource classifications.
Drilling confirmed that the zinc, lead and silver mineralisation within East Zone extends for
approximately 475m (north-south) and 375m (east-west) along the eastern slope of the Oposura

Level 1, 34 Colin Street, West Perth, Western Australia, 6005 | T: +61 8 9481 2555 | F: +61 8 9485 1290
www.azureminerals.com.au | ABN: 46 106 346 918
mountain. Drilling confirmed that the zinc, lead and silver mineralisation within West Zone extends
for approximately 400m (north-south) and 475m (east-west) along the southern and western slopes
at the western end of the Oposura mountain.
These two Mineral Resource zones are separated by the approximately 500m-wide Central Zone,
which has been only lightly tested by historical drilling undertaken by Anaconda and Peñoles during
the 1960s and 1970s. Several of these historical drill holes intersected zinc and lead sulphide
mineralisation within the Arenillas Formation. Azure is currently planning further drilling to test
Central Zone which, if successful, has the potential to expand the Mineral Resource.
Sampling Details
Mineral Resource definition drilling comprised 173 diamond drill holes (for 11,108.6m of drilling).
Sixteen holes were drilled by the previous owner Puma (982.9m) and 157 holes by Azure
(10,125.7m). Holes ranged from 10.65m to 134.35m deep, with an average depth of 61.21m,
highlighting the shallow nature of the deposit.
Holes were drilled with a variety of azimuths and dips to ensure the mineralised horizon was
intersected on an initial 50m × 50m spacing. Additional drilling to infill the hole spacing to 25m x
25m was undertaken in some areas. For the Mineral Resource, all Puma holes and 141 Azure holes
intersected mineralisation.
Drill core was sawn in half along the core axis using a wet diamond core saw. All samples were
collected from the same side of the core. Duplicate, standard and blank check samples were
anonymously submitted with drill core samples at the rate of approximately one standard, blank or
duplicate in every 10 samples. When a duplicate sample was required, the ½-core sub-sample was
then wet-cut preparing two ¼-core sub-samples for laboratory dispatch, one considered to be the
primary sample, the other a duplicate.
Sample lengths for assay purposes were guided by changes in geology and varied from 0.05m to
3.05m, with an average sample mass of 2.71kg.
Sample Preparation and Assaying
Bureau Veritas Mineral Laboratories (BVL) prepared all the samples from Oposura at their sample
preparation facilities in Hermosillo, Sonora, Mexico. Samples were weighed, assigned a unique bar
code and logged into the laboratory tracking system. Samples were then dried and each sample was
crushed to >70% passing a 2mm screen. A 250g sub-sample was collected for pulverising by ring and
puck to >85% passing sub 75µm. The 250g sample pulps were then dispatched via courier to BVL in
Vancouver, Canada for analysis.
Samples drilled by Puma were analysed by the technique MA200 with 0.25g samples subject to a
four-acid digest followed by multi-element ICP-MS analysis producing results for silver and base
metals. This technique is considered a total digest for all relevant minerals and has a very low
detection limit.
The analytical technique, MA300, was used for all samples drilled by Azure, comprising 0.25g
samples subject to a four-acid digest followed by multi-element ICP-ES analysis producing results for
silver and base metals. This technique is considered a total digest for all relevant minerals.
Level 1, 34 Colin Street, West Perth, Western Australia, 6005 | T: +61 8 9481 2555 | F: +61 8 9485 1290
www.azureminerals.com.au | ABN: 46 106 346 918
Over-limit assays for both Azure and Puma drill samples were re-analysed by:
Method MA370 (0.5g samples digested by 4 acids and analysed by ICP-ES for base metals
grading >1%);
Method GC816 (by Classical Titration for zinc grading >20%);
Method GC817 (by Classical Titration for lead grading >10%);
Method FA530 (by fire assay with gravimetric finish for silver grading >200ppm).
Density
Azure collected a total of 809 density measurements from drill core samples with 120 samples
sourced from within the boundaries of the Mineral Resource and the remainder collected from
within lower-grade and waste zones to provide a good range of material for density determinations.
Each sample was dried and measured for length and diameter. The diameter was measured with
callipers at three points along the length of the core sample and averaged. The volume of the core
sample was calculated and the sample was weighed. Azure calculated the density for the core
samples by dividing the dry weight of the sample by its volume.
A total of 57 of the 809 samples were sent to Bureau Veritas Laboratories in Hermosillo, Mexico for
confirmatory density measurements by immersion of waxed core (method SPG03). The results of
the immersion method were compared to densities calculated by Azure. There was no discernible
difference between the calliper and immersion methods.
A multivariate regression formula from dry bulk density determinations to Zn% and Pb% was
developed for use across the deposit for areas of varying zinc and lead grades. This formula
combined the measured density of samples that were subsequently sent for assay.
The multivariate regression formula was also used to analyse the results of the dense media
separation testwork.
Metallurgical Test Results
Metallurgical testwork on Oposura mineralisation was conducted at Blue Coast Research (BCR)
laboratories in Vancouver, Canada. Metallurgical testwork comprised Dense Media Separation,
staged and locked cycle flotation tests, and physical property tests.
Dense Media Separation (DMS) testwork
In several parts of the Oposura mineralised system, thick mineralised intersections comprise narrow
bands of very high-grade mineralisation separated by intervals of lower grade or waste material.
Azure’s studies indicate that some of these thick mineralised zones may be more suitable to a “bulk”
mining approach rather than “selective” mining, thereby reducing unit operating costs and
maximising resource recovery.
Testwork was undertaken to assess the suitability of DMS technology to upgrade the grade of the
“bulk” mined material by rejecting low grade and waste material while retaining the mineralised
material, ahead of entering the milling circuit. DMS is most effective in upgrading ore when there
are distinct density differences between mineralised material and waste rock, and this is the case at
Oposura.
Level 1, 34 Colin Street, West Perth, Western Australia, 6005 | T: +61 8 9481 2555 | F: +61 8 9485 1290
www.azureminerals.com.au | ABN: 46 106 346 918
DMS testwork was initially conducted on rock samples taken from historical underground mine
workings. DMS testwork was then extended to include tests on individual drill hole intersections of
varying combined zinc and lead grades and zinc to lead grade ratios. These tests were used to
ascertain the density at which the DMS circuit could optimise ore recovery and waste rejection.
Follow-up DMS testwork was then conducted on a bulk master sample averaging 6.4% Zn, 4.2% Pb
and 28.8g/t Ag that was prepared from the drill core of eleven Mineral Resource drill holes. This
testwork showed that an upgrade in both zinc and lead grades of 34% could be achieved with an
overall metal recovery of 95%, while rejecting waste material amounting to approximately 30% of
the mass entering the DMS circuit.
The positive results achieved from this metallurgical testwork demonstrate that crushing, screening
and DMS processing prior to a standard sulphide flotation treatment support the option of utilising
DMS technology at Oposura.
Flotation testwork
Staged flotation testwork was conducted on individual drill hole intersections of varying combined
zinc and lead grades and zinc to lead grade ratios.
Follow-up staged and locked cycle flotation tests were then conducted on the bulk master
composite comprising intersections from several drill holes across the Mineral Resource. The
laboratory split the bulk master composite into several sub-samples to allow multiple batch and
locked cycle flotation tests to be undertaken.
The staged flotation tests conducted on the bulk master composite were used to optimise primary
and secondary grind sizes, flotation times and reagent regimes for the separate zinc and lead
concentrates. A locked cycle test was then conducted on the bulk master composite to more closely
simulate a continuously operating flotation circuit.
The result of the locked cycle test was a zinc concentrate grading 57.2% Zn with a zinc recovery of
85.6% and a lead concentrate grading 61.4% Pb at a lead recovery of 84.0%. Silver recovery to the
lead concentrate was 67.1% Ag at a concentrate grade of 323.8 g/t Ag (10.4 oz/t Ag).
Both the zinc and the lead concentrate grades achieved in the locked cycle test were above the
typical industry benchmark grades quoted respectively for zinc and lead concentrates of 53% zinc
and 60% lead. A regression line from the batch locked cycle test results back to the benchmark
concentrate grades was calculated to interpolate the zinc and lead recoveries. A zinc recovery of
87.5% was interpolated at the benchmark concentrate grade of 53% zinc and a lead recovery of 85%
was interpolated at the benchmark concentrate grade of 60% lead.
Multi-element assays were conducted on the separate zinc and lead concentrates produced from
the locked cycle test conducted on the bulk master composite. These assays indicated that
deleterious elements were not present at levels that would cause concern or penalties from
smelters.
The testwork successfully demonstrated that clean, commercial grade concentrates could be
produced at high metallurgical recoveries and thereby has eliminated a potential major project risk.
Physical Properties testwork
Level 1, 34 Colin Street, West Perth, Western Australia, 6005 | T: +61 8 9481 2555 | F: +61 8 9485 1290
www.azureminerals.com.au | ABN: 46 106 346 918
Physical properties testwork comprised the establishment of crushing, grinding and abrasion indices.
The crusher and ball mill work indices are a measure of the amount of power required respectively
to crush and grind mineralisation and are quoted in kilowatt hours per tonne (kWhr/t). The higher
the number, the more power that is required to crush and grind the mineralisation prior to flotation.
The abrasion index is a measure of weight loss of metal when in contact with mineralisation. It is
used to select materials for items such as mill liners and chutes and to determine how often these
items need to be replaced based on wear rates.
All three of the indices are within the typical range of expected values for mining projects, and
power requirements and wear rates are not expected to be out of the ordinary.
Mining
The overall geometry of East Zone and West Zone Mineral Resources is favourable for potential
extraction using a combination of conventional open pit and underground mining techniques. This
geometry also allows the resources to be easily be accessed from surface, providing exceptional
mine scheduling flexibility.
East Zone and West Zone resources crop out at surface in both zones. The extremities of both
resource zones could be accessed by a maximum of 200m (East Zone) and 250m (West Zone) of
lateral underground mine development. This mine development could be undertaken within
mineralisation due to the overall shallow dipping nature of the mineralised horizon. Mining could be
undertaken contemporaneously by open pit and underground methods in both East Zone and West
Zone.
The Mineral Resources include distinct areas of higher grade mineralisation that could be scheduled
to suit economic circumstances and/or product marketing options.
Oposura mountain slopes at approximately 20 to 25 degrees in the vicinity of East Zone and at
approximately 30 to 40 degrees in the vicinity of West Zone. Near surface mineralisation would be
amenable to open pit techniques in both East and West Zones. Fresh rock commences at or very
close to surface. An historical small-scale open pit was mined at the East Zone. Surveys undertaken
in 2017 show this open pit to be approximately 30m in length, with a bench height of approximately
12m and a pit wall angle of approximately 60 degrees.
The maximum depths below surface of the Mineral Resources are approximately 120m (East Zone)
and 140m (West Zone). Maximum vertical capital development for ventilation and emergency egress
would be limited to these depths. The in-situ rock stress is expected to be low corresponding to the
shallow depth of the resources below surface. An historical underground level drive, Tunnel D, in
East Zone has a maximum depth below surface of approximately 100 metres. The backs and walls of
this level drive are in good condition and have limited ground support.
Historical development drives and room and pillar stopes remain intact and accessible. These stopes
were surveyed in 2017 using digital laser techniques. The extraction ratio of the historical room and
pillar stopes was measured to be 95%. A room and pillar underground mining method is considered
appropriate due to the geometry of the resources.
The sub-horizontal dip of the mineralised zones results in vertical thickness being very similar to true
thickness. The vertical thicknesses of individual sulphide mineralisation lenses average 7m in East
Level 1, 34 Colin Street, West Perth, Western Australia, 6005 | T: +61 8 9481 2555 | F: +61 8 9485 1290
www.azureminerals.com.au | ABN: 46 106 346 918
Zone and 3m in West Zone, with maximum vertical thicknesses of 20m in East Zone and 10m in West
Zone. These thicknesses would make both resource zones amenable to modern mechanised open
piand underground mining techniques.
The historical workings are located at or below the lowest resource elevation and show no signs of
groundwater ingress. Groundwater ingress is not expected to adversely affect potential mining
development or stoping.
Infrastructure
The Oposura project area is located approximately 150km from the capital of the state of Sonora,
Hermosillo (population of approximately one million) and is accessed from Hermosillo via a two-lane
bitumen highway (National Highway 14).
The nearest bulk commodity export facility is located at the Port of Guaymas. Guaymas is located
approximately 330km by road via Hermosillo from the Oposura project. A four-lane concrete
highway (National Highway 15) exists between Hermosillo and the Port of Guaymas. Bulk mineral
concentrates are currently exported through the Port of Guaymas by several mining companies
including Grupo Mexico, BHP Billiton and Freeport McMoran.
A power supply option study undertaken in 2018 showed that power for the project could be
obtained from either 230kV or 32kV high voltage transmission lines that pass within 10 kilometres of
the project.
Wireless voice and high-speed data communication currently exists at the project site via line of
sight to a communications tower located in the nearby town of Moctezuma (population 5,000).
Hydrological studies completed in 2018 identified potential aquifers within the mining concessions.
Two bores located on a privately-owned ranch in the Moctezuma river valley were pumped tested as
part of the study. Based on the pump test results, the average flow from each of these bores is
approximately one million cubic metres (tonnes) of water per annum, which is considered sufficient
for a project corresponding to the scale of the Mineral Resources.
Surface rights agreements are in place with the owners of the two private ranches that cover the
project area and mineral concessions. The surface rights agreement areas are expected to be
sufficient for locating access roads, infrastructure, mining works, process plant and tailings facility
required for a project corresponding to the scale of the Mineral Resources.
Environment
The project area is covered by two privately-owned cattle ranches and surface access rights
agreements are in place with both owners.
The previous owners of the Oposura project, Puma, applied for and received environmental
approval for the clearance of a surface area of up to 5 hectares for the development of a small-scale
mine, process plant and tailings facility for Oposura. This environmental approval has been
transferred from Puma to Minera Piedra Azul SA de CV (a wholly-owned subsidiary of Azure).
Environmental surveys and studies over the Oposura project area were independently conducted in
2017 and 2018. These surveys indicate that there are no flora or fauna impediments to potential
development of the project.
Level 1, 34 Colin Street, West Perth, Western Australia, 6005 | T: +61 8 9481 2555 | F: +61 8 9485 1290
www.azureminerals.com.au | ABN: 46 106 346 918
Geological Estimation Domains
For the Mineral Resource estimation control, four mineralisation domains and four low-grade halo
(non-Mineral Resource) domains were identified for East Zone, while for West Zone five
mineralisation and five low-grade halo (non-Mineral Resource) domains were grouped into two
statistical domains based on statistical and geometric similarities. The domains were identified by
geological and spatial continuity, as grade-boundary analysis of zinc, lead and combined zinc + lead
showed continuous distributions. The volumes of the domains were modelled using conventional
sectional interpretation followed by digital wireframing methods. The wireframe models were
reviewed and accepted by Azure and then used to code a digital block model as follows:
Mineralisation: defined using a combined nominal ≥ 1.5% Zn%+Pb% grade cut-off.
Low grade halos (not reportable as Mineral Resources): defined as being any coherent zones
enveloping the mineralisation wireframes below the mineralisation modelling cut-off. This
allows a more robust measure of dilution around the mineralisation for mine studies.
Sub-blocks were included in the block model to closely match the estimation domain boundaries and
the topographic surface and provide adequate resolution on volumes.
Domains were estimated using composites from each estimation domain. For East Zone, the semi-
variogram models from the same domain were used, for West Zone, the semi-variogram model from
the statistical domain grouping was used.
Estimation and Validation Methodology
Quantitative Kriging Neighbourhood Analysis was undertaken using SupervisorTM V8.8 software to
assess the effect of changing key Kriging neighbourhood parameters on block grade estimates.
Kriging Efficiency and Slope of Regression were reviewed for a range of block sizes, minimum and
maximum samples, search dimensions and discretisation grids.
Ordinary Kriging (OK) was adopted to interpolate grades into cells for the mineralised domains and
low-grade halo domains around the mineralisation, inside which the composites for the high-grade
domain were removed.
The block size appropriately reflects the dual open-pit and underground scenarios, and the drill hole
spacing, which varies from 25m – 50m sections along strike. Intra-section pierce points are evenly
spaced in predominance and vary from 10m – 25m in the eastern parts of East Zone, to 40m – 60m
in other parts of East Zone and West Zone.
The estimate employed a four-pass search strategy to improve the local grade estimate. The first
pass was equal to 2/3 the range of the largest variogram model structure for each variable in each
domain, honouring the anisotropic ratios orthogonally. The second pass equated to 100% of the
ranges, the third 150% and the fourth 200%. Following the fourth estimation pass, the Sichel mean
of the composite within the statistical domain was assigned for Zn%, Pb% and Ag g/t for each
domain. The mean was assigned for blocks with unestimated sulphur grades.
All geological modelling and grade estimation was undertaken using SurpacTM V6.6 software.
Level 1, 34 Colin Street, West Perth, Western Australia, 6005 | T: +61 8 9481 2555 | F: +61 8 9485 1290
www.azureminerals.com.au | ABN: 46 106 346 918
Reporting Cut-off Grade
The Mineral Resources were reporting above a 1.5% zinc equivalent (ZnEq) grade based upon
benchmark Mexico mining and processing costs for the proposed scale of operations, current
metallurgical testwork, international benchmark smelting and refining charges, and metal pricing as
at the end of May, 2018.
More details are given in the JORC Table 1 Section 3 appended to this ASX release.
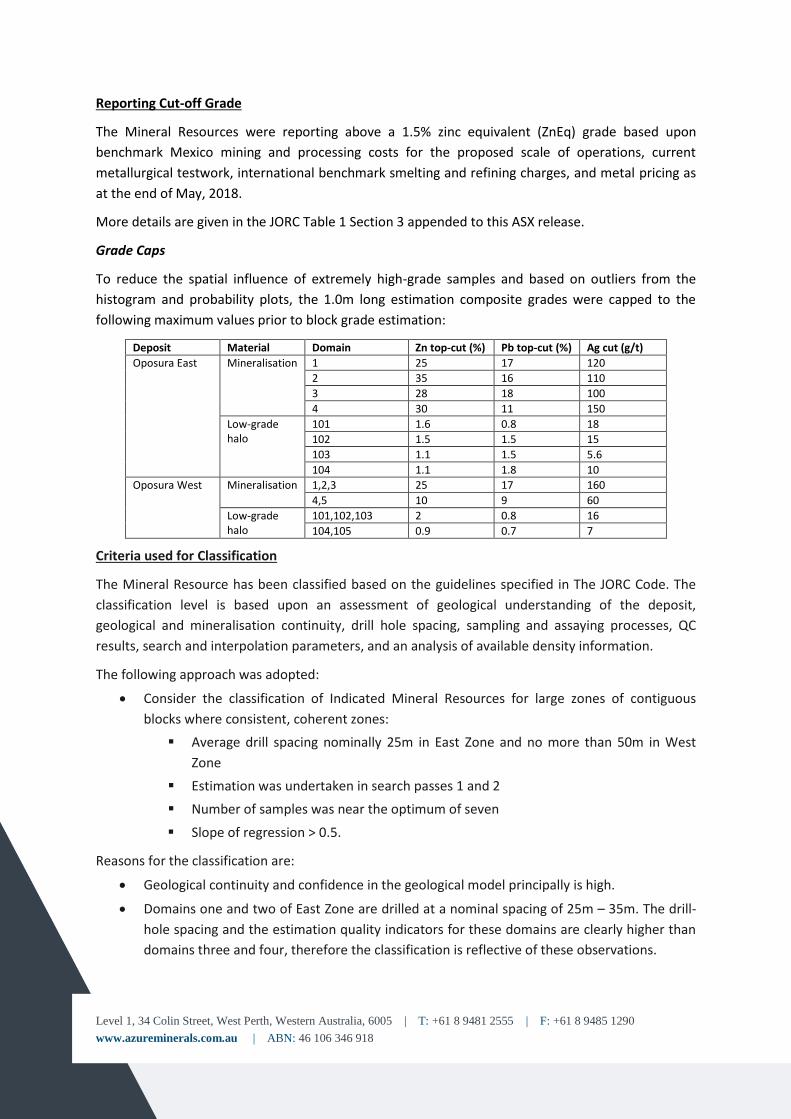
Grade Caps
To reduce the spatial influence of extremely high-grade samples and based on outliers from the
histogram and probability plots, the 1.0m long estimation composite grades were capped to the
following maximum values prior to block grade estimation:
Deposit Material Domain Zn top-cut (%) Pb top-cut (%) Ag cut (g/t)
Oposura East Mineralisation 1 25 17 120
2 35 16 110
3 28 18 100
4 30 11 150
Low-grade halo
101 1.6 0.8 18
102 1.5 1.5 15
103 1.1 1.5 5.6
104 1.1 1.8 10
Oposura West Mineralisation 1,2,3 25 17 160
4,5 10 9 60
Low-grade halo
101,102,103 2 0.8 16
104,105 0.9 0.7 7
Criteria used for Classification
The Mineral Resource has been classified based on the guidelines specified in The JORC Code. The
classification level is based upon an assessment of geological understanding of the deposit,
geological and mineralisation continuity, drill hole spacing, sampling and assaying processes, QC
results, search and interpolation parameters, and an analysis of available density information.
The following approach was adopted:
Consider the classification of Indicated Mineral Resources for large zones of contiguous
blocks where consistent, coherent zones:
Average drill spacing nominally 25m in East Zone and no more than 50m in West
Zone
Estimation was undertaken in search passes 1 and 2
Number of samples was near the optimum of seven
Slope of regression > 0.5.
Reasons for the classification are:
Geological continuity and confidence in the geological model principally is high.
Domains one and two of East Zone are drilled at a nominal spacing of 25m – 35m. The drill-
hole spacing and the estimation quality indicators for these domains are clearly higher than
domains three and four, therefore the classification is reflective of these observations.
Level 1, 34 Colin Street, West Perth, Western Australia, 6005 | T: +61 8 9481 2555 | F: +61 8 9485 1290
www.azureminerals.com.au | ABN: 46 106 346 918
Although thickening and higher-grades close to fault zones is evident, particularly in East
Zone, coverage of drilling generally reduces the impact of uncertainty on both grades and
thickness.
However, along the eastern margin of domain four of East Zone, the substantially thicker
fault-proximal mineralisation and higher grades causes uncertainty regarding the estimate
for this area and the domain generally. Therefore, despite tighter drill-spacing for this area
of domain four than the rest of the domain, this uncertainty is reflected in an Inferred
Mineral Resource classification.
Fault thickening was less evident for West Zone, therefore the assessment of geological
continuity for classification was simpler.
Modifying Factor Assumptions
In terms of key modifying factors, it has been assumed that the deposit could be exploited by
conventional truck and shovel open pit mining and by conventional mechanised underground room
and pillar mining, with ore processed by conventional flotation processes after crushing, dense
media separation and milling and with the metallurgical recoveries indicated by preliminary
metallurgical test results. Using these assumptions and current commodity prices for zinc, lead and
silver, a block reporting cut-off grade of 1.5% Zinc Equivalent was selected as a reasonable basis for
reporting the Mineral Resource.
Given the long history of mining in the Sonora region of Mexico, and that there is a current
environmental approval in place for a small-scale mining and processing operation at Oposura, the
Company believes there are reasonable expectations that a mine and processing operation
corresponding to the scale of the Mineral Resource could be developed should (or when) future
studies result in the definition of an Ore Reserve.
BACKGROUND
The Mineral Resource estimate for the East and West Zones of the Oposura deposit is located wholly
within the ‘Oposura’ project area which comprises 10 mineral concessions. These concessions are
100% owned by a Mexican entity named Minera Piedra Azul SA de CV (MPA), which is a wholly-
owned subsidiary of Azure Minerals Limited (Azure).
On 11 August 2017, MPA executed an agreement with Grupo Minero Puma SA de CV (Puma)
whereby MPA agreed to acquire 100% ownership of the Oposura concessions by paying Puma
US$1,500,000 and with Puma retaining a residual Net Smelter Return royalty (NSR) of 2.5%.
MPA has paid to Puma the US$1,500,000 in consideration for the acquisition of the Oposura Project
and has entered into a royalty agreement with Puma covering Puma’s retained 2.5% NSR royalty.
Azure has now acquired 100% legal and beneficial interest in the Oposura project.
-ENDS-
For further information, please contact:
Tony Rovira Managing Director Azure Minerals Limited Ph: +61 8 9481 2555
Media & Investor Relations Michael Weir / Cameron Gilenko Citadel-MAGNUS Ph: +61 8 6160 4903
or visit www.azureminerals.com.au
Level 1, 34 Colin Street, West Perth, Western Australia, 6005 | T: +61 8 9481 2555 | F: +61 8 9485 1290
www.azureminerals.com.au | ABN: 46 106 346 918
Competent Person Statement:
Information in this document that relates to Sampling Techniques and Data, and Reporting of Exploration
Results (sections 1 and 2 of Table 1 of the JORC Code) for the Oposura East and West deposit Mineral Resource
estimates is based on information compiled by Dr Neal Reynolds, who is a Member of the Australian Institute of
Geoscientists. Dr Reynolds is employed as a Principal Geologist and Director and is a full-time employee of CSA
Global Pty Ltd.
Information in this document that relates to Estimation and Reporting of Mineral Resources (section 3 of Table
1 of the JORC Code) for the Oposura East and West deposit Mineral Resource estimates is based on information
compiled by Dr Matthew Cobb, who is a Member of both the Australian Institute of Geoscientists and the
Australasian Institute of Mining and Metallurgy. Dr Cobb is employed as a Principal Geologist and is a full-time
employee of CSA Global.
Dr Reynolds and Dr Cobb have sufficient experience which is relevant to the style of mineralisation and type of
deposit under consideration and to the activity being undertaken to qualify as Competent Persons as defined in
the 2012 Edition of the ‘Australasian Code for Reporting of Exploration Results, Mineral Resources and Ore
Reserves’.
Dr Reynolds and Dr Cobb consent to the inclusion in the report of the matters based on their information in the
form and context in which it appears.
Level 1, 34 Colin Street, West Perth, Western Australia, 6005 | T: +61 8 9481 2555 | F: +61 8 9485 1290
www.azureminerals.com.au | ABN: 46 106 346 918
Appendix 1: JORC Table 1
JORC Table 1 Section 1 – Sampling Techniques and Data – Key Classification Criteria
Criteria JORC Code explanation Commentary
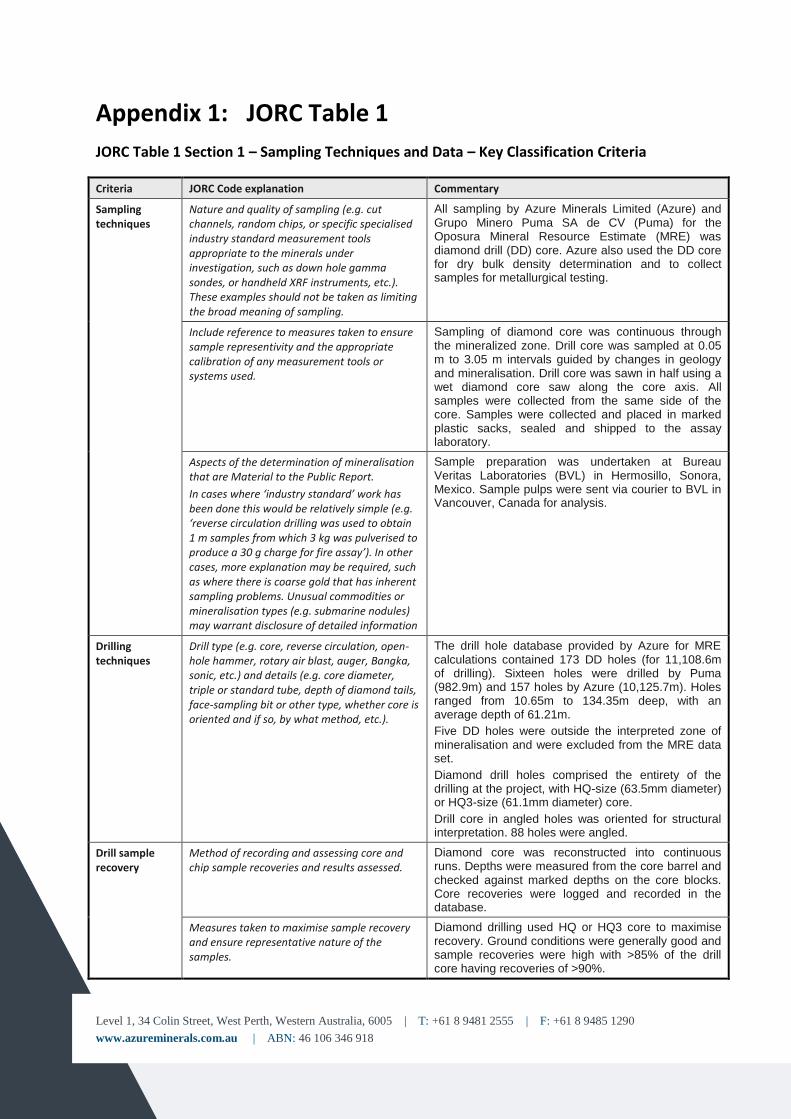
Sampling techniques
Nature and quality of sampling (e.g. cut channels, random chips, or specific specialised industry standard measurement tools appropriate to the minerals under investigation, such as down hole gamma sondes, or handheld XRF instruments, etc.). These examples should not be taken as limiting the broad meaning of sampling.
All sampling by Azure Minerals Limited (Azure) and Grupo Minero Puma SA de CV (Puma) for the Oposura Mineral Resource Estimate (MRE) was diamond drill (DD) core. Azure also used the DD core for dry bulk density determination and to collect samples for metallurgical testing.
Include reference to measures taken to ensure sample representivity and the appropriate calibration of any measurement tools or systems used.
Sampling of diamond core was continuous through the mineralized zone. Drill core was sampled at 0.05 m to 3.05 m intervals guided by changes in geology and mineralisation. Drill core was sawn in half using a wet diamond core saw along the core axis. All samples were collected from the same side of the core. Samples were collected and placed in marked plastic sacks, sealed and shipped to the assay laboratory.
Aspects of the determination of mineralisation that are Material to the Public Report.
In cases where ‘industry standard’ work has been done this would be relatively simple (e.g. ‘reverse circulation drilling was used to obtain 1 m samples from which 3 kg was pulverised to produce a 30 g charge for fire assay’). In other cases, more explanation may be required, such as where there is coarse gold that has inherent sampling problems. Unusual commodities or mineralisation types (e.g. submarine nodules) may warrant disclosure of detailed information
Sample preparation was undertaken at Bureau Veritas Laboratories (BVL) in Hermosillo, Sonora, Mexico. Sample pulps were sent via courier to BVL in Vancouver, Canada for analysis.
Drilling techniques
Drill type (e.g. core, reverse circulation, open-hole hammer, rotary air blast, auger, Bangka, sonic, etc.) and details (e.g. core diameter, triple or standard tube, depth of diamond tails, face-sampling bit or other type, whether core is oriented and if so, by what method, etc.).
The drill hole database provided by Azure for MRE calculations contained 173 DD holes (for 11,108.6m of drilling). Sixteen holes were drilled by Puma (982.9m) and 157 holes by Azure (10,125.7m). Holes ranged from 10.65m to 134.35m deep, with an average depth of 61.21m.
Five DD holes were outside the interpreted zone of mineralisation and were excluded from the MRE data set.
Diamond drill holes comprised the entirety of the drilling at the project, with HQ-size (63.5mm diameter) or HQ3-size (61.1mm diameter) core.
Drill core in angled holes was oriented for structural interpretation. 88 holes were angled.
Drill sample recovery
Method of recording and assessing core and chip sample recoveries and results assessed.
Diamond core was reconstructed into continuous runs. Depths were measured from the core barrel and checked against marked depths on the core blocks. Core recoveries were logged and recorded in the database.
Measures taken to maximise sample recovery and ensure representative nature of the samples.
Diamond drilling used HQ or HQ3 core to maximise recovery. Ground conditions were generally good and sample recoveries were high with >85% of the drill core having recoveries of >90%.
Level 1, 34 Colin Street, West Perth, Western Australia, 6005 | T: +61 8 9481 2555 | F: +61 8 9485 1290
www.azureminerals.com.au | ABN: 46 106 346 918
Criteria JORC Code explanation Commentary
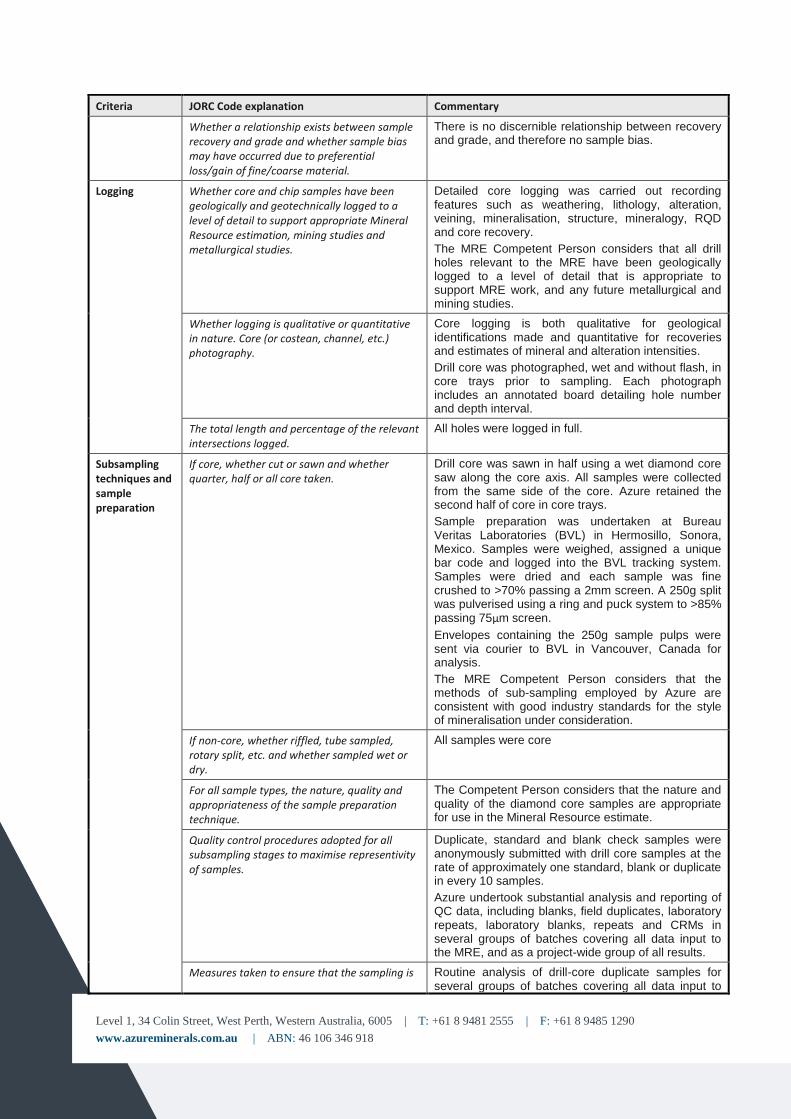
Whether a relationship exists between sample recovery and grade and whether sample bias may have occurred due to preferential loss/gain of fine/coarse material.
There is no discernible relationship between recovery and grade, and therefore no sample bias.
Logging Whether core and chip samples have been geologically and geotechnically logged to a level of detail to support appropriate Mineral Resource estimation, mining studies and metallurgical studies.
Detailed core logging was carried out recording features such as weathering, lithology, alteration, veining, mineralisation, structure, mineralogy, RQD and core recovery.
The MRE Competent Person considers that all drill holes relevant to the MRE have been geologically logged to a level of detail that is appropriate to support MRE work, and any future metallurgical and mining studies.
Whether logging is qualitative or quantitative in nature. Core (or costean, channel, etc.) photography.
Core logging is both qualitative for geological identifications made and quantitative for recoveries and estimates of mineral and alteration intensities.
Drill core was photographed, wet and without flash, in core trays prior to sampling. Each photograph includes an annotated board detailing hole number and depth interval.
The total length and percentage of the relevant intersections logged.
All holes were logged in full.
Subsampling techniques and sample preparation
If core, whether cut or sawn and whether quarter, half or all core taken.
Drill core was sawn in half using a wet diamond core saw along the core axis. All samples were collected from the same side of the core. Azure retained the second half of core in core trays.
Sample preparation was undertaken at Bureau Veritas Laboratories (BVL) in Hermosillo, Sonora, Mexico. Samples were weighed, assigned a unique bar code and logged into the BVL tracking system. Samples were dried and each sample was fine crushed to >70% passing a 2mm screen. A 250g split was pulverised using a ring and puck system to >85% passing 75µm screen.
Envelopes containing the 250g sample pulps were sent via courier to BVL in Vancouver, Canada for analysis.
The MRE Competent Person considers that the methods of sub-sampling employed by Azure are consistent with good industry standards for the style of mineralisation under consideration.
If non-core, whether riffled, tube sampled, rotary split, etc. and whether sampled wet or dry.
All samples were core
For all sample types, the nature, quality and appropriateness of the sample preparation technique.
The Competent Person considers that the nature and quality of the diamond core samples are appropriate for use in the Mineral Resource estimate.
Quality control procedures adopted for all subsampling stages to maximise representivity of samples.
Duplicate, standard and blank check samples were anonymously submitted with drill core samples at the rate of approximately one standard, blank or duplicate in every 10 samples.
Azure undertook substantial analysis and reporting of QC data, including blanks, field duplicates, laboratory repeats, laboratory blanks, repeats and CRMs in several groups of batches covering all data input to the MRE, and as a project-wide group of all results.
Measures taken to ensure that the sampling is Routine analysis of drill-core duplicate samples for several groups of batches covering all data input to
Level 1, 34 Colin Street, West Perth, Western Australia, 6005 | T: +61 8 9481 2555 | F: +61 8 9485 1290
www.azureminerals.com.au | ABN: 46 106 346 918
Criteria JORC Code explanation Commentary
representative of the in-situ material collected, including for instance results for field duplicate/second-half sampling.
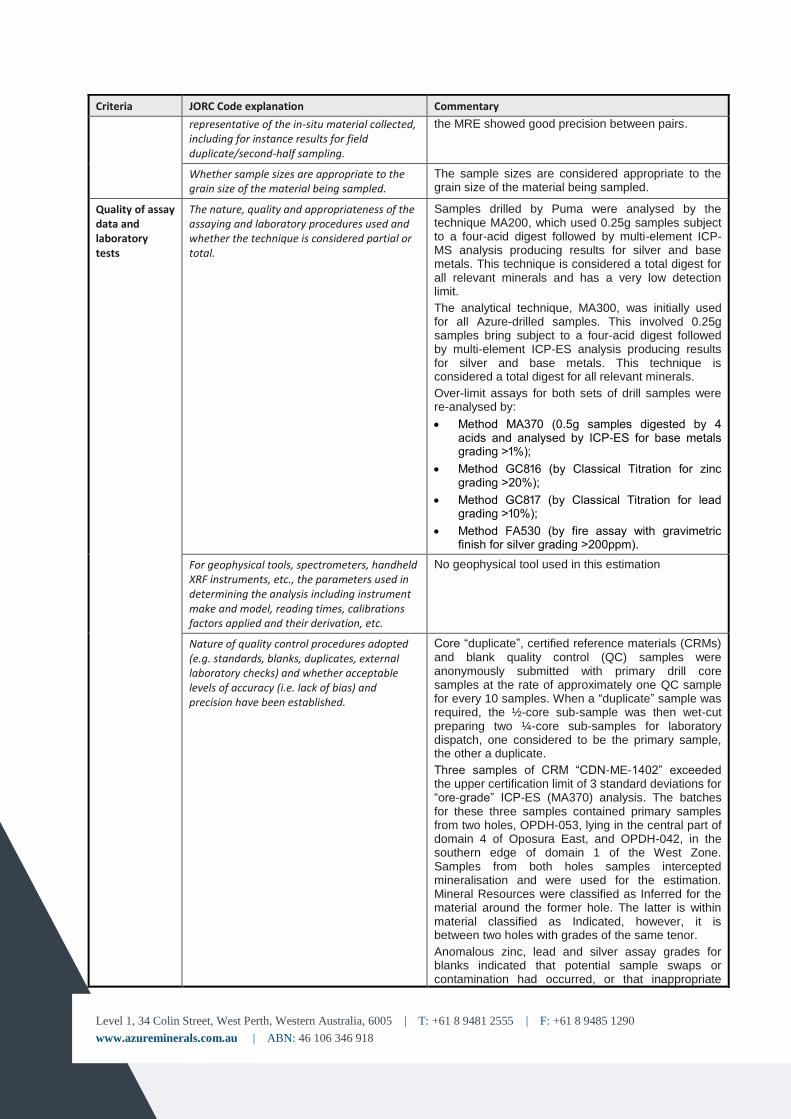
the MRE showed good precision between pairs.
Whether sample sizes are appropriate to the grain size of the material being sampled.
The sample sizes are considered appropriate to the grain size of the material being sampled.
Quality of assay data and laboratory tests
The nature, quality and appropriateness of the assaying and laboratory procedures used and whether the technique is considered partial or total.
Samples drilled by Puma were analysed by the technique MA200, which used 0.25g samples subject to a four-acid digest followed by multi-element ICP-MS analysis producing results for silver and base metals. This technique is considered a total digest for all relevant minerals and has a very low detection limit.
The analytical technique, MA300, was initially used for all Azure-drilled samples. This involved 0.25g samples bring subject to a four-acid digest followed by multi-element ICP-ES analysis producing results for silver and base metals. This technique is considered a total digest for all relevant minerals.
Over-limit assays for both sets of drill samples were re-analysed by:
Method MA370 (0.5g samples digested by 4 acids and analysed by ICP-ES for base metals grading >1%);
Method GC816 (by Classical Titration for zinc grading >20%);
Method GC817 (by Classical Titration for lead grading >10%);
Method FA530 (by fire assay with gravimetric finish for silver grading >200ppm).
For geophysical tools, spectrometers, handheld XRF instruments, etc., the parameters used in determining the analysis including instrument make and model, reading times, calibrations factors applied and their derivation, etc.
No geophysical tool used in this estimation
Nature of quality control procedures adopted (e.g. standards, blanks, duplicates, external laboratory checks) and whether acceptable levels of accuracy (i.e. lack of bias) and precision have been established.
Core “duplicate”, certified reference materials (CRMs) and blank quality control (QC) samples were anonymously submitted with primary drill core samples at the rate of approximately one QC sample for every 10 samples. When a “duplicate” sample was required, the ½-core sub-sample was then wet-cut preparing two ¼-core sub-samples for laboratory dispatch, one considered to be the primary sample, the other a duplicate.
Three samples of CRM “CDN-ME-1402” exceeded the upper certification limit of 3 standard deviations for “ore-grade” ICP-ES (MA370) analysis. The batches for these three samples contained primary samples from two holes, OPDH-053, lying in the central part of domain 4 of Oposura East, and OPDH-042, in the southern edge of domain 1 of the West Zone. Samples from both holes samples intercepted mineralisation and were used for the estimation. Mineral Resources were classified as Inferred for the material around the former hole. The latter is within material classified as Indicated, however, it is between two holes with grades of the same tenor.
Anomalous zinc, lead and silver assay grades for blanks indicated that potential sample swaps or contamination had occurred, or that inappropriate
Level 1, 34 Colin Street, West Perth, Western Australia, 6005 | T: +61 8 9481 2555 | F: +61 8 9485 1290
www.azureminerals.com.au | ABN: 46 106 346 918
Criteria JORC Code explanation Commentary
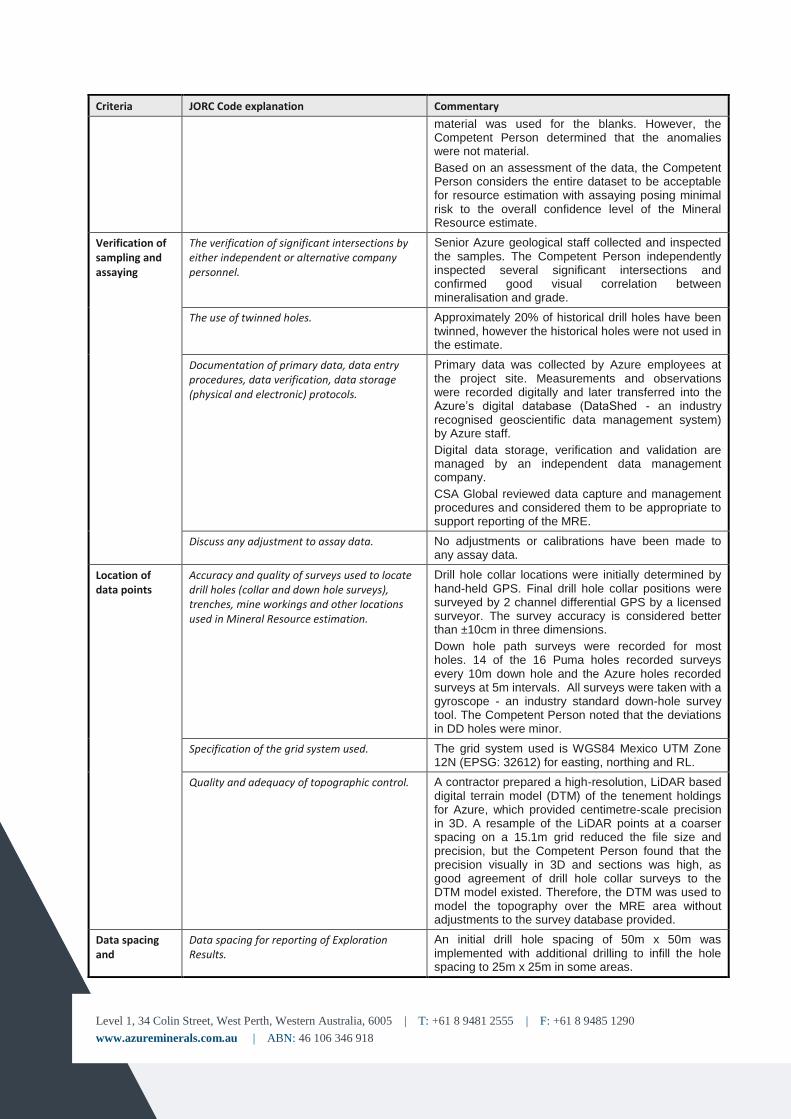
material was used for the blanks. However, the Competent Person determined that the anomalies were not material.
Based on an assessment of the data, the Competent Person considers the entire dataset to be acceptable for resource estimation with assaying posing minimal risk to the overall confidence level of the Mineral Resource estimate.
Verification of sampling and assaying
The verification of significant intersections by either independent or alternative company personnel.
Senior Azure geological staff collected and inspected the samples. The Competent Person independently inspected several significant intersections and confirmed good visual correlation between mineralisation and grade.
The use of twinned holes. Approximately 20% of historical drill holes have been twinned, however the historical holes were not used in the estimate.
Documentation of primary data, data entry procedures, data verification, data storage (physical and electronic) protocols.
Primary data was collected by Azure employees at the project site. Measurements and observations were recorded digitally and later transferred into the Azure’s digital database (DataShed - an industry recognised geoscientific data management system) by Azure staff.
Digital data storage, verification and validation are managed by an independent data management company.
CSA Global reviewed data capture and management procedures and considered them to be appropriate to support reporting of the MRE.
Discuss any adjustment to assay data. No adjustments or calibrations have been made to any assay data.
Location of data points
Accuracy and quality of surveys used to locate drill holes (collar and down hole surveys), trenches, mine workings and other locations used in Mineral Resource estimation.
Drill hole collar locations were initially determined by hand-held GPS. Final drill hole collar positions were surveyed by 2 channel differential GPS by a licensed surveyor. The survey accuracy is considered better than ±10cm in three dimensions.
Down hole path surveys were recorded for most holes. 14 of the 16 Puma holes recorded surveys every 10m down hole and the Azure holes recorded surveys at 5m intervals. All surveys were taken with a gyroscope - an industry standard down-hole survey tool. The Competent Person noted that the deviations in DD holes were minor.
Specification of the grid system used. The grid system used is WGS84 Mexico UTM Zone 12N (EPSG: 32612) for easting, northing and RL.
Quality and adequacy of topographic control. A contractor prepared a high-resolution, LiDAR based digital terrain model (DTM) of the tenement holdings for Azure, which provided centimetre-scale precision in 3D. A resample of the LiDAR points at a coarser spacing on a 15.1m grid reduced the file size and precision, but the Competent Person found that the precision visually in 3D and sections was high, as good agreement of drill hole collar surveys to the DTM model existed. Therefore, the DTM was used to model the topography over the MRE area without adjustments to the survey database provided.
Data spacing and
Data spacing for reporting of Exploration Results.
An initial drill hole spacing of 50m x 50m was implemented with additional drilling to infill the hole spacing to 25m x 25m in some areas.
Level 1, 34 Colin Street, West Perth, Western Australia, 6005 | T: +61 8 9481 2555 | F: +61 8 9485 1290
www.azureminerals.com.au | ABN: 46 106 346 918
Criteria JORC Code explanation Commentary
distribution Whether the data spacing and distribution is sufficient to establish the degree of geological and grade continuity appropriate for the Mineral Resource and Ore Reserve estimation procedure(s) and classifications applied.
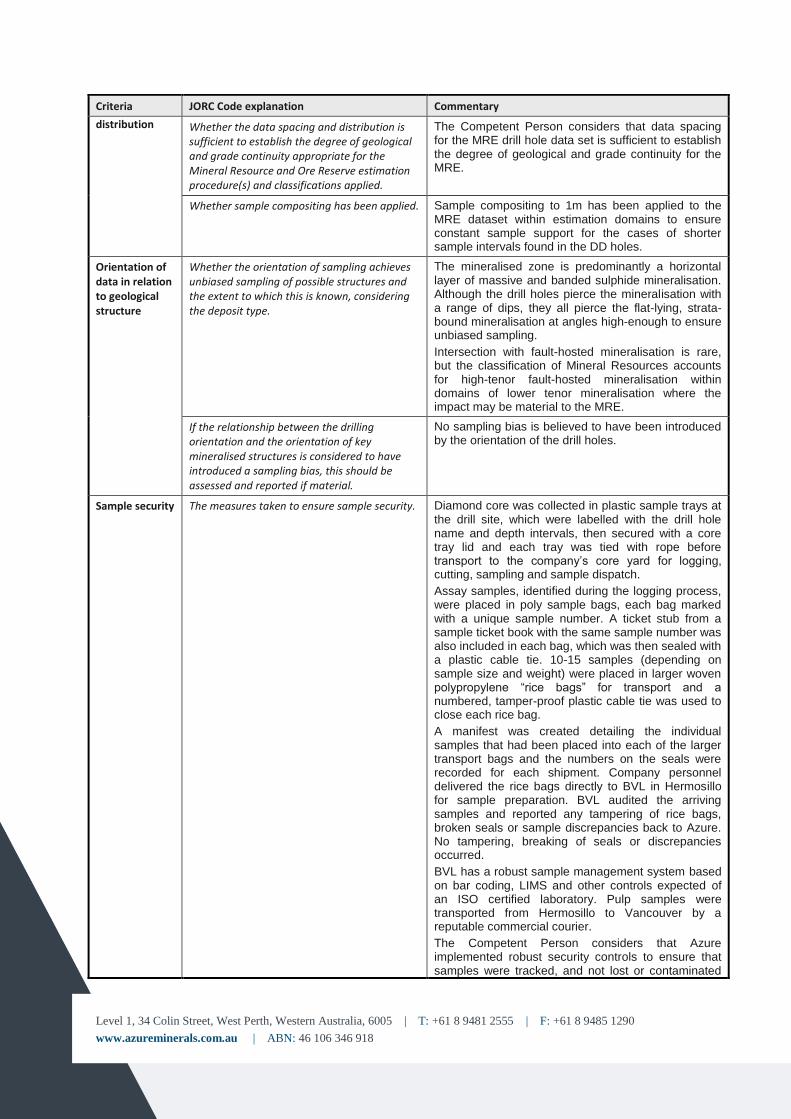
The Competent Person considers that data spacing for the MRE drill hole data set is sufficient to establish the degree of geological and grade continuity for the MRE.
Whether sample compositing has been applied. Sample compositing to 1m has been applied to the MRE dataset within estimation domains to ensure constant sample support for the cases of shorter sample intervals found in the DD holes.
Orientation of data in relation to geological structure
Whether the orientation of sampling achieves unbiased sampling of possible structures and the extent to which this is known, considering the deposit type.
The mineralised zone is predominantly a horizontal layer of massive and banded sulphide mineralisation. Although the drill holes pierce the mineralisation with a range of dips, they all pierce the flat-lying, strata-bound mineralisation at angles high-enough to ensure unbiased sampling.
Intersection with fault-hosted mineralisation is rare, but the classification of Mineral Resources accounts for high-tenor fault-hosted mineralisation within domains of lower tenor mineralisation where the impact may be material to the MRE.
If the relationship between the drilling orientation and the orientation of key mineralised structures is considered to have introduced a sampling bias, this should be assessed and reported if material.
No sampling bias is believed to have been introduced by the orientation of the drill holes.
Sample security The measures taken to ensure sample security. Diamond core was collected in plastic sample trays at the drill site, which were labelled with the drill hole name and depth intervals, then secured with a core tray lid and each tray was tied with rope before transport to the company’s core yard for logging, cutting, sampling and sample dispatch.
Assay samples, identified during the logging process, were placed in poly sample bags, each bag marked with a unique sample number. A ticket stub from a sample ticket book with the same sample number was also included in each bag, which was then sealed with a plastic cable tie. 10-15 samples (depending on sample size and weight) were placed in larger woven polypropylene “rice bags” for transport and a numbered, tamper-proof plastic cable tie was used to close each rice bag.
A manifest was created detailing the individual samples that had been placed into each of the larger transport bags and the numbers on the seals were recorded for each shipment. Company personnel delivered the rice bags directly to BVL in Hermosillo for sample preparation. BVL audited the arriving samples and reported any tampering of rice bags, broken seals or sample discrepancies back to Azure. No tampering, breaking of seals or discrepancies occurred.
BVL has a robust sample management system based on bar coding, LIMS and other controls expected of an ISO certified laboratory. Pulp samples were transported from Hermosillo to Vancouver by a reputable commercial courier.
The Competent Person considers that Azure implemented robust security controls to ensure that samples were tracked, and not lost or contaminated
Level 1, 34 Colin Street, West Perth, Western Australia, 6005 | T: +61 8 9481 2555 | F: +61 8 9485 1290
www.azureminerals.com.au | ABN: 46 106 346 918
Criteria JORC Code explanation Commentary
either accidentally or deliberately.
Audits or reviews
The results of any audits or reviews of sampling techniques and data.
Azure’s senior geological staff have regularly visited site during drilling programs to ensure correct sampling protocols were followed.
All digital data was subjected to audit by the Azure data manager.
The Competent Person, Dr. Neal Reynolds, Principal Geologist and Director of CSA Global, visited site during the Azure drill program in November 2017 and February 2018 and independently reviewed the site geology, geomorphology, drilling, sampling protocols and data management systems. He additionally provided guidance in logging and geological interpretation that was incorporated in the resource model. The review concluded that geological understanding, systems and procedures were appropriate to support reporting of the Mineral Resource in accordance with the JORC Code (2012 Edition).
JORC 2012 Table 1 Section 2 – Reporting Exploration Results – Key Classification Criteria
Criteria JORC Code explanation Commentary
Mineral tenement and land tenure status
Type, reference name/number, location and ownership including agreements or material issues with third parties such as joint ventures, partnerships, overriding royalties, native title interests, historical sites, wilderness or national park and environmental settings.
The MRE for East and West Zones of the Oposura deposit is located wholly within the ‘Oposura’ mining concessions comprising:
El Monstruo de Plomo (Title No. 180473) 27.0522 hectares
Don Genaro (Title No. 180474) 20 hectares
El Crestón de Plomo (Title No. 180475) 20 hectares
Candelaria (Title No. 180476) 50 hectares
El Hueco (Title No. 180477) 24.8957 hectares
Campo de Plomo (Title No. 180602) 10 hectares
Oposura Numero 2 (Title No. 180603) 20 hectares
Oposura No. 4 (Title No. 180604) 20 hectares
Oposura No. 6 (Title No. 180605) 6 hectares
El Encinal (Title No. 223473) 620 hectares
The security of the tenure held at the time of reporting along with any known impediments to obtaining a licence to operate in the area.
These concessions are 100% owned by a Mexican entity named Minera Piedra Azul SA de CV (MPA), which is a wholly owned subsidiary of Azure.
On 11 August 2017, MPA executed an agreement with Grupo Minera Puma SA de CV (Puma) whereby:
MPA agreed to acquire 100% ownership of the Oposura concessions by paying Puma US$1,500,000 and with Puma retaining a Net Smelter Return (NSR) royalty of 2.5%.
MPA has paid to Puma the US$1,500,000 in consideration for the acquisition of the Oposura Project and has entered into a royalty agreement with Puma covering Puma’s retained 2.5% NSR royalty.
Azure has now acquired 100% legal and beneficial interest in the Oposura project.
Level 1, 34 Colin Street, West Perth, Western Australia, 6005 | T: +61 8 9481 2555 | F: +61 8 9485 1290
www.azureminerals.com.au | ABN: 46 106 346 918
Criteria JORC Code explanation Commentary
The Competent Person has seen information indicating that Azure’s obligations in relation to statutory reporting requirements and statutory payments have been met and are current for the Oposura concessions.
The Competent Person considers that the Oposura concessions are in good standing and no known impediments exist to obtaining a licence to operate on the Oposura concessions, or to develop and progress to the grant of mining approvals should an Ore Reserve be defined in the future.
Exploration done by other parties
Acknowledgment and appraisal of exploration by other parties.
The Oposura project area has a history of exploration and small-scale exploratory mining dating back to the early 20
th century. There was a hiatus in activity on
the project from the 1980s until the previous owner, Puma, commenced a small drilling program in early 2017.
Several companies carried out exploration over the Oposura property between the 1920s and 1980s including Anaconda from the 1940s to 1960s and Peñoles in the 1970s. Most recently, the previous owners, Puma, conducted a 16 holes drill program in 2017. In every case, exploration was focused on zinc, lead and silver mineralisation.
Geological mapping from previous exploration has been utilised in interpretation and modelling of the deposit, but no historical sampling data has been used.
Geology Deposit type, geological setting and style of mineralisation.
The region is within the western Mexican Sierra Madre Occidental Basin and Range tectonic zone, which is characterised by north-west trending mountain ranges consisting of Palaeozoic to Mesozoic meta-sedimentary rocks, which are overlain by Mesozoic to Cenozoic volcanic rocks. North-trending, elongate plutons of Laramide-age intrude the volcanic rocks. The valleys between mountain ranges are filled with Tertiary conglomerates, volcanics, and Quaternary gravels.
Oposura is hosted by the Cretaceous-age Mesa Formation, which includes an upper dacite member that extends from Cananea to the Sonora River in northern Mexico. Below the base of the Mesa Formation dacite is a crystal tuff unit up to 100 m thick.
At Oposura, the host lithology is dominantly felsic volcanic sequence, probable Late Cretaceous to Paleogene age. Mineralisation occurs within the Arenillas formation, volcano-sedimentary interval within felsic volcaniclastics, including significant limestone intervals.
Based on the observed alteration mineralogy, Oposura fits the characteristics of a distal skarn, carbonate replacement style deposit. Mineralisation and skarn replaces limestone horizons in the Arenillas formation, a mixed sedimentary-volcanic sedimentary unit between two volcanic welded tuff units.
Stratabound massive to semi-massive zinc, lead and silver sulphide carbonate-replacement mineralisation in the Arenillas formation is characterised by manganese rich calcium-silicate minerals with strong late stage retrogression. The higher-grade zinc and
Level 1, 34 Colin Street, West Perth, Western Australia, 6005 | T: +61 8 9481 2555 | F: +61 8 9485 1290
www.azureminerals.com.au | ABN: 46 106 346 918
Criteria JORC Code explanation Commentary
lead mineralisation is correlated with elevated silver concentrations. The main sulphide-mineralised zone crops out discontinuously over approximately 2 kilometres on the eastern, southern and western sides of a mountain and generally dips shallowly to the northwest.
Drill hole Information
A summary of all information material to the understanding of the exploration results including a tabulation of the following information for all Material drill holes:
Easting and northing of the drill hole collar
Elevation or RL (Reduced Level – elevation above sea level in metres) of the drill hole collar
Dip and azimuth of the hole
Down hole length and interception depth
Hole length.
Exploration results are not being reported.
If the exclusion of this information is justified on the basis that the information is not Material and this exclusion does not detract from the understanding of the report, the Competent Person should clearly explain why this is the case.
Exploration results are not being reported.
Data aggregation methods
In reporting Exploration Results, weighting averaging techniques, maximum and/or minimum grade truncations (e.g. cutting of high grades) and cut-off grades are usually Material and should be stated.
Exploration results are not being reported.
Where aggregate intercepts incorporate short lengths of high grade results and longer lengths of low grade results, the procedure used for such aggregation should be stated and some typical examples of such aggregations should be shown in detail.
Exploration results are not being reported.
The assumptions used for any reporting of metal equivalent values should be clearly stated.
Exploration results are not being reported.
Relationship between mineralisation widths and intercept lengths
These relationships are particularly important in the reporting of Exploration Results.
Exploration results are not being reported.
If the geometry of the mineralisation with respect to the drill hole angle is known, its nature should be reported.
Exploration results are not being reported.
Holes were variably angled (–43° to –90°) towards northeast and southwest. The average dip of holes was –60° to balance an optimal angle of intersection of the mineralised horizon with access restrictions. There are no relationships between hole angles and grade or true thickness of the mineralisation.
If it is not known and only the down hole lengths are reported, there should be a clear statement to this effect (e.g. ‘down hole length, true width not known’).
Exploration results are not being reported.
Diagrams Appropriate maps and sections (with scales) and tabulations of intercepts should be included for any significant discovery being reported These should include, but not be limited to a plan view of drill hole collar
Relevant maps and diagrams are included in the body of the report.
Level 1, 34 Colin Street, West Perth, Western Australia, 6005 | T: +61 8 9481 2555 | F: +61 8 9485 1290
www.azureminerals.com.au | ABN: 46 106 346 918
Criteria JORC Code explanation Commentary
locations and appropriate sectional views.
Balanced reporting
Where comprehensive reporting of all Exploration Results is not practicable, representative reporting of both low and high grades and/or widths should be practiced to avoid misleading reporting of Exploration Results.
All material relevant to the reporting of a MRE has been included in this report.
Other substantive exploration data
Other exploration data, if meaningful and material, should be reported including (but not limited to): geological observations; geophysical survey results; geochemical survey results; bulk samples – size and method of treatment; metallurgical test results; bulk density, groundwater, geotechnical and rock characteristics; potential deleterious or contaminating substances.
See Section 3 of this Table 1 for information on bulk density and metallurgical test results.
Further work The nature and scale of planned further work (e.g. tests for lateral extensions or depth extensions or large-scale step-out drilling).
Having reported the Mineral Resource in accordance with the guidelines of the JORC Code (2012 Edition), Azure will examine the potential of the deposit via a Preliminary Economic Assessment (PEA).
Diagrams clearly highlighting the areas of possible extensions, including the main geological interpretations and future drilling areas, provided this information is not commercially sensitive.
This document covers the reporting of a MRE. Plans showing the extent of existing drilling over the deposits are included in the text, highlighting areas of possible extension.
On achievement of a positive PEA, drilling is planned in the short term to upgrade Mineral Resource confidence. Future drilling is also planned between the East Zone and the West Zone deposits to define extensions.
JORC 2012 Table 1 Section 3 – Estimation and Reporting of Mineral Resources – Key Classification Criteria
Criteria JORC Code explanation Commentary
Database integrity
Measures taken to ensure that data has not been corrupted by, for example, transcription or keying errors, between its initial collection and its use for Mineral Resource estimation purposes.
The logs were uploaded, without alteration, into a relational database management system with primary key fields and look-up tables (DataShed). Collar survey, down hole survey and assay files were loaded from source files using templates to load into predefined tables. These measures enforced strict referential integrity and validation rules to prevent corruption errors.
The Competent Person found no material errors and that the database was fit for the purpose of Mineral Resource estimation.
Data validation procedures used. All data were then checked for the following logical errors:
Duplicate drill hole IDs
Missing collar coordinates
Mis-matched or missing FROM or TO fields in the assay file
FROM value greater than TO value in the assay table
Non-contiguous sampling intervals
Sampling interval overlap in the assay table
The first sample in the interval file not starting at 0 m
Interval tables with depths greater than the collar table
Level 1, 34 Colin Street, West Perth, Western Australia, 6005 | T: +61 8 9481 2555 | F: +61 8 9485 1290
www.azureminerals.com.au | ABN: 46 106 346 918
Criteria JORC Code explanation Commentary
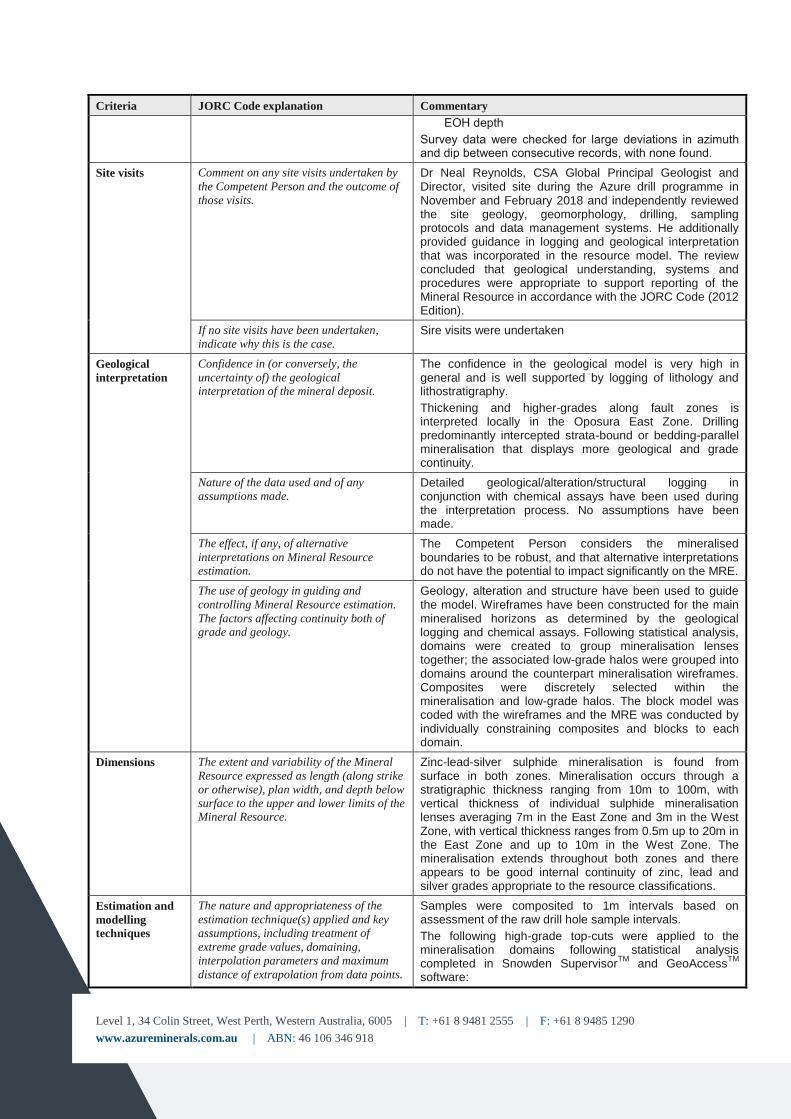
EOH depth
Survey data were checked for large deviations in azimuth and dip between consecutive records, with none found.
Site visits Comment on any site visits undertaken by
the Competent Person and the outcome of
those visits.
Dr Neal Reynolds, CSA Global Principal Geologist and Director, visited site during the Azure drill programme in November and February 2018 and independently reviewed the site geology, geomorphology, drilling, sampling protocols and data management systems. He additionally provided guidance in logging and geological interpretation that was incorporated in the resource model. The review concluded that geological understanding, systems and procedures were appropriate to support reporting of the Mineral Resource in accordance with the JORC Code (2012 Edition).
If no site visits have been undertaken,
indicate why this is the case. Sire visits were undertaken
Geological
interpretation
Confidence in (or conversely, the
uncertainty of) the geological interpretation of the mineral deposit.
The confidence in the geological model is very high in general and is well supported by logging of lithology and lithostratigraphy.
Thickening and higher-grades along fault zones is interpreted locally in the Oposura East Zone. Drilling predominantly intercepted strata-bound or bedding-parallel mineralisation that displays more geological and grade continuity.
Nature of the data used and of any
assumptions made. Detailed geological/alteration/structural logging in conjunction with chemical assays have been used during the interpretation process. No assumptions have been made.
The effect, if any, of alternative
interpretations on Mineral Resource estimation.
The Competent Person considers the mineralised boundaries to be robust, and that alternative interpretations do not have the potential to impact significantly on the MRE.
The use of geology in guiding and
controlling Mineral Resource estimation.
The factors affecting continuity both of grade and geology.
Geology, alteration and structure have been used to guide the model. Wireframes have been constructed for the main mineralised horizons as determined by the geological logging and chemical assays. Following statistical analysis, domains were created to group mineralisation lenses together; the associated low-grade halos were grouped into domains around the counterpart mineralisation wireframes. Composites were discretely selected within the mineralisation and low-grade halos. The block model was coded with the wireframes and the MRE was conducted by individually constraining composites and blocks to each domain.
Dimensions The extent and variability of the Mineral
Resource expressed as length (along strike
or otherwise), plan width, and depth below
surface to the upper and lower limits of the Mineral Resource.
Zinc-lead-silver sulphide mineralisation is found from surface in both zones. Mineralisation occurs through a stratigraphic thickness ranging from 10m to 100m, with vertical thickness of individual sulphide mineralisation lenses averaging 7m in the East Zone and 3m in the West Zone, with vertical thickness ranges from 0.5m up to 20m in the East Zone and up to 10m in the West Zone. The mineralisation extends throughout both zones and there appears to be good internal continuity of zinc, lead and silver grades appropriate to the resource classifications.
Estimation and
modelling
techniques
The nature and appropriateness of the
estimation technique(s) applied and key
assumptions, including treatment of
extreme grade values, domaining,
interpolation parameters and maximum
distance of extrapolation from data points.
Samples were composited to 1m intervals based on assessment of the raw drill hole sample intervals.
The following high-grade top-cuts were applied to the mineralisation domains following statistical analysis completed in Snowden Supervisor
TM and GeoAccess
TM
software:
Level 1, 34 Colin Street, West Perth, Western Australia, 6005 | T: +61 8 9481 2555 | F: +61 8 9485 1290
www.azureminerals.com.au | ABN: 46 106 346 918
Criteria JORC Code explanation Commentary
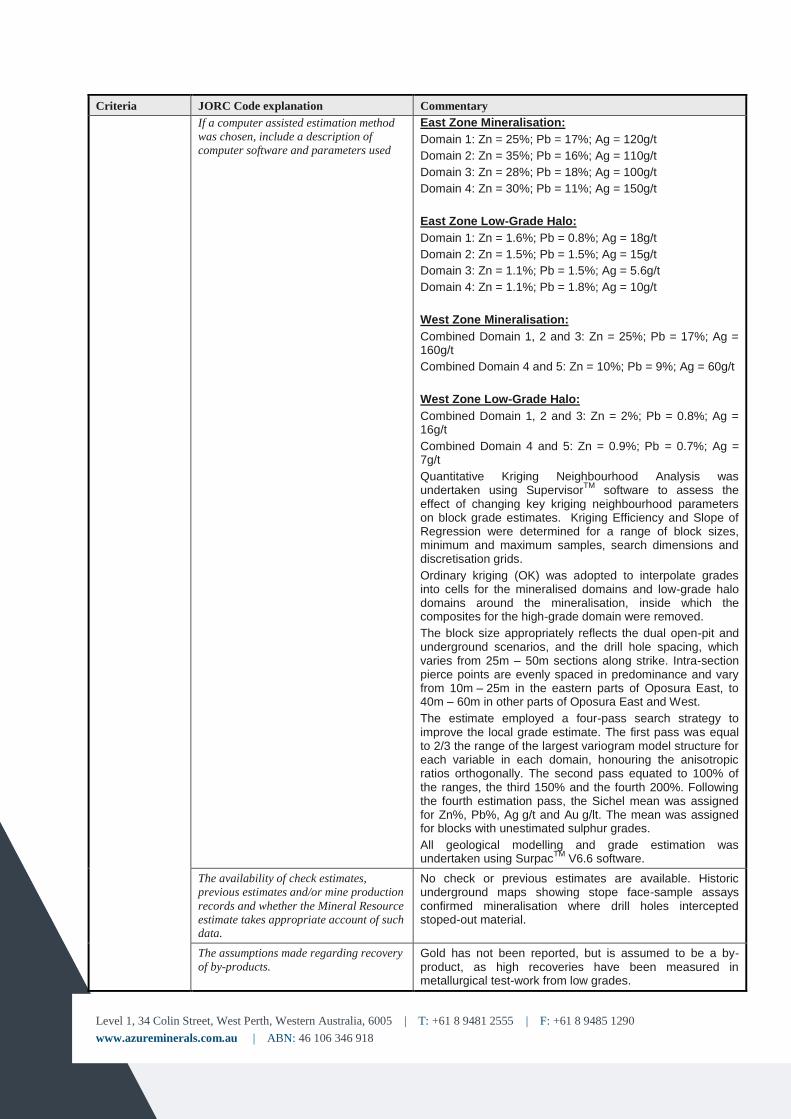
If a computer assisted estimation method
was chosen, include a description of
computer software and parameters used
East Zone Mineralisation:
Domain 1: Zn = 25%; Pb = 17%; Ag = 120g/t
Domain 2: Zn = 35%; Pb = 16%; Ag = 110g/t
Domain 3: Zn = 28%; Pb = 18%; Ag = 100g/t
Domain 4: Zn = 30%; Pb = 11%; Ag = 150g/t
East Zone Low-Grade Halo:
Domain 1: Zn = 1.6%; Pb = 0.8%; Ag = 18g/t
Domain 2: Zn = 1.5%; Pb = 1.5%; Ag = 15g/t
Domain 3: Zn = 1.1%; Pb = 1.5%; Ag = 5.6g/t
Domain 4: Zn = 1.1%; Pb = 1.8%; Ag = 10g/t
West Zone Mineralisation:
Combined Domain 1, 2 and 3: Zn = 25%; Pb = 17%; Ag = 160g/t
Combined Domain 4 and 5: Zn = 10%; Pb = 9%; Ag = 60g/t
West Zone Low-Grade Halo:
Combined Domain 1, 2 and 3: Zn = 2%; Pb = 0.8%; Ag = 16g/t
Combined Domain 4 and 5: Zn = 0.9%; Pb = 0.7%; Ag = 7g/t
Quantitative Kriging Neighbourhood Analysis was undertaken using Supervisor
TM software to assess the
effect of changing key kriging neighbourhood parameters on block grade estimates. Kriging Efficiency and Slope of Regression were determined for a range of block sizes, minimum and maximum samples, search dimensions and discretisation grids.
Ordinary kriging (OK) was adopted to interpolate grades into cells for the mineralised domains and low-grade halo domains around the mineralisation, inside which the composites for the high-grade domain were removed.
The block size appropriately reflects the dual open-pit and underground scenarios, and the drill hole spacing, which varies from 25m – 50m sections along strike. Intra-section pierce points are evenly spaced in predominance and vary from 10m – 25m in the eastern parts of Oposura East, to 40m – 60m in other parts of Oposura East and West.
The estimate employed a four-pass search strategy to improve the local grade estimate. The first pass was equal to 2/3 the range of the largest variogram model structure for each variable in each domain, honouring the anisotropic ratios orthogonally. The second pass equated to 100% of the ranges, the third 150% and the fourth 200%. Following the fourth estimation pass, the Sichel mean was assigned for Zn%, Pb%, Ag g/t and Au g/lt. The mean was assigned for blocks with unestimated sulphur grades.
All geological modelling and grade estimation was undertaken using Surpac
TM V6.6 software.
The availability of check estimates,
previous estimates and/or mine production
records and whether the Mineral Resource
estimate takes appropriate account of such data.
No check or previous estimates are available. Historic underground maps showing stope face-sample assays confirmed mineralisation where drill holes intercepted stoped-out material.
The assumptions made regarding recovery
of by-products. Gold has not been reported, but is assumed to be a by-product, as high recoveries have been measured in metallurgical test-work from low grades.
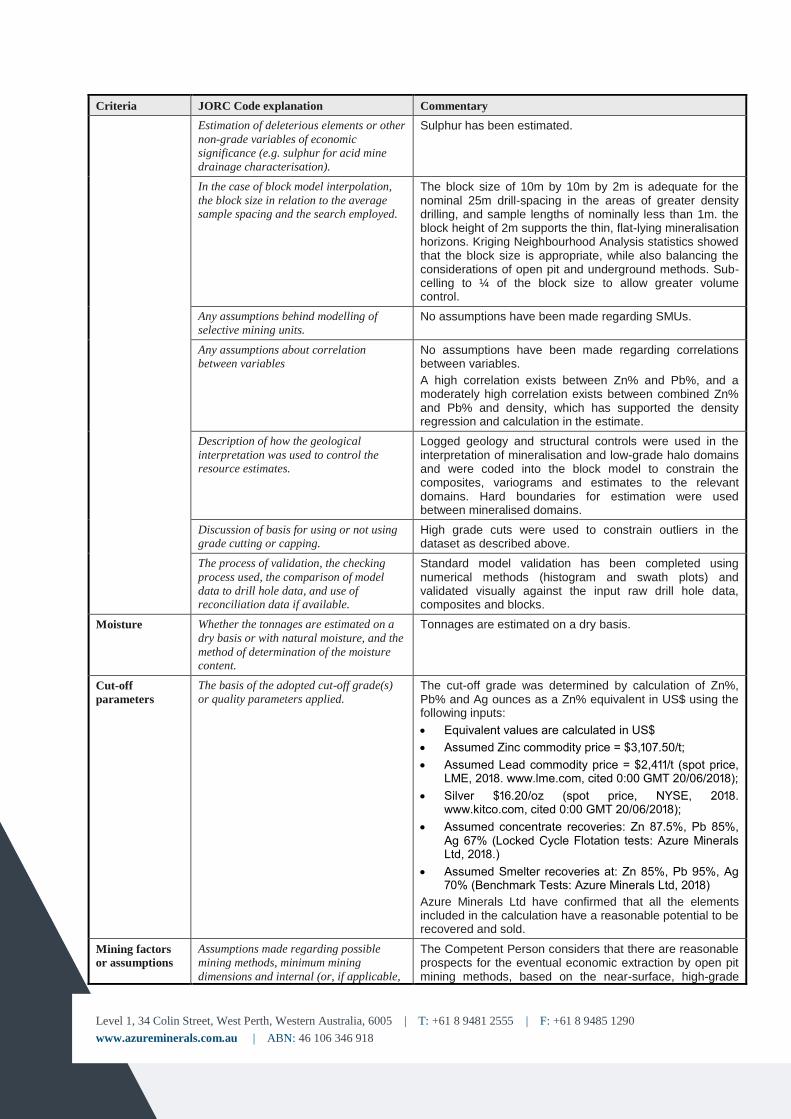
Level 1, 34 Colin Street, West Perth, Western Australia, 6005 | T: +61 8 9481 2555 | F: +61 8 9485 1290
www.azureminerals.com.au | ABN: 46 106 346 918
Criteria JORC Code explanation Commentary
Estimation of deleterious elements or other
non-grade variables of economic
significance (e.g. sulphur for acid mine
drainage characterisation).
Sulphur has been estimated.
In the case of block model interpolation,
the block size in relation to the average sample spacing and the search employed.
The block size of 10m by 10m by 2m is adequate for the nominal 25m drill-spacing in the areas of greater density drilling, and sample lengths of nominally less than 1m. the block height of 2m supports the thin, flat-lying mineralisation horizons. Kriging Neighbourhood Analysis statistics showed that the block size is appropriate, while also balancing the considerations of open pit and underground methods. Sub-celling to ¼ of the block size to allow greater volume control.
Any assumptions behind modelling of
selective mining units. No assumptions have been made regarding SMUs.
Any assumptions about correlation
between variables No assumptions have been made regarding correlations between variables.
A high correlation exists between Zn% and Pb%, and a moderately high correlation exists between combined Zn% and Pb% and density, which has supported the density regression and calculation in the estimate.
Description of how the geological
interpretation was used to control the resource estimates.
Logged geology and structural controls were used in the interpretation of mineralisation and low-grade halo domains and were coded into the block model to constrain the composites, variograms and estimates to the relevant domains. Hard boundaries for estimation were used between mineralised domains.
Discussion of basis for using or not using
grade cutting or capping. High grade cuts were used to constrain outliers in the dataset as described above.
The process of validation, the checking
process used, the comparison of model
data to drill hole data, and use of reconciliation data if available.
Standard model validation has been completed using numerical methods (histogram and swath plots) and validated visually against the input raw drill hole data, composites and blocks.
Moisture Whether the tonnages are estimated on a
dry basis or with natural moisture, and the
method of determination of the moisture content.
Tonnages are estimated on a dry basis.
Cut-off
parameters
The basis of the adopted cut-off grade(s)
or quality parameters applied. The cut-off grade was determined by calculation of Zn%, Pb% and Ag ounces as a Zn% equivalent in US$ using the following inputs:
Equivalent values are calculated in US$
Assumed Zinc commodity price = $3,107.50/t;
Assumed Lead commodity price = $2,411/t (spot price, LME, 2018. www.lme.com, cited 0:00 GMT 20/06/2018);
Silver $16.20/oz (spot price, NYSE, 2018. www.kitco.com, cited 0:00 GMT 20/06/2018);
Assumed concentrate recoveries: Zn 87.5%, Pb 85%, Ag 67% (Locked Cycle Flotation tests: Azure Minerals Ltd, 2018.)
Assumed Smelter recoveries at: Zn 85%, Pb 95%, Ag 70% (Benchmark Tests: Azure Minerals Ltd, 2018)
Azure Minerals Ltd have confirmed that all the elements included in the calculation have a reasonable potential to be recovered and sold.
Mining factors
or assumptions
Assumptions made regarding possible
mining methods, minimum mining
dimensions and internal (or, if applicable,
The Competent Person considers that there are reasonable prospects for the eventual economic extraction by open pit mining methods, based on the near-surface, high-grade
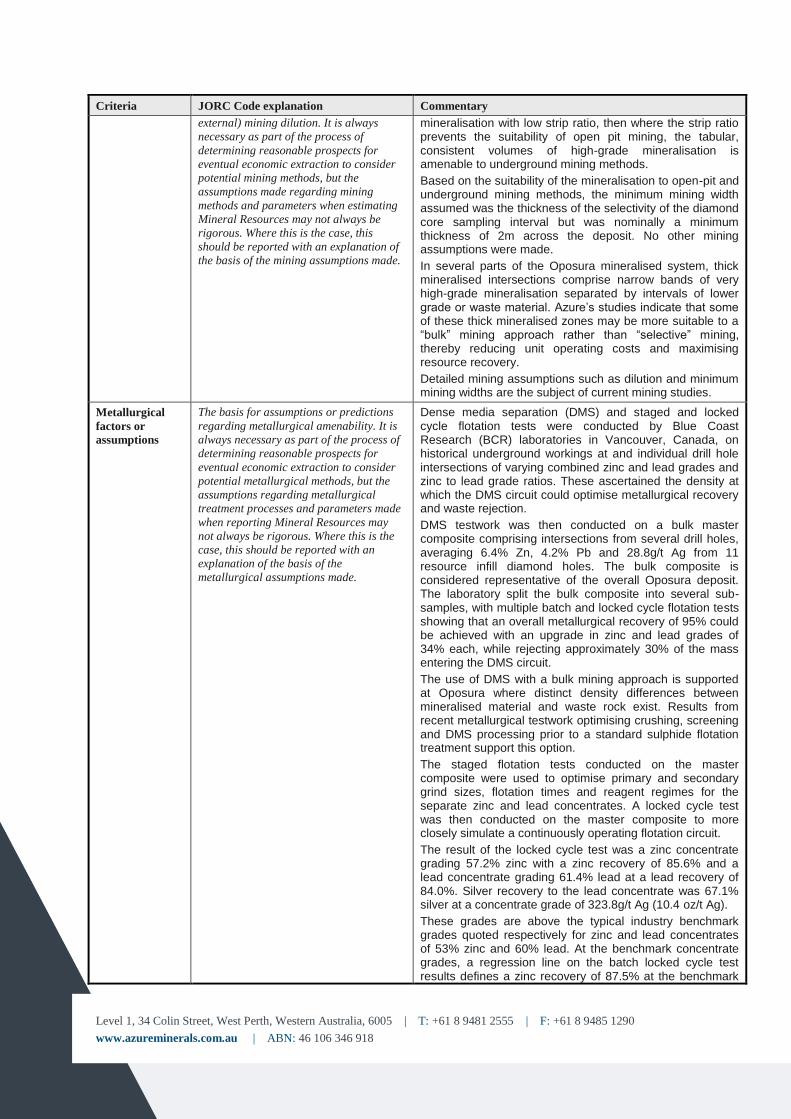
Level 1, 34 Colin Street, West Perth, Western Australia, 6005 | T: +61 8 9481 2555 | F: +61 8 9485 1290
www.azureminerals.com.au | ABN: 46 106 346 918
Criteria JORC Code explanation Commentary
external) mining dilution. It is always
necessary as part of the process of
determining reasonable prospects for
eventual economic extraction to consider
potential mining methods, but the
assumptions made regarding mining
methods and parameters when estimating
Mineral Resources may not always be
rigorous. Where this is the case, this
should be reported with an explanation of
the basis of the mining assumptions made.
mineralisation with low strip ratio, then where the strip ratio prevents the suitability of open pit mining, the tabular, consistent volumes of high-grade mineralisation is amenable to underground mining methods.
Based on the suitability of the mineralisation to open-pit and underground mining methods, the minimum mining width assumed was the thickness of the selectivity of the diamond core sampling interval but was nominally a minimum thickness of 2m across the deposit. No other mining assumptions were made.
In several parts of the Oposura mineralised system, thick mineralised intersections comprise narrow bands of very high-grade mineralisation separated by intervals of lower grade or waste material. Azure’s studies indicate that some of these thick mineralised zones may be more suitable to a “bulk” mining approach rather than “selective” mining, thereby reducing unit operating costs and maximising resource recovery.
Detailed mining assumptions such as dilution and minimum mining widths are the subject of current mining studies.
Metallurgical
factors or
assumptions
The basis for assumptions or predictions
regarding metallurgical amenability. It is
always necessary as part of the process of
determining reasonable prospects for
eventual economic extraction to consider
potential metallurgical methods, but the
assumptions regarding metallurgical
treatment processes and parameters made
when reporting Mineral Resources may
not always be rigorous. Where this is the
case, this should be reported with an
explanation of the basis of the
metallurgical assumptions made.
Dense media separation (DMS) and staged and locked cycle flotation tests were conducted by Blue Coast Research (BCR) laboratories in Vancouver, Canada, on historical underground workings at and individual drill hole intersections of varying combined zinc and lead grades and zinc to lead grade ratios. These ascertained the density at which the DMS circuit could optimise metallurgical recovery and waste rejection.
DMS testwork was then conducted on a bulk master composite comprising intersections from several drill holes, averaging 6.4% Zn, 4.2% Pb and 28.8g/t Ag from 11 resource infill diamond holes. The bulk composite is considered representative of the overall Oposura deposit. The laboratory split the bulk composite into several sub-samples, with multiple batch and locked cycle flotation tests showing that an overall metallurgical recovery of 95% could be achieved with an upgrade in zinc and lead grades of 34% each, while rejecting approximately 30% of the mass entering the DMS circuit.
The use of DMS with a bulk mining approach is supported at Oposura where distinct density differences between mineralised material and waste rock exist. Results from recent metallurgical testwork optimising crushing, screening and DMS processing prior to a standard sulphide flotation treatment support this option.
The staged flotation tests conducted on the master composite were used to optimise primary and secondary grind sizes, flotation times and reagent regimes for the separate zinc and lead concentrates. A locked cycle test was then conducted on the master composite to more closely simulate a continuously operating flotation circuit.
The result of the locked cycle test was a zinc concentrate grading 57.2% zinc with a zinc recovery of 85.6% and a lead concentrate grading 61.4% lead at a lead recovery of 84.0%. Silver recovery to the lead concentrate was 67.1% silver at a concentrate grade of 323.8g/t Ag (10.4 oz/t Ag).
These grades are above the typical industry benchmark grades quoted respectively for zinc and lead concentrates of 53% zinc and 60% lead. At the benchmark concentrate grades, a regression line on the batch locked cycle test results defines a zinc recovery of 87.5% at the benchmark
Level 1, 34 Colin Street, West Perth, Western Australia, 6005 | T: +61 8 9481 2555 | F: +61 8 9485 1290
www.azureminerals.com.au | ABN: 46 106 346 918
Criteria JORC Code explanation Commentary
concentrate grade of 53% zinc and a lead recovery of 85% was used at the benchmark concentrate grade of 60% lead.
Physical testwork comprised the establishment of crushing, grinding and abrasion indices. All three of the indices are within the typical range of expected values for mining projects.
Assays on the concentrates indicated that deleterious elements were not present at levels that would cause concern or penalties from smelters
Environmental
factors or
assumptions
Assumptions made regarding possible
waste and process residue disposal
options. It is always necessary as part of
the process of determining reasonable
prospects for eventual economic extraction
to consider the potential environmental
impacts of the mining and processing
operation. While at this stage the
determination of potential environmental
impacts, particularly for a greenfields
project, may not always be well advanced,
the status of early consideration of these
potential environmental impacts should be
reported. Where these aspects have not
been considered, this should be reported
with an explanation of the environmental assumptions made.
Baseline environmental surveys and studies have been conducted and a report is being compiled for Azure.
Also, the prior concession owners Grupo Minero Puma, applied for and received approval (a MIA) for the development of a mine, process plant and tailings facility for Oposura.
This approval has been transferred from Puma to Minera Piedra Azul.
Bulk density Whether assumed or determined. If
assumed, the basis for the assumptions. If
determined, the method used, whether wet
or dry, the frequency of the measurements,
the nature, size and representativeness of the samples.
Azure collected a total of 809 density measurements from drill core samples, with 120 samples within the bounds of the reported Mineral Resource, the remainder within lower-grade and waste zones to provide a good range of material for density determinations, reducing sample bias. Each sample was dried and measured for length and diameter. The diameter was measured with callipers at three points along the length of the core sample and averaged. The volume of the core sample was calculated and the sample was weighed. Azure calculated the density for the core samples by dividing the dry weight of the sample by the volume.
A total of 57 of the 809 samples were sent to Bureau Veritas Laboratories in Hermosillo, Mexico for density measurements by immersion of waxed core (method SPG03). The results of the immersion method were compared to densities measured by Azure. There was no discernible difference between the calliper and immersion methods.
A multivariate regression formula from dry bulk density determinations to Zn% and Pb% was developed for use across the deposit for areas of varying zinc and lead grades. This formula combined the measured density of samples that were subsequently sent for assay.
A regression was calculated between methods. A multivariate regression was calculated from density data of both methods to Zn% and Pb%, which was used to calculate density in the block model from the Zn% and Pb% grade estimates.
The bulk density for bulk material must
have been measured by methods that
adequately account for void spaces (vugs,
porosity, etc.), moisture and differences
between rock and alteration zones within
the deposit.
Both methods adequately account for void spaces, moisture and differences between rock and alteration zones within the deposit.
Level 1, 34 Colin Street, West Perth, Western Australia, 6005 | T: +61 8 9481 2555 | F: +61 8 9485 1290
www.azureminerals.com.au | ABN: 46 106 346 918
Criteria JORC Code explanation Commentary
Discuss assumptions for bulk density
estimates used in the evaluation process of the different materials.
The bulk density is assumed to be influenced by the content of combined Pb% and Zn%, as shown by a stronger correlation and P-value between the combined variables and density than in a univariate sense. Other variables were checked for influence, but their impact on density was not material.
Classification The basis for the classification of the
Mineral Resources into varying confidence categories.
Indicated resources were classified for large zones of contiguous blocks where consistent, coherent zones of estimation pass 1 and 2, average distance less than 30 m. Results were visually checked against composites for appropriate local estimates in sections.
The quality of samples, density data, drill hole spacing, drill hole surveying, historical nature of the drilling, sampling and assaying processes, and estimation quality were all considered for determining the resource classification.
Whether appropriate account has been
taken of all relevant factors (i.e. relative
confidence in tonnage/grade estimations,
reliability of input data, confidence in
continuity of geology and metal values,
quality, quantity and distribution of the
data).
The Mineral Resource has been appropriately classified considering all relevant factors as described above.
Whether the result appropriately reflects
the Competent Person’s view of the deposit.
The Mineral Resource estimate appropriately reflects the view of the Competent Person.
Audits or
reviews
The results of any audits or reviews of
Mineral Resource estimates. No audits or reviews of the MRE have been conducted.
Discussion of
relative
accuracy/
confidence
Where appropriate, a statement of the
relative accuracy and confidence level in
the Mineral Resource estimate using an
approach or procedure deemed
appropriate by the Competent Person. For
example, the application of statistical or
geostatistical procedures to quantify the
relative accuracy of the resource within
stated confidence limits, or, if such an
approach is not deemed appropriate, a
qualitative discussion of the factors that
could affect the relative accuracy and confidence of the estimate.
The Mineral Resource accuracy is communicated through the classification assigned to the deposit. The Mineral Resource estimate has been classified in accordance with the JORC Code (2012 Edition) using a qualitative approach. All factors that have been considered have been adequately communicated in Section 1 and Section 3 of this Table.
The statement should specify whether it
relates to global or local estimates, and, if
local, state the relevant tonnages, which
should be relevant to technical and
economic evaluation. Documentation
should include assumptions made and the
procedures used.
The Mineral Resource statement relates to a global estimate of in-situ tonnes and grade.
These statements of relative accuracy and
confidence of the estimate should be
compared with production data, where available.
No production data exists to compare the MRE.