Embed Size (px)
Citation preview
A B P
Federal Public Debt: Annual Borrowing Plan
2014
NUMBER 14
BRASÍLIA2014

MINISTER OF FINANCEGuido Mantega
INTERIM EXECUTIVE SECRETARYDyogo Henrique de Oliveira
NATIONAL TREASURY SECRETARYArno Hugo Augustin Filho
NATIONAL TREASURY UNDER SECRETARIESCleber Ubiratan de OliveiraEduardo Coutinho GuerraGilvan da Silva DantasLíscio Fábio de Brasil Camargo Marcus Pereira AucélioPaulo Fontoura Valle
TECHNICAL STAFFUnder Secretary of the Public DebtPaulo Fontoura ValleGeneral Coordinator of Public Debt OperationsFernando Eurico de Paiva GarridoGeneral Coordinator of Public Debt Strategic PlanningOtavio Ladeira de MedeirosGeneral Coordinator of Public Debt ControlAntônio de Pádua Ferreira Passos
Adonias Evaristo da Costa Filho Marcia Paim Romera
André Luiz Gonçalves Garcia Marcos Demian Pereira Magalhães
André Proite Marcos Francisco Ferreira Martinelli
Artur Cleber Assunção do Vale Marcus Vinícius Socio Magalhães
Cláudio Araujo de Freitas Gago Maria José Marques de Paula
Daniel Mário Alves de Paula Mariana de Lourdes Moreira Lopes
David Rebelo Athayde Maurício Dias Leister
Edis Machado Canedo Nucilene Lima de Freitas França
Frederico Schettini Batista Pedro Camara Lima da Costa
Geraldo Teodoro F. Gonçalves Pedro Ivo Ferreira de Souza Junior
Gustavo Matte Russomanno Poliana de Carvalho Pereira
Helano Borges Dias Priscila de Souza C. de Castro
José Franco Medeiros de Morais Renato da Motta Andrade Neto
Juliana Fernandes Marcolino de Oliveira Roberto Beier Lobarinhas
Julio Cesar Lima Cruz Róger Araujo Castro
Leandro Puccini Secunho Rubens Rodrigues da Cruz
Luiz Fernando Alves* Ruth Lacerda Benfica
Marcelo Rocha Vitorino
Márcia Fernanda Tapajós * Technical Coordination
Cover & Graphic DesignHelise Oliveira Gomes
Federal Public Debt: Annual Borrowing Plan 2014. 1/Ministry of Finance, National Treasury Secretariat, Brasília: National Treasury Secretariat, January, 2014, number 14. 1. Federal Public Debt 2. Annual Borrowing Plan 3. Planning 4. StrategyI. Brazil. National Treasury Secretariat II. Title.
Information:Gerência de Relacionamento Institucional - GERINPhone: (61) 3412-3188; Fax: (61) 3412-1565National Treasury SecretariatEdifício do Ministério da Fazenda, Esplanada dos Ministérios, Bloco P, 2o andar, CEP 70.048-900 – Brasília - DFE-mail: [email protected] Page: http://www.tesouro.fazenda.gov.br
Federal Public Debt: Annual Borrowing Plan 2014 is a yearly publication of the National Treasury Secretariat. Reproduction in full or in part is permitted, provided the source is cited.
MESSAGE FROM THE MINISTER OF FINANCE
Despite the challenges faced by the Brazilian economy, the economic activity in 2013 continued on the path of gradual recovery. Even with the adversities posed by the global scenario, Brazil stood out in a very positive manner, by creating space and incentives for investments designed to lever-age the nation’s competitiveness and further boost the process of renewed economic expansion.
Domestic incentives have played an important role in strengthening the economy. Here, one should highlight tax incentives that have aided in sustaining aggregate demand, together with the infrastructure concession program, involving ports, airports, highways and railways, coupled with cutbacks in energy costs, generating across-the-board benefits for all segments of society ranging from families to industry, with evident impacts on the country’s competitiveness. In the framework of these initiatives, the investment level has taken on a new dynamic, attracting inves-tor interest to a series of high impact projects in the Brazilian productive sector.
Brazil has maintained its commitment to solid macroeconomic fundamentals. Just as has oc-curred in recent years, the country registered a positive primary surplus, resulting in a balanced fiscal performance and a comfortable public debt trajectory. Inflation remains under control within the target limits, with expectations of reductions in the coming years toward the target center. On the external front, foreign reserves remain in a comfortable position, making the country less vulnerable to balance of payments crises. Moreover, Brazil has shown attractiveness for domestic and foreign investors, as we can observe in the success of infrastructure concession auctions, in the high inflows of foreign direct investment and also in the increased participation of foreigners in public debt.
In 2014, Brazil will continue striding forward toward a more highly developed infrastructure, strengthening strategic sectors such as oil and gas, and raising productivity through innovation and improvements in human capital. Furthermore, the government will continue providing in-centives to the domestic market and investment sector, focused mainly on continuation of the concession process, which should stimulate the recovery of economic activity, reduce the cost of business and broaden supply in the various productive sectors.
It is in this framework that the National Treasury publishes its fourteenth Annual Borrowing Plan – ABP 2014, setting out the objectives, guidelines, strategies and targets for federal public debt management in the current year. With this, we not only seek to strengthen the credibility of our public institutions, but also reaffirm the nation’s commitment to a responsible economic policy, targeted to development and improvement in the quality of life of our population.
GUIDO MANTEGA MINISTER OF FINANCE
MESSAGE FROM THE NATIONAL TREASURY SECRETARY
The measures adopted by the National Treasury in its task of Federal Public Debt (FPD) man-agement follows the objective of meeting the federal government’s borrowing requirements, thus ensuring an adequate balance between FPD costs and risks while, simultaneously, fostering smooth operation of the public security market. It is with this commitment in mind that we present the fourteenth Annual Borrowing Plan (ABP) 2014, stating the guidelines, strategies and targets that will orient the nation’s public debt policy.
This ABP is presented in the framework of the Brazilian economy’s positive reaction to the chal-lenges imposed by the scenario of deceleration that has marked most countries in recent years. Structural changes have been consolidated in Brazil and the government has adopted important investment incentives, particularly the infrastructure concession program and reductions in en-ergy costs, with the intention of enhancing competitiveness and paving the way toward recovery in the pace of the country’s economic activity.
Parallel to this, the nation’s macroeconomic fundamentals have been consolidated, aligned with a monetary policy marked by competitive interest and exchange rates in a framework of continued inflation control. On the fiscal side, we have reaffirmed the solidity of public sector results, high-lighted by consistently positive primary surpluses, even in the midst of anti-cyclical measures. As a result of the robust performance of public accounts, one should note the favorable trajectory of the Net Public Sector Debt, together with that of the Gross General Government Debt.
In the FPD framework, evolution of its indicators in recent years points that the country has come a long way in its move toward a structure of lesser costs and risks, particularly with respect to reductions in the share of the debt that is most sensitive to financial indicators, as that tied to exchange rates, and to lengthening of its average term. In this sense, the National Treasury will continue its pursuit of opportunities for greater progress in debt composition without, however, generating pressures that could result in excessive costs for the country.
The strategy presented in this 2014 ABP prioritizes the supply of fixed-rate and inflation-linked securities, while the volume of LFT to be placed on the market will be lower than maturities scheduled for the year. Auctions of long-term NTN-B will be maintained, with maturities in 2030, 2040 and 2050, thus fostering a lengthening of the average FPD term. As regards fixed-rate bonds, four vertices of LTN will be offered, with terms varying from six months to four years, aside from the long-term benchmarks which will include two NTN-F, among which the new 10-year bond maturing in 2025 deserves special mention.
With publication of this ABP, planning and transparency are viewed once again as the pillars of healthy and efficient public debt management.
ARNO HUGO AUGUSTIN FILHO NATIONAL TREASURY SECRETARY
GENERAL INDEX
1 INTRODUCTION ............................................................................................................................. 7
2 2014 SCENARIOS AND BORROWING REQUIREMENTS ...................................................... 8
2.1 Scenarios ...................................................................................................................................... 8
2.2 Borrowing Requirements .......................................................................................................... 9
3 BORROWING STRATEGY ........................................................................................................... 11
Fixed-rate Securities ............................................................................................................... 12
Inflation-Linked Bonds .......................................................................................................... 13
Floating-Rate Bonds ............................................................................................................... 13
External Debt ........................................................................................................................... 13
Other Measures ....................................................................................................................... 13
4 EXPECTED RESULTS .................................................................................................................... 14
4.1 Current FPD Indicators ........................................................................................................... 14
4.2 FPD at the End of 2014 ............................................................................................................ 17
5 LONG TERM COMPOSITION AND FPD RISK MANAGEMENT ....................................... 19
5.1 FPD Over the Long Term ........................................................................................................ 19
5.2 Historical Evolution: Risk Reduction..................................................................................... 20
Market Risk .............................................................................................................................. 20
Refinancing Risk ...................................................................................................................... 22
6 FINAL CONSIDERATIONS .......................................................................................................... 24
7 ANNEX ............................................................................................................................................. 25
INDEX OF CHARTS
Chart 1: Objectives and Guidelines .................................................................................................... 8
Chart 2: FPD Maturities Profile ......................................................................................................... 9
Chart 3: Domestic Debt Auctions in 2014 ....................................................................................... 12
Chart 4: FPD Targets for 2014 ........................................................................................................... 17
Chart 5: Indicative Intervals of the Desired Long-Term FPD Composition ............................... 19
Chart 6: Schedule of Bond Auctions ................................................................................................. 25
INDEX OF FIGURES
Figure 1: FPD Maturities in 2014 ...................................................................................................... 10
Figure 2: National Treasury Borrowing Requirements .................................................................. 11
Figure 3: FPD in Relation to GDP ................................................................................................... 14
Figure 4: FPD and DFPD Bond Profile and EFPD Currency Profile ........................................... 15
Figure 5: Maturity Structure: FPD, DFPD and EFPD .................................................................... 16
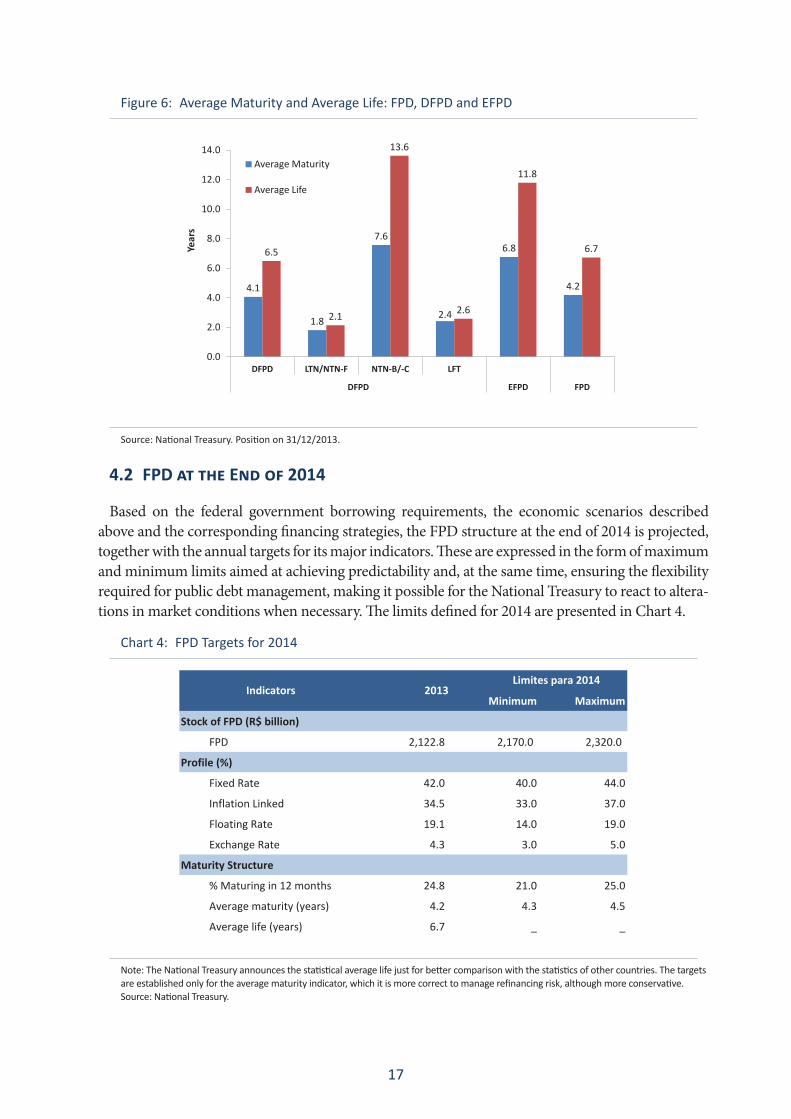
Figure 6: Average Maturity and Average Life: FPD, DFPD and EFPD ........................................ 17
Figure 7: FPD Profile .......................................................................................................................... 21
Figure 8: Refixing Risk: Debt to Mature in 12 Months plus Floating Rate Debt ........................ 22
Figure 9: FPD Maturing in 12 Months ............................................................................................. 23
Figure 10: Maturity Structure Evolution (DFPD) ........................................................................... 23
Figure 11: Average Maturity and Average Life (FPD) .................................................................... 24
7
1 INTRODUCTION
The objective of this Annual Borrowing Plan – ABP 2014 is to set out the objectives, guidelines, strategies and targets for Federal Public Debt – FPD management, including both the internal and external debts for which the federal government1 is liable in the current year. For the four-teenth consecutive year, the ABP is published as an instrument of planning, predictability and transparency regarding FPD financing policy.
The objective of the FPD management, coupled with a set of qualitative guidelines, as declared in Chart 1, is the main reference for the ABP. The main concern is to ensure that National Treasury measures adopted on domestic and international government bond markets and aimed at meet-ing the federal government’s borrowing requirements are based on the pursuit of an adequate balance between FPD costs and risks, while also stimulating smooth and efficient operation of the securities market.
In terms of ABP execution, one should note that the National Treasury will constantly moni-tor market conditions. In this way, in moments of adversity, alterations may be introduced into issuance policy so as to minimize government bond market volatility and guarantee an adequate balance between FPD costs and risks.
This document is distributed into five sections, aside from this introduction. Section two pres-ents a summarized description of the benchmark scenarios used in elaborating this ABP, together with federal government borrowing requirements for 2014. Following that, section three details the main lines of National Treasury borrowing strategy and the measures to be adopted in man-aging the debt during the current year. Following a description of the current FPD profile, expec-tations of results (in terms of intervals) for the end of 2014 are described in section 4, taking due account of the major FPD indicators. Information on the desired long-term composition of the debt, as well as an analysis of the risks derived from the FPD structure, are the theme of section 5. Final considerations are put forward in section 6.
1 FPD corresponds to the sum total of the Domestic Federal Public Debt - DFPD and the External Federal Public Debt - EFPD, the latter being composed of the securities debt and contractual debt. It should be stressed that all of the statistics presented in this document refer exclusively to debt held by the public and, therefore, do not encompass the debt held by the Central Bank, which information are available in the Annex of Monthly Reports of FPD in <https://www.tesouro.fazenda.gov.br/en/federal-public-debt/monthly-debt-report>.
8
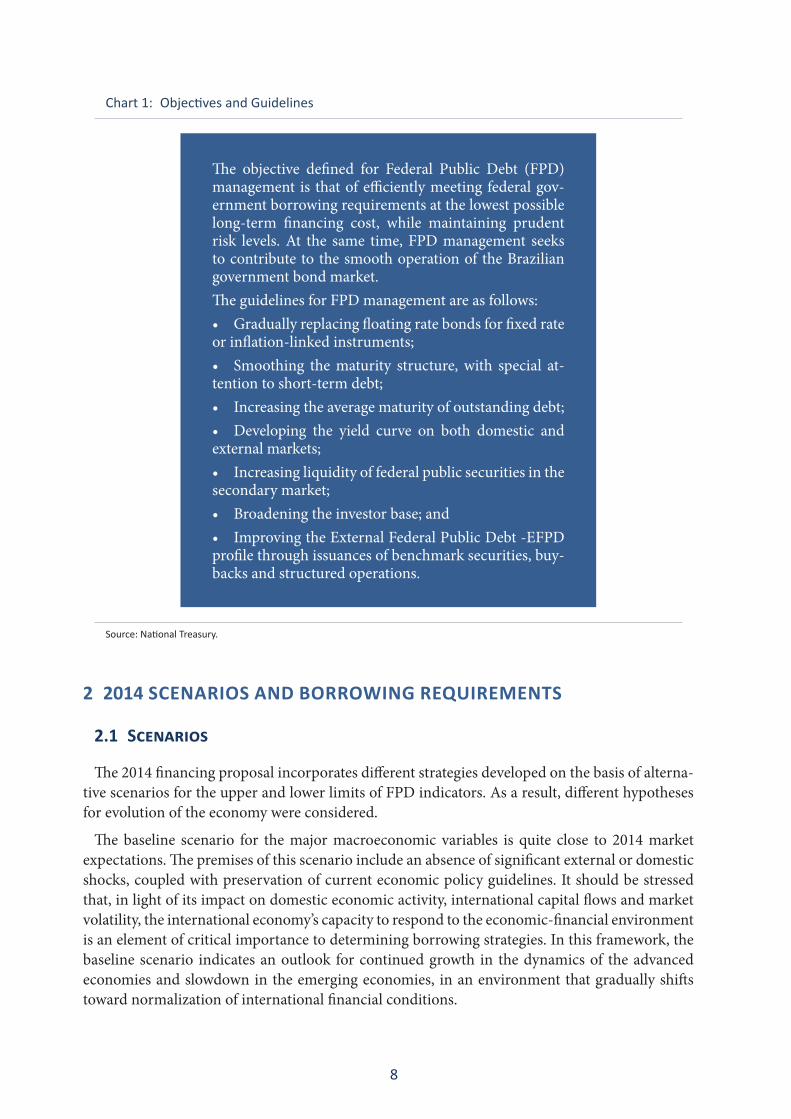
Chart 1: Objectives and Guidelines
The objective defined for Federal Public Debt (FPD) management is that of efficiently meeting federal gov-ernment borrowing requirements at the lowest possible long-term financing cost, while maintaining prudent risk levels. At the same time, FPD management seeks to contribute to the smooth operation of the Brazilian government bond market.The guidelines for FPD management are as follows:• Graduallyreplacingfloatingratebondsforfixedrateor inflation-linked instruments;• Smoothing thematurity structure,with special at-tention to short-term debt;• Increasingtheaveragematurityofoutstandingdebt;• Developing the yield curve on both domestic andexternal markets;• Increasingliquidityoffederalpublicsecuritiesinthesecondary market;• Broadeningtheinvestorbase;and• ImprovingtheExternalFederalPublicDebt-EFPDprofile through issuances of benchmark securities, buy-backs and structured operations.
Source: National Treasury.
2 2014 SCENARIOS AND BORROWING REQUIREMENTS
2.1 Scenarios
The 2014 financing proposal incorporates different strategies developed on the basis of alterna-tive scenarios for the upper and lower limits of FPD indicators. As a result, different hypotheses for evolution of the economy were considered.
The baseline scenario for the major macroeconomic variables is quite close to 2014 market expectations. The premises of this scenario include an absence of significant external or domestic shocks, coupled with preservation of current economic policy guidelines. It should be stressed that, in light of its impact on domestic economic activity, international capital flows and market volatility, the international economy’s capacity to respond to the economic-financial environment is an element of critical importance to determining borrowing strategies. In this framework, the baseline scenario indicates an outlook for continued growth in the dynamics of the advanced economies and slowdown in the emerging economies, in an environment that gradually shifts toward normalization of international financial conditions.
9
The alternative scenarios are rooted in varied dynamics for the domestic economy, associated with different hypotheses for the development of the global economy. The first alternative scenario incorporates the possibility of a more accentuated decline in global liquidity, with restrictive im-plications for domestic growth and economic policy. The second scenario utilizes the hypothesis of weakening global recovery, thus undermining the growth trajectory of the domestic economy. In this context, the possibilities of price decompression and a below potential pace of economic activity would lead to adoption of anti-cyclical economic measures.
Finally, macroeconomic scenarios marked by strong shocks or stress situations have not been included among the alternatives used for defining the limits resulting from this Annual Borrowing Plan.
2.2 Borrowing Requirements
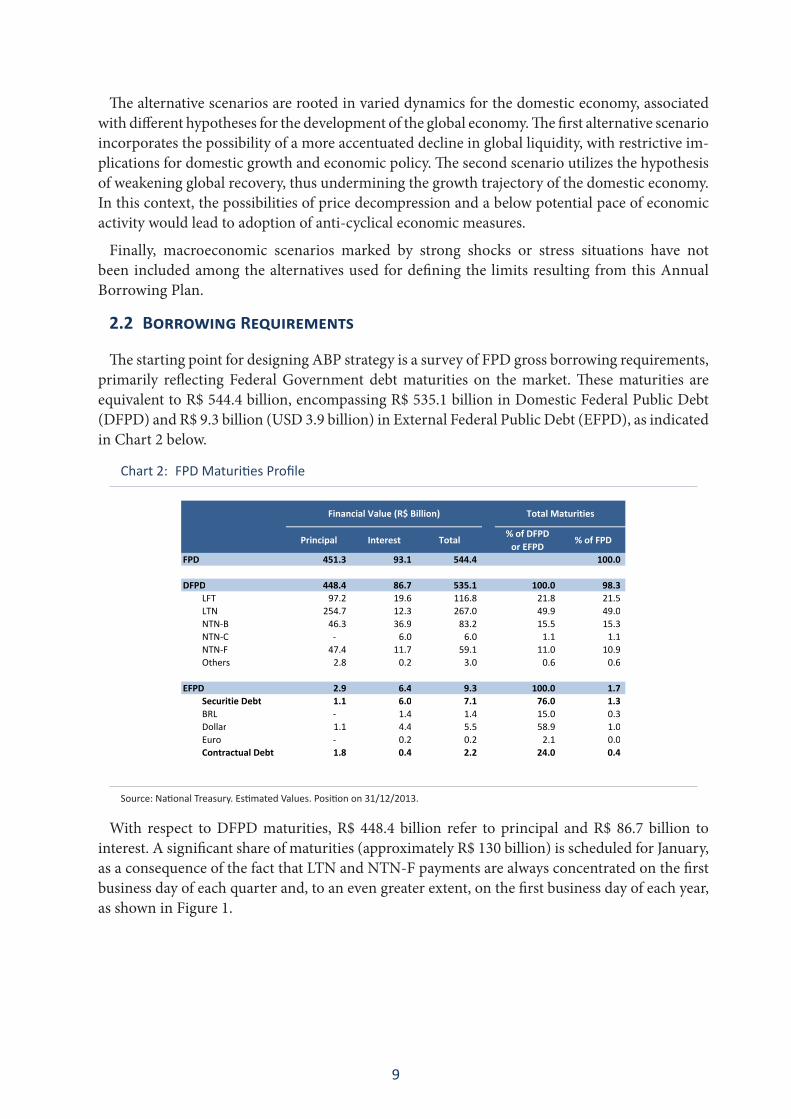
The starting point for designing ABP strategy is a survey of FPD gross borrowing requirements, primarily reflecting Federal Government debt maturities on the market. These maturities are equivalent to R$ 544.4 billion, encompassing R$ 535.1 billion in Domestic Federal Public Debt (DFPD) and R$ 9.3 billion (USD 3.9 billion) in External Federal Public Debt (EFPD), as indicated in Chart 2 below.
Chart 2: FPD Maturities Profile
Principal Interest Total% of DFPD
or EFPD% of FPD
FPD 451.3 93.1 544.4 100.0
DFPD 448.4 86.7 535.1 100.0 98.3 LFT 97.2 19.6 116.8 21.8 21.5 LTN 254.7 12.3 267.0 49.9 49.0 NTN-B 46.3 36.9 83.2 15.5 15.3 NTN-C - 6.0 6.0 1.1 1.1 NTN-F 47.4 11.7 59.1 11.0 10.9 Others 2.8 0.2 3.0 0.6 0.6
EFPD 2.9 6.4 9.3 100.0 1.7 Securitie Debt 1.1 6.0 7.1 76.0 1.3 BRL - 1.4 1.4 15.0 0.3 Dollar 1.1 4.4 5.5 58.9 1.0 Euro - 0.2 0.2 2.1 0.0 Contractual Debt 1.8 0.4 2.2 24.0 0.4
Total MaturitiesFinancial Value (R$ Billion)
Source: National Treasury. Estimated Values. Position on 31/12/2013.
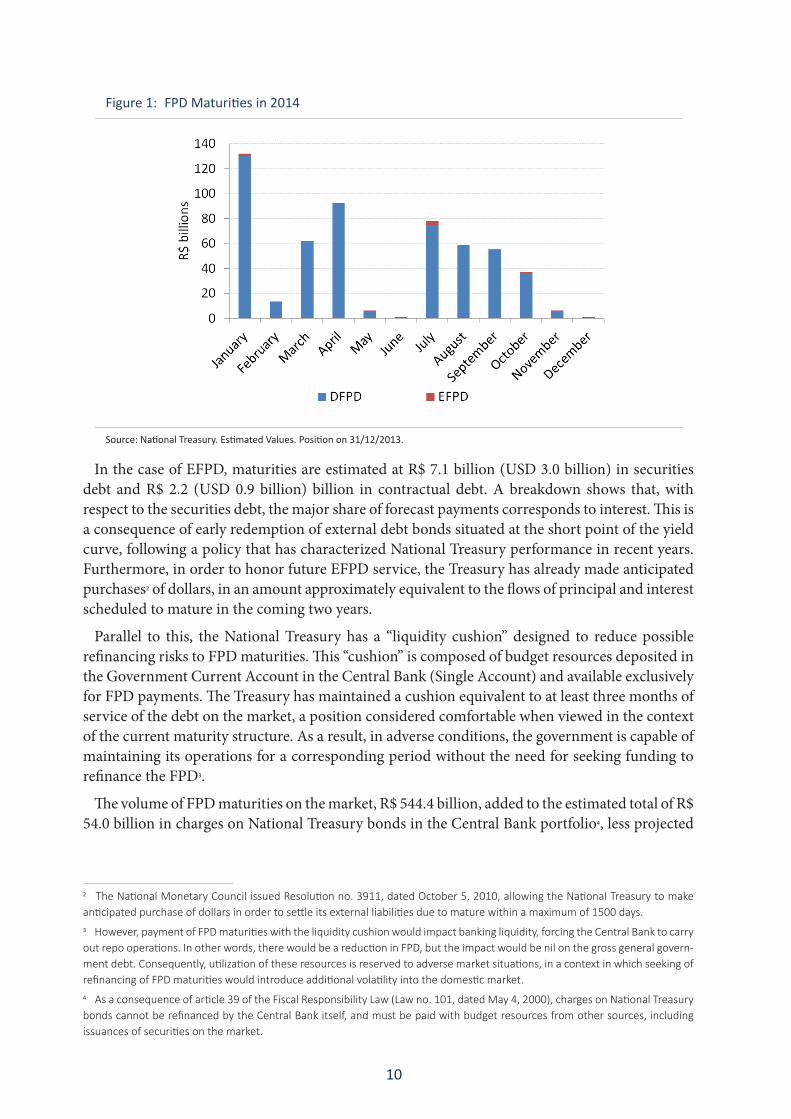
With respect to DFPD maturities, R$ 448.4 billion refer to principal and R$ 86.7 billion to interest. A significant share of maturities (approximately R$ 130 billion) is scheduled for January, as a consequence of the fact that LTN and NTN-F payments are always concentrated on the first business day of each quarter and, to an even greater extent, on the first business day of each year, as shown in Figure 1.
10
Figure 1: FPD Maturities in 2014
Source: National Treasury. Estimated Values. Position on 31/12/2013.
In the case of EFPD, maturities are estimated at R$ 7.1 billion (USD 3.0 billion) in securities debt and R$ 2.2 (USD 0.9 billion) billion in contractual debt. A breakdown shows that, with respect to the securities debt, the major share of forecast payments corresponds to interest. This is a consequence of early redemption of external debt bonds situated at the short point of the yield curve, following a policy that has characterized National Treasury performance in recent years. Furthermore, in order to honor future EFPD service, the Treasury has already made anticipated purchases2 of dollars, in an amount approximately equivalent to the flows of principal and interest scheduled to mature in the coming two years.
Parallel to this, the National Treasury has a “liquidity cushion” designed to reduce possible refinancing risks to FPD maturities. This “cushion” is composed of budget resources deposited in the Government Current Account in the Central Bank (Single Account) and available exclusively for FPD payments. The Treasury has maintained a cushion equivalent to at least three months of service of the debt on the market, a position considered comfortable when viewed in the context of the current maturity structure. As a result, in adverse conditions, the government is capable of maintaining its operations for a corresponding period without the need for seeking funding to refinance the FPD3.
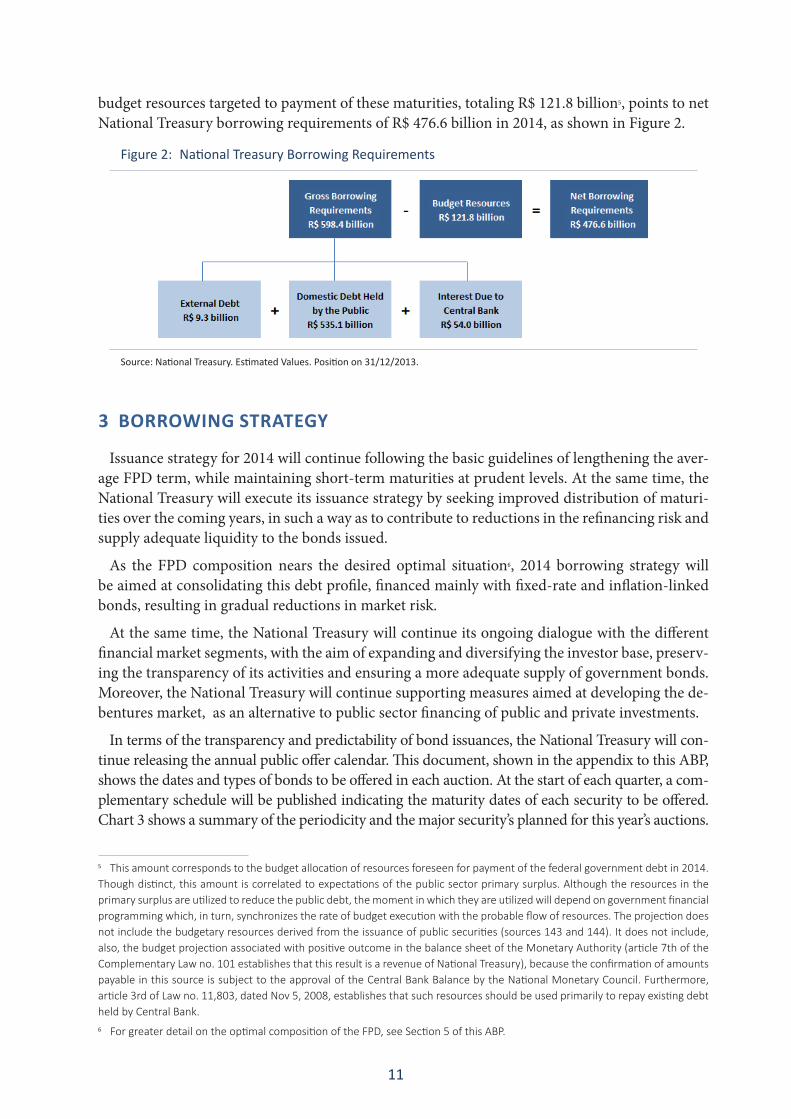
The volume of FPD maturities on the market, R$ 544.4 billion, added to the estimated total of R$ 54.0 billion in charges on National Treasury bonds in the Central Bank portfolio4, less projected
2 The National Monetary Council issued Resolution no. 3911, dated October 5, 2010, allowing the National Treasury to make anticipated purchase of dollars in order to settle its external liabilities due to mature within a maximum of 1500 days.3 However, payment of FPD maturities with the liquidity cushion would impact banking liquidity, forcing the Central Bank to carry out repo operations. In other words, there would be a reduction in FPD, but the impact would be nil on the gross general govern-ment debt. Consequently, utilization of these resources is reserved to adverse market situations, in a context in which seeking of refinancing of FPD maturities would introduce additional volatility into the domestic market.4 As a consequence of article 39 of the Fiscal Responsibility Law (Law no. 101, dated May 4, 2000), charges on National Treasury bonds cannot be refinanced by the Central Bank itself, and must be paid with budget resources from other sources, including issuances of securities on the market.
11
budget resources targeted to payment of these maturities, totaling R$ 121.8 billion5, points to net National Treasury borrowing requirements of R$ 476.6 billion in 2014, as shown in Figure 2.
Figure 2: National Treasury Borrowing Requirements
Source: National Treasury. Estimated Values. Position on 31/12/2013.
3 BORROWING STRATEGY
Issuance strategy for 2014 will continue following the basic guidelines of lengthening the aver-age FPD term, while maintaining short-term maturities at prudent levels. At the same time, the National Treasury will execute its issuance strategy by seeking improved distribution of maturi-ties over the coming years, in such a way as to contribute to reductions in the refinancing risk and supply adequate liquidity to the bonds issued.
As the FPD composition nears the desired optimal situation6, 2014 borrowing strategy will be aimed at consolidating this debt profile, financed mainly with fixed-rate and inflation-linked bonds, resulting in gradual reductions in market risk.
At the same time, the National Treasury will continue its ongoing dialogue with the different financial market segments, with the aim of expanding and diversifying the investor base, preserv-ing the transparency of its activities and ensuring a more adequate supply of government bonds. Moreover, the National Treasury will continue supporting measures aimed at developing the de-bentures market, as an alternative to public sector financing of public and private investments.
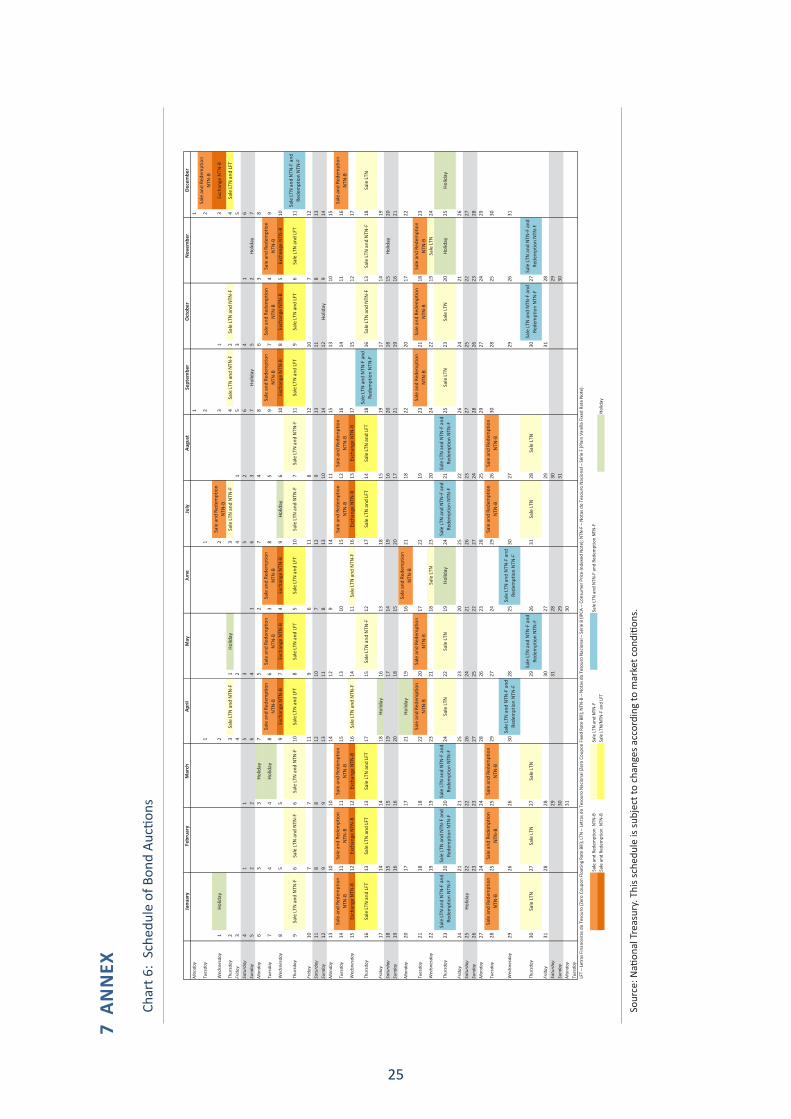
In terms of the transparency and predictability of bond issuances, the National Treasury will con-tinue releasing the annual public offer calendar. This document, shown in the appendix to this ABP, shows the dates and types of bonds to be offered in each auction. At the start of each quarter, a com-plementary schedule will be published indicating the maturity dates of each security to be offered. Chart 3 shows a summary of the periodicity and the major security’s planned for this year’s auctions.
5 This amount corresponds to the budget allocation of resources foreseen for payment of the federal government debt in 2014. Though distinct, this amount is correlated to expectations of the public sector primary surplus. Although the resources in the primary surplus are utilized to reduce the public debt, the moment in which they are utilized will depend on government financial programming which, in turn, synchronizes the rate of budget execution with the probable flow of resources. The projection does not include the budgetary resources derived from the issuance of public securities (sources 143 and 144). It does not include, also, the budget projection associated with positive outcome in the balance sheet of the Monetary Authority (article 7th of the Complementary Law no. 101 establishes that this result is a revenue of National Treasury), because the confirmation of amounts payable in this source is subject to the approval of the Central Bank Balance by the National Monetary Council. Furthermore, article 3rd of Law no. 11,803, dated Nov 5, 2008, establishes that such resources should be used primarily to repay existing debt held by Central Bank.6 For greater detail on the optimal composition of the FPD, see Section 5 of this ABP.
12
Fixed-rate Securities
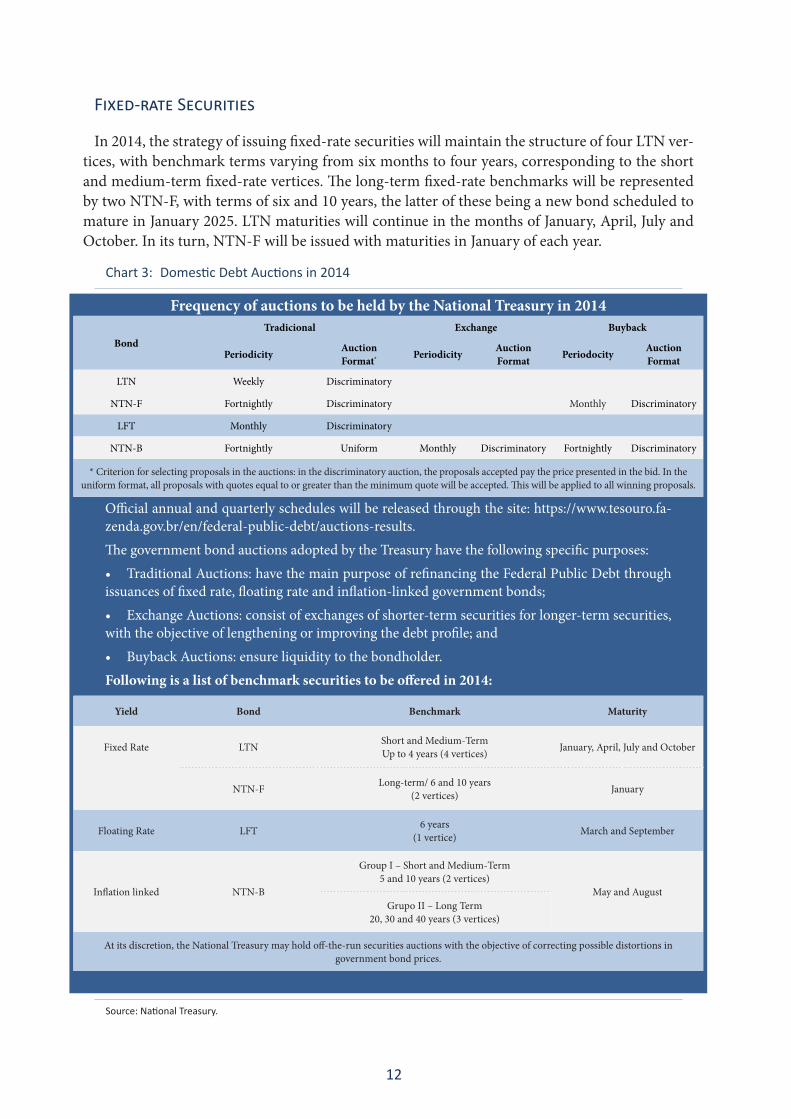
In 2014, the strategy of issuing fixed-rate securities will maintain the structure of four LTN ver-tices, with benchmark terms varying from six months to four years, corresponding to the short and medium-term fixed-rate vertices. The long-term fixed-rate benchmarks will be represented by two NTN-F, with terms of six and 10 years, the latter of these being a new bond scheduled to mature in January 2025. LTN maturities will continue in the months of January, April, July and October. In its turn, NTN-F will be issued with maturities in January of each year.
Chart 3: Domestic Debt Auctions in 2014
Frequency of auctions to be held by the National Treasury in 2014
BondTradicional Exchange Buyback
Periodicity Auction Format* Periodicity Auction
Format Periodocity Auction Format
LTN Weekly Discriminatory
NTN-F Fortnightly Discriminatory Monthly Discriminatory
LFT Monthly Discriminatory
NTN-B Fortnightly Uniform Monthly Discriminatory Fortnightly Discriminatory
* Criterion for selecting proposals in the auctions: in the discriminatory auction, the proposals accepted pay the price presented in the bid. In the uniform format, all proposals with quotes equal to or greater than the minimum quote will be accepted. This will be applied to all winning proposals.
Official annual and quarterly schedules will be released through the site: https://www.tesouro.fa-zenda.gov.br/en/federal-public-debt/auctions-results.The government bond auctions adopted by the Treasury have the following specific purposes:• TraditionalAuctions:havethemainpurposeofrefinancingtheFederalPublicDebtthroughissuances of fixed rate, floating rate and inflation-linked government bonds;• ExchangeAuctions:consistofexchangesofshorter-termsecuritiesforlonger-termsecurities,with the objective of lengthening or improving the debt profile; and• BuybackAuctions:ensureliquiditytothebondholder.Following is a list of benchmark securities to be offered in 2014:
Yield Bond Benchmark Maturity
Fixed Rate LTN Short and Medium-Term Up to 4 years (4 vertices) January, April, July and October
NTN-F Long-term/ 6 and 10 years(2 vertices) January
Floating Rate LFT 6 years(1 vertice) March and September
Inflation linked NTN-B
Group I – Short and Medium-Term 5 and 10 years (2 vertices)
May and AugustGrupo II – Long Term
20, 30 and 40 years (3 vertices)
At its discretion, the National Treasury may hold off-the-run securities auctions with the objective of correcting possible distortions in government bond prices.
Source: National Treasury.
13
The National Treasury strategy of supplying a volume of issuances of each type of bond that is sufficient to provide adequate liquidity in each vertex will be maintained in 2014. Simultaneously, these volumes are to be distributed in such a way as to guarantee that the maturity structure of the debt is smoothed. These factors will result in more efficient operation of the public bond market.
Inflation-Linked Bonds
Offers of NTN-B, which generate earnings according to the Broad National Consumer Price Index – IPCA, will take place fortnightly. In each fortnight sales auction, the bonds will be dis-tributed into two groups, according to their maturities. Group I will be composed of two bonds with terms of up to 10 years and Group II will have three vertices with longer terms.
Parallel to this, anticipated NTN-B buyback auctions will also take place fortnightly, while NTN-B exchange auctions will be held monthly.
Floating-Rate Bonds
In 2014, bonds linked to the Selic rate — LFT will be offered in monthly auctions, with maturi-ties in March and September. The average issuance maturity of these securities should be close to six years, remaining at a level above the average maturity of outstanding FPD.
External Debt
The National Treasury will continue its policy of improving the external yield curve in 2014, through qualitative issuances and early redemptions of bonds that are not benchmarks.
The EFPD strategy will be oriented by the following guidelines:
» Creation and improvement of benchmarks in the external market yield curve;
» Maintenance of the buyback program for bonds denominated in dollars (USD), euros (EUR) and real (BRL);
» Possibility of carrying out external liability management operations, aimed at enhancing the efficiency of the external yield curve; and
» Monitoring of the External Contractual Debt, in the pursuit of alternative operations that may generate financial gains for the National Treasury.
Other Measures
Aside from the public security issuance strategy described above, other measures are to be taken with the aim of achieving further improvement in the operations of the government bond market, mainly with respect to the secondary market, expansion and diversification of the inves-tor base, elimination of indexation of the economy to the overnight interest rate and development of the fixed income market as a source of private financing.
One of the National Treasury’s permanent concerns remains that of supporting development of fixed income benchmarks, such as the IMA — ANBIMA Market Index and its subindices, thus generating positive impacts on the composition and lengthening of government and private fixed rate bonds on the domestic market.
The recent regulating of Fixed Income Exchange Traded Funds by the Securities and Exchange Commission – CVM will make it possible to create new investment vehicles, with the aim of
14
seeking out opportunities for developing the secondary government bond market and its investor base, while eliminating indexing of financial assets to the overnight interest rate.
Shifting to another area of activity, the National Treasury may hold off-the-run security sales auctions, with the aim of correcting possible distortions in the prices of government bonds.
Finally, the Treasury will support projects aimed at preparing professionals and providing fi-nancial education to investors, will continue its policy of improving the market makers system and support utilization of electronic platforms, while prioritizing studies involving practices and products capable of contributing to the development of the Brazilian fixed income market.
4 EXPECTED RESULTS
4.1 Current FPD Indicators
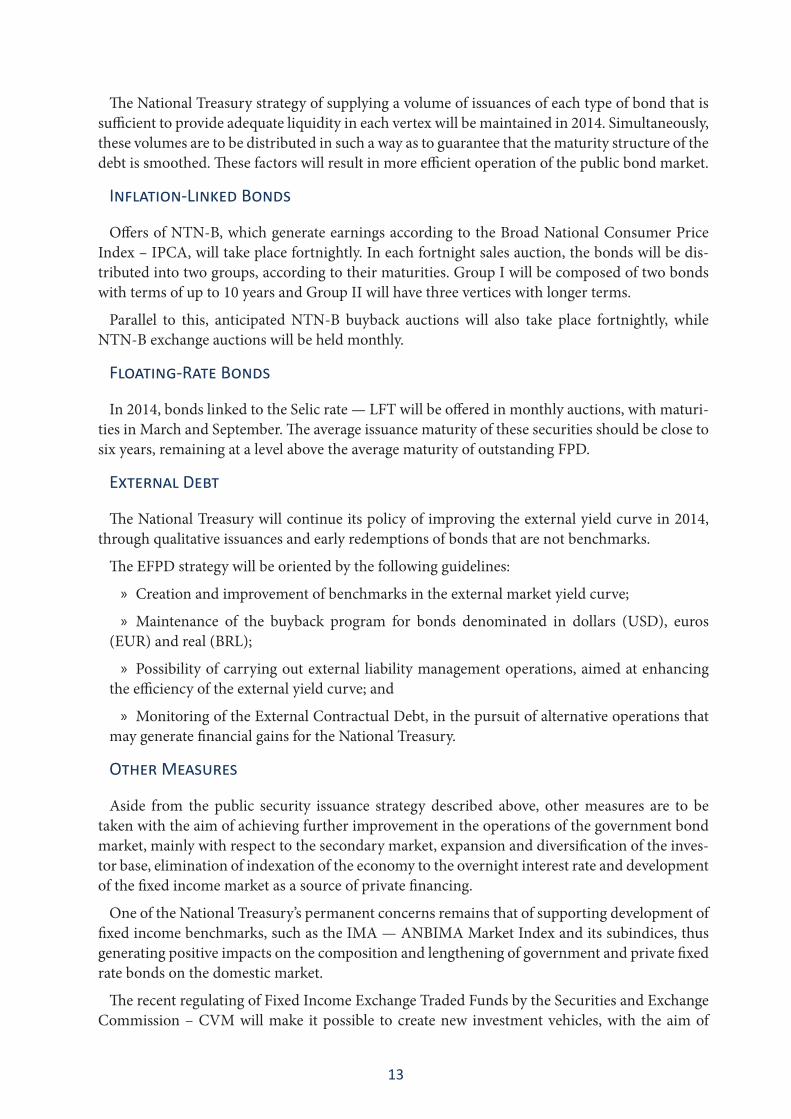
At the end of 2013, the FPD outstanding came to a total volume of R$ 2,122.8 billion, equivalent to 44.3% of GDP, with R$ 2028.1 billion (42.3% of GDP) in DFPD and R$ 94.7 billion (2.0% of GDP) in EFPD. As shown in Figure 3 below, the FPD has trended steadily downward as a propor-tion of GDP over the last 10 years. Another point that should be noted in this process is that the relative participation of the external debt in FPD has also declined as participation of nonresident investors in DFPD has increased.
Figure 3: FPD in Relation to GDP
Source: National Treasury.
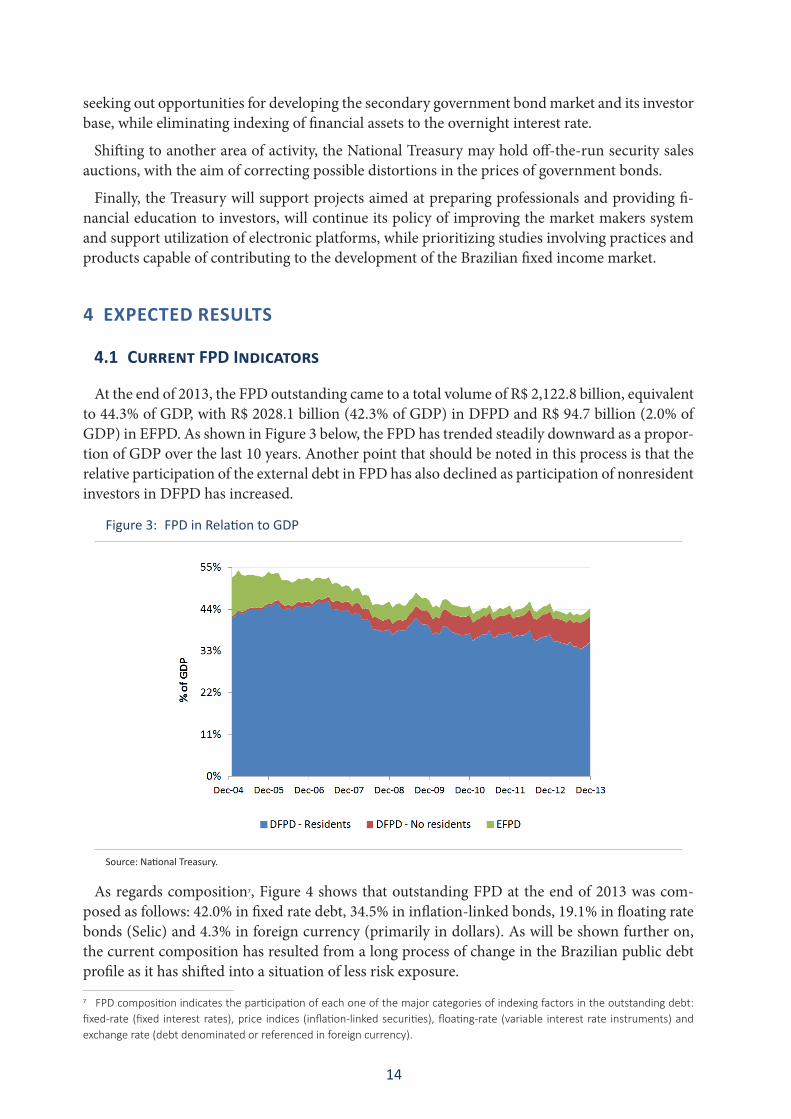
As regards composition7, Figure 4 shows that outstanding FPD at the end of 2013 was com-posed as follows: 42.0% in fixed rate debt, 34.5% in inflation-linked bonds, 19.1% in floating rate bonds (Selic) and 4.3% in foreign currency (primarily in dollars). As will be shown further on, the current composition has resulted from a long process of change in the Brazilian public debt profile as it has shifted into a situation of less risk exposure.
7 FPD composition indicates the participation of each one of the major categories of indexing factors in the outstanding debt: fixed-rate (fixed interest rates), price indices (inflation-linked securities), floating-rate (variable interest rate instruments) and exchange rate (debt denominated or referenced in foreign currency).
15
Figure 4: FPD and DFPD Bond Profile and EFPD Currency Profile
Source: National Treasury. Position on 31/12/2013.
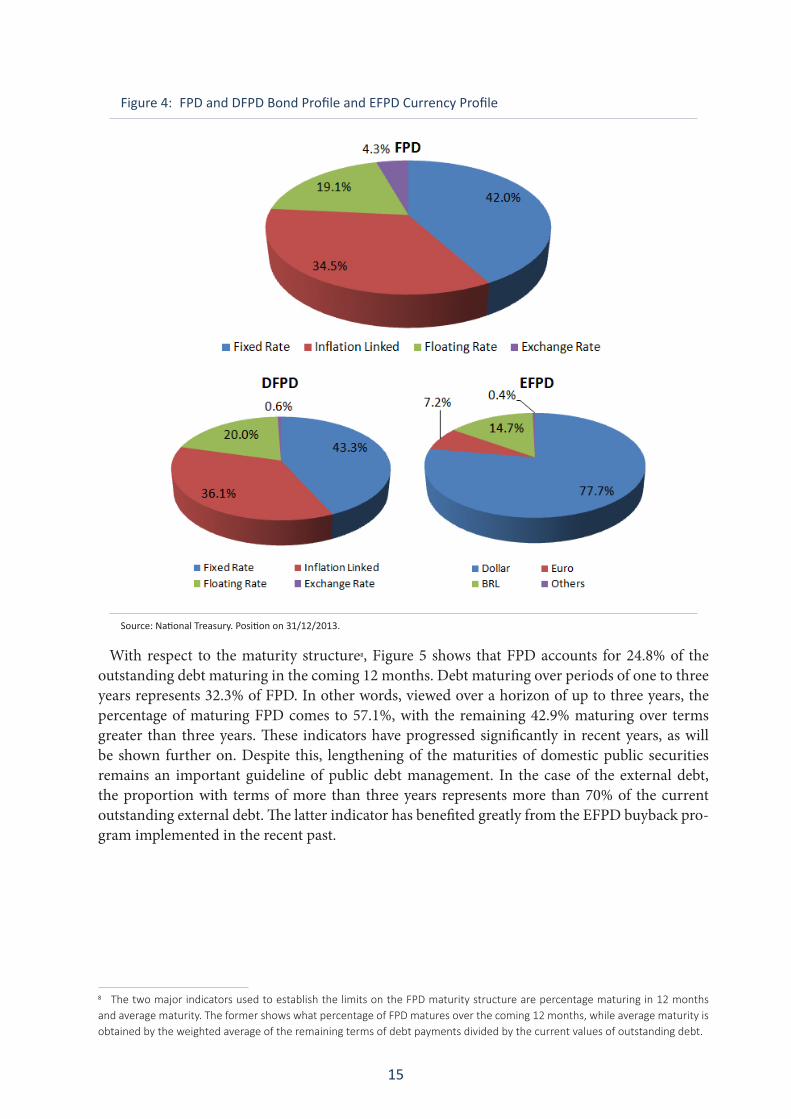
With respect to the maturity structure8, Figure 5 shows that FPD accounts for 24.8% of the outstanding debt maturing in the coming 12 months. Debt maturing over periods of one to three years represents 32.3% of FPD. In other words, viewed over a horizon of up to three years, the percentage of maturing FPD comes to 57.1%, with the remaining 42.9% maturing over terms greater than three years. These indicators have progressed significantly in recent years, as will be shown further on. Despite this, lengthening of the maturities of domestic public securities remains an important guideline of public debt management. In the case of the external debt, the proportion with terms of more than three years represents more than 70% of the current outstanding external debt. The latter indicator has benefited greatly from the EFPD buyback pro-gram implemented in the recent past.
8 The two major indicators used to establish the limits on the FPD maturity structure are percentage maturing in 12 months and average maturity. The former shows what percentage of FPD matures over the coming 12 months, while average maturity is obtained by the weighted average of the remaining terms of debt payments divided by the current values of outstanding debt.
16
Figure 5: Maturity Structure: FPD, DFPD and EFPD
Source: National Treasury. Position on 31/12/2013.
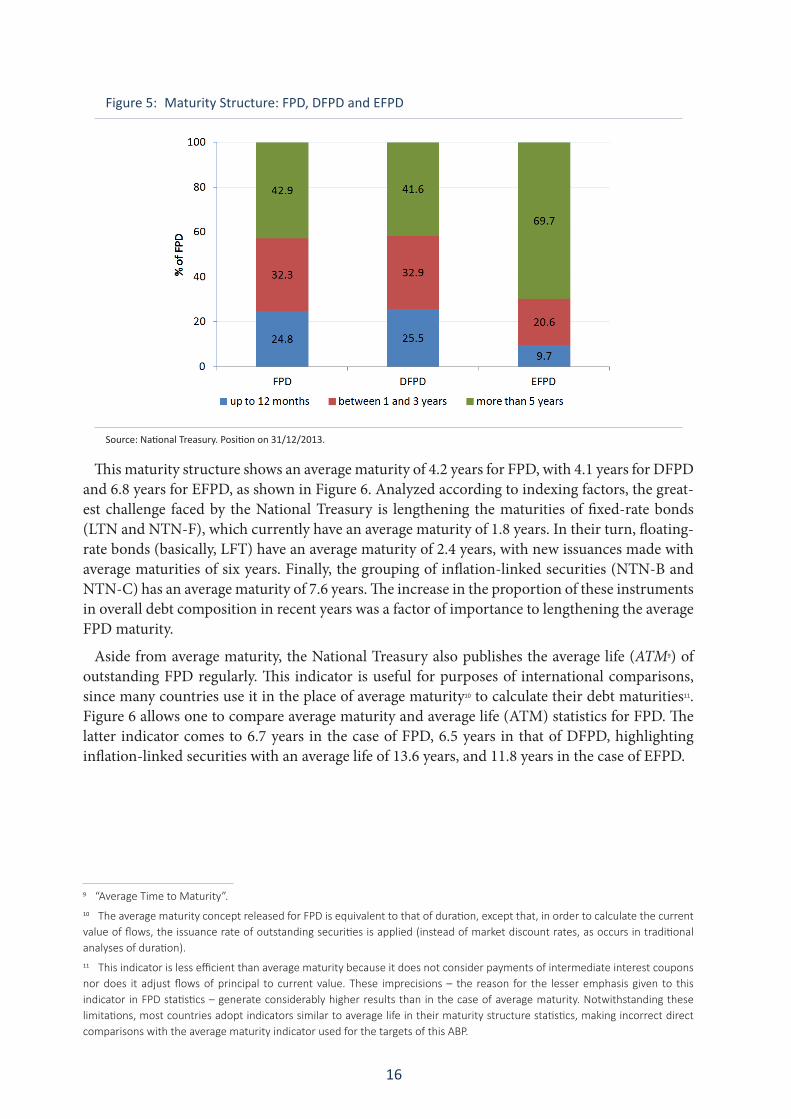
This maturity structure shows an average maturity of 4.2 years for FPD, with 4.1 years for DFPD and 6.8 years for EFPD, as shown in Figure 6. Analyzed according to indexing factors, the great-est challenge faced by the National Treasury is lengthening the maturities of fixed-rate bonds (LTN and NTN-F), which currently have an average maturity of 1.8 years. In their turn, floating-rate bonds (basically, LFT) have an average maturity of 2.4 years, with new issuances made with average maturities of six years. Finally, the grouping of inflation-linked securities (NTN-B and NTN-C) has an average maturity of 7.6 years. The increase in the proportion of these instruments in overall debt composition in recent years was a factor of importance to lengthening the average FPD maturity.
Aside from average maturity, the National Treasury also publishes the average life (ATM9) of outstanding FPD regularly. This indicator is useful for purposes of international comparisons, since many countries use it in the place of average maturity10 to calculate their debt maturities11. Figure 6 allows one to compare average maturity and average life (ATM) statistics for FPD. The latter indicator comes to 6.7 years in the case of FPD, 6.5 years in that of DFPD, highlighting inflation-linked securities with an average life of 13.6 years, and 11.8 years in the case of EFPD.
9 “Average Time to Maturity”.10 The average maturity concept released for FPD is equivalent to that of duration, except that, in order to calculate the current value of flows, the issuance rate of outstanding securities is applied (instead of market discount rates, as occurs in traditional analyses of duration).11 This indicator is less efficient than average maturity because it does not consider payments of intermediate interest coupons nor does it adjust flows of principal to current value. These imprecisions – the reason for the lesser emphasis given to this indicator in FPD statistics – generate considerably higher results than in the case of average maturity. Notwithstanding these limitations, most countries adopt indicators similar to average life in their maturity structure statistics, making incorrect direct comparisons with the average maturity indicator used for the targets of this ABP.
17
Figure 6: Average Maturity and Average Life: FPD, DFPD and EFPD
4.1
1.8
7.6
2.4
6.8
4.2
6.5
2.1
13.6
2.6
11.8
6.7
0.0
2.0
4.0
6.0
8.0
10.0
12.0
14.0
DFPD LTN/NTN-F NTN-B/-C LFT
DFPD EFPD FPD
Year
s
Average Maturity
Average Life
Source: National Treasury. Position on 31/12/2013.
4.2 FPD at the End of 2014
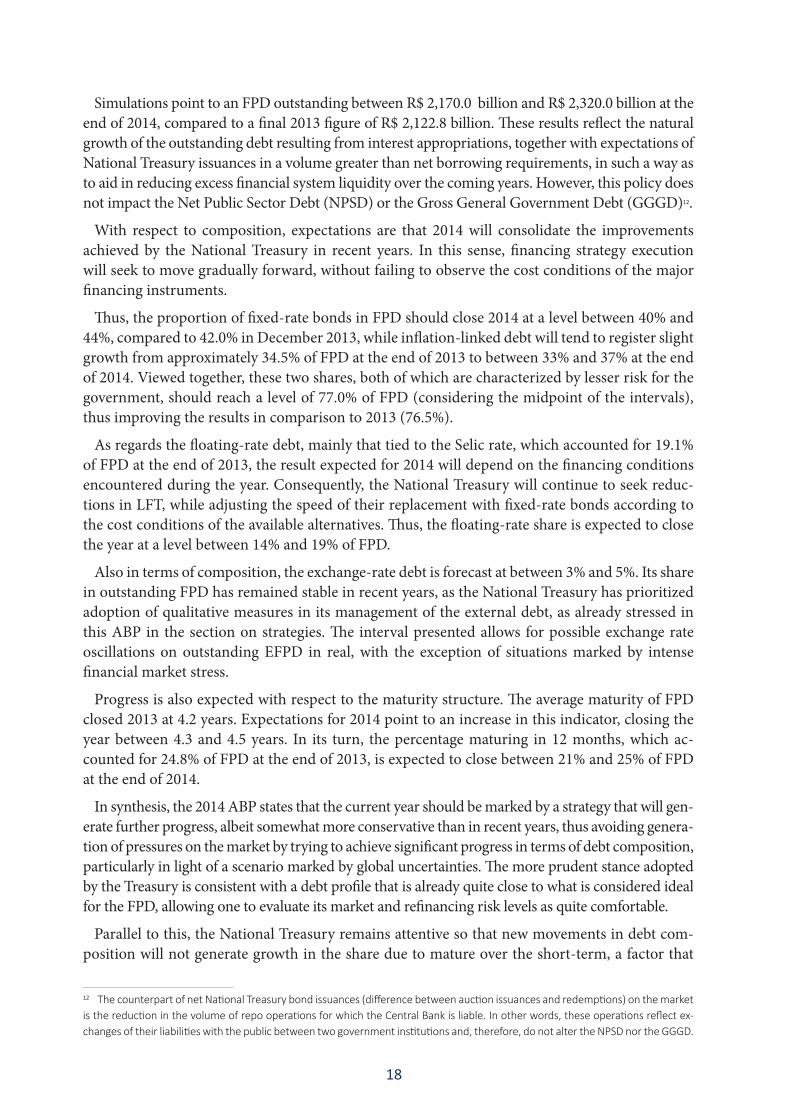
Based on the federal government borrowing requirements, the economic scenarios described above and the corresponding financing strategies, the FPD structure at the end of 2014 is projected, together with the annual targets for its major indicators. These are expressed in the form of maximum and minimum limits aimed at achieving predictability and, at the same time, ensuring the flexibility required for public debt management, making it possible for the National Treasury to react to altera-tions in market conditions when necessary. The limits defined for 2014 are presented in Chart 4.
Chart 4: FPD Targets for 2014
Minimum Maximum
Stock of FPD (R$ billion)
FPD 2,122.8 2,170.0 2,320.0
Profile (%)
Fixed Rate 42.0 40.0 44.0
Inflation Linked 34.5 33.0 37.0
Floating Rate 19.1 14.0 19.0
Exchange Rate 4.3 3.0 5.0
Maturity Structure
% Maturing in 12 months 24.8 21.0 25.0
Average maturity (years) 4.2 4.3 4.5
Average life (years) 6.7 _ _
Indicators 2013 Limites para 2014
Note: The National Treasury announces the statistical average life just for better comparison with the statistics of other countries. The targets are established only for the average maturity indicator, which it is more correct to manage refinancing risk, although more conservative. Source: National Treasury.
18
Simulations point to an FPD outstanding between R$ 2,170.0 billion and R$ 2,320.0 billion at the end of 2014, compared to a final 2013 figure of R$ 2,122.8 billion. These results reflect the natural growth of the outstanding debt resulting from interest appropriations, together with expectations of National Treasury issuances in a volume greater than net borrowing requirements, in such a way as to aid in reducing excess financial system liquidity over the coming years. However, this policy does not impact the Net Public Sector Debt (NPSD) or the Gross General Government Debt (GGGD)12.
With respect to composition, expectations are that 2014 will consolidate the improvements achieved by the National Treasury in recent years. In this sense, financing strategy execution will seek to move gradually forward, without failing to observe the cost conditions of the major financing instruments.
Thus, the proportion of fixed-rate bonds in FPD should close 2014 at a level between 40% and 44%, compared to 42.0% in December 2013, while inflation-linked debt will tend to register slight growth from approximately 34.5% of FPD at the end of 2013 to between 33% and 37% at the end of 2014. Viewed together, these two shares, both of which are characterized by lesser risk for the government, should reach a level of 77.0% of FPD (considering the midpoint of the intervals), thus improving the results in comparison to 2013 (76.5%).
As regards the floating-rate debt, mainly that tied to the Selic rate, which accounted for 19.1% of FPD at the end of 2013, the result expected for 2014 will depend on the financing conditions encountered during the year. Consequently, the National Treasury will continue to seek reduc-tions in LFT, while adjusting the speed of their replacement with fixed-rate bonds according to the cost conditions of the available alternatives. Thus, the floating-rate share is expected to close the year at a level between 14% and 19% of FPD.
Also in terms of composition, the exchange-rate debt is forecast at between 3% and 5%. Its share in outstanding FPD has remained stable in recent years, as the National Treasury has prioritized adoption of qualitative measures in its management of the external debt, as already stressed in this ABP in the section on strategies. The interval presented allows for possible exchange rate oscillations on outstanding EFPD in real, with the exception of situations marked by intense financial market stress.
Progress is also expected with respect to the maturity structure. The average maturity of FPD closed 2013 at 4.2 years. Expectations for 2014 point to an increase in this indicator, closing the year between 4.3 and 4.5 years. In its turn, the percentage maturing in 12 months, which ac-counted for 24.8% of FPD at the end of 2013, is expected to close between 21% and 25% of FPD at the end of 2014.
In synthesis, the 2014 ABP states that the current year should be marked by a strategy that will gen-erate further progress, albeit somewhat more conservative than in recent years, thus avoiding genera-tion of pressures on the market by trying to achieve significant progress in terms of debt composition, particularly in light of a scenario marked by global uncertainties. The more prudent stance adopted by the Treasury is consistent with a debt profile that is already quite close to what is considered ideal for the FPD, allowing one to evaluate its market and refinancing risk levels as quite comfortable.
Parallel to this, the National Treasury remains attentive so that new movements in debt com-position will not generate growth in the share due to mature over the short-term, a factor that
12 The counterpart of net National Treasury bond issuances (difference between auction issuances and redemptions) on the market is the reduction in the volume of repo operations for which the Central Bank is liable. In other words, these operations reflect ex-changes of their liabilities with the public between two government institutions and, therefore, do not alter the NPSD nor the GGGD.
19
could occur as a result of a strategy that prioritizes issuances of short-term fixed-rate securities. However, viewed over a temporal horizon greater than that of this ABP, one can envisage stronger movement in line with FPD guidelines.
5 LONG TERM COMPOSITION AND FPD RISK MANAGEMENT
5.1 FPD Over the Long Term
FPD risk management should be seen within a broader perspective of strategic planning that goes beyond the temporal horizon covered by the ABP and that, among other aspects, pursues responses to questions related to its desired composition over the long-term, taking due account of indexing factors and maturity structure, while also seeking more complete mapping of the op-portunities and restrictions on the path toward the desired debt structure, from the point of view of the balance between costs and risks.
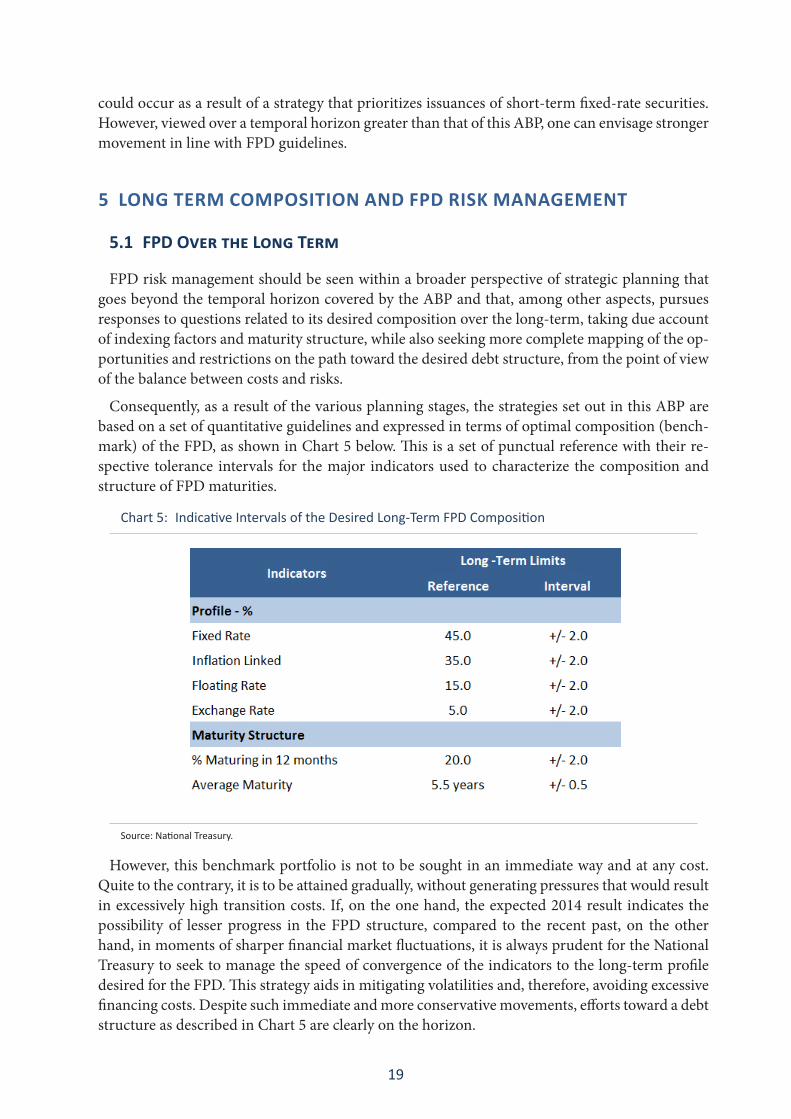
Consequently, as a result of the various planning stages, the strategies set out in this ABP are based on a set of quantitative guidelines and expressed in terms of optimal composition (bench-mark) of the FPD, as shown in Chart 5 below. This is a set of punctual reference with their re-spective tolerance intervals for the major indicators used to characterize the composition and structure of FPD maturities.
Chart 5: Indicative Intervals of the Desired Long-Term FPD Composition
Source: National Treasury.
However, this benchmark portfolio is not to be sought in an immediate way and at any cost. Quite to the contrary, it is to be attained gradually, without generating pressures that would result in excessively high transition costs. If, on the one hand, the expected 2014 result indicates the possibility of lesser progress in the FPD structure, compared to the recent past, on the other hand, in moments of sharper financial market fluctuations, it is always prudent for the National Treasury to seek to manage the speed of convergence of the indicators to the long-term profile desired for the FPD. This strategy aids in mitigating volatilities and, therefore, avoiding excessive financing costs. Despite such immediate and more conservative movements, efforts toward a debt structure as described in Chart 5 are clearly on the horizon.

20
5.2 Historical Evolution: Risk Reduction
The historic evolution of FPD indicators reveals that a long path has already been traveled in the direction of the optimal composition. The following analysis will focus on two dimensions of FPD risk management: market risk, viewed in terms of debt composition, and refinancing risk, evaluated on the basis of the maturity structure.
Market risk refers to the possibility of raising the outstanding debt as a result of fluctuations in the economic variables that impact the costs of public securities, such as alterations in short-term interest rates, exchange rates and inflation, or in the yield curve. In its turn, refinancing risk corresponds to situations in which, when attempting to refinance its debt maturing on the market, the National Treasury may encounter adverse conditions that demand high issuance costs or, in extreme cases, in which the Treasury is unable to obtain funding sufficient to honor its commitments.
Market Risk
FPD market risk has been diminishing as a result of alterations in the composition of the out-standing debt by indexing factors, particularly reductions in those with more volatile costs such as LFT and debt tied to exchange rates. In contrast to this, for more than a decade the National Treasury has clearly prioritized increased participation of fixed-rate and inflation-linked bonds in the overall debt.
In the case of inflation-linked securities, their costs are variable and, therefore, subject to mar-ket risk. However, in this case, we have identified advantages from the point of view of overall risk management for the public debt. One aspect to be considered is that the impact of inflation on the outstanding volume of this debt is only nominal, and not on its real value measured in relation to GDP. Another point is that a large share of government revenues bears a positive correlation with inflation, thus providing a hedge for this share of the debt. A third element that minimizes risks is that provided by the inflation targeting system, to the extent in which one expects that the index utilized as reference13 will remain within a limited range of values, with relatively little volatility, compared to other financial variables.
Evolution of composition in the direction of lesser risk can be noted in Figure 7. In 2002, the share of floating rate debt accounted for 42.4% of FPD, while exchange rate debt accounted for 45.8% of the FPD. By the end of 2014, utilizing the midpoint of the targets set out in this ABP, these participation levels will have been dropped to 16.5% and 4.0% of FPD, respectively. In con-trast, taken as a whole, the fixed-rate and inflation-linked share is expected to reach 77% in 2014 (compared to 11.8% in 2002), thus further consolidating the progress achieved in recent years.
Interpretation of these numbers clearly suggests that the composition of the FPD by indexing factors is already quite close to that desired for the long-term. One also notes that this change has occurred gradually. Initially, priority was giving to reducing exchange rate risk. Only more recently were efforts intensified to reduce the percentage of floating-rate bonds, particularly LFT. The advances already achieved in this direction have now made it possible for the National Treasury to administer the pace of LFT substitution with fixed-rate securities, based on the cost and term conditions of the latter instruments.
13 In the case of Brazil, the index used to monitor the inflation target is the IPCA, which is the indexing factor of approximately 90% of the share of FPD linked to inflation.

21
Figure 7: FPD Profile
Source: National Treasury. The 2014 projections are based on the midpoint of the indicative limits of this ABP.
In elaboration of FPD financing strategies, one concern has been to avoid the possibility of changes in the FPD composition resulting in increased concentration of the debt maturing over the short-term, since this would worsen refinancing risk. In this framework, aside from the advantages already cited, inflation-linked bonds are issued with typically long maturities, thus contributing to lengthening of the average FPD maturity and smoothing its maturities over time. In this way, the inflation-linked debt stands as an important option to overall FPD risk manage-ment, including both market and refinancing risks.
One metric that seeks to conjugate the effects of changes in debt composition and its maturity profile is the refixing risk. This indicator results from the sum total of the entire debt scheduled to mature in 12 months and the share of floating-rate debt maturing over periods greater than 12 months or, in other words, it is the total debt with costs to be renewed over a horizon of one year, in the case of alterations in interest rates during that period.
Consequently, the refixing risk is a measurement of FPD sensitivity to short-term fluctuations in the Selic rate, aside from reflecting a possible trade-off between market risk and refinancing risk. The indicator would evolve in a negative manner if one were to adopt a strategy marked by substitution of LFT with a high volume of very short-term instruments. Therefore, it is seen to be a more conservative indicator in comparison to the simple share of a certain type of indexing in debt composition.
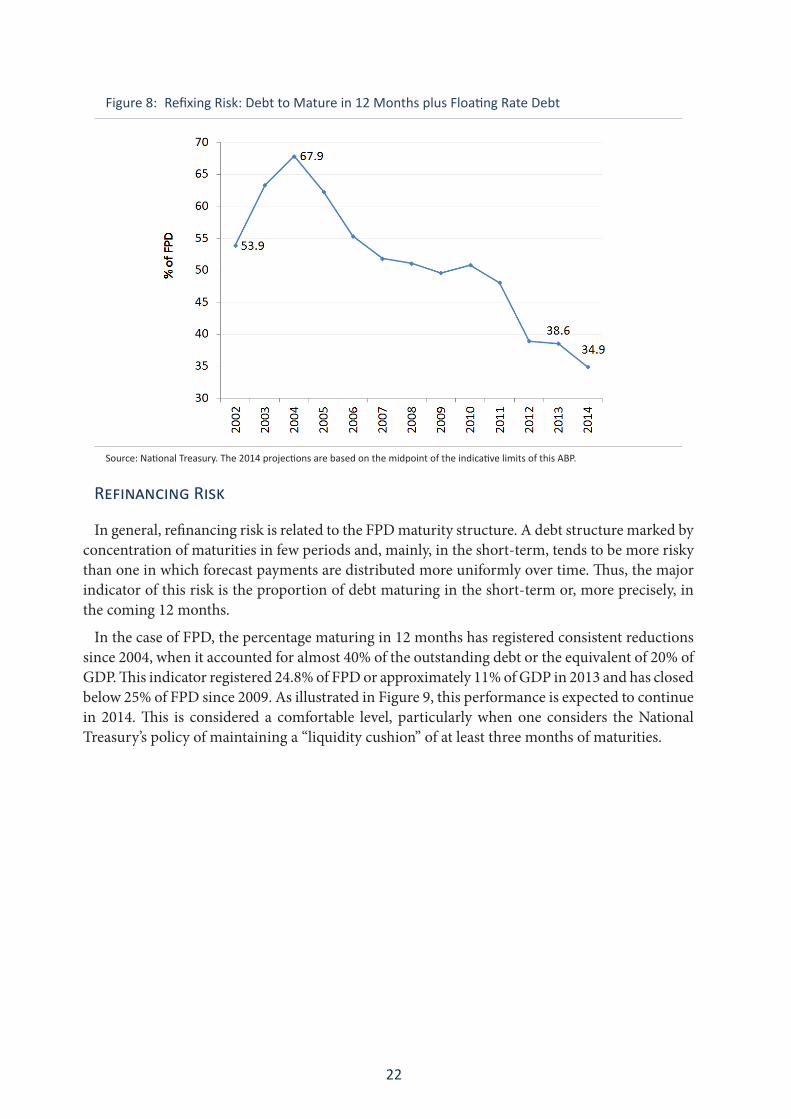
The downward trajectory of the refixing risk as a proportion of FPD shows that the National Treasury has been successful in its strategy of contributing to reductions in indexation of the economy to the overnight interest rate, without compromising the FPD maturity structure. It is expected that this trajectory will continue in 2014, as shown in Figure 8 below.
22
Figure 8: Refixing Risk: Debt to Mature in 12 Months plus Floating Rate Debt
Source: National Treasury. The 2014 projections are based on the midpoint of the indicative limits of this ABP.
Refinancing Risk
In general, refinancing risk is related to the FPD maturity structure. A debt structure marked by concentration of maturities in few periods and, mainly, in the short-term, tends to be more risky than one in which forecast payments are distributed more uniformly over time. Thus, the major indicator of this risk is the proportion of debt maturing in the short-term or, more precisely, in the coming 12 months.
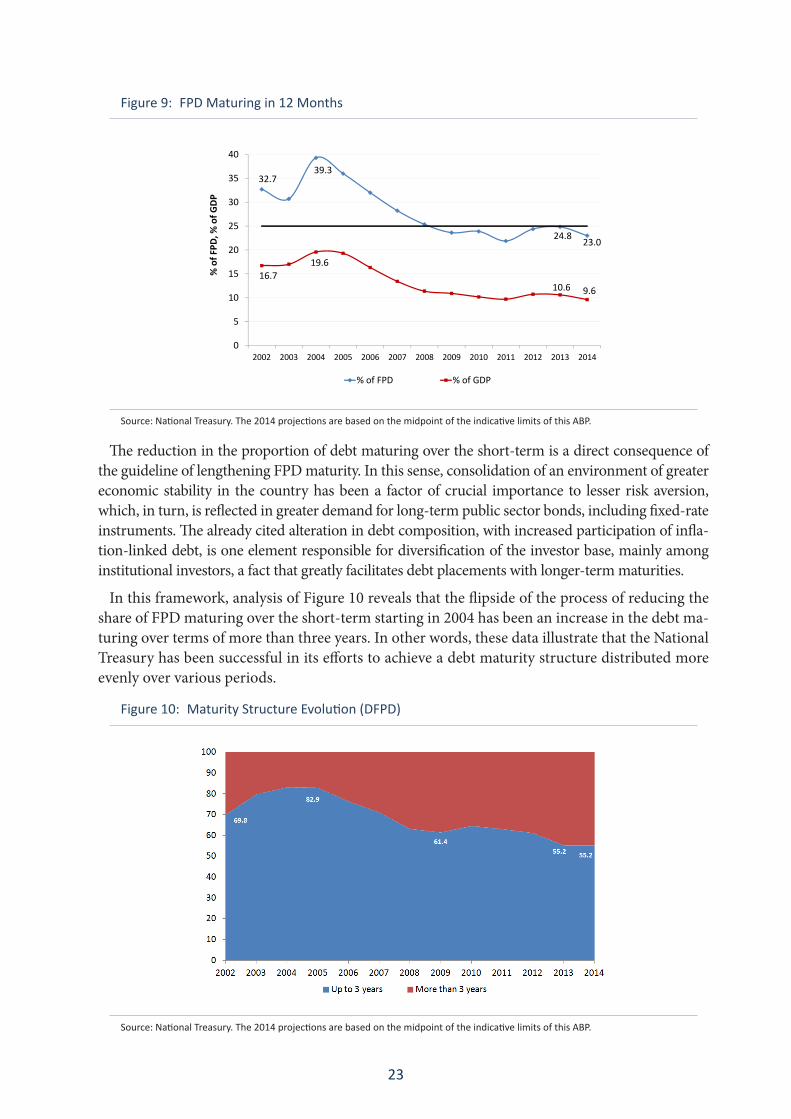
In the case of FPD, the percentage maturing in 12 months has registered consistent reductions since 2004, when it accounted for almost 40% of the outstanding debt or the equivalent of 20% of GDP. This indicator registered 24.8% of FPD or approximately 11% of GDP in 2013 and has closed below 25% of FPD since 2009. As illustrated in Figure 9, this performance is expected to continue in 2014. This is considered a comfortable level, particularly when one considers the National Treasury’s policy of maintaining a “liquidity cushion” of at least three months of maturities.
23
Figure 9: FPD Maturing in 12 Months
32.739.3
24.8 23.0
16.719.6
10.615
20
25
30
35
40
% o
f FPD
, % o
f GDP
10.6 9.6
0
5
10
2002 2003 2004 2005 2006 2007 2008 2009 2010 2011 2012 2013 2014
% of FPD % of GDP
Source: National Treasury. The 2014 projections are based on the midpoint of the indicative limits of this ABP.
The reduction in the proportion of debt maturing over the short-term is a direct consequence of the guideline of lengthening FPD maturity. In this sense, consolidation of an environment of greater economic stability in the country has been a factor of crucial importance to lesser risk aversion, which, in turn, is reflected in greater demand for long-term public sector bonds, including fixed-rate instruments. The already cited alteration in debt composition, with increased participation of infla-tion-linked debt, is one element responsible for diversification of the investor base, mainly among institutional investors, a fact that greatly facilitates debt placements with longer-term maturities.
In this framework, analysis of Figure 10 reveals that the flipside of the process of reducing the share of FPD maturing over the short-term starting in 2004 has been an increase in the debt ma-turing over terms of more than three years. In other words, these data illustrate that the National Treasury has been successful in its efforts to achieve a debt maturity structure distributed more evenly over various periods.
Figure 10: Maturity Structure Evolution (DFPD)
Source: National Treasury. The 2014 projections are based on the midpoint of the indicative limits of this ABP.
24
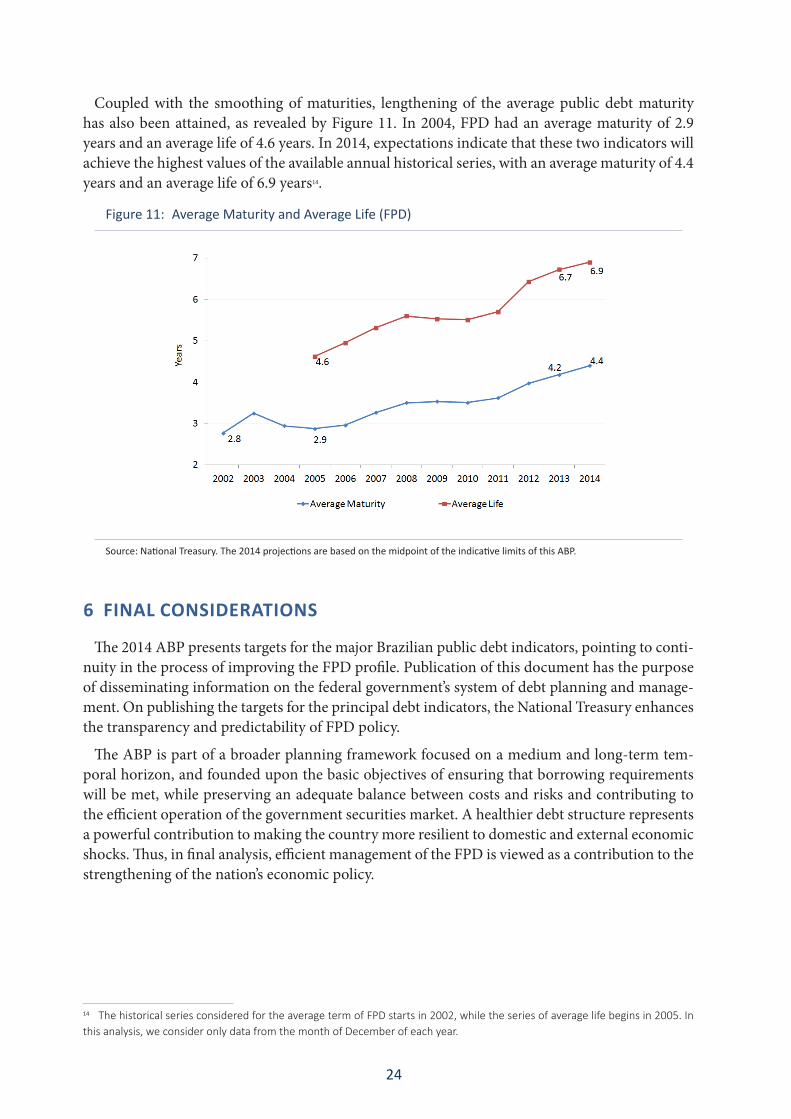
Coupled with the smoothing of maturities, lengthening of the average public debt maturity has also been attained, as revealed by Figure 11. In 2004, FPD had an average maturity of 2.9 years and an average life of 4.6 years. In 2014, expectations indicate that these two indicators will achieve the highest values of the available annual historical series, with an average maturity of 4.4 years and an average life of 6.9 years14.
Figure 11: Average Maturity and Average Life (FPD)
Source: National Treasury. The 2014 projections are based on the midpoint of the indicative limits of this ABP.
6 FINAL CONSIDERATIONS
The 2014 ABP presents targets for the major Brazilian public debt indicators, pointing to conti-nuity in the process of improving the FPD profile. Publication of this document has the purpose of disseminating information on the federal government’s system of debt planning and manage-ment. On publishing the targets for the principal debt indicators, the National Treasury enhances the transparency and predictability of FPD policy.
The ABP is part of a broader planning framework focused on a medium and long-term tem-poral horizon, and founded upon the basic objectives of ensuring that borrowing requirements will be met, while preserving an adequate balance between costs and risks and contributing to the efficient operation of the government securities market. A healthier debt structure represents a powerful contribution to making the country more resilient to domestic and external economic shocks. Thus, in final analysis, efficient management of the FPD is viewed as a contribution to the strengthening of the nation’s economic policy.
14 The historical series considered for the average term of FPD starts in 2002, while the series of average life begins in 2005. In this analysis, we consider only data from the month of December of each year.
25
7 A
NN
EX
Char
t 6:
Sche
dule
of B
ond
Aucti
ons
NA
TIO
NA
L TR
EASU
RY
OFF
ICIA
L N
OTI
CE
DO
MES
TIC
DEB
T A
UC
TIO
NS
CA
LEN
DA
R
The
Nat
iona
l Tre
asur
y he
reby
est
ablis
hes t
he sc
hedu
le o
f dom
estic
deb
t iss
uanc
es fo
r 201
4:
Janu
ary
Februa
ryMarch
April
May
June
July
August
Septem
ber
Octob
erNovem
ber
Decembe
rMon
day
11
Tuesda
y1
12
2Sa
le a
nd R
edem
ptio
n N
TN-B
Wed
snesda
y1
Holid
ay2
2Sa
le a
nd R
edem
ptio
n N
TN-B
3
13
Exch
ange
NTN
-B
Thursday
23
Sale
LTN
and
NTN
-F1
Holid
ay3
Sale
LTN
and
NTN
-F4
Sale
LTN
and
NTN
-F2
Sale
LTN
and
NTN
-F4
Sale
LTN
and
LFT
Friday
34
24
15
35
Saturday
41
15
35
26
41
6Sund
ay5
22
64
16
37
Holid
ay5
2Ho
liday
7Mon
day
63
3Ho
liday
75
27
48
63
8
Tuesda
y7
44
Holid
ay8
Sale
and
Red
empt
ion
NTN
-B
6Sa
le a
nd R
edem
ptio
n N
TN-B
3
Sale
and
Red
empt
ion
NTN
-B
85
9Sa
le a
nd R
edem
ptio
n N
TN-B
7
Sale
and
Red
empt
ion
NTN
-B
4Sa
le a
nd R
edem
ptio
n N
TN-B
9
Wed
snesda
y8
55
9Ex
chan
ge N
TN-B
7Ex
chan
ge N
TN-B
4Ex
chan
ge N
TN-B
9Ho
liday
610
Exch
ange
NTN
-B8
Exch
ange
NTN
-B5
Exch
ange
NTN
-B10
Thursday
9Sa
le L
TN a
nd N
TN-F
6Sa
le L
TN a
nd N
TN-F
6Sa
le L
TN a
nd N
TN-F
10Sa
le L
TN a
nd L
FT8
Sale
LTN
and
LFT
5Sa
le L
TN a
nd L
FT10
Sale
LTN
and
NTN
-F7
Sale
LTN
and
NTN
-F11
Sale
LTN
and
LFT
9Sa
le L
TN a
nd L
FT6
Sale
LTN
and
LFT
11Sa
le L
TN a
nd N
TN-F
and
Re
dem
ptio
n N
TN-F
Friday
107
711
96
118
1210
712
Saturday
118
812
107
129
1311
813
Sund
ay12
99
1311
813
1014
12Ho
liday
914
Mon
day
1310
1014
129
1411
1513
1015
Tuesda
y14
Sale
and
Red
empt
ion
NTN
-B
11Sa
le a
nd R
edem
ptio
n N
TN-B
11
Sale
and
Red
empt
ion
NTN
-B
1513
1015
Sale
and
Red
empt
ion
NTN
-B
12Sa
le a
nd R
edem
ptio
n N
TN-B
16
1411
16Sa
le a
nd R
edem
ptio
n N
TN-B
Wed
snesda
y15
Exch
ange
NTN
-B12
Exch
ange
NTN
-B12
Exch
ange
NTN
-B16
Sale
LTN
and
NTN
-F14
11Sa
le L
TN a
nd N
TN-F
16Ex
chan
ge N
TN-B
13Ex
chan
ge N
TN-B
1715
1217
Thursday
16Sa
le L
TN a
nd L
FT13
Sale
LTN
and
LFT
13Sa
le L
TN a
nd L
FT17
15Sa
le L
TN a
nd N
TN-F
1217
Sale
LTN
and
LFT
14Sa
le L
TN a
nd L
FT18
Sale
LTN
and
NTN
-F a
nd
Rede
mpt
ion
NTN
-F16
Sale
LTN
and
NTN
-F13
Sale
LTN
and
NTN
-F18
Sale
LTN
Friday
1714
1418
Holid
ay16
1318
1519
1714
19Saturday
1815
1519
1714
1916
2018
15Ho
liday
20Sund
ay19
1616
2018
1520
1721
1916
21
Mon
day
2017
1721
Holid
ay19
16Sa
le a
nd R
edem
ptio
n N
TN-B
21
1822
2017
22
Tuesda
y21
1818
22Sa
le a
nd R
edem
ptio
n N
TN-B
20
Sale
and
Red
empt
ion
NTN
-B
1722
1923
Sale
and
Red
empt
ion
NTN
-B
21Sa
le a
nd R
edem
ptio
n N
TN-B
18
Sale
and
Red
empt
ion
NTN
-B
23
Wed
snesda
y22
1919
2321
18Sa
le L
TN23
2024
2219
Sale
LTN
24
Thursday
23Sa
le L
TN a
nd N
TN-F
and
Re
dem
ptio
n N
TN-F
20Sa
le L
TN a
nd N
TN-F
and
Re
dem
ptio
n N
TN-F
20Sa
le L
TN a
nd N
TN-F
and
Re
dem
ptio
n N
TN-F
24Sa
le L
TN22
Sale
LTN
19Ho
liday
24Sa
le L
TN a
nd N
TN-F
and
Re
dem
ptio
n N
TN-F
21Sa
le L
TN a
nd N
TN-F
and
Re
dem
ptio
n N
TN-F
25Sa
le L
TN23
Sale
LTN
20Ho
liday
25Ho
liday
Friday
2421
2125
2320
2522
2624
2126
Saturday
25Ho
liday
2222
2624
2126
2327
2522
27Sund
ay26
2323
2725
2227
2428
2623
28Mon
day
2724
2428
2623
2825
2927
2429
Tuesda
y28
Sale
and
Red
empt
ion
NTN
-B
25Sa
le a
nd R
edem
ptio
n N
TN-B
25
Sale
and
Red
empt
ion
NTN
-B
2927
2429
Sale
and
Red
empt
ion
NTN
-B
26Sa
le a
nd R
edem
ptio
n N
TN-B
30
2825
30
Wed
snesda
y29
2626
30Sa
le L
TN a
nd N
TN-F
and
Re
dem
ptio
n N
TN-F
2825
Sale
LTN
and
NTN
-F a
nd
Rede
mpt
ion
NTN
-F30
2729
2631
Thursday
30Sa
le L
TN27
Sale
LTN
27Sa
le L
TN29
Sale
LTN
and
NTN
-F a
nd
Rede
mpt
ion
NTN
-F26
31Sa
le L
TN28
Sale
LTN
30Sa
le L
TN a
nd N
TN-F
and
Re
dem
ptio
n N
TN-F
27Sa
le L
TN a
nd N
TN-F
and
Re
dem
ptio
n N
TN-F
Friday
3128
2830
2729
3128
Saturday
2931
2830
29Sund
ay30
2931
30Mon
day
3130
Tuesda
yLF
T –
Letr
as F
inan
ceira
s do
Teso
uro
(Zer
o Co
upon
Flo
atin
g Ra
te B
ill);
LTN
– Le
tras
do
Teso
uro
Nacio
nal (
Zero
Cou
pon
Fixe
d Ra
te B
ill);
NTN-
B –
Nota
s do
Teso
uro
Nacio
nal –
Sér
ie B
(IPC
A –
Cons
umer
Pric
e-In
dexe
d No
te);
NTN-
F –
Nota
s do
Teso
uro
Nacio
nal –
Sér
ie F
(Pla
in V
anill
a Fi
xed
Rate
Not
e).
Sale
and
Red
empt
ion
NTN
-B
Sale
LTN
and
NTN-
FSa
le LT
N an
d NT
N-F
and
Rede
mpt
ion
NTN-
FSa
le a
nd R
edem
ptio
n N
TN-B
Sa
le LT
N/NT
N-F
and
LFT
Holid
ay
This
sche
dule
is su
bjec
t to
mod
ifica
tions
in a
ccor
danc
e w
ith m
arke
t con
ditio
ns.
Bras
ília,
Dec
embe
r 23rd
2013
.
M
INIS
TÉ
RIO
DA
FA
ZE
ND
A
Sour
ce: N
ation
al T
reas
ury.
Thi
s sch
edul
e is
subj
ect t
o ch
ange
s acc
ordi
ng to
mar
ket c
ondi
tions
.