Embed Size (px)
Citation preview
B Defining innovation-oriented government policies and their evolution in the digital ageSince the 2008-09 financial crisis, industrial employment in some economies has seen accelerated decline and international competition in mature industrial sectors has tightened; the evolution of productivity and wages has slowed; and a new economy enabled by digital technologies has emerged. In this context, industrial and innovation policies have undergone renewal, and these “new industrial policies” are reflecting a duality inherent to all government policy phases, as they aim to address the difficult modernization of traditional industries, while also aiming to bring about an adaptation of economies to digitalization.

Contents1. Introduction 24
2. A new wave of government policies: when, where, what? 24
3. Mapping government policy instruments in the digital era: 49 old tools, new tools
4. Conclusions 75
Some key facts and findings
• Spurring innovation in the digital field is at the core of many “new industrial policies” adopted in countries at all levels of development in recent years.
• In adopting “new industrial policies”, there is a general recognition among governments that trade and trade policy are important engines for innovation. Outward-oriented policies allow countries to access advanced technology by importing capital goods, technologies and building knowledge through partnerships and global value chain participation.
• As data become an essential input in economic activities, firms in the digital economy are coming to rely less on physical assets and more on intangible assets, allowing them to reach global markets faster.
• Governments continue to make a relatively active use of policy tools of a “defensive” nature in traditional sectors such as minerals, metals and chemical industries, and to a lesser extent in textiles and clothing, electrical machinery and transport equipment.
• Government policies are increasingly aiming to promote digital innovation and address digital challenges through a mixture of traditional policy instruments (such as tariffs, investment and tax incentives, innovation-based procurement and intellectual property policies) and new regulatory approaches.
• Many developing countries have adopted proactive policy frameworks to promote digital development and technological innovation. Provided that they continue to catch up with internet infrastructure and the right policy and business environment, least-developed countries stand to gain in digital service exports, participation in global value chains and economic inclusion fostered by affordable mobile services.

WORLD TRADE REPORT 2020
24
1. Introduction
Since the 2008-09 financial crisis, government intervention in the economy has undergone a process of renewal. These “new industrial policies” reflect a duality inherent to all industrial policy phases. On the one hand, they aim to address the difficult modernization of traditional industries, both in developed and developing countries; hence, in some of these traditional sectors, these policies may display “defensive” features, protective of the build-up or restructuring of traditional/downstream industries. On the other hand, new industrial policies are also clearly geared towards the adaptation of economies to digitalization, which means encouraging the adoption of digital processes in industrial sectors and spurring innovation to generate new activities (such as application-based services) in the digital space.
Section B.2 looks at how the characteristics of the digital economy modify the design of policy instruments, and how the push towards innovation in the digital economy has influenced the evolution of government policy and the ways in which instruments have been adapted. Some policy tools and instruments – for example, data policies and research and development (R&D) support measures, such as tax breaks to support specific digital innovation, skills and knowledge creation and diffusion – are clearly integral to the digital economy. Other instruments are more familiar, such as incentives for investment, or the promotion of intellectual property, even when they are applied to the digital sector.
Section B.3 offers a quantitative review of how governments have used policy tools over the past decade. The analysis is based on public sources, mainly the WTO trade monitoring tools, complemented by the Global Trade Alert database.1 It shows that government policies continue to be widely used to support traditional sectors and to attract investment. However, increased focus is being placed on supporting innovation and the development of the digital economy through a mix of traditional policy instruments, such as support for R&D and tariffs, and new regulatory approaches to promote innovation and address digital policy issues raised specifically by the digital economy.
2. A new wave of government policies: when, where, what?
According to a United Nations Conference on Trade and Development (UNCTAD) global survey of industrial policies, presented in the context of in its UNCTAD (2018a), 84 economies, accounting for
over 90 per cent of global gross domestic product (GDP), have adopted formal industrial development strategies since 2013, a number reaching 101 economies if counted since the financial crisis of 2008. Although such government policies never absolutely disappeared, they were less “in fashion” a decade or two ago, and their revival has been widespread enough to raise questions. The term “new industrial policies” has been used with relative frequency by countries to label their industrial policy plans, with a view to marking policy priorities linked to transformational changes in technology and economic activity.
This subsection will provide an overview of current trends in these policies. It will then discuss the special features of the digital economy and review how innovation and industrial policy evolve in the digital age.
(a) Definitions
(i) New industrial policies
There is no agreed or universal definition of industrial policy, in part because the very concept of industrial policy has been and still is subject to debate, and in part because it has adapted over time. Vanden Bosch (2014) notes that the term “industry” could be narrowly understood as “manufacturing industry” but the new industrial revolution, characterized by the growing utilization of digital technologies, has altered its meaning so that it now tends to include information technologies and services as well.
A key feature of current industrial policy (“new industrial policy”) is its focus on innovation, technological development and upgrading in the digital field. Innovation policies are public interventions to support the generation and diffusion of innovation, whereby an innovation is understood as the transformation of an invention into marketable products and services, the development of new business processes and methods of organization, and the absorption, adaptation and dissemination of novel technologies and know-how (Curtis, 2016; Edler et al., 2016).2
Over time, a distinction has been made in the literature between narrowly defined, “vertical” policies, meant to support, by means of public policy tools, production in a particular sector or firm, as well as the technologies and tasks to build up that sector;3
and the wider concept of “horizontal” policies or strategies, which improve the business, cost, legal and infrastructural environment in which economic actors operate across sectors.4 Joseph Stiglitz, Justin

B. D
EF
ININ
G IN
NO
VA
TIO
N-
OR
IEN
TE
D G
OV
ER
NM
EN
T P
OLIC
IES
AN
D T
HE
IR
EV
OLU
TION
IN TH
E D
IGITA
L AG
E
25
GOVERNMENT POLICIES TO PROMOTE INNOVATION IN THE DIGITAL AGE
Yifu Lin and Celestin Monga, all former chief economists of the World Bank Group, have acknowledged the vertical/horizontal distinction but warned that the frontier between vertical and supposedly more neutral, “horizontal” policies was blurry, as vertical policies had to be supported or were impacted by horizontal ones (Stiglitz, Lin and Monga, 2013). Stiglitz, Lin and Monga wished to go beyond this distinction by suggesting that government action, through tax and fiscal policy, infrastructure development, the promotion of technology and of knowledge (including education spill-overs), was not “neutral” from the perspective of resource allocation, and that “industrial policy was not just about manufacturing”. They floated the controversial idea that “all governments were engaged in various forms of industrial policies – even those who advocated horizontal or neutral policies ended up taking actions that favoured certain industries more than others and therefore shaped the sector allocation of the economy”.
Nowadays many, if not most, economists opt for a definition sufficiently broad to reflect policy plans observed in countries or regions at different periods of times and levels of development.
(ii) Innovation policy
The defining feature of current government policies is their prime focus on innovation, technological development and upgrading in the digital field. Industrial and innovation policies have never been more intertwined than before. As Curtis (2016) puts it,
“the current debate and proposals on updated forms of industrial policy are less about market interventionism and more on technological innovation, productivity gaps, R&D, entrepreneurship, vertical specialization and agglomeration economies”.
Curtis notes that globalization and digital technologies have had a profound impact on the global innovation landscape. At the same time, innovation has become a crucial aspect of the development process, as policymakers in both high- and low-income countries increasingly see the development and adoption of advanced technologies, know-how and new business methods as key to stimulating productivity, competitiveness, employment and growth (Curtis, 2016).
Edler et al. (2016) define innovation policies as:
“public intervention to support the generation and diffusion of innovation, whereby an innovation is a new product, service, process or business model
that is to be put to use, commercially or non-commercially”.
While the Edler et al. (2016) definition focuses on the generation of new products and services, Li and Georghiou (2016) make a distinction by level of development. They acknowledge that “innovation” in the context of developed countries was often regarded as the creation of “non-existing” goods or services. By contrast, in some developing countries, innovation has not always been “new to the world”, but more often “new to the country”, in a way that means that innovation has been associated with catching up with world-level technological frontiers (Nelson, 2004). The World Bank (2010) embraces the view that:
“innovation means technologies or practices that are new to a given society. They are not necessarily new in absolute terms. These technologies or practices are being diffused in that economy or society. This point is important: what is not disseminated and used is not an innovation. Dissemination is very significant and requires particular attention in low- and medium-income countries”.
In this definition, innovation policy is not a single set of policy prescription to promote innovation but policy actions in several policy areas (education, science and technology, trade, entrepreneurship, investment and finance) constituting a framework for innovation to occur, but also for the innovation to be marketed and the underlying knowledge to be diffused.
The literature points to the tendency of innovation policies to become more complex, including not only an increasing set of policy areas, but also involving a range of actors and institutions. Innovation policies in the past were linked to specific policy objectives, designed and implemented by specific departments responsible for those specific missions (for example space travel and telecommunications). These innovation policies are often labelled as “mission-oriented” (Ergas, 1987; Mazzucato, 2013). This first phase of innovation policy evolved into more complex, “holistic” policies aimed at facilitating the interactions between the various actors and institutions involved in innovations processes, such as universities, research institutes, investors (including banks and venture capitals), and government agencies across various sectors. This intersects with new industrial policies, which promote a more horizontal approach to economic development, bringing together a vast number of actors and policy areas (World Bank, 2010).
2525

WORLD TRADE REPORT 2020
26
Industrial policy revisited
The best-kept secret of economic policy may be the fact that every single economy in the world, either intentionally or not, pursues industrial policy. This is true not only for the usual suspects, such as Brazil, China, France and Singapore, but also for Chile, Germany, Great Britain and the United States. The news is only surprising if one forgets that industrial policy broadly refers to any government decision, regulation or law that encourages the ongoing operation or development of a particular industry. After all, economic development and sustained growth are simply the results of continuous industrial and technological upgrading, a process that requires public-private collaboration.
While industrial policy has had a bad reputation in economics for a long time, historical evidence shows that all countries that have successfully transformed from agrarian economies to modern advanced economies – the old industrial powers in Western Europe and North America as well as the newly industrialized economies in East Asia – had governments that played a proactive role in assisting individual firms in overcoming the coordination and externality problems that arose during the process of their structural transformation.
However, the sad fact is that while almost every government in the developing world has attempted, at some point in its development process, to play that facilitating role, most have failed. The economic history of the economies of the former Soviet Union, Latin America, Africa and even Asia have been marked by inefficient public investment and misguided government interventions that have resulted in many “white elephants” and costly distortions.
Looking carefully at these pervasive failures in developing economies, it appears that they are mostly due to the inability of governments to come up with good criteria for identifying industries that are appropriate for a given country’s level of development. In fact, the propensity of governments to target industries that are too ambitious and are not aligned with a country’s comparative advantage largely explains why their attempts to “pick winners” have often resulted in “picking losers.” In contrast, as I argued in “New Structural Economics” (Lin, 2010), governments in successful developing countries have typically targeted mature industries which have succeeded in countries with an endowment structure similar to theirs and with a level of development not much more advanced than theirs. The main reason is straightforward:
government interventions aiming at facilitating industrial upgrading and diversification must be anchored in industries with latent comparative advantage determined by their endowment structure, so that they enjoy low factor costs of production. In this way, once a government uses targeted policy to improve the hard and soft infrastructure needed to lower transaction costs, private firms in the new industries can quickly become competitive, both domestically and internationally.
In the case of advanced countries, most industries tend to be on the global frontier (i.e. having adopted the most recent innovations), which means upgrading requires an original innovation. In addition to ex post measures such as giving a patent to a successful innovation or supporting a new product through procurement, the government may also use ex ante measures such as supporting basic research needed for new product/technology development or impose a mandate for using a new product like the case of ethanol.
OPINION PIECE
By Justin Yifu Lin,Dean, Institute of New Structural Economics, Institute of South-South Cooperation and Development and Honorary Dean, National School of Development, Peking University, China. Formerly Senior Vice President and Chief Economist of the World Bank (2008-12).

27
(b) Context
The rethinking of government polices since the global financial crisis of 2008-09 has been driven by a wide array of factors that vary from one country to another (Singh, 2016). These include:
• tightening competition between developing and developed economies, particularly in mature manufacturing sectors – as products and technologies mature and spread, catch-up phases are perceived to be shorter;
• the continuous decline in manufacturing employment in industrialized economies, and the relatively new phenomenon of a declining share of manufacturing production in the GDPs of the more advanced developing economies;
• the slower evolution of productivity and the stagnation, if not the decline, of real wages for mid- to low-income workers in many economies;
• influential public policy arguments, according to which economies with a stronger industrial base resist changes and shocks better;
• the desire to “move up the value chain”, i.e. for low-income economies to shift away from commodity exports and increase domestic value-addition, and for middle-income economies to achieve a technological “catch-up” with high-income economies; and,
• in line with the above, the emergence of disruptive technologies linked to the digital economy.
The socioeconomic context surrounding government policies has also changed: public demands on governments have become more complex in terms of defining economic policies to address sets of intertwined problems or longer-term crises, such as regional inequality, territorial impoverishment, health and food concerns, environmental protection, and even in some cases wage levels and redistribution.
Another element in the altered socioeconomic context is the recognition that the success of government policies cannot rely solely on manufacturing, given the level of servicification of manufactures and the spill-overs that incentives on one sector have on others. Cross-industry spill-overs are now widely acknowledged by the literature, so improving incentives for advanced manufacturing or the digital sector without making progress on internet connectivity and physical infrastructures, or promoting manufacturing activities without improving
the competitiveness of adjacent services activities, are recognised not to be effective. In other words, a better understanding of the notion of competitiveness implies the fulfilment of many other conditions other than just promoting output in manufacturing.
As described below, expectations from government policies differ according to levels of development, from the early stages in which sectoral industrial development is sought, to advanced levels in which ongoing technological change and its economic, social and territorial consequences must be addressed. Further, in countries at early levels of development, industrial and innovation strategies often pursue technology transfer and the domestication of international technologies, while later stages strive to push their technological frontiers outward.
(c) Trends in government policies
Policymaking is a process. Most government policies display elements of duality: simultaneously defensive (protecting the build-up or restructuring of traditional/downstream industries) and offensive (promoting exports, incentivizing innovations in “new” industries); vertical (aiming at sectoral development) and horizontal (coordinating actors and policies, improving the business environment, and reducing business and trade costs); combining domestic support and external measures. It is rarely one or the other, at each stage of development.
New industrial policies reflect this duality. On the one hand, these policies were designed during a period of profound industrial restructuring following the financial crisis of 2008-09 and were therefore aimed at addressing the difficult transitions of traditional industries in both developed and developing countries. On the other hand, new industrial policies focus on adapting the economy towards digitalization – which means encouraging the adoption of digital processes in industrial sectors as much as spurring innovation to generate new activities (such as application-based services) in the digital space. This push towards innovation in the digital economy is reflected in the evolution of policy instruments, as discussed in the following subsection, and in Table B.1, which shows how new themes and orientations have been incorporated in modern industrial policies over time.
The 1980s marked a gradual shift away from policies based on import substitution, infant industry protection and the direct intervention of states in the production processes, that were prevalent in the 1960s and 1970s in many economies, towards more
B. D
EF
ININ
G IN
NO
VA
TIO
N-
OR
IEN
TE
D G
OV
ER
NM
EN
T P
OLIC
IES
AN
D T
HE
IR
EV
OLU
TION
IN TH
E D
IGITA
L AG
E
GOVERNMENT POLICIES TO PROMOTE INNOVATION IN THE DIGITAL AGE

WORLD TRADE REPORT 2020
28
outward-oriented policies, as noted by Dornbusch and Park (1987). Some countries, for example in Asia, had anticipated that shift earlier, while others changed direction later.
In the 1990s, government policymaking embraced open economy requirements, such as skills upgrading, the acquisition of technological capacity, the reduction of business and trade costs, and infrastructure development, as important medium-term objectives. Industrial and trade policies aimed to improve the international competitiveness of firms and to integrate into global value chains. An important element of context has been the appearance of international (regional or multilateral) disciplines on the use of policy instruments that could generate negative spill-
overs internationally. For example, the combination of state aid and competition policies emphasized consumer interest in the European Union and aimed to limit the market powers of national champions in the European Union, and WTO binding disciplines and provisions have undoubtedly had an impact on WTO members’ policy spaces (Bohanes, 2015).
Still, the introduction of strong horizontal objectives did not completely displace sectoral policies, which remained a prominent feature of government policies. Grabas and Nützenadel (2014) mentioned the 1990 European Commission’s Communication on “Industrial Policy in an Open and Competitive Environment, Guidelines for a Community Approach” as a reflection of the new construct of policies of the 1990s.
Table B.1: Evolution in government policies and new themes
Modern industrial policies
Until the 1970s 1980s-90s 2000s and ongoing Recent/emerging themes
Key features/themes
Industrialization,structuraltransformation
Stabilization, liberalization
Knowledge-based economy
Participation in global value chains
Knowledge-based economy
“Moving-up” the value chains
New industrial revolution.
Push towards innovation and transition to the digital economy.
Participation in digital supply chains.
Sustainable development.
Policy goals Creating markets,diversification
Market-led modernization Specialization and increased productivity
Modern innovation ecosystem development.
Key elements Importsubstitution
Infant industry protection
Sector development
Gradual andselective openingto competition
More limited government involvement in many countries
More horizontal policies
Foreign direct investment (FDI) opening
Exposure to international competition
Targeted strategies in open economies
Enabling business environment
Digital development (information technology – IT) and information and communication technology (ICT) diffusion
Participation in global production networks
FDI promotion combined with protection of strategic industries
Micro, small and medium-sized enterprise (MSME) support (ongoing)
Skills development (ongoing)
Innovative research, and technological development.
Innovation in production.
Learning economy.
Public-private knowledge/tech development institutions.
Acquisition or transfer of foreign technology.
Entrepreneurship development.
Policy environment
Promotion of national development strategies
Less interventionist development strategies in many countries
International commitments and disciplines
National development strategies complemented by other policies (technology, digital policies)
More emphasis on inclusiveness and coordination of various policies (industrial, innovation, digital transformation, environment)
Source: Authors, adapted from UNCTAD (2018a).

29
GOVERNMENT POLICIES TO PROMOTE INNOVATION IN THE DIGITAL AGE
At the turn of the millennium, academics such as Rodrik contributed to redefining the concept of industrial policies (Rodrik, 2004). Prominent among these shifts was a model of strategic collaboration between the private sector and governments, hence the relatively large presence of public-private partnerships and programmes to boost R&D. Rodrik made the point that one size did not fit all government policies, which had to be tailored to the specific context or institutions of a country, or, to use the terminology introduced by Hausmann, Rodrik and Velasco (2008), policies had to be sensitive to countries’ “binding constraints”. According to this view, different countries could adopt identical policies with very different results, since they had different sets of market failures. Also, policies aimed to be “more neutral” and targeted (for example toward micro, small and medium-sized enterprises (MSMEs)).
The idea of evaluating policies and instruments also grew in the 2000s. The related literature analysed instruments such as R&D subsidies (Hall and Van Reenen, 1999; Wilson, 2009), place-based policies targeting disadvantaged geographical areas, and environmental subsidies (e.g., renewable energy subsidies, as per Aldy, Gerarden and Sweeney (2018)). Aghion, Boulanger and Cohen (2011) argued that targeted, sectoral government subsidies work better when implemented in more competitive and high-skilled sectors. Instruments such as investment and R&D incentives induce more (and new) firms to enter competitive markets, and, in view of the higher level of competition in these markets, some will be encouraged to innovate in order to “escape” such competition. For these reasons, Aghion, Boulanger and Cohen suggest that sectoral aid that enhances within-sector competition by not focusing on one or a small number of firms is more likely to be growth- and productivity-enhancing than more concentrated aid.
The most recent inflexion is the current resurgence of governmental new industrial policies following the global financial crisis of 2008-09, in a context of a profound industrial reorganization and the emergence of ground-breaking digital and advanced manufacturing supply-chain technologies and digital services. Horizontal objectives are often associated with the vertical objectives of promoting specific industries or types of industries and with new concerns and objectives that aim to rely on greener sources of energy and on upgrading human capital and skills across the economy.5
As per the analysis in UNCTAD (2018), of the 114 new industrial policies issued since the global financial crisis, 30 emanated from developed countries and 84 from developing countries, of which 24 were
least-developed countries (LDCs). Three-quarters of these strategies have been adopted in the past five years. The coordination of various sets of policies is important, as industrial, environmental, investment and trade policies are called upon to meet the large number of objectives of today’s industrial and development policies. New policy objectives are required to meet new socioeconomic challenges.
Several countries have adopted more than one policy; for example, they may have adopted a national industrial policy complemented by a policy on innovation, advanced manufacturing or digital economy (see Table B.2), all of which may eventually be part of an overall national development strategy. Industrial strategies reflect levels of development and concerns. UNCTAD (2019a) noted that high-income and upper-middle-income countries focused, for example, on advanced manufacturing development linked to the new industrial and digital revolution. LDCs had a higher number of industry-specific programmes and initiatives focusing on certain segments of their economies, such as MSMEs, consistent with the objective of promoting domestic value creation in downstream (and sometimes intermediate or upstream) sectors of the economy.
A defining feature of new industrial policies is the focus on innovation, technological development and upgrading, and the role of investment in promoting it. Investment policies may either be incorporated into broader industrial and development plans or be standalone policies establishing bridges with other policies. UNCTAD (2018) notes that foreign direct investment (FDI) policies have had to adapt to the characteristics of the new e-economy, in which firms no longer need to serve foreign markets by building locally large manufacturing capacity, but instead serve them with lower-scale non-equity investment and services; and in which the criteria used by firms to justify investing abroad change, for example from labour costs to skills, and from the quality of physical infrastructure to digital infrastructure.
Making the most of the digital economy is an overriding concern of countries at all levels of development. This means more than just adapting industrial and investment policies, as it implies a government-wide response to cross-sectoral, economy-wide challenges: among the topics that typically figure in countries’ digital strategies are developing the right digital infrastructure, boosting research and science, upgrading skills and adopting retraining policies, promoting e-government services and cybersecurity, establishing a clear framework for data use, transfer and protection, and, in some countries, promoting the growth of national companies in digital services. Many
B. D
EF
ININ
G IN
NO
VA
TIO
N-
OR
IEN
TE
D G
OV
ER
NM
EN
T P
OLIC
IES
AN
D T
HE
IR
EV
OLU
TION
IN TH
E D
IGITA
L AG
E

30
Table B.2: Examples of industrial and technological upgrading strategies adopted since the mid-2010’s
New industrial policies (illustrative)
Developed countries
France Industries du FuturPacte Productif 2025
Germany National Industrial Strategy 2030High Tech Strategy 2025 Shaping the Course of Digitalization (Digitalisierunggestalten)
Italy National Industry Plan 4.0
Japan Japan Revitalization Strategy and Industrial Competitiveness Enhancement Act; Initiatives for Promoting InnovationNew Robot StrategyFifth Science and Technology Basic Plan
Republic of Korea Manufacturing Innovation Strategy 3.0
Singapore Smart Nation Plan
Sweden Smart Industries Strategy
United Kingdom UK Industrial Strategy
United States Strategy for American Leadership in Advanced ManufacturingManufacturing Extension Partnerships
Developing countries
Brazil National strategy for Internet of ThingsBrazilian Strategy for Digital Transformation (“E-Digital”)
China Made in China 2025; “A policy to upgrade and integrate China’s manufacturing sector with a modern service sector” (November 2019)Internet Plus
India National Manufacturing PolicyDigital IndiaMake in India Strategy
Indonesia Making Indonesia 4.0 (2017)Indonesia 2045
Malaysia Industry4WRD: National Policy on Industry 4.0
Mexico Industry 4.0 Roadmap
Morocco Plan d’Accélération Industrielle du Maroc 2014-20
Philippines Inclusive, Innovation-led Industrial Strategy (I-cube)
South Africa National Industrial Policy Framework, and Industrial Policy Action Plan 2018/2019-2020/2021
Thailand Thailand 4.0 National Strategy
Turkey Medium Term Development PlanIndustrial Strategy and Sector-specific industries 2019
Viet Nam Five-Year Socio-Economic Development Plan (2016-2020)Industrial Development Strategy through 2025, vision 2015;Strategy on Cleaner Industrial Production 2020
Least-developed countries
Bangladesh Five-Year Plan 2016-21; National Industrial Policy 2016
Cambodia Cambodia Industrial Development Policy 2015/25National Broadband PlanningCambodia ICT Master Plan 2020
Myanmar National Comprehensive Development PlanIndustrial Development Vision and Industrial Policy Paper
Rwanda National Industrial Policy; Made in Rwanda Policy (2017)
Zambia National Industrial Policy (2018)
Source: Authors based on UNCTAD (2018a).
WORLD TRADE REPORT 2020

31
GOVERNMENT POLICIES TO PROMOTE INNOVATION IN THE DIGITAL AGEB
. DE
FIN
ING
INN
OV
AT
ION
-O
RIE
NT
ED
GO
VE
RN
ME
NT
PO
LICIE
S A
ND
TH
EIR
E
VO
LUTIO
N IN
THE
DIG
ITAL A
GE
countries see the potential of the digital economy for generating economic growth. Digitally distributed or enabled services, such as (e-)banking and media, offer new opportunities for both domestic producers and consumers, and complement or replace less efficient physical distribution services.
MSMEs are also at the heart of the digital economy. Despite the high market shares of global platforms, many applications are locally produced and destined for local markets. The digital economy can reduce the need for intermediaries in certain activities and could encourage entrepreneurship by reducing the amount of start-up capital required. This is particularly true in developing countries. However, a digital economy becomes the focus of digital policies, and there are many challenges associated with the development of a competitive digital economy, including start-up funding, connectivity, skills and talent retention, data acquisition and storage, privacy, and other data-related issues.
LDCs have expressed concerns that, in view of the challenges and resources required to be competitive in the digital economy, they might lose their grip on the new economy before they even have a chance to catch up with traditional supply chains. Correa and Kanatsouli (2018) drew a mixed panorama of their industrialization in previous periods. Still, half of the LDCs had explicit objectives in the area of ICTs, for example to secure affordable and reliable connectivity, and to develop locally made applications. In many cases, local applications allow for significant cost reductions for consumers and improvement in the availability of services (for example in agricultural and remote areas). Several such countries have made significant headway already, including in remote and agricultural areas (UN-OHRLLS, 2018). In LDCs, exports of ICT services and services that can be delivered digitally accounted for an estimated 16 per cent of total services exports; they more than tripled from 2005 to 2018 (UNCTAD, 2019b).
Digital technologies help LDCs to improve the business environment and to reduce costs for MSMEs. For example, e-commerce is well suited to LDCs, which have a higher share of MSMEs than other economies. Apart from providing access to a broader range of buyers, some e-commerce platforms offer a range of services (customer service, shipping, payment, delivery and return handling) which are a source of significant savings for participating MSMEs (Songwe, 2019).
(d) Taxonomy of policy instruments
Table B.3 presents an illustrative taxonomy of the government policy tools most often found in the traditional goods sectors, and referenced by
institutions such as the Organisation for Economic Co-operation and Development (OECD), the United Nations Industrial Development Organization (UNIDO) and the United Nations Conference on Trade and Development (UNCTAD),6 as well as of instruments typically found in the digital space. Policies in digital sectors or digitally enabled sectors aim, to a large extent, to foster innovation and knowledge diffusion in these sectors, and from these sectors to others. The economic characteristics of digital sectors (the asset-light model, where a business owns relatively fewer capital assets compared to the value of its operations) and the objectives of government intervention (building the e-connectivity infrastructure, encouraging local innovation, even if it is only local software- and application-making, favouring certain data policies, encouraging knowledge diffusion, etc.), are shaping the nature and form of the instruments used in the digital space. For example, large capital infusions which may previously have been used to build capacity in capital-intensive sectors – such as metals, ship-building and others – may in part be “replaced” by more limited grants and tax incentives for R&D in the digital space, which is less intensive in terms of physical capital.
The question arises of what is really new and what is a simple adaptation of policy instruments already used in “traditional sectors”. The instruments presented in Table B.3 aim to support firms in participating in digital and digitally enabled supply chains. As reflected in Table B.3, certain policy tools and instruments are clearly integral to the digital economy: data policies, R&D support measures such as tax breaks to support specific digital innovation, and skills and knowledge creation and diffusion. Other instruments, even when applied to the digital sector, look somewhat more familiar, such as incentives for investment and the promotion of intellectual property. Perhaps the novelty is in the requirement for a better articulation of policies supporting the establishment of a new “digital” supply chain, which includes telecommunication and internet infrastructures and connectivity, the networks necessary to undertake electronic commerce and other digital services, and the skills set necessary to participate in the digital economy as a producer of local applications.
Several innovation-based policies are not new, but are now applied to spur innovation in the digital economy. For instance, there is a great emphasis on tax incentives and tax breaks in the digital field; tax reductions are available horizontally across several policy fields, for example upon investment, to foster patent and other intellectual property (IP) creation, to facilitate the adoption of digital processes in “traditional” industrial sectors, to create new software services, and to boost R&D.

32
Table B.3: Taxonomy of innovation and industrial policy tools
Type of instrument
Traditional instruments Instruments in the digital age Examples in the digital age
Border measures
Import tariffs; export tariffs and other duties; quantitative restrictions; duty drawbacks
Elimination of tariffs for technical equipment, e.g. as per the WTO Information Technology Agreement (ITA) and the WTO Moratorium on Customs Duties on Electronic Transmissions.
Support measures
Tax incentives, exemptions, breaks, credit and any other favourable tax treatment (amortization); remission of indirect taxes.
Direct transfers such as grants, direct payments and other production subsidies, equity financial and capital infusion, start-up capital for large investment projects.
Directed and preferential lending; subsidized interest rates and guarantees, favourable credit restructuring, forgiveness; export credit and guarantees.
Input or infrastructural subsidies (lower electricity prices); funding for basic and development research for dual goods.
(Tax) incentives for adoption of digital technologies.
France: Industries du Futur; Malaysia: tax incentives to the electrical and electronics industry to transition into the 5G digital economy and Industry 4.0.
Tax incentives for software development services, ICT-related services, data processing services and call centre services.
Australia; Belize; Djibouti; Egypt; India: IT/ITeS (i.e. Information Technology/Information Technology-Enabled Services) Policy; Republic of Korea; Malaysia; Philippines: Investment Priority Plan; Slovak Republic; Sri Lanka; United States.
R&D support, including R&D incentives, funding for basic research, research for dual goods; R&D grants and tax credits.
Germany: Digitalisierunggestalten – direct funding for digital technologies and innovations; Federal funding of American Artificial Intelligence Initiative; Malaysia: Investment Tax Allowance (ITA) for R&D; Singapore: Research Incentive Scheme.
Grants. EU Research Council (grants for software and computing); US National Research Foundation.
Mission-oriented R&D grants. Canada: National Research Council Canada (NRC) Quantum Research & The Institute for Quantum Computing at the University of Waterloo; China: National Thirteenth Five-Year Plan for National Science and Technology Innovation; Quantum Research – United States: National Strategic Overview for Quantum Information Science.
Equity financing for tech and digital sectors: public equity funds, fund of funds.
European Union: Connecting Europe Broadband Fund; Korea Fund of Funds; Sweden: Almi Invest (public venture capital company that invests in areas such as technology and industry).
Accelerator and incubator programmes for early-stage businesses.
Poland: The Incubator Foundation; Canada Target Group: EntrePrism; US Small Business Administration: Growth Accelerator Fund.
Patent boxes. Ireland: Knowledge Development Box; France: reduced corporation tax rate on intellectual property income;Switzerland: tax exemption of patent income.
Provide and extend digital infrastructure.
Cambodian ICT Masterplan 2020;Germany: DigitalPAct School & Special Fund “Digital Infrastructure”;Japan: High Performance Computing Infrastructure (HPCI) programme; Malaysia: High-speed Broadband project (HSBB) & National Fiberisation and Connectivity Plan (NFCP); Nepal: National Broadband Policy & Rural Telecommunication Development Fund (RTDF).
WORLD TRADE REPORT 2020

33
GOVERNMENT POLICIES TO PROMOTE INNOVATION IN THE DIGITAL AGEB
. DE
FIN
ING
INN
OV
AT
ION
-O
RIE
NT
ED
GO
VE
RN
ME
NT
PO
LICIE
S A
ND
TH
EIR
E
VO
LUTIO
N IN
THE
DIG
ITAL A
GE
Table B.3: Taxonomy of innovation and industrial policy tools
Type of instrument
Traditional instruments Instruments in the digital age Examples in the digital age
Local content requirements
Local employment quotas; use of local contractors; use of local supplies and services.
Technological transfer requirements; share of parts and components to be used in a product.
Indonesia: local content requirements for smartphones and tablets (30-40 per cent of 4G telecommunication devices sold in Indonesia are to be produced locally or need to include seven locally made applications or 14 locally created games, in addition to 10 per cent of locally sourced hardware and 20 per cent of local design and firmware development).
Government procurement
Preferential purchase schemes, preferential price margins for local producers.
Source and procure software only from local software development companies.
Russia: Issued decree 1236 and Order 155 restricting purchases by government entities and state-owned enterprises, based on not having an adequate local alternative for foreign producers of software; enforcement of a 15 per cent price advantage.
Preferential purchase schemes covering digital products and services.
Turkey: Enforced local preference margin of 15 per cent for middle and high technology products;United States: provision in the “Consolidated and Further Continuing Appropriations Act, 2013- H.R.933” (Procurement of Chinese IT equipment contingent on FBI certification).
Agglomeration Clusters; special economic zones; policies may include:free land, preferential input prices and access to utilities; infrastructural investment.
High-tech clusters; science parks.
Austria: Digital Innovation Hubs Initiative;Canada: Artificial Intelligence-Powered Supply Chains Supercluster (Scale AI);Cluster Excellence Denmark; EU Smart Specialisation Platform;Japan: The Industrial Cluster Initiative; Thailand Science Park;United States: National Network of Big Data Regional Innovation Hubs (BD Hubs).
Special economic zones China: High-Tech Development Zones (HTDZs); Turkey: technology development zones (TDZs).
Accelerator and incubator programmes for early-stage businesses; tech hubs.
The Canada Accelerator and Incubator Program (CAIP); Turkey: International Incubation Center and Accelerator Support Programme.
Regulatory measures and standards
Technical regulations; product testing;
Standard development initiatives and regulatory measures related to digital technologies and advanced technologies (e.g. Blockchain, AI, 5G, autonomous vehicles).
Germany: Digitalisierunggestalten –develop general compliance standards for telemedia; Germany: Road Regulations Amended to Allow Autonomous Vehicles; United States: Standardization Roadmap for Additive Manufacturing (i.e. 3D Printing).
Standards for compatibility / interoperability.
European Telecommunications Standards Institute (ETSI) – interoperability standards for e-health, the Internet of Things and smart cities; European Committee for Standardisation (CEN) – e.g. Guidelines on interoperability of electronic invoices; United States: Federal Trade Commission – Internet of Things.
Regulatory sandboxes. Global Financial Innovation Network (GFIN); Monetary Authority of Singapore: The FinTech Regulatory Sandbox; United Kingdom: Financial Conduct Authority (FCA).
Investment (domestic and foreign)
Tariff and tax exemptions, incentives, and other support measures for domestic or foreign investment (see support measures), which may be granted inside or outside the context of particular economic zones or areas.
Investment promotion measures and agencies; investment facilitation, screening, protection.
Tax incentives by local authorities for establishment, linked or not linked to performance requirements.
Policies to attract FDI from high-tech companies.
Indonesia: tax holidays that include the digital economy sector; Republic of Korea: foreign investment zones for companies conducting R&D and companies that possess advanced technologies; Malaysia: customized investment incentives of RM 1 billion annually over 5 years to attract Fortune 500 & high-tech companies; Thailand: tax incentives for FDI for high-tech, including digital technologies.
Special economic zones. China – high-tech development zones (HTDZs); Turkey – technology development zones (TDZs).
Immigration policies directed at bringing high-skilled labour in technology or other industries.
European Union: Blue Card; Japan: Highly Skilled Foreign Professional (HSFP) visa;Singapore: Employment Pass; United States: H1B visa.
(continued)

34
A variety of grants also exists, for example when governments offer to match the paid-up capital of MSMEs, or provide funds to universities and national scientific institutes for research on advanced software and digital technologies (such as the
grants given to the European Research Council and the US National Science Foundation); in this context, individual grants may be limited in size. There are areas, however, which may mobilize larger direct funding resources from governments, such
Table B.3: Taxonomy of innovation and industrial policy tools
Type of instrument
Traditional instruments Instruments in the digital age Examples in the digital age
Skills and learning
Training grants; training institutes for industry-specific skills; industry associations or skills councils; technical vocational education and training; education policies; government advisory services.
(Direct and indirect) government advisory services.
Czech Republic: CzechInvest- Business and Investment Support Agency;Germany: Mittelstand 4.0 (small and medium-sized business) competence centres.
Technological knowledge transfer.
France: Industries du Futur – “multi-technology matrix”.
Expansion of STEM (science, technology, engineering and mathematics) programmes.
US Department of Education investment for STEM education, including computer science, through discretionary and research grants.
Accelerator and incubator programmes for early-stage businesses.
The Canada Accelerator and Incubator Program (CAIP); Turkey: International Incubation Center and Accelerator Support Programme.
Skill development for digital technologies
Germany: DigitalPAct School & Vocational Training 4.0; Malaysia – Digital Social Responsibility (DSR);The Digital Personnel Development Institute for Public Sector: Thailand Digital Government Academy (TDGA).
Intellectual property
Patents, copyrights, trademarks.
Intellectual property (IP) incentives.
Malaysia: 10-year income tax exemption for IP-generated income from patents and copyright software based on the Modified Nexus Approach;7
Singapore: Intellectual Property Development Scheme.
Patent boxes. Ireland: Knowledge Development Box; France: Reduced Corporation Tax Rate on IP Income;Switzerland: tax exemption of patent income.
Data policies Personal data protection policies.
Australia: Personally Controlled Electronic Health Records Act (PCEHR); Malaysia: Personal Data Protection Act (PDPA); Russia: Federal Law no. 242-FZ “On Personal Data” (international transfer of personal data requires additional consent); Turkey: Data Protection Law; EU General Data Protection Regulation (GDPR);
Data policies for addressing security issues, including data localization requirements and cross-border data flow policies.
China Cybersecurity Law- 2017 (requires operators of critical infrastructure (e.g. telecoms operators) to store personal data within China & requests for cross border data flows shall be submitted to a regulator); Guidelines for Nigerian Content Development in Information and Communications Technology (ICT); EU Cybersecurity Act;
Open government data.8 Mexico: La Política de Datos Abiertos.
Data policies fostering data-sharing between companies (i.e. generally for addressing market competition issues).
Brazilian Good Payer’s Credit Act;European Payment Service Directive;UK Open Banking initiative.
Data policies for ensuring government access to data for law enforcement and regulatory oversight purposes.
UK Investigatory Powers Act 2016.
Source: Authors.
(continued)
WORLD TRADE REPORT 2020

35
as “mission-oriented” grants for the development of cutting-edge “quantum computing”, in the same style as the supercomputer projects of the 1980s. Government funding can also be made available to upgrade “enabling” telecommunications and internet infrastructures (broadband and connectivity plans), which require significant and multi-annual public and private sector investment.
While technological and science parks have existed for decades, digital tech hubs and other similar agglomerative formulae aim to maximize knowledge spill-overs by bringing together universities, start-ups and occasionally government research centres under individual or grouped projects. The agglomeration of talents and skills is a key component of the digital economy, and benefits in some countries from the support of specific immigration policies aimed at attracting highly skilled human resources.
An important category of policies is innovation-based government procurement. Such policies can take several forms (see Section D.2(a)(v)). Via government procurement, R&D contracts can be allocated to innovative firms or groups of firms, incentives can be provided for local firms to supply locally developed goods and services (such as software or digital applications), and/or markets can be created to develop local technologies.
National data policies are also at the heart of the digital economy. They generally aim to increase the accessibility and ease of data-sharing among users, as well as to regulate data availability for various purposes, including societal, scientific and economic purposes. Policies may provide guidance on charges for information, open data provision, collection, exchange and disclosure, licensing and privacy protection.
(e) How the digital economy changes government policy
Over the past few decades, the rapid developments of technologies such as AI, robotics, IoT, autonomous vehicles, 3D printing and nanotechnology have triggered a new wave of economic structural change, often termed the “Fourth Industrial Revolution” (Davis, 2016; Schwab, 2017). The current wave of technological breakthroughs can be distinguished from the first, second and third industrial revolutions in which technological developments in mechanical power, electricity and information technology (IT) powered industrial changes. In contrast, the driving force of the recent technological change is the shift from mechanical and analogue electronic technology to digital technologies.
Digital technologies, products and services have become core aspects of almost every sector, impacting production processes and business models, disrupting established sectors and altering the dynamics of the world economy. Although this revolution is still in its infancy, it is starting to bring about economic and social changes, requiring that institutional frameworks and government policies adapt. In particular, data and the digital economy affect business behaviour, redefine innovation, alter market outcomes and transform the way economies are organized.
(i) Features of the digital economy
The digital economy comprises ICT goods and services to provide digital infrastructure, online platforms, digitally enabled services and cross-border flows of data. The definition of ICT and the digital sector used in this report is the manufacturing and services sectors of which the main activities are linked to the development, production, commercialization and intensive use of digital technology.9
Several features of the digital economy underline this ongoing economic transformation. First, data have become an essential input in every aspect of economic activities, which are increasingly organized along digital supply chains. Second, many digital technologies have the potential to alter economies drastically, and they are thus considered to be general-purpose technologies (GPTs). Third, digital technologies redefine innovation, foster collaboration and help to form innovative ecosystems. Fourth, firms in the digital sectors are often highly scalable, resulting in higher market concentrations. Fifth, digital goods and services are increasingly integrated, resulting in a sustained shift of employment from manufacturing to services sectors. Finally, changes in the digital economy often take place much faster than in the traditional economy.
Data as a key input into the digital economy
The digital economy arose out of the extraordinary amounts of detailed machine-readable information that have become available about practically all personal, social and business activities and interactions. The internet has also allowed a massive amount of information to be carried by modern communication networks and transmitted instantaneously over any distance. The quantity of data flowing globally over the internet has grown exponentially over the past three decades. Global internet traffic, a proxy for data flows, grew from about 100 gigabytes per day in 1992 to more than 45,000 gigabytes per second in 2017. Today 3.9 billion people, or 51 per cent of the global population, use the internet, and it is predicted
GOVERNMENT POLICIES TO PROMOTE INNOVATION IN THE DIGITAL AGEB
. DE
FIN
ING
INN
OV
AT
ION
-O
RIE
NT
ED
GO
VE
RN
ME
NT
PO
LICIE
S A
ND
TH
EIR
E
VO
LUTIO
N IN
THE
DIG
ITAL A
GE

36
that nearly two-thirds of the global population will have internet access by 2023 (Cisco Systems, 2020).
Currently 80 per cent of the processing and analysis of data take place in data centres and centralized computing facilities, and 20 per cent in smart connected objects such as cars, home appliances, manufacturing robots and computing facilities (Gartner, 2018). In the future, even more data are likely to be generated by smart connected objects and personal computing devices. Not only do digital technologies modify the functionalities of available goods and services, but the range and extent of such functionalities will depend on the quantity of data that can be transmitted. For example, the availability and diversity of data are crucial for training AI systems, which work by combining large amounts of data with fast, iterative algorithms to allow the software to learn automatically from patterns or features.
Although data are becoming ever more ubiquitous, creating value out of data requires complementary assets, individual skills, and data assessment tools, enabling those individuals and firms with the strongest capacities to take full advantage of the data (Guellec and Paunov, 2018). An entirely new value chain has
evolved around firms that support the production of insights from data, including data acquisition, data storage, data modelling and data analysis to generate data intelligence. This digital value chain runs through every aspect of the economy, enabling the efficient management of supply chains and increasing product diversity and in-depth insights about consumer preferences (see Figure B.1). In essence, the amount of data and the speed of data transmission enabled by data infrastructure are crucial for the functioning of the digital economy.
Digital technologies affect the entire economy
As mentioned above, many digital technologies are considered to be GPTs with the potential to alter economies and societies drastically. Just as the invention of steam engine, the electric motor and the semiconductor played essential roles in the first, second and third industrial revolutions, the development and wide adoption of digital technologies are the enablers for the Fourth Industrial Revolution. Technologies such as AI, IoT and Blockchain have the potential to be of benefit to the economy generally (Furman and Seamans, 2019).
Figure B.1: Digital value chains run through every aspect of the digital economyValue chains in the digital economy
Source: Adapted from Curry et al. (2014).
Data intelligence
Data analytics
Data processing
Data storage
Data acquisition
Raw materialIntermediate
inputFinal product Consumers
DATA
WORLD TRADE REPORT 2020

37
GPTs can be identified as having three main characteristics, according to Bresnahan and Trajtenberg (1995). The first is pervasiveness – the technology should spread to most sectors. The second is improvement – the technology should get better over time, and therefore costs should keep falling for its users. The third is innovation generation – the technology should make it easier to invent and produce new products or processes. As we see below, digital technologies fulfil all three characteristics (Jovanovic and Rousseau, 2005).
Digital technologies spread across all sectors
Since the invention of computers and the internet, the spread of digital technologies has been rapid and has ranged well beyond the ICT sector. Figure B.2 shows the share of IT equipment and software in the net capital stocks of main sectors in the United States.
Some sectors adopted IT very rapidly – for example, the share of IT equipment and software in total capital stock in the information services sector reached over 30 per cent in 2018, followed by professional administration and management services, whose
share of IT equipment and software is over 20 per cent of its total capital stock. Other sectors, such as utilities, agriculture and mining, have not adopted IT technologies to the same extent, but their use of digital technologies has nonetheless increased over time. For example, ICT are used to provide localized weather forecasts and information on daily market prices to farmers. In resource-constrained environments especially, service providers use satellites or remote sensors to gather temperature data, the internet to store large amounts of data, and mobile phones to disseminate temperature information to remote farmers cheaply, to prevent crop losses and mitigate the effects of natural adversities (McNamara et al., 2011).
The pervasiveness of digital technologies is also demonstrated in their wide applications across different fields. AI, for example, is one of the most widely adopted digital technologies. It is increasingly driving important developments in technology and business, from autonomous vehicles to medical diagnosis to advanced manufacturing, transforming ways of living and working (WIPO, 2019b). The IoT, which allows everyday objects to communicate with
GOVERNMENT POLICIES TO PROMOTE INNOVATION IN THE DIGITAL AGEB
. DE
FIN
ING
INN
OV
AT
ION
-O
RIE
NT
ED
GO
VE
RN
ME
NT
PO
LICIE
S A
ND
TH
EIR
E
VO
LUTIO
N IN
THE
DIG
ITAL A
GE
Figure B.2: Digital technologies spread rapidly to all sectorsShare of IT equipment and software in the capital stock in the United States by sector, 1960-2018 (percentile)
Source: Authors’ calculation based on data from the US Bureau of Economic Analysis.
Note: The sectoral capital stocks are from the detailed non-residential fixed asset tables in constant 2012 US dollars made available by the US Bureau of Economic Analysis. The classification of sectors was changed in 2001.
Information services
Professional, administrationand management services
Finance and insurance
Manufacturing
Wholesale, retail and transportation
Construction
Education and healthcare
Other services
Utilities
Agriculture and mining
0
5
10
15
20
25
30
35
1960
1962
1964
1966
1968
1970
1972
1974
1976
1978
1980
1982
1984
1986
1988
1990
1992
1994
1996
1998
2000
2002
2004
2006
2008
2010
2012
2014
2016
2018

38
one another and with other devices and services over the internet, also has wide applications: wireless IoT devices are becoming ubiquitous in business sectors such as manufacturing, healthcare and logistics.
Digital technologies improve over time
The second characteristic of a GPT is the improvement in efficiency over time, which can be shown in a decline in price and an increase in quality. This is certainly the case for digital technologies. Figure B.3 presents the price indices of personal computers, computer software, wireless telephone services and internet services relative to the aggregated consumer price index. The price of electricity – widely regarded as a GPT adopted in the 20th century – is also presented for comparison. While the relative price of electricity has remained stable since the late 1970s, the index of relative price of personal computers has fallen by a factor of 30 since 1997, and the price of computer software has fallen by more than 80 per cent. The relative price indices of wireless telephone
services and of internet services fell by roughly two-thirds and by half, respectively, over the same period.
While the price of digital technologies has drastically declined, the quality and speed of these technologies has improved. Take the example of computer memory chips: from the 1970s through the mid-1990s, a new generation of technology nodes – specific semiconductor manufacturing process and its design rules – was introduced roughly every three years. This three-year cycle coincided with the time interval between the introduction of next-generation dynamic random-access memory (DRAM) computer memory chips, which stored four times the quantity of data compared to the previous generation of chips.In the mid-1990s, the semiconductor manufacturing industry arrived at a significant technological inflection point and new technology nodes began arriving at two-year intervals. With smaller transistor sizes also came faster switching times and lower power requirements (Flamm, 2019).
Figure B.3: The relative price of computers has declined drastically in the past decades Price indices for electricity, computer and computer software products
Source: Authors’ calculation based on data from the US Bureau of Labor Statistics (http://www.bls.gov).
Note: The prices indices are deflated by the US consumer price index. Electricity prices are US city averages per kilowatt-hour (kWh) (average yearly rate). The price indices of personal computers and peripheral equipment and of computer software are set to equal 100 in the first year of the sample (1997).
Personal computers and peripheral equipment Wireless telephone services
Computer software and accessories Internet services and electronic information providers
Electricity per kWh
0
0.01
0.02
0.03
0.04
0.05
0.06
0
10
20
30
40
50
60
70
80
90
100
1978
1979
1980
1981
1982
1983
1984
1985
1986
1987
1988
1989
1990
1991
1992
1993
1994
1995
1996
1997
1998
1999
2000
2001
2002
2003
2004
2005
2006
2007
2008
2009
2010
2011
2012
2013
2014
2015
2016
2017
2018
2019
Ave
rage
pric
e of
ele
ctric
ity p
er k
Wh
in th
e U
nite
d S
tate
s ci
ty a
vera
ge
-
Inde
x of
per
sona
l com
pute
r and
per
iphe
ral e
quip
men
tD
ecem
ber 1
997
= 1
00
WORLD TRADE REPORT 2020

39
Digital technologies generate innovation
A third defining feature of a GPT is the ability to generate innovation. Digital technologies have not only radically improved processes, products and services, but have also changed the nature of innovation. We will discuss below how digital technologies foster innovation and innovative ecosystems as a distinct feature of the digital economy. In addition, measures to contain the spread of the COVID-19 pandemic
have further accelerated the adoption of digital technologies and fostered digital innovation (see Box B.1).
Digital innovation
In a narrow sense, digital innovation means the implementation of a new or significantly improved digital product, e.g. a semiconductor, a motion sensor or a piece of software. More broadly, digital
GOVERNMENT POLICIES TO PROMOTE INNOVATION IN THE DIGITAL AGEB
. DE
FIN
ING
INN
OV
AT
ION
-O
RIE
NT
ED
GO
VE
RN
ME
NT
PO
LICIE
S A
ND
TH
EIR
E
VO
LUTIO
N IN
THE
DIG
ITAL A
GE
Box B.1: How COVID-19 has accelerated uptake of e-commerce and digital innovation
The COVID-19 pandemic is a public health crisis, but it has also acted as a catalyst for economic, social and behavioural changes. The measures to contain the spread of COVID-19 are likely to accelerate the shift to digital platforms and technologies significantly.
The enforcement of social distancing, lockdowns and other measures in response to the COVID-19 pandemic has led consumers to ramp up online shopping and use of social media and of other means of digital communication. Online e-commerce platforms have registered significant growth since the start of the pandemic. Amazon, a US-based e-commerce company, announced revenues of US$ 75 billion in the first three months of the year, averaging US$ 33 million an hour. MercadoLibre, Latin America’s leading e-commerce technology company, reported a 70.5 per cent year-over-year increase in net revenue in the first quarter of 2020. The Chinese e-commerce giant Alibaba reported that its sales grew by 22 per cent in the first three months of 2020, despite virus-related restrictions denting activity.
Much of the digital innovation is taking place in developing countries. In Senegal, the Ministry of Trade is partnering with the private sector to facilitate delivery of essential goods and services through e-commerce. In Uganda, the Ministry of Information and Communications Technology and National Guidance has called to develop digital solutions in the fight against COVID-19 to support health systems and public service delivery (Kituyi, 2020).
Digital payments help people to avoid potential COVID-19 infection while keeping economies running, and they also help to put stimulus funds into consumers’ hands more rapidly. For example, local governments in China have distributed vouchers through WeChat Pay to encourage immediate spending. The digital option also applies to the transfer of remittances, since restrictions to mobility during the COVID-19-related lockdowns limited the possibility of sending cash remittances (Bisong, Ahairwe and Njoroge, 2020). In addition, central banks have temporarily permitted companies and banks to lower or scrap transaction costs and fees on digital payments and mobile money transfers in order to encourage the use of mobile money in preference to cash (WTO, 2020).
Some small businesses were able to adopt digital technologies speedily, such as Indian food tech business Zomato, which used its platform to work with grocery start-ups to meet surging online orders (McKinsey & Company, 2020b). Governments also put in place measures to help businesses innovate and adopt digital technologies to strengthen their resilience against economic disruptions. For instance, the Distance Business Programme (Hong Kong, China) is a time-limited programme that provides funding support through fast-track processing for enterprises to adopt IT solutions for developing distance business.
Spurred by social distancing and stay-at-home requirements, digital services that can be delivered electronically have flourished. An average of 40 per cent of workers in the European Union and the United States have worked from home due to the pandemic (Berg, Florence and Sergei, 2020; Dingel and Neiman, 2020), although the rate of telework has been lower in developing economies. In particular, levels of remote work have significantly increased in sectors such as IT services, professional and business services, and financial activities (Hensvik, Le Barbanchon and Rathelot, 2020). To make teleworking possible, firms invested in digital transformations, especially in the services sector. Workers have learned to use collaborative software, access remote databases and participate in virtual meetings.
40
technologies are used to develop new digital products and services, enhance existing or create new business processes, and modify existing business models. Digital innovation, in a broad sense, refers to the use of digital technologies to create a new product, process, marketing method, or organizational method, or to improve existing ones (Wiesböck and Hess, 2020; Nepelski, 2019).
Although the ICT sectors account for only a small share of value-added, digital technologies are the driving force in innovation. One way of measuring innovation is by the number of patent applications. The invention and wide adoption of computers worldwide coincided with a surge in the number of patent applications from both developed and developing countries since the mid-1990s. In particular, the number of ICT-related patent applications saw stronger growth compared with patent applications generally. Figure B.4 shows the share of patent applications in the ICT field as a percentage of total patent applications. In recent years this trend has been the strongest in China, although other economies have also seen increasing innovation in the ICT field.
Some digital technologies, such as AI, have wide applications in many areas, generating innovation in a range of fields. Figure B.5 provides an overview
of AI patent applications, showing the top 20 companies and the economic fields designated in their applications. While IBM and Microsoft are the largest applicants of AI technology, most of the top 20 applicants are Japanese or Korean conglomerates. AI may be applied in many areas of economic activity, such as transportation, telecommunications and healthcare, and may thereby generate innovation and transform the economy as a whole.
Digital technologies also allow innovation to become more open and more collaborative, forming an innovation ecosystem. Despite frequent predictions that the internet will lead to the death of distance, the importance of spill-overs and synergies has in fact increased the importance of places where people come together to share ideas (see Box B.2). Innovation often happens where people congregate, especially in cities (Haskel and Westlake, 2017).
A proliferation of digital tools or digital components allows firms to build platforms not just of products but of digital capabilities to support different functions (Yoo et al., 2012). As firms leverage more standardized tools to design, produce and support products and services throughout their value chains, they are sharing more data and processes across organizational boundaries.
Box B.1: How COVID-19 has accelerated uptake of e-commerce and digital innovation (continued)
Although the measures to contain COVID-19 are temporary, they could trigger long-term shifts in customer habits and business operations. According to a consumer survey, 75 per cent of people using digital channels for the first time indicate that they will continue to use them when things return to “normal” (McKinsey & Company, 2020a). The digital transformations triggered by the pandemic are likely to have long-lasting effects.
Since the start of the pandemic, governments have introduced a wide range of digital technologies and services to mitigate the spread of COVID-19. These technologies and services are enabling policymakers to design and implement evidence-based policies and to enforce regulatory measures. They are also helping health professionals to treat patients and optimize hospital logistics.
For instance, in April 2020, the Government of Singapore was the first government in the world to introduce a Bluetooth-based mobile application which permits users to receive a notification when they have been in close contact with individuals who have been infected by the virus (Bay et al., 2020). The data are shared with public health authorities to analyse and predict epidemic spread. The application runs on a privacy protocol, and all data, which are stored on the user’s device (and are not retained by the application), are automatically deleted after a few weeks to ensure privacy. Several other governments have since developed similar applications.
Several governments are collaborating with telecommunications services providers to access telecommunications and geolocation data to track population movements, and in some cases, to enforce quarantine measures. According to Shendruk (2020), at least 29 governments are using data from mobile phones to monitor the spread of COVID-19. AI is also used to help front-line healthcare workers stay abreast with fast-changing COVID-19-related information.
WORLD TRADE REPORT 2020

41
GOVERNMENT POLICIES TO PROMOTE INNOVATION IN THE DIGITAL AGEB
. DE
FIN
ING
INN
OV
AT
ION
-O
RIE
NT
ED
GO
VE
RN
ME
NT
PO
LICIE
S A
ND
TH
EIR
E
VO
LUTIO
N IN
THE
DIG
ITAL A
GE
Figure B.4: The share of ICT patents has been surgingICT-related patent applications as a share of total patent applications
Source: Authors’ calculation based on data from OECD statistics.
Note: Patent applications under the Patent Cooperation Treaty (PCT)10 by origin of the inventor. ICT patents are defined as in Inaba and Squicciarini (2017).
Figure B.5: Innovations in AI are applied in a wide range of different fieldsTop patent applicants by AI application field
Source: World Intellectual Property Organization (WIPO) (2019b).
Note: SGCC = State Grid Corporation China, NEC = Nippon Electric Company, NTT = Nippon Telegraph and Telephone. A patent may refer to more than one category.
High-income economies China Low- and middle-income economies
0
10%
20%
30%
40%
50%
60%
70%
19931994
19951996
19971998
19992000
20012002
20032004
20052006
20072008
20092010
20112012
20132014
20152016
2017
Agr
icul
ture
Art
s an
d hu
man
ities
Ban
king
and
fina
nce
Bus
ines
s
Car
togr
aphy
Com
putin
g in
gov
ernm
ent
Doc
umen
t man
agem
ent a
nd
publ
ishi
ng
Edu
catio
n
Ene
rgy
man
agem
ent
Ent
erta
inm
ent
Indu
stry
and
man
ufac
turin
g
Law
, soc
ial a
nd b
ehav
iour
al
scie
nces
Life
and
med
ical
sci
ence
s
Mili
tary
Net
wor
ks
Per
sona
l dev
ices
, com
putin
g an
d hu
man
-com
pute
r
Phy
sica
l sci
ence
s an
d en
gine
erin
g
Sec
urity
Tele
com
mun
icat
ions
Tran
spor
tatio
n
IBM 17 150 93 935 184 81 1223 215 43 82 546 22 553 29 308 1050 112 486 759 424Microsoft 17 209 42 780 218 96 944 151 22 236 192 9 319 25 332 1438 155 377 754 278Samsung 29 176 17 183 42 44 265 73 140 62 131 5 595 64 135 922 165 446 755 538Alphabet 4 163 29 463 361 38 521 67 18 55 61 6 119 13 241 709 53 206 593 333Siemens 14 51 27 60 39 31 170 58 164 11 266 6 1127 16 58 268 323 293 458 415Hitachi 18 98 65 168 23 37 270 90 141 13 199 2 447 18 61 306 256 297 338 735Toyota 14 40 0 26 31 19 14 80 173 15 36 3 188 10 30 169 267 92 198 1987Sony 13 267 10 194 67 32 196 106 34 314 46 5 372 14 88 495 85 299 538 209SGCC 4 6 32 194 114 55 43 14 646 1 518 26 158 5 148 160 36 322 374 184Panasonic 9 145 11 115 21 31 251 80 97 45 96 4 322 14 53 323 101 261 494 487Toshiba 7 158 33 232 12 50 439 37 142 12 132 3 390 11 73 336 108 161 274 286Bosch 39 9 8 14 21 3 17 25 155 10 58 1 129 4 13 137 230 184 185 1469NEC 11 97 16 197 21 47 351 63 51 17 105 4 368 9 58 203 69 317 438 190Fujitsu 12 73 47 173 8 34 326 66 25 22 110 3 401 8 54 200 55 351 253 299LG Corporation 12 84 25 94 9 10 71 15 93 13 49 4 113 20 43 409 57 212 524 451Canon 2 89 1 56 11 18 496 31 15 11 50 1 380 4 28 293 33 118 195 56Mitsubishi 16 42 13 50 17 14 119 49 94 17 88 1 171 30 45 130 148 121 179 501Ricoh 4 62 13 95 10 24 367 24 6 7 81 1 55 5 44 176 22 72 134 163NTT 3 55 8 61 14 22 177 36 21 11 27 5 129 8 57 72 23 107 273 42Sharp 5 74 3 21 7 16 203 35 7 8 28 0 92 7 14 153 33 54 142 88

42
Box B.2: Geographical agglomeration of industries
Firms within an industry tend to agglomerate (e.g. software companies in Silicon Valley, California) because there are benefits to having a large pool of skilled labour, easy access to local customers or suppliers and local knowledge spill-overs concentrated in one location. Until recently, the literature focused on the agglomeration of individual industries, and did not offer guidance on which types of effects mattered more. In a seminal paper, Ellison et al. (2010) propose a methodology to disentangle the strength of three different types of economic forces that result in industry agglomeration – consumer-supply relationships, labour market pooling and knowledge spill-overs. Using US data, they find that customer-supplier relationships have the strongest benefits, closely followed by labour market pooling. Knowledge spill-overs are found to be weaker than the other factors, but they are still statistically important.
The effects may also differ according to the industry. Whereas some industries require specialized workers with years of on-the-job training (labour linkages), other sectors often employ workers on short-term contracts through temporary work agencies. Similarly, some industries closely collaborate with their local suppliers (value chain linkages), while other industries operate according to anonymous exchanges with little need for buyer-supplier interaction. Knowledge spill-overs may be important catalysts for clustering for high-technology industries, but are less important in industries in which technology progresses less rapidly (Diodato, Neffke and O’Clery, 2018).
Using data from the United States, Diodato, Neffke and O’Clery (2018) show that services sectors, especially IT services, architecture, engineering, media and knowledge-intensive business services, are very much driven by agglomeration effects. The effects of labour linkages (i.e. the availability of a large pool of skilled labour) are particularly pronounced for services sectors. Conversely, manufacturing sectors are less likely to be clustered in one location, and their agglomeration is more likely to be driven by value chain linkages.
Faggio, Silva and Strange (2017) use data from the United Kingdom to show that the effects of agglomeration forces – in particular knowledge spill-overs – exist in new industries (i.e. sectors that are younger than the typical median industries) and for dynamic industries (i.e. sectors that have more new market entrants compared to the median entrants in a given year and industry). The effects of knowledge spill-overs are five to 10 times larger in new and dynamic industries than other industries. In particular, industries with high-technology components and high-education labour force tend to agglomerate due to knowledge spill-overs.
It has been suggested that the social distancing measures introduced during the COVID-19 pandemic and the rise of telework will lead to a decentralization of economic activities. Since the pandemic, some technology companies, including Facebook and Twitter, have committed to continuing remote work, citing benefits such as a more diverse hiring pool and reduced office space demands (Wittenberg, 2020). This trend has started to help spread economic activities from the top 15 most expensive cities in the United States to less expensive cities, generating higher earnings for professionals located outside metropolitan areas and lower costs for businesses (Ozimek, 2020). The dispersion of economic activities can also go beyond national borders: the accelerated adoption of digital technologies could allow companies to hire employees based in foreign countries teleworking from abroad, providing opportunities for workers in developing countries (Baldwin, 2020).
WORLD TRADE REPORT 2020
In addition, the evolution of transnational production networks and value chains has allowed an expansion of global innovation networks. The reduction of communication and coordination costs as a result of IT has led to a geographical dispersion of innovation activities. Multinational enterprises can establish one or more affiliate facilities at different locations around the world, allowing business activities such as R&D, design, production, marketing and the provision of services to be increasingly dispersed in multiple geographical
locations. R&D management, specialization decisions and exchanges of information take place among regional R&D facilities and the parent company. Different market participants such as networks of multinational enterprises, high-technology start-ups, universities and public research laboratories, venture capitalists, specialized technology brokers, standard-setting organizations and government agencies increasingly recognize the gains from research specialization and collaboration (Maskus and Saggi, 2013).

43
Firms are more scalable in the digital economy
The consumption of data and information by one person does not reduce the amount of data and information available to others, and this is considered to be non-rivalry by economists. The non-rival nature of data makes them ubiquitous and reusable without further costs, and also results in cost advantages, which companies obtain with an increasing scale of operation (“the economy of scale”). While economies of scale are observed in traditional sectors such as telecommunications and electricity supply, there are often limits to the cost advantages due to the finite supply of raw materials or saturation of regional markets. Creating and expanding a company in the digital age, however, requires much less physical capital. Although the initial investments in fixed assets are high, the cost of producing one additional unit of a digital product (e.g. producing an additional copy of a software) is almost zero and average costs rapidly decrease with scale.11
As firms in the digital economy no longer need the equipment and inventories to process physical goods, the major assets of a company are often intangible assets such as knowledge, brand recognition and intellectual property (patents, trademarks and copyrights), which are highly scalable. Consequently, we observe increasing incidences of “scale without mass” in the digital economy, which allow firms to scale up to serve entire markets much more rapidly. A number of start-up companies have reached very high percentages of international revenues within a few years of their inception, even when these “born global” companies were quite small and unknown at home.12
Table B.4 categorizes 20 large global companies in digital or digital-enabled sectors, ranging from internet platforms and digital content providers to telecommunication companies. In comparison to traditional multinational corporations, such as those in the telecommunications sector, large digital companies possess fewer foreign assets even though they derive a significant portion of their sales abroad.
The digital economy is also characterized by economies of scope, where the value of data increases when cross-referenced with other data sources. The competitive advantage that data provide is precisely the insight into markets or production processes that are not accessible without it (Ciuriak, 2018b). In addition, the digital economy features network effects, whereby the value of a network increases with additional users. This self-reinforcing mechanism often strengthens the dominant market positions of existing firms. As the co-founder of
PayPal, Peter Thiel, points out, commercial success is built on network effects and economies of scale: “Twitter can easily scale up but a yoga studio cannot” (Thiel and Masters, 2014).
Consequently, dominant market players are widely seen in the digital economy. For example, Google has some 90 per cent of the market for internet searches. Facebook accounts for two-thirds of the global social media market. Amazon boasts an almost 40 per cent share of the world’s online retail activity. In China, Alibaba has been estimated to have close to 60 per cent of the Chinese e-commerce market, while WeChat (owned by Tencent) has more than one billion active users, and together with Alipay (Alibaba), is offering mobile payment solutions for virtually the entire Chinese market (UNCTAD, 2019b). In terms of market structure, the data-driven economy gives rise to superstar firms, resulting in high market concentration across a wide swath of industries and a low share of labour in value-added and sales (Autor et al., 2020).
Integration of goods and services
Another special feature of digital technologies is that they allow goods and services to be increasingly integrated. As digital technologies allow for reduced costs and greater fluidity in reaching and interacting with consumers and in tracking their behaviour, the digital transformation moves manufacturing towards mixed models for providing goods and services and creates opportunities for innovation.
This servicification process comes through several channels. First, the services component of manufacturing, such as R&D, product design, branding, advertising and retail, is increasing and becoming more profitable than the manufacturing and assembly process (Timmer et al., 2014). Digitalization allows these services to be unbundled either as separate business entities or outsourced. Second, the rapidly changing technology and service requirements make it more common for firms to unbundle capital equipment into a service, thus turning capital expenditure into operation expenditure. This model means that some manufacturers no longer own their production equipment but pay either a fixed subscription cost or a variable fee to use and maintain the equipment (Mussomeli, Gish and Laaper, 2016). Third, entirely new services have emerged, such as predictive maintenance services using IoT, on-demand transportation services and web-based business services. The customization of products to adapt to individual customers’ specific needs has also become a service.
GOVERNMENT POLICIES TO PROMOTE INNOVATION IN THE DIGITAL AGEB
. DE
FIN
ING
INN
OV
AT
ION
-O
RIE
NT
ED
GO
VE
RN
ME
NT
PO
LICIE
S A
ND
TH
EIR
E
VO
LUTIO
N IN
THE
DIG
ITAL A
GE

44
As a result, services are gradually being integrated into manufacturing firms’ business activities. Many manufacturing companies are moving toward an “as-a-service” model, enabled by software, connectivity, and intelligent supply chain capabilities. For instance, Siemens, a producer of consumer and industrial appliances, installs sensors on many of its appliances that are monitored by software, allowing for more effective maintenance services for customers.
Conversely, services firms are also entering manufacturing activities, further blurring the frontier
between manufacturing and service. Retailers and logistics companies are gaining greater control over their supply chains by investing in next-generation digital logistics, empowering them to meet increasing consumer demand for fast and accurate delivery. Amazon is an illustration of this move. The company has its own private brands and owns a patent for an on-demand clothing manufacturing warehouse that enables the firm to quickly produce tailored clothing once customer orders are placed (Del Rey, 2017).
As a consequence of digitalization, a sustained shift in employment have been taking place from
Table B.4: Sales and assets of top digital companies globally
Category Company nameTotal sales
(billion US$)Total assets (billion US$)
Share of foreign sales (%)
Share of foreign assets (%)
Ratio between share of
foreign sales and assets
Internet platforms Alphabet (Google) 75 147.5 54 24 2.3
Facebook 17.9 49.4 53 21 2.5
eBay 8.6 17.8 58 7 8.3
Average 11.3 26.4 50 19 2.6
Digital Solutions Automatic Data Processing
11.7 43.7 15 10 2.3
First Data Processing
11.5 34.4 14 11 1.3
Paypal 9.2 28.9 50 7 7.1
Average 4.2 9.7 32 17 1.9
E-Commerce Amazon.com 107 65.4 36 32 1.1
Priceline.com 9.2 17.4 80 17 4.7
Expedia 6.7 15.5 44 11 4.0
Average 9.9 13.5 42 38 1.1
Digital Content 21st Century 27.3 48.2 29 10 2.9
Fox Liberty Global 18.3 67.9 61 65 0.9
Sky 16.1 23.5 30 7 4.3
Average 11.1 19.3 36 32 1.1
IT devices and components
Apple 215.6 321.7 65 39 1.7
Sony 72 148 71 24 3.0
Flextronics 24.4 12.4 70 20 3.5
Average 31.5 36.3 75 39 1.9
IT Software and Services
Microsoft 85.3 193.7 52 43 1.2
Qualcomm 23.6 52.4 98 18 5.4
Adobe Systems 5.9 12.7 47 21 2.2
Average 19.5 32.2 63 46 1.4
Telecom AT&T 146.8 402.7 4 5 0.8
Vodaphone 59 192.6 85 90 0.9
Telecom Italia 21.5 77.6 25 12 2.1
Average 31.3 74.8 42 46 0.9
Source: UNCTAD (2017) based on data from the Orbis – Bureau Van Dijk database.
WORLD TRADE REPORT 2020

45
the manufacturing sector to the services sector in developed countries and in an increasing number of developing countries. Automation, industrial robotics and better production technologies allow manufacturing activities to be more productive without requiring the same amount of workforce. Current technological progress, especially the use of computers and digital technologies in the workplace, has led to a higher relative demand for skilled workers and a lower relative demand for workers performing routine activities (WTO, 2017). As illustrated in Figure B.6, while manufacturing output increase in the United States, Germany and Japan, the share of manufacturing employment continues declining. In the meantime, the share of employment in services is increasing and requires higher skills. The shift of employment opportunities away from the manufacturing sector calls for policy adjustments to provide social safety net and opportunities for workers to acquire new skills.
The speed of change
A final defining feature of the digital economy is the sheer speed of change. As predicted by the co-founder and Chairman Emeritus of Intel Corporation, Gordon Moore, computing power has been doubling every two years since the dawn of the electronic age (“Moore’s Law”). The result is exponential growth in the price performance of computation at a much faster speed. Similarly, author George Gilder predicted that the carrying capacity of communication systems (the bandwidth) grows at least three times faster than computing power, which meant that the communications power doubles almost every six months (“Gilder’s Law”).
Such exponential growth of digital technologies implies that dramatic changes often take place rapidly, without any clear indication given by past experience. For example, smartphones appeared about a decade ago, but it could not have been predicted that over 5 billion people would come to own a mobile device today and that they would use these devices to exchange data, purchase products and share information. Innovation can also be more frequent, as the internet and platforms make it possible to launch new products and processes at lower costs. For example, in the automotive industry, new car models are launched once a year, whereas software updates (i.e. innovations that modify the models concerned) can be issued at a high frequency13 (Guellec and Paunov, 2018). It has been argued that machine-learning has further accelerated the pace of innovation, as computer algorithms are trained on large amount of data to optimize discovery, refine production processes, and improve product quality
(Ciuriak, 2019). Within the short period of time since the COVID-19 outbreak, advanced machine learning techniques have been used for rapid classification of COVID-19 genomes, predicting survival rates of severe patients, and discovering potential drug candidates against the virus (Alimadadi et al., 2020).
The speed of change in the digital economy has allowed major industry players in the digital sector to emerge within a short period of time. Compared with companies in the traditional economy that took decades or centuries to establish their brand reputations, the digital economy has allowed new business models and rapidly expanding lead firms to become established within a matter of years. As new business models challenge incumbents in novel ways and rapidly render skills obsolete, the fast pace of transformation requires societies to adapt and calls for agile government policies that stay ahead of the curve.
(ii) The digital economy requires changes in policymaking
The special features of the digital economy affect market outcomes and influence the effectiveness of innovation-based government policies, thus calling for new thinking in government priorities. In what follows, we describe several broad trends of how innovation and industrial policy in the digital age may evolve or break from previous generations of policy. A closer examination of specific policy tools to foster innovation and promote the digital economy is provided in Section B.3.
In the digital economy, data policies are an integral part of innovation and industrial policy. Support in internet and telecommunication infrastructure has become a key priority for many economies. Government policies also aim to foster innovation through R&D support and by developing innovation hubs and promoting digital literacy. Government policies need to be broad and agile to keep up with the pace of change, and policies to address market concentration and encourage competition are an integral part of government policies.
First, as data and digital intelligence become key inputs in the digital economy, data policies become an integral part of innovation and industrial policy. On the one hand, governments recognise the importance of data and digital intelligence in production and innovation, and therefore aim to create an attractive policy environment to support access to and use of data. On the other hand, data generation, collection, storage, capture and analysis by private firms have triggered concerns about privacy and security for
GOVERNMENT POLICIES TO PROMOTE INNOVATION IN THE DIGITAL AGEB
. DE
FIN
ING
INN
OV
AT
ION
-O
RIE
NT
ED
GO
VE
RN
ME
NT
PO
LICIE
S A
ND
TH
EIR
E
VO
LUTIO
N IN
THE
DIG
ITAL A
GE

46
Figure B.6: Factory jobs have declined but industrial production has continued to grow Factory output and manufacturing employment in Germany, Japan and the United States
Source: Authors’ calculation. The data for Germany and Japan are based on the US Bureau of Labour Statistics’ International Labor Comparisons (ILC) program. The figure for the United States is based on data from US Bureau of Labour Statistics.
Note: The figures for Germany and Japan reflect manufacturing output per employee and the share of employment in manufacturing. The figure for the United States reflects factory output volumes and manufacturing employment; the data have been adjusted with both indices equal to 100 in January 1972.
0
50
100
150
200
250
300
1972
1974
1976
1978
1980
1982
1984
1986
1988
1990
1992
1994
1996
1998
2000
2002
2004
2006
2008
2010
2012
2014
2016
2018
2020
0
20
40
60
80
100
120
140
Germany: output per employee and share of manufacturing employment
Japan: output per employee and share of manufacturing employment
United States: manufacturing employment and factory output volume (rebased 1972=100)
1970
1972
1974
1976
1978
1980
1982
1984
1986
1988
1990
1992
1994
1996
1998
2000
2002
2004
2006
2008
2010
2012
Germany: Output per employee
Germany: Share of manufacturing employment
Japan: Output per employee
Japan: Share of manufacturing employment
United States: Factory output volumes
United States: Manufacturing employment
0
20
40
60
80
100
120
140
160
1970
1972
1974
1976
1978
1980
1982
1984
1986
1988
1990
1992
1994
1996
1998
2000
2002
2004
2006
2008
2010
2012
WORLD TRADE REPORT 2020

47
both individuals and governments. Government policies thus aim to serve the twin purpose of fostering data-based innovation while mitigating the risks of digital technologies.
Second, support in building and upgrading telecommunication infrastructure has become a key priority for many economies, as digital connectivity offers the preconditions for market participants to access and utilize data. For example, 5G mobile telephone networks are expected to be a game-changer in digital sectors, as many new digital technologies such as the IoT depend on a fast and stable telecommunication network. Some 50 telecommunications operators are scheduled to start new 5G services by the end of 2020, requiring new investment in underwater cabling and in upgrading network capacity (Grijpink et al., 2018).
Notwithstanding the progress in enhancing digital connectivity, a major digital divide exists between advanced economies, developing countries and
LDCs. Figure B.7 illustrates the digital divide across countries of different development levels. While almost every individual in advanced economies owns one or more mobile devices and has access to mobile broadband, the number of mobile telephone and mobile broadband subscriptions in LDCs stand at 71 and 29 per cent respectively. The ratio of fixed broadband subscriptions in LDCs is even lower, at about 1 per 100 inhabitants. This gap in access to ICT infrastructure is compounded by the fact that internet connections in some low-income economies are slow and relatively more expensive. In some African countries, 1 gigabyte (GB) of internet data costs over 20 per cent of the average monthly income, which makes it unaffordable for all but the wealthy few (Alliance for Affordable Internet, 2019).
African LDCs have been able to leapfrog in certain digital services. For instance, African firms have become world leaders in mobile money transfer and payment services, which help bring affordable financial services such as banking, micro-payments
GOVERNMENT POLICIES TO PROMOTE INNOVATION IN THE DIGITAL AGEB
. DE
FIN
ING
INN
OV
AT
ION
-O
RIE
NT
ED
GO
VE
RN
ME
NT
PO
LICIE
S A
ND
TH
EIR
E
VO
LUTIO
N IN
THE
DIG
ITAL A
GE
Figure B.7: LDCs are still behind in access to digital infrastructureIndicators of ICT access per 100 inhabitants, 2018
Source: Author’s calculation based on data from International Telecommunications Union (ITU).
Fixed
telep
hone
subs
cript
ions
Mobile
telep
hone
subs
cript
ions
Active
mob
ile b
road
band
subs
cript
ions
Fixed
bro
adba
nd su
bscr
iption
sHou
seho
lds w
ith a
compu
ter
House
holds
with
inter
net a
cces
s at h
ome
Indivi
duals
using
the i
ntern
et
0
20
40
60
80
100
120
140
Per
100
indi
vidu
als/
hous
ehol
ds
World average Developed Developing LDCs

48
and remittances transfer to consumers, particularly in remote areas. Mobile money services have improved significantly in low-income countries, particularly in sub-Saharan Africa: the share of the population aged 15 years and older having a mobile money account reached 21 per cent by 2017, the highest share in the world (Figure B.8). Such technologies provide an alternative and cost-effective way to deliver services when traditional institutions are less efficient.
While it is acknowledged that LDCs are still lagging behind in ICT infrastructure equipment and access, the relatively high rates of mobile telephony equipment and growing internet penetration are already allowing certain countries to find areas of comparative advantage, notably in business processing outsourced activities enabled by the internet such as accounting, call centre services, transportation and delivery, in which tens of thousands of jobs have already been created in Africa (Songwe, 2019).
Third, the close connection between digitalization and innovation suggests an ever-closer alignment of government policy and building appropriate innovation ecosystem (Ciuriak, 2018a; Sampath, 2018). Table B.5 provides an illustrative list of the major changes to innovation policy motivated by the digital economy. Policies to spur innovation include reforming
the patent system, providing support for more GPTs, encouraging collaboration between universities and the business sector, ensuring access to data, and supporting innovation and entrepreneurship. As will be discussed in the following subsection, government policies to foster innovation include R&D support, capital market interventions, government procurement and the development of innovation hubs.
Finally, the changing dynamics of innovation requires governments to adapt their policies at a much faster pace. As it is practically impossible to foresee the applications and socioeconomic ramifications of digital technologies, government policies cannot provide guidance or regulations beforehand, but instead need to be flexible and agile to respond to the requirements of ever-emerging new technologies and business models. Policymaking in the digital age thus need to be broad and agile, refrain from overly detailed regulations, and follow an adaptive approach that favours experimentation, iteration and differentiation. For example, mechanisms such as regulatory sandboxes are used by policymakers to allow start-ups and other innovators to conduct live experiments in a controlled environment under a regulator’s supervision, thus helping policymakers to improve their understanding of regulatory needs (see Section B.3)
Figure B.8: Sub-Saharan Africa is leading in mobile bankingMobile money accounts, by country group, 2014 and 2017 (per cent of population aged 15 years or older)
Source: Author’s calculation based on World Bank Global Financial Inclusion Database.
Note: Country groups are those of the source.
0 5 10 15 20 25 30
Europe and Central Africa
Middle East and North Africa
East Asia and Pacific
South Asia
Latin America and Caribbean
Lower middle-income
Upper middle-income
World
Low-income
Sub-Saharan Africa
20172014
WORLD TRADE REPORT 2020

49
3. Mapping government policy instruments in the digital era: old tools, new tools
As noted in Section B.2, government policies are a complex mix of tools and objectives that evolve over time to adjust to new economic developments and priorities. With the rise of the digital economy, recent years have been characterized by a shift towards innovation to accelerate the transition into the digital age. This section reviews the specific policy tools used by governments over the past decade. Our analysis, based on WTO trade monitoring activities and complemented by the Global Trade Alert database (https://www.globaltradealert.org), shows that government policies continue to be widely used to support traditional sectors and to attract investment. However, there is increased focus on supporting innovation and the development of the digital economy through a mixture of traditional policy instruments, such as support for R&D and tariffs, and new regulatory approaches that promote innovation and address digital policy issues raised specifically by the digital economy.
Analysis is unfortunately hampered by the lack of specific information on key policy instruments (e.g. subsidies) and the existence of various sources of
information that are not necessarily comparable. In spite of these shortcomings, the data available provide a glimpse into the types of measures commonly applied.
Figure B.9, which is based on WTO trade monitoring activities, shows a relatively active use of various policy instruments over the past decade. The implementation of new measures by WTO members fluctuated over the period from 2009 to 2018, declining from a peak of 600 new measures during the 2009 financial crisis to a low of 400 new measures in 2013, to rise again to more than 500 in 2016.14 Another sharp decrease could be observed in 2017. Although the number of new measures varied over the period, the number of policy instruments used, by type, remained relatively constant until 2017, which saw a decrease in the number of import tariff measures.15 Trade remedies accounted for a large and steady number of new measures over the period, followed by import tariffs and support measures. Support measures, which represented more than one-third of the number of measures examined in 2009 owing to the financial crisis, decreased significantly between 2010 and 2014. A slight increase in the use of support measures can be observed thereafter.
These numbers, which cover both trade-liberalizing and trade-restrictive measures, do not capture
GOVERNMENT POLICIES TO PROMOTE INNOVATION IN THE DIGITAL AGEB
. DE
FIN
ING
INN
OV
AT
ION
-O
RIE
NT
ED
GO
VE
RN
ME
NT
PO
LICIE
S A
ND
TH
EIR
E
VO
LUTIO
N IN
THE
DIG
ITAL A
GE
Table B.5: Major changes to innovation policy called for by digitalization
Policy area Change required
All domains Use digital tools to mobilize more information, implementation and monitoring of policies.Engage with the public.Frame national policies in view of the global market.
Access to data Ensure access to data for innovators, taking into account diversity of data.Develop appropriate data access schemes, differentiating by types of data.Explore the development of markets for data.
Support for innovation and entrepreneurship
Ensure that policies are responsive and agile.Support more service innovations.Adapt the IP system. Facilitate access to data while preserving rights and incentives.Support the development of multi-purpose digital technologies.
Public research Promote open science (access to data, publications). Support interdisciplinary collaboration.Develop co-creation with industry. Support training in digital skills for science. Invest in digital infrastructure for science.
Competition and collaboration
Review the conceptual framework of competition policies as needed from the perspective of innovation in the age of platforms and easier entry (e.g. new rules regarding takeovers, standards, access to data, etc.). Adapt the IP system (protection of data, AI challenges).Support the transition of MSMEs and opportunities for diverse regions. Foster collaborative innovation.
Education and training Have innovation agencies support improvement of assessments of skills required for the digital transformation, ensuring that young people and students are properly equipped with these as well as skills for lifelong learning. Support proper management and organizational structures in firms for digital innovation. Support wider involvement in innovation by disadvantaged groups, through engagement and training.
Source: Guellec and Paunov (2018).

50
the incidence of such measures on global trade flows. They only provide a general idea of the type of measures used by governments. Further analysis conducted in the context of the trade monitoring process finds that approximately two-thirds of import tariff measures taken throughout this period are liberalizing measures, including agreements such as the Information Technology Agreement (ITA) or other bilateral free trade agreements (FTAs). Interestingly, the incidence on global trade flows of trade remedies, which are trade-restrictive by nature, increased sharply in 2017 and 2018, a period which also saw growing trade tensions (WTO, 2019b).
(a) Policy tools are widely used to support traditional economic sectors
The following analysis shows that a relatively high density of policy tools apply to the minerals, metals and chemical industries, textiles and clothing, electrical machinery and, to an extent, transport equipment. These sectors face globalized competition, a large degree of cyclicality, and
reduced profit margins. Market pressure to adapt, incorporate new technologies and mobilize capital explains the continued focus of industrial policy on these industries.
(i) Border measures
Regarding average unweighted most-favoured-nation (MFN) (i.e. non-discriminatory) applied tariffs, the general trend over the past decade has been one of overall tariff reduction at the global level. Average unweighted MFN applied tariffs, calculated from the WTO World Tariff Profiles database (which encompasses 94 economies), declined for developed economies from 3.14 per cent in 2009 to 2.35 per cent in 2018, and from 8.57 per cent to 7.94 per cent for developing economies. Even when tariffs were trade-weighted, the average applied duty changed very little over the period. The industrial sector with the highest average tariffs is clothing (garments), followed by textiles – although even these tariffs, which have historically been high, also experienced a modest decline between 2009 and 2018.
Figure B.9: Trade remedies, import tariffs and support measures are the most widely used policy measuresNumber of measures over time, by type of measure (2009-18)
Source: WTO Trade Monitoring Database.
Note: Measures covered include both new trade-liberalizing and trade-restrictive measures. Data for support measures are unavailable for 2017 and 2018. The year runs from November to October.
0
100
200
300
400
500
600
700
2009 2010 2011 2012 2013 2014 2015 2016 2017* 2018*
Num
ber o
f mea
sure
s
Support measures
Import tariffs
Export duties
Quantitative restrictions
Local content requirements
Government procurement
Trade remedies
Other
WORLD TRADE REPORT 2020

51
Average MFN applied tariffs, however, do not capture import tariffs imposed bilaterally in the context of anti-dumping or countervailing measures. Looking at these trade remedy measures provides a different picture. Trade remedies are a widely used policy tool. Although trade remedies are not directly an industrial policy tool, they are used to counter other members’ policies and are examined in the context of the WTO monitoring reports, which found a growing stockpile of import-restrictive measures over the 2009-2018 period.16 Minerals, metals and chemicals are the main sectors subject to these types of policies, in both developed and developing economies, and measures include anti-dumping and countervailing duties, and other “temporary” regulations to limit imports from specific trading partners. The most frequently used import-restrictive measure in terms of numbers implemented was anti-dumping duties, with more than 200 implemented in 2018. The use of these measures climbed substantially following a low in 2011 of roughly 110 new anti-dumping measures (see Figure B.10).
Comparing the distribution of anti-dumping measures by product category, roughly 60 per cent of measures imposed by developed economies focus on minerals and metals, for example steel and aluminium products (see Figure B.11). For developing economies, chemicals, which includes items from pigments and dyes all the way to plastics, is the product category with the highest number of anti-dumping measures (about one-third), followed closely by minerals and metals. Textiles are also important for developing economies, with 12 per cent of anti-dumping measures imposed on this sector. It is important to note that few LDCs have their own investigating authorities for trade remedies, meaning that this tool is not frequently used by these economies.
Finally, an analysis of export duties and quantitative restrictions provides a similar picture to the analysis of trade remedies, namely that they are primarily applied to the minerals, metals and chemicals industries. However, whereas for anti-dumping duties these sectors are targeted because of market segmentation, export duties mostly stem from governmental financial
GOVERNMENT POLICIES TO PROMOTE INNOVATION IN THE DIGITAL AGEB
. DE
FIN
ING
INN
OV
AT
ION
-O
RIE
NT
ED
GO
VE
RN
ME
NT
PO
LICIE
S A
ND
TH
EIR
E
VO
LUTIO
N IN
THE
DIG
ITAL A
GE
Figure B.10: Anti-dumping measures have seen a resurgence in recent yearsNumber of anti-dumping measures imposed over time (2009-18)
Source: WTO data on trade remedies.
Note: Includes information for the following economies: Argentina; Australia; Brazil; Canada; Chile; China; Colombia; Dominican Republic; Egypt; El Salvador; European Union; Guatemala; India; Indonesia; Israel; Japan; Republic of Korea; Malaysia; Mexico; Morocco; New Zealand; Pakistan; Panama; Peru; Philippines; Russian Federation; Kingdom of Saudi Arabia; South Africa; Chinese Taipei; Thailand; Trinidad and Tobago; Turkey; Ukraine; United States; Uruguay; Viet Nam.
Developed economies
Developing economies
0
50
100
150
200
250
2009
2010
2011
2012
2013
2014
2015
2016
2017
2018
Num
ber o
f ant
i-dum
ping
mea
sure
s im
pose
d

WORLD TRADE REPORT 2020
52
motivations. As noted in WTO (2010), the possibility of deriving large incomes from natural resources can incentivize exporting and importing economies to appropriate these incomes through trade restrictions.
Export duties as documented in the WTO trade monitoring database are exclusively applied by developing economies, almost two-thirds of which are applied to minerals and metals, followed by chemicals and textiles.17 Similarly, quantitative restrictions are a tool mostly used by developing economies, with nearly 40 per cent of these measures applied to minerals and metals, followed by chemicals and textiles.18
(ii) Local content and government procurement
Whereas trade remedies and border measures are used chiefly on primary and intermediate goods, local content and government procurement measures tend to apply to final goods, such as electrical machinery and transport equipment. These tools account for only a small part of total adopted support measures:
between 3 per cent and 6 per cent of the annual totals of new policy interventions each year according to the Global Trade Alert database, but these percentages probably understate the true totals.
Sectors targeted by local content and government procurement measures vary somewhat according to whether an economy is developed or developing. In developed economies, most local content measures19 were used for electronic components between 2009 and 2018 (Figure B.12). This was in contrast to government procurement, measures for which taken by developed economies primarily targeted minerals and metals in 2009-18, although largely by a single economy (Figure B.13). In contrast, developing economies, which often have objectives to protect infant industries (Hufbauer et al., 2013) target a much broader range of sectors for both local content measures and government procurement (figures B.12 and B.13). Only one LDC reported a “buy local” government procurement measure in the Global Trade Alert database.
Figure B.11: Minerals, metals and chemicals are the sectors most targeted by anti-dumping measures in both developed and developing economiesAnti-dumping measures by product categories (2009-18)
Source: WTO data on trade remedies.
Note: Includes information for the following economies: Australia; Canada; European Union; Japan; New Zealand; United States (developed) and Argentina; Brazil; Chile; China; Colombia; Dominican Republic; Egypt; El Salvador; Guatemala; India; Indonesia; Israel; Republic of Korea; Malaysia; Mexico; Morocco; Pakistan; Panama; Peru; the Philippines; Russian Federation; Kingdom of Saudi Arabia; South Africa; Chinese Taipei; Thailand; Trinidad and Tobago; Turkey; Ukraine; Uruguay; Viet Nam.
Mineral
s and
meta
lsChe
micals
Texti
lesW
ood,
pape
r, etc.
Electric
al mac
hiner
y
Non-e
lectric
al mac
hiner
y
Leath
er, fo
otwea
r, etc.
Other m
anufa
cture
s
Tran
spor
t equ
ipmen
t
0%
10%
20%
30%
40%
50%
60%
70%
Pro
port
ion
of a
nti-d
umpi
ng m
easu
res
impo
sed
Developed economies
Developing economies

B. D
EF
ININ
G IN
NO
VA
TIO
N-
OR
IEN
TE
D G
OV
ER
NM
EN
T P
OLIC
IES
AN
D T
HE
IR
EV
OLU
TION
IN TH
E D
IGITA
L AG
E
53
GOVERNMENT POLICIES TO PROMOTE INNOVATION IN THE DIGITAL AGE
Figure B.12: Local content measures focus on electrical and non-electrical machineryLocal content measures by product categories (2009-18)
Source: Global Trade Alert (https://www.globaltradealert.org).
Note: Includes submissions from the following economies: Australia, Austria, Belgium, Bulgaria, Canada, Croatia, Cyprus, Czech Republic, Denmark, Estonia, Finland, France, Germany, Greece, Hungary, Iceland, Ireland, Italy, Japan, Latvia, Liechtenstein, Lithuania, Luxembourg, Malta, Monaco, Netherlands, New Zealand, Norway, Poland, Portugal, Romania, Slovakia, Slovenia, Spain, Sweden, Switzerland, United Kingdom and United States.
0
2
4
6
8
10
12
14
16
Per
cent
age
of lo
caliz
atio
n m
easu
res
affe
ctin
g gi
ven
sect
or,
2009
-18
Developed economies Developing economies
Electro
nic co
mpone
ntsElec
tric m
otor
s
Inter
net t
eleco
mmunica
tions
Constr
uctio
n ser
vices
Telec
ommun
icatio
nsBas
ic iro
n and
stee
l
Produ
cts of
iron a
nd st
eel
Structu
ral m
etal p
rodu
cts
Buildin
gsMot
or ve
hicles
Mining
mac
hiner
y
Figure B.13: Government procurement measures are mostly in minerals and metals and non-electrical machineryGovernment procurement by product category (2008-18)
Source: Global Trade Alert (https://www.globaltradealert.org).
Note: Includes submissions from the following economies: Australia, Austria, Belgium, Bulgaria, Canada, Croatia, Cyprus, Czech Republic, Denmark, Estonia, Finland, France, Germany, Greece, Hungary, Iceland, Ireland, Italy, Japan, Latvia, Liechtenstein, Lithuania, Luxembourg, Malta, Monaco, Netherlands, New Zealand, Norway, Poland, Portugal, Romania, Slovakia, Slovenia, Spain, Sweden, Switzerland, United Kingdom and United States.
Per
cent
age
of g
over
nmen
t pro
cure
men
t mea
sure
s af
fect
ing
give
n se
ctor
, 200
9-18
Developed countries Developing countries
Produ
cts of
iron a
nd st
eel
Other f
abric
ated
metal p
rodu
ctsBas
ic iro
n and
stee
l
Structu
ral m
etal p
rodu
ctsDom
estic
appli
ance
sMeta
l was
te
Contai
ners
Bearin
gs an
d ge
arsRail
way lo
comot
ives
Motor
vehic
les
Electro
nic va
lves
Compu
ting
machin
ery
0
5
10
15
20
25

WORLD TRADE REPORT 2020
54
(iii) Support measures
While there is a plethora of descriptions and information on subsidies in the economic literature, there is no agreed definition and comprehensive database of support measures for domestic industries around the world. WTO (2006) discusses various definitions and forms of support that may be associated with subsidies, a discussion this report still considers to be relevant in 2020. The Global Trade Alert database uses its own concept. It tracks, in its own way, financial grants, state loans, and tax or social insurance relief, which would generally qualify as economic subsidies under the broad definitions used for analytical purposes. The Global Trade Alert database tends to confirm the trend observed for other policy instruments, i.e., that the number of support measures slightly declined after the 2008-09 financial crisis, and that, after a “plateau”, the use of support measures has been recently increasing, a trend that the COVID-19 pandemic is likely to magnify further. In 2018 alone, more than 400 new support measures were accounted for in the database, the most recorded during the entire 2009-18 period (see Figure B.14).
Types of support measures range from tax holidays to grants, and can cover specific industries or entire economies. Looking at the distribution of support measures by product category in both developed and developing economies, a large share are unclassified measures that are horizontal in nature, i.e., not
attributed to a specific sector. Electrical energy and motor vehicles are the most frequently affected sectors, followed by iron and steel and mining machinery.
Financial grants (e.g. R&D for clean transportation or other infrastructure support) and state loans are the two most widely used types of support measures. According to Global Trade Alert data, developed economies primarily used financial grants until 2014-15, but figures from recent years show a high and increasing use of state loans. Large developing economies seem to resort primarily to direct intervention through financial grants, while other developing economies seem to favour state loans.20 State loans are consistently the second-largest proportion of support measures employed by developing economies.
(b) Investment policies: a central piece of government policies
Investment policies have always been an important part of government policy and continue today as a key measure to promote economic development and competitiveness. According to UNCTAD (2018a), 90 per cent of new industrial policies include investment policy tools targeting all areas of the economy. There has been a growing focus on increasing FDI in recent decades, reflected by the explosion of investment promotion agencies (IPAs) and bilateral investment treaties in the 1990s (UNCTAD, 2000; WAIPA, 2019).
Figure B.14: Support measures have increased over the 2009-18 period Number of support measures (excluding export support) over time (2009-18)
Source: Global Trade Alert (https://www.globaltradealert.org) (data from February 2020).
Developed economies Developing economies
0
50
100
150
200
250
300
350
400
450
500
2009 2010 2011 2012 2013 2014 2015 2016 2017 2018
Num
ber o
f mea
sure
s

B. D
EF
ININ
G IN
NO
VA
TIO
N-
OR
IEN
TE
D G
OV
ER
NM
EN
T P
OLIC
IES
AN
D T
HE
IR
EV
OLU
TION
IN TH
E D
IGITA
L AG
E
55
GOVERNMENT POLICIES TO PROMOTE INNOVATION IN THE DIGITAL AGE
However, global economic changes have seen the value of FDI fluctuate in recent years (see Figure B.15). Although inward FDI was worth nearly US$ 1.2 trillion in 2018, this represented a decline from a high of more than US$ 2 trillion in 2015. Significantly, although in value terms investment has primarily targeted developed economies, developing economies have steadily attracted more investment dollars, surpassing developed economy FDI in 2014 and 2018. In fact, the recent decline in FDI flows is mainly attributable to three factors principally affecting developed economies, including tax reform in the United States, a decline in the average rates of return on FDI, and a systematic change in the source of production value from physical to intangible assets, such as IP and royalties, which has accompanied the growth of the digital economy (Omic, 2018).
Investment policy is used both to attract foreign investment and to regulate that foreign investment, including the conditions of establishment, issues of protection of assets and repatriation of profits.
A variety of tools are used for these purposes, although fiscal and financial incentives are the most prevalent investment promotion tools among economies of all development levels (see Table B.6) (UNCTAD, 2018). Incentives include tax or tariff exemptions and subsidized services or employee training programmes. Investment facilitation, be it regulatory exemptions or re-designed procedures, is another widely used investment promotion tool with broad horizontal coverage of an economy. Location requirements and incentives for investment, especially incentives to invest in special economic zones (SEZs), are also used to bring finance and development to a specific region or sector (see Box B.3
Figure B.15: Inward FDI flows reflect investment’s shift towards intangible assetsInward FDI flows (2009-18)
Source: UNCTAD statistics.
World Developed Developing LDC
0
0.5
1.0
1.5
2.0
2.5
2009 2010 2011 2012 2013 2014 2015 2016 2017 2018
Trill
ion
US
$
Table B.6: Survey of investment policy tools in industrial development strategies, by economic grouping
Entry and establishment
Economic grouping IncentivesSpecial zones/
incubatorsInvestment facilitation
Liberalization RestrictionPerformance requirements
Developed economies 97 83 67 3 0 3
Developing economies 92 78 82 18 5 20
LDCs 96 92 88 17 8 25
Source: UNCTAD (2018).
Note: From an UNCTAD survey of industrial policies including 30 strategies and 84 policies issued by economies across all regions. Some economies are covered by more than one industrial policy, and one industrial policy includes more than one investment promotion tool.

WORLD TRADE REPORT 2020
56
Box B.3: Special economic zones
One of the key features of investment policies in the past two or three decades has been the expansion of SEZs. Their number increased ten-fold in 25 years to nearly 5,400 in 2018 (UNCTAD, 2019a), and about 500 new SEZs are currently in preparation. Many economies wish to replicate the success of some of these zones in terms of economic expansion and innovation, as well as aim to fulfil economic development and industrial policy objectives. In some SEZs, economic activity has mutated in less than two decades from the production of low value-added manufacturing products to cutting-edge digital industries or services.
As with investment policies more generally, a variety of tools are used to attract investment into SEZs. These tools include fiscal incentives such as tax holidays, preferential border measures including import tariff exemptions, business-friendly regulations like faster permitting, real estate laws including ownership rights, and infrastructure support (see Figure B.16).
SEZs have had a particularly large role for many economies’ trade, being a facilitator of both imports, especially of intermediate goods, and exports of value-added products. Trade data reveals that a large share of some economies’ total manufacturing exports originate from SEZs and an estimated 20 per cent of global exports come from export zones, including an estimated 40 per cent of developing country exports (OECD and EUIPO, 2018). In addition, SEZs have been shown to play a key role in global value chain participation for processing intermediate goods, given that their customs exemptions generally prevent tariff accumulation (UNCTAD, 2019a).
Unfortunately, the central role of SEZs in many global value chains has been disadvantageous to them in the current COVID-19 pandemic. According to a survey conducted by the Kiel Institute and the World Free Zones Organization, nearly every free zone in the world has been affected by domestic measures to contain the virus, drops in demand, supply chain disruptions or losses of trade financing (Gern and Saskia, 2020).
Analysis by UNCTAD reveals that most SEZs no longer target specific economic activities and manufacturing and services. SEZs are increasingly moving into new areas, including high-tech sectors, and targeting objectives beyond exports. Additionally, SEZs are more and more often becoming a means for cross-border cooperation, for example when they straddle more than one economy (UNCTAD, 2018).
Figure B.16: Fiscal incentives are the tools most frequently used in SEZsTools used by SEZs
Source: UNCTAD (2019a).
Note: 127 SEZ laws from 115 countries were reviewed.
4
21
22
32
33
41
94
98
Social amenities
Infrastructure provision
Trade facilitation
Preferential land use
Investment protection
Investment facilitation
Special customs regime
Fiscal incentives

B. D
EF
ININ
G IN
NO
VA
TIO
N-
OR
IEN
TE
D G
OV
ER
NM
EN
T P
OLIC
IES
AN
D T
HE
IR
EV
OLU
TION
IN TH
E D
IGITA
L AG
E
57
GOVERNMENT POLICIES TO PROMOTE INNOVATION IN THE DIGITAL AGE
for more information on SEZs). Importantly, performance requirements may be tied to investment incentives to ensure that objectives like employment levels, exports or technology dissemination are achieved.
IPAs themselves are also a tool economies use to promote investment, both nationally and within specific sectors. Although investment policies often apply horizontally to all parts of a given economy, the majority of IPAs (94 per cent) target specific sectors (WAIPA, 2019). Sectors targeted by IPAs also vary by income level. Developed economies focus efforts on a range of sectors, most importantly ICT (70 per cent target this sector) followed by tourism, life science and renewable energy, compared to developing economies which focus on agriculture and fishery investment, followed by ICT and tourism (WAIPA, 2019). Beyond investment, economies target specific sectors to try to push development objectives, for example to move into higher technology sectors, particularly through SEZs.
While in the past two decades, the direction of investment policies had been to attract increased foreign investment under more liberal terms, a renewed emphasis has recently been placed on restrictive “investment screening procedures”, which require that governments investigate more deeply when considering whether to approve investment in sensitive sectors, such as energy and critical infrastructure, including infrastructure related to the digital economy (UNCTAD, 2018). In addition to traditional national security concerns such as those related to the acquisition of land and natural resources, new concerns related to the digital economy, such as access to citizens’ data or developing domestic capabilities related to new digital infrastructure, have become more prominent in investment policies.21 In addition, concerns about domestic capacity and capability with respect to the digital sector, particularly with regards to telecommunications, are increasingly being considered by governments prior to allowing certain types of foreign investment (ECIPE, 2020).
Although some restrictions may be appearing, attracting investment remains an important tool used by economies for growth and development, especially with the growth of the digital economy. Just as IPAs are increasingly focused on bringing investment to ICT, the focus of economies’ investment measures more generally has turned to the digital economy. Ensuring that an economy has adequate access to high speed internet or to the latest mobile technology is becoming more critical for integration into the global economy, and economies are taking measures to invest in this infrastructure themselves.
(c) Old tools, new tools: supporting innovation and the development of the digital economy
Although government policy tools continue to support traditional economic sectors, an increasing focus is being placed on broader policy objectives, including the promotion of innovation and the development of the digital economy.
As many economies gradually move towards a knowledge-driven economy, the use of policy tools has evolved to facilitate new technological developments and innovation. This subsection provides insights on the evolution of policy tools used by economies across different levels of development to promote innovation and development of the digital economy. It discusses public efforts to support R&D, policy interventions implemented on trade in ICT goods (as enablers of digitalization), measures and regulations applied to trade in ICT-enabled services (i.e. cross-border services provided in digitized form), and the rising use of high-tech clusters and tech hubs to foster innovation.
(i) R&D as an engine of innovation
R&D plays a critical role in the innovation process. R&D essentially consists of an investment in technology and future capabilities that is transformed into new products, processes and services. Companies, governments, universities and non-profit organizations around the world have made substantial investments in R&D.
Gross R&D expenditure has been increasing, but R&D intensity gaps persist across income groups and regions
R&D expenditures have grown significantly over the last two decades, but gaps in R&D intensity persist across income groups. Total global R&D expenditures, including both private and public investments, nearly tripled in current dollars since 2000, from US$ 676 billion to US$ 2.0 trillion (UNESCO, 2020b).
From a historical perspective, global R&D expenditures have undergone important shifts over the last three decades. Today, it is not only high-income economies that are conducting R&D in earnest; middle-income economies represent a significant and rising share of global R&D expenditures. While in 1996 high-income economies accounted for 87 per cent of global R&D, in 2017 they only represented 64 per cent of total investments — the lowest share registered in the last 30 years. Middle-income economies represented 35 per cent of total R&D expenditures in 2017. Asian R&D powerhouses, such as China, India, Japan and the Republic of Korea, contributed to as much as 40

WORLD TRADE REPORT 2020
58
per cent of the world’s R&D in 2017, up from 22 per cent in 1996 (WIPO, 2019a).
R&D intensity, defined as global R&D expenditures divided by global GDP, allows a comparison of the degree of importance given to R&D for spurring innovation. R&D intensity has been relatively stable, increasing from 1.4 per cent in 1996 to 1.7 per cent since 2013 (UNESCO, 2020b). As Figure B.17 illustrates, most of the growth in R&D intensity has been registered among upper middle-income economies, with intensities rising from 0.6 per cent in 1996 to 1.5 per cent in 2017. Growth in R&D intensity is concentrated in a few countries, notably China, where R&D intensity grew from 0.6 per cent in 1996 to 2.1 per cent in 2017, and Malaysia, where R&D intensity grew from 0.2 per cent to 1.3 per cent over the same period. In contrast, R&D intensity only improved marginally among middle-income economies, excluding China, from 0.5 per cent in 1996 to 0.6 per cent in 2017, and in low-income economies, from 0.2 per cent to 0.4 per cent.
Figure B.18 presents the distribution of R&D intensity by region and R&D intensity trends between 1996 and 2016. North America and Western Europe have been leading total global R&D expenditures. However, East Asia and the Pacific countries have experienced the most significant growth rate (50 per cent) in the
last three decades, followed by the Arab States (30 per cent), Latin America and the Caribbean (29 per cent) and sub-Saharan Africa (19 per cent).
In many economies, direct government funding and tax incentives are key policy instruments to promote R&D and innovation.
Investment in R&D is an important driver of innovation and economic growth. The primary source of funding for R&D varies across economies, with governments playing a leading role in low-income economies. Figure B.19 illustrates the evolution of R&D expenditure by source of funding (business, government, higher education or private non-profit organizations, and funds from abroad – i.e. rest of the world) across different economies and income levels. Although the period for which data are available is limited (2012-17), interesting trends emerge: governments appear to play a significant role as a source of direct funding for R&D in low-income and lower middle-income economies and act as the second primary source of funding in high-income countries and upper middle-income economies with a consistent level of spending at around 22 per cent and 30 per cent respectively. Direct government support typically takes the form of subsidies and grants to research institutes and firms, including MSMEs. In contrast, the business sector acts as a
Figure B.17: R&D intensity increased in all economies except lower middle-income economiesEvolution of R&D intensity by level of development (1996-2016)
Source: UNESCO (2020b).
0
0.5
1.0
1.5
2.0
2.5
1996 1997 1998 1999 2000 2001 2002 2003 2004 2005 2006 2007 2008 2009 2010 2011 2012 2013 2014 2015 2016
% o
f GD
P
Low-income economies Lower middle-income economies Middle-income economies
Upper middle-income economies High-income economies World

B. D
EF
ININ
G IN
NO
VA
TIO
N-
OR
IEN
TE
D G
OV
ER
NM
EN
T P
OLIC
IES
AN
D T
HE
IR
EV
OLU
TION
IN TH
E D
IGITA
L AG
E
59
GOVERNMENT POLICIES TO PROMOTE INNOVATION IN THE DIGITAL AGE
Figure B.18: North America, Western Europe, and East Asia and the Pacific have the highest R&D intensityR&D intensity by region, 1996, 2006 and 2016 (R&D expenditure as a percentage of GDP)
Source: UNESCO (2020b).
1996 2006 2016
0
0.5
1.0
1.5
2.0
2.5
3.0
Central Asia Sub-SaharanAfrica
South andWest Asia
LatinAmerica and
the Caribbean
Central andEasternEurope
East Asiaand thePacific
NorthAmerica and
WesternEurope
Arab States World
% o
f GD
P
Figure B.19: Government funding plays a key role in lower middle-income and low-income economiesSource of funding for R&D across various levels of development (2012-17)
Source: Author’s calculation based on UNESCO data (UNESCO, 2020b).
0%10%20%30%40%50%60%70%80%90%
100%
2012 2013 2014 2015 2016 2017
High-income countries
0%10%20%30%40%50%60%70%80%90%
100%
2012 2013 2014 2015 2016 2017
Upper middle-income
0%
20%
40%
60%
80%
100%
2012 2013 2014 2015 2016 2017
Lower middle-income
0%10%20%30%40%50%60%70%80%90%
10%
30%
50%
70%
90%100%
2012 2013 2014 2015 2016 2017
Low-income countries
Business enterprise
Private non-profit
Government
Rest of the world
Higher education
Not specified

WORLD TRADE REPORT 2020
60
primary source of funding for R&D in high-income countries, accounting for around 75 per cent over the 2012-17 period.
Direct government funding is also increasingly being used to promote innovation and R&D in MSMEs. Data from the European Commission and the OECD Compass on science, technology and innovation policy (STIP Compass) reveals that direct funding support for R&D is the most common policy instrument used to support MSME innovation in the 51 economies considered22 and that such support grew significantly over the period between 2000 and 2017 (see Figure B.20). Grants are the most popular form of direct financial support – although governments increasingly use other tools as well, such as indirect financial support (e.g. tax incentives, debt guarantees), innovation vouchers to work with academic researchers, and public procurement programmes for R&D.
In addition to direct funding, governments can support R&D through tax incentives. R&D tax incentives have
become a major tool for promoting business R&D in high-income economies. The choice of R&D tax incentives depends on country-level variables such as overall innovation performance, market failures in R&D, industrial structure, size of firms and the nature of the corporate tax system. R&D tax credits are neutral with respect to the type of R&D being conducted by a firm, and therefore operate more in accordance with market rationale than direct support.
According to OECD (2020), many countries have increased the availability, simplicity of use and generosity of R&D tax incentives. In 2019, 30 out of 36 OECD countries, 21 out of 28 EU member states, and several other economies (Argentina, Brazil, Colombia, China, the Russian Federation and South Africa) gave preferential tax treatment to R&D expenditures. Over the period from 2009 to 2015, nearly half of 107 developing economies (20 low-income, 39 lower-middle income, and 48 upper-middle-income countries) also granted tax exemptions or tax reductions to firms on the condition that they spend on R&D (see Table B.7).
Figure B.20: Direct financial support is the main policy instrument to support R&D in MSMEsNumber of MSME-related measures aimed at fostering innovation and R&D in 51 economies (2000-17)
Source: European Commission and OECD (2019).
0
20
40
60
80
100
120
140
2000 2001 2002 2003 2005 2006 2007 2008 2009 2010 2011 2012 2013 2014 2015 2016 2017
Num
ber o
f MS
ME
-rel
ated
mea
sure
s
Indirect financial support (e.g. tax relief: debt guarantees)
Guidance, regulation and other incentives (e.g. business services; labour mobility regime; IP incentives and guidelines)
Governance (e.g. national strategies; public awareness campaigns; formal consultation with stakeholders)
Direct financial support (e.g. grants; loans; equity financing)
Collaborative platforms and infrastructure (e.g. dedicated support to new research infrastructure; clusters)

B. D
EF
ININ
G IN
NO
VA
TIO
N-
OR
IEN
TE
D G
OV
ER
NM
EN
T P
OLIC
IES
AN
D T
HE
IR
EV
OLU
TION
IN TH
E D
IGITA
L AG
E
61
GOVERNMENT POLICIES TO PROMOTE INNOVATION IN THE DIGITAL AGE
Table B.7: Nearly half of surveyed developing economies granted tax holidays or tax allowances to firms on condition that they spend on R&D Based on 107 developing economies (2009–15)
East Asia and Pacific
Europe and
Central Asia
Latin America and the
Caribbean
North Africa and
Middle East
South Asia
Sub-Saharan
Africa
Low-income
Lower middle-income
Upper middle-income
Total
Number of economies covered in database
15 18 23 8 6 37 20 39 48 107
% of economies providing tax exemptions subject to spending on R&D
65 24 32 48 34 38 24 40 23 40
% of economies providing tax reductions subject to spending on R&D
46 10 23 14 67 81 67 47 35 46
Source: Author’s calculation based on the Developing Country Tax Incentives Database (Andersen, Kett and von Uexkull, 2017). This database provides information on 107 developing economies for the period 2009–15.
Figure B.21: In some countries, MSMEs enjoy preferential tax subsidy rates on R&D expendituresImplied tax subsidy rates on R&D expenditures (2019)
Source: OECD R&D Tax Incentives Database (OECD, 2020).
Note: Figure B.21 reflects the tax treatment of R&D expenditure for MSMEs and large enterprises in OECD economies, the European Union and other major economies. The implied tax subsidy rate is defined as 1 minus the B-index, i.e. a measure of the income before taxes of a representative firm on one additional unit of R&D outlay (Warda, 2001). Measures of tax subsidy rates such as those based on the B-index provide a convenient proxy for examining the implications of tax relief provisions. They provide a synthetic representation of the generosity of a tax system. To provide a more accurate representation of different scenarios, B-indices are calculated for “representative” firms according to whether they can claim tax benefits against their tax liability in the reporting period (OECD, 2013).
0
0.1
0.2
0.3
0.4
0.5
Fran
ce
Portug
alChil
e
Colombia
Spain
Nether
lands
Canad
a
Lithu
ania
Slovak
Rep
ublic
Brazil
United
King
dom
Repub
lic of
Kor
ea
Czech
Rep
ublic
Japa
n
Austra
lia
South
Africa
Russia
n Fed
erati
on
Greec
eChin
a
Roman
ia
Mexico
Turke
y
United
Stat
es
Sweden Ita
ly
Croati
a
1-B-index
Large, profitable firm MSME, profitable firm
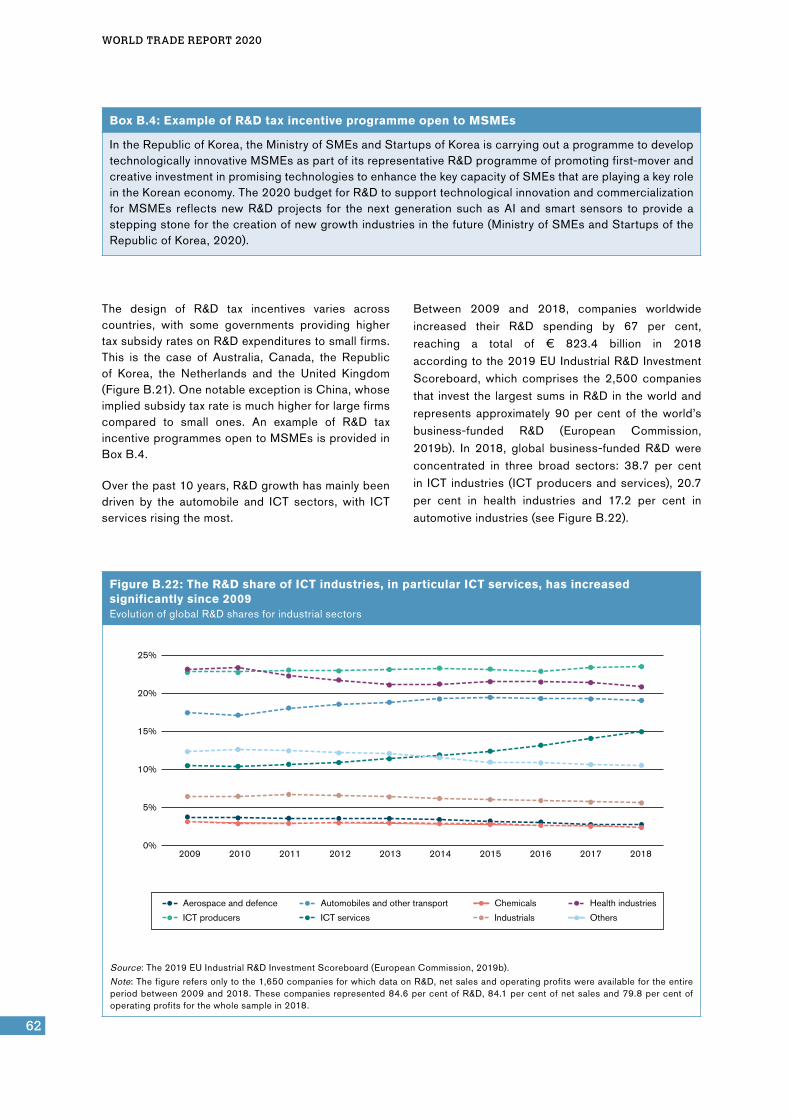
WORLD TRADE REPORT 2020
62
The design of R&D tax incentives varies across countries, with some governments providing higher tax subsidy rates on R&D expenditures to small firms. This is the case of Australia, Canada, the Republic of Korea, the Netherlands and the United Kingdom (Figure B.21). One notable exception is China, whose implied subsidy tax rate is much higher for large firms compared to small ones. An example of R&D tax incentive programmes open to MSMEs is provided in Box B.4.
Over the past 10 years, R&D growth has mainly been driven by the automobile and ICT sectors, with ICT services rising the most.
Between 2009 and 2018, companies worldwide increased their R&D spending by 67 per cent, reaching a total of € 823.4 billion in 2018 according to the 2019 EU Industrial R&D Investment Scoreboard, which comprises the 2,500 companies that invest the largest sums in R&D in the world and represents approximately 90 per cent of the world’s business-funded R&D (European Commission, 2019b). In 2018, global business-funded R&D were concentrated in three broad sectors: 38.7 per cent in ICT industries (ICT producers and services), 20.7 per cent in health industries and 17.2 per cent in automotive industries (see Figure B.22).
Box B.4: Example of R&D tax incentive programme open to MSMEs
In the Republic of Korea, the Ministry of SMEs and Startups of Korea is carrying out a programme to develop technologically innovative MSMEs as part of its representative R&D programme of promoting first-mover and creative investment in promising technologies to enhance the key capacity of SMEs that are playing a key role in the Korean economy. The 2020 budget for R&D to support technological innovation and commercialization for MSMEs reflects new R&D projects for the next generation such as AI and smart sensors to provide a stepping stone for the creation of new growth industries in the future (Ministry of SMEs and Startups of the Republic of Korea, 2020).
Figure B.22: The R&D share of ICT industries, in particular ICT services, has increased significantly since 2009 Evolution of global R&D shares for industrial sectors
Source: The 2019 EU Industrial R&D Investment Scoreboard (European Commission, 2019b).
Note: The figure refers only to the 1,650 companies for which data on R&D, net sales and operating profits were available for the entire period between 2009 and 2018. These companies represented 84.6 per cent of R&D, 84.1 per cent of net sales and 79.8 per cent of operating profits for the whole sample in 2018.
0%
5%
10%
15%
20%
25%
2009 20112010 2012 2013 2014 2015 2016 2017 2018
Aerospace and defence
ICT producers
Chemicals
Industrials
Health industries
Others
Automobiles and other transport
ICT services

B. D
EF
ININ
G IN
NO
VA
TIO
N-
OR
IEN
TE
D G
OV
ER
NM
EN
T P
OLIC
IES
AN
D T
HE
IR
EV
OLU
TION
IN TH
E D
IGITA
L AG
E
63
GOVERNMENT POLICIES TO PROMOTE INNOVATION IN THE DIGITAL AGE
Figure B.22 illustrates the evolution of global R&D shares in main industries over the past decades. Globally, an important sector shift occurred in ICT industries, mainly in ICT services whose R&D share increased from 10.8 per cent to 14.2 per cent. The share of ICT producers also rose, although to a lesser extent, from 23.0 per cent to 23.7 per cent. Sectors that underwent a decrease in R&D shares included aerospace and defence, and chemicals, as well as other sectors covering low-tech activities, such as textiles.
(ii) Public efforts to support digitalization and the ICT sector
Governments have used a mix of policy interventions to support digital transformation and foster innovation in the digital sector over the last decade, from traditional tools such as direct and indirect funding of R&D and innovation-oriented public procurement, to more innovative tools like data-related regulations and regulatory sandboxes.
How traditional instruments are used to support the digital transformation
The various tools used to support traditional sectors examined in Section B.3(a) form part of the collection of instruments to which governments also commonly resort to support digitalization and the ICT sector.
Although the data from the Global Trade Alert are incomplete, they do give some idea of the extent to which such tools have been used in relation to ICT goods and ICT services over the last decade (see Figures B.23 and B.24).
Among the 184 economies tracked by the Global Trade Alert database (https://www.globaltradealert.org), 132 economies (of which the European Union counted as 27) took a total of 1,264 measures – both trade-facilitating and trade-restrictive – targeted ICT goods between 2009 and 2018. These 132 economies cover 71 per cent of the world’s developed economies, 75 per cent of its developing
Figure B.23: Various measures target ICT goods Evolution of the type of measures targeting ICT goods between 2009 and 2018 (number of policy interventions)
Source: Global Trade Alert (https://www.globaltradealert.org).
Note: ICT goods include: computing machinery and parts; television and radio transmitters, cameras, telephone sets; broadcast recording apparatus, microphones, loudspeakers, etc.; disks, tapes, storage devices and other media, not recorded; disks, tapes and other physical media, recorded; packaged software; and cards with magnetic strips or chip. The category “Other” includes: controls on commercial transactions and investment instruments; controls on credit operations; internal taxes and charges levied on imports; competitive devaluation; finance measures; undefined policy instruments; labour market access; licensing or permit requirements to export; export taxes and charges; and other export measures. Measures covered include both trade-facilitating and trade-restrictive measures.
0 20 40 60 80 100 120 140 160
2009
2010
2011
2012
2013
2014
2015
2016
2017
2018
Quantitative import restrictions Import tariffs
Public procurement
Export financial support FDI measures
Trade remedies
Financial support (excluding export financial support) Local content measures
Other

WORLD TRADE REPORT 2020
64
Figure B.24: Only a few measures target ICT servicesEvolution of the type of measures targeting ICT services sectors between 2009 and 2018 (number of policy interventions)
Source: Global Trade Alert (https://www.globaltradealert.org).
Note: Measures covered include both trade-facilitating and trade-restricting measures. ICT services include telephony and other telecommunications services, internet telecommunications services, and online content. Measures covered include both trade-facilitating and trade-restrictive measures.
0 10 20 30 40 50 60
2009
2010
2011
2012
2013
2014
2015
2016
2017
2018
Quantitative import restrictions Import tariffs
Public procurement Export financial support
FDI measures Trade remedies
Financial support (excluding export financial support)
Local content measures
Other
economies and 31 per cent of LDCs. By contrast, only 342 measures targeted ICT services over the review period, and these were taken by 57 economies representing 57 per cent of developed economies, 30 per cent of developing economies and 8 per cent of LDCs (see Figure B.24).
In the case of goods, import tariffs appear to be the most widely used tool. About two-thirds of import tariff measures taken between 2009 and 2018 were trade-liberalizing. Financial support and export financial support are also popular instruments. In terms of measures targeting ICT services, FDI measures, financial support, export financial support and local content measures were the most widely used.
While, in the case of measures targeting ICT goods, trade-facilitating and trade-restrictive measures were used to more or less the same extent – 613 trade-restrictive versus 590 trade-facilitating measures, and 61 with unclear effects on trade. Measures targeting ICT services were mainly trade-restrictive, suggesting a preferred approach for endogenous innovation – 204 trade-restrictive versus 67 trade-facilitating, and 70 with unclear effects on trade (see https://www.globaltradealert.org).
As already noted, these numbers only provide a glimpse of the types of measures used to support digitalization. They do not provide a comprehensive picture of policy interventions and need to be handled with care.
Elimination of import tariffs as a trade-liberalizing tool to improve access to ICT products
Over the last decade, the elimination of import tariffs has been the primary tool used by most countries to improve their access to ICT products. The WTO ITA is the most significant tariff liberalization arrangement concerning trade in ITA products. Through the ITA, participants agreed to eliminate tariffs on a range of ICT products,23 including computers, telecommunication equipment, semiconductors, software, as well as most of the parts and accessories of these products. Since 1996, the number of ITA participants has grown to 82, representing approximately 97 per cent of world trade in ICT products. In 2015, over 50 WTO members concluded the expansion of the ITA, which now covers an additional 201 products, accounting for 99 per cent of the value of global ICT goods, and some 80 per

B. D
EF
ININ
G IN
NO
VA
TIO
N-
OR
IEN
TE
D G
OV
ER
NM
EN
T P
OLIC
IES
AN
D T
HE
IR
EV
OLU
TION
IN TH
E D
IGITA
L AG
E
65
GOVERNMENT POLICIES TO PROMOTE INNOVATION IN THE DIGITAL AGE
Figure B.25: World exports of ITA products almost quadrupled between 1996 and 2018World exports of ITA products in US$ billion and percentage change
Source: WTO Secretariat based on UN Comtrade (https://comtrade.un.org) (reported data, complemented by mirror estimates).
18%
1%
13%
23%
-14%
0%
7%
28%
4%
15%
3% 2%
-16%
24%
6% 6% 6%
3%
-5%-2%
14%12%
549
2027
-20%
-15%
-10%
-5%
0%
5%
10%
15%
20%
25%
30%
0
500
1,000
1,500
2,000
2,500
19961997
19981999
20002001
20022003
20042005
20062007
20082009
20102011
20122013
20142015
20162017
2018
Annual percentage change (%) Exports (US$ billions)
cent of all product lines in this category. Trade in ITA products has expanded 3.7 times since the ITA came into force (see Figure B.25).
Direct and indirect government financial support to ICT innovation and the digital economy
The ICT sector plays an increasingly important role in the global economy. According to a study by the European Commission, the ICT sector of 40 economies24 tripled in value-added in the last two decades (European Commission, 2019a). The COVID-19 pandemic will likely strengthen this trend. Government direct funding and indirect financial support foster ICT innovation and the digital economy in at least three ways: by stimulating R&D, by strengthening the supply of ICT innovative products, and by boosting the demand for these ICT innovative products.
First, direct public funding of R&D in the ICT sector plays a critical role in the digital transformation. Although data are limited with regard to the amount of public spending on ICT innovation, available evidence in advanced economies shows that public funding of R&D (measured as total government budget allocations for R&D, or GBARD) devoted
to funding ICT-related expenditure has increased in value in the United States and European Union (European Commission, 2019a). By 2017, ICT-related government expenditure had reached € 6.7 billion in the European Union (representing 7 per cent of total EU government budget allocations for R&D), and € 10.9 billion in the United States (8 per cent of its total R&D budget). As for Japan, its share of ICT-related expenditures in total government budget allocations for R&D slightly decreased over the period with some ups and downs (see Figure B.26).
Governments also use direct funding and indirect financial support to foster R&D in advanced technologies, including AI, 5G mobile telephone networks, additive manufacturing (i.e. 3D printing), IoT and Blockchain. For instance, India, the Republic of Korea, Singapore and the United Kingdom finance 5G trials to enable businesses to test their 5G products and hence to develop new 5G use cases. The Republic of Korea offers tax exemptions to businesses undertaking 3D printing R&D, and Germany finances a blockchain R&D laboratory to assess blockchain applications. Brazil has set up a new AI institute (the Advanced Institute for Artificial Intelligence) promoting partnerships between universities and companies on joint AI R&D projects. In light of the growing importance of IP in today’s
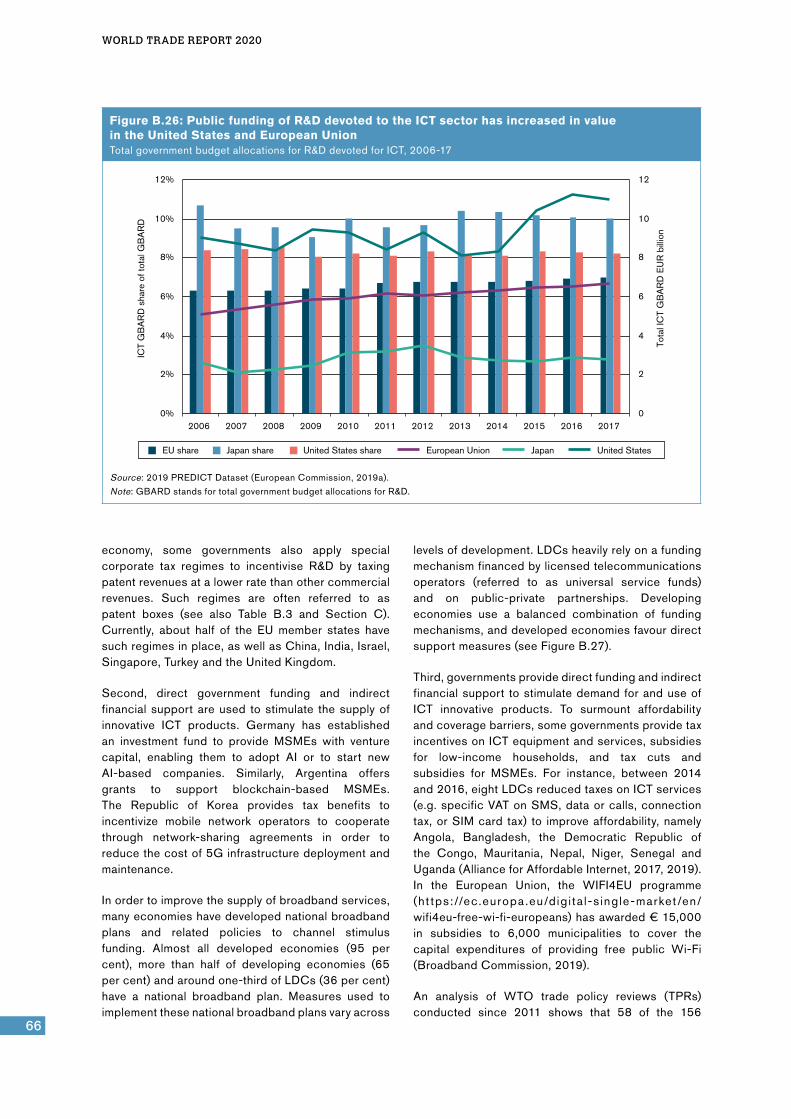
WORLD TRADE REPORT 2020
66
economy, some governments also apply special corporate tax regimes to incentivise R&D by taxing patent revenues at a lower rate than other commercial revenues. Such regimes are often referred to as patent boxes (see also Table B.3 and Section C). Currently, about half of the EU member states have such regimes in place, as well as China, India, Israel, Singapore, Turkey and the United Kingdom.
Second, direct government funding and indirect financial support are used to stimulate the supply of innovative ICT products. Germany has established an investment fund to provide MSMEs with venture capital, enabling them to adopt AI or to start new AI-based companies. Similarly, Argentina offers grants to support blockchain-based MSMEs. The Republic of Korea provides tax benefits to incentivize mobile network operators to cooperate through network-sharing agreements in order to reduce the cost of 5G infrastructure deployment and maintenance.
In order to improve the supply of broadband services, many economies have developed national broadband plans and related policies to channel stimulus funding. Almost all developed economies (95 per cent), more than half of developing economies (65 per cent) and around one-third of LDCs (36 per cent) have a national broadband plan. Measures used to implement these national broadband plans vary across
levels of development. LDCs heavily rely on a funding mechanism financed by licensed telecommunications operators (referred to as universal service funds) and on public-private partnerships. Developing economies use a balanced combination of funding mechanisms, and developed economies favour direct support measures (see Figure B.27).
Third, governments provide direct funding and indirect financial support to stimulate demand for and use of ICT innovative products. To surmount affordability and coverage barriers, some governments provide tax incentives on ICT equipment and services, subsidies for low-income households, and tax cuts and subsidies for MSMEs. For instance, between 2014 and 2016, eight LDCs reduced taxes on ICT services (e.g. specific VAT on SMS, data or calls, connection tax, or SIM card tax) to improve affordability, namely Angola, Bangladesh, the Democratic Republic of the Congo, Mauritania, Nepal, Niger, Senegal and Uganda (Alliance for Affordable Internet, 2017, 2019). In the European Union, the WIFI4EU programme (ht tps: //ec .europa .eu/digi ta l-s ingle-market /en/wifi4eu-free-wi-fi-europeans) has awarded € 15,000 in subsidies to 6,000 municipalities to cover the capital expenditures of providing free public Wi-Fi (Broadband Commission, 2019).
An analysis of WTO trade policy reviews (TPRs) conducted since 2011 shows that 58 of the 156
Figure B.26: Public funding of R&D devoted to the ICT sector has increased in value in the United States and European UnionTotal government budget allocations for R&D devoted for ICT, 2006-17
Source: 2019 PREDICT Dataset (European Commission, 2019a).
Note: GBARD stands for total government budget allocations for R&D.
0
2
4
6
8
10
12
0%
2%
4%
6%
8%
10%
12%
2006 2007 2008 2009 2010 2011 2012 2013 2014 2015 2016 2017
Tota
l IC
T G
BA
RD
EU
R b
illio
n
ICT
GB
AR
D s
hare
of t
otal
GB
AR
D
EU share Japan share United States share European Union Japan United States

B. D
EF
ININ
G IN
NO
VA
TIO
N-
OR
IEN
TE
D G
OV
ER
NM
EN
T P
OLIC
IES
AN
D T
HE
IR
EV
OLU
TION
IN TH
E D
IGITA
L AG
E
67
GOVERNMENT POLICIES TO PROMOTE INNOVATION IN THE DIGITAL AGE
members covered over the review period provided financial support to ICT-related services, that is almost 40 per cent of WTO membership representing all levels of development. Slightly more than four-fifths of the developed countries covered by the analysis, a quarter of the developing economies, and about a tenth of the LDCs have adopted similar support measures. LDCs essentially resort to tax incentives and developed economies to direct grants, while developing economies tend to use both instruments, although tax incentives appear to be more popular (see Figure B.28).
The use by developed economies of direct grants, which are a potent catalyst for growth and innovation, could further accelerate disparities between LDCs – which essentially resort to tax incentives – and more advanced economies. These numbers need to be considered with caution, as WTO TPRs do not systematically cover all services and may not provide the same level of detail across TPRs. However, they provide an interesting glimpse into the type of instruments being used to support ICT-related services.
Government procurement: a tool frequently used to foster innovation and digitalization
When used strategically, government procurement – also called public procurement – can boost
innovation at both the national and local levels, and can ultimately improve productivity and inclusiveness. Through procurement, governments can shape innovation directly or indirectly by helping firms to recuperate the sunk costs of large and sometimes risky investments.
A number of governments increasingly resort to procurement to foster innovation. According to the OECD (2017), 81 per cent of OECD countries have developed strategies or policies to support innovation through public procurement, and 50 per cent have developed an action plan for innovation procurement. Increasing attention is also being paid to the role that public procurement can play in supporting MSMEs to grow and innovate. Out of 180 economies covered by World Bank (2016), 85 economies (47 per cent) had introduced incentives for MSMEs to participate in public procurement. In 2012, participants in the WTO Government Procurement Agreement (GPA) launched a MSME work programme to assist, promote, encourage or facilitate MSME participation in government procurement (WTO, 2012).
Government procurement is often used to support the digital sector. Data from the European Centre for International Political Economy (ECIPE) show that 89 per cent of the economies represented in their dataset25 have used public procurement in this way (ECIPE, 2020). While these data do not pretend to
Figure B.27: LDCs favour universal service funds and public-private partnerships, and developed countries direct support measures Funding mechanisms of national broadband plans in 2018 by level of development
Source: ITU Regulatory Outlook Database (ITU, 2020).
Note: The percentages indicate how often a particular financing mechanism is provided for in the national broadband plans of the economies of that particular grouping (e.g. 59 per cent of the national broadband plans of LDCs provide for the use of universal service funds). As one national broadband plan may contain several distinct funding mechanisms, the total for a particular level of development can exceed 100 per cent.
0 10% 20% 30% 40% 50% 60% 70%
Dedicated broadband development fund
Universal service fund
Government direct support measures (e.g. grants)
Public-private partnerships (PPPs)
Other (e.g. aid funds, private investment, state-owned enterprise investment, not specified)
38 developed economies 110 developing economies 47 LDCs

WORLD TRADE REPORT 2020
68
be exhaustive, they provide interesting insights into the extent to which government procurement is used to bolster the digital sector. The tools used remain largely traditional ones, i.e. the purchase of goods and services at preferential rates. Table B.8 shows that “Preferential purchase schemes covering digital products and services” is the most popular type of tool.
In the digital sector, public procurement for digital goods and services is more popular in developing economies than in developed ones: 100 per cent of developing economies covered in the database have adopted public procurement measures targeting the digital sector, compared to 81 per cent in the case of developed economies, and the number of public procurement measures adopted by developing economies is almost double that of developed countries (see Table B.8).
Local content requirements
There has been a significant increase in the use of local content measures in the ICT sector. The Global Trade Alert database identified a total 29 local content measures related to the ICT sector between 2009 and 2018, with 20 such measures targeting ICT goods
and nine targeting ICT services. Examples of such policies include requirements that telecommunications companies use only locally manufactured SIM cards in providing their services or that they use a minimum value of local components, or that foreign enterprises trading ICT equipment include a certain share of domestically produced inputs.
Standards as a tool to facilitate innovation and digitalization
Standards define product and process characteristics essentially to set levels of product quality, safety, health and environmental protection and to improve process management, and they are not intrinsically an industrial policy tool. However, by codifying technical information on products and services and facilitating communication between economic agents, they foster innovation and competition, promote trust among stakeholders, and nurture international trade. Standards play a critical role in highly technical areas, including those that contribute to the digital transformation, and they can facilitate and accelerate the ongoing digitalization of our economies by promoting compatibility and interoperability between products and processes and the uptake of new digital technologies.
Figure B.28: Tax incentives are a popular tool for supporting ICT-related services in developing economies and LDCsTypes of financial measures to support ICT-related services by level of development (based on TPRs published between 2011 and 2020)
Source: WTO Trade Policy Reviews.
Note: The analysis is based on the last TPR available for each WTO member over the period from January 2011 to March 2020. Eight WTO members were not included in the analysis due to a lack of TPRs conducted during the review period: Afghanistan, Cuba, Kazakhstan, Liberia, Seychelles, Tajikistan, the Bolivarian Republic of Venezuela and Yemen.
0%
10%
20%
30%
40%
50%
60%
70%
80%
90%
100%
Developed economies Developing economies LDCs
Direct grants
Equity injections
Duty-free inputs, free zones and offshores
Preferential credit and guarantees
Tax incentives concessions and allowances

B. D
EF
ININ
G IN
NO
VA
TIO
N-
OR
IEN
TE
D G
OV
ER
NM
EN
T P
OLIC
IES
AN
D T
HE
IR
EV
OLU
TION
IN TH
E D
IGITA
L AG
E
69
GOVERNMENT POLICIES TO PROMOTE INNOVATION IN THE DIGITAL AGE
The accelerated pace of change is leading an increasing number of governments to actively support the development of standards to facilitate the adoption and steer the development of new digital technologies (see Section C for a discussion on the economic rationale of these measures).
In the area of 5G mobile networks, for example, the European Commission launched a Framework Programme for Research and Innovation (2014-20) and a public-private partnership to finance costs associated with the development of standards for higher-speed wireless communication. China, on its side, finances the development of global 5G standards in collaboration with research institutes and industry associations around the world.
Given the concerns about the potential ethical implications of the development of AI, several governments, such as Canada, Estonia, France and the United Kingdom, have developed an ethical and legal framework to guide the adoption of AI and facilitate market adoption.
Various governments also support standards development to facilitate the deployment of 3D printing in manufacturing sectors. In 2015, for instance, the Government of the Netherlands established a “Smart Industry” action agenda, through which it funds several field laboratory networks of companies and knowledge institutes to develop and test ICT applications. Similarly, the Federal Government of the United States finances the Standardization Roadmap for Additive Manufacturing (i.e. 3D printing), which is a programme meant to coordinate multiple organizations engaged in standards-setting for various aspects of additive manufacturing.26
Government support to standards development extends to other advanced technologies, such as cloud computing or Blockchain. The European Union,
for instance, finances initiatives to develop common open standards for cloud computing, and Australia finances the development of blockchain-related standards.
Clusters and tech hubs as a tool to promote innovation and digitalization
Governments frequently use clusters of firms and research centres as a tool to foster innovation. Clusters aim to capture the economic advantages that accrue through the agglomeration of firms, and sometimes of research centres. In this eco-system, firms can be more innovative and create more jobs than alone.
While interest in clusters is not new, data from the OECD and the European Commission’s database on innovation policies, which covers 51 economies, shows that the number of cluster programmes in innovation policies has increased sharply over the last two decades, pointing to the growing importance attached to clusters as a tool to promote innovation (see Figure B.29). In 2017, 27 economies, of which 17 developed and 10 developing economies, reported having established clusters as part of their innovation policy (European Commission and OECD, 2019).
Some clusters are highly technology-oriented. These clusters, which usually have as a core renowned universities and research centres with which technology start-ups interact, are usually referred to as high-tech clusters. Other terms used are “science parks”, “technology parks”, “technopoles” or “research parks”. These high-tech clusters provide a vehicle to bring together business, public research, investors and university partners, offering a new mechanism for innovation and collaboration. Prominent examples of these high-tech clusters include Silicon Valley in the United States, the East London Tech City in the United Kingdom, Bangalore in India and Shenzhen in China. According to the
Table B.8: Public procurement for digital products is more popular in developing economies
Type of public procurement measure Number of measures targeting the digital
sector applied by developed economies
Number of measures targeting the digital
sector applied by developing economies
Total
Preferential purchase schemes covering digital products and services
57 96 153
Requirement to surrender patents, source codes, trade secrets
0 5 5
Technology mandate 5 9 14
Total 62 110 172
Source: ECIPE (2020).

WORLD TRADE REPORT 2020
70
United Nations Educational Scientific and Cultural Organization (UNESCO), 81 governments have supported the establishment of at least one high-tech cluster (UNESCO, 2020a – see Figure B.30).
Another common form of agglomeration is tech hubs. A “tech hub” is a physical space – a city, a suburb or a suite of offices under a single roof – designed to support start-ups and help them thrive, and is viewed as a place where members of the technology and entrepreneurship community can get together (ITC, 2019). Tech hubs can be part of high-tech clusters, thereby tapping into the R&D facilities that characterize high-tech clusters (KPMG, 2019). Most tech hubs are either “accelerators” or “incubators”. Accelerators primarily target starts-up with a product that is ready to be used and/or traded and help them to achieve external funding. Incubators intervene at
an earlier stage. They assist start-ups in designing and building business models. These forms of agglomeration boost collaboration between start-ups and investors and provide a wide range of services to support innovation take-ups, such as mentorship services, legal services or access to investors.
Tech hubs have flourished around the world and their number keeps increasing. A 2017 study financed by the UK Department for Business, Energy and Industrial Strategy found that there were 205 incubators and 163 accelerators active in the United Kingdom in 2016-17 (Bone, Allen and Haley, 2017), and the International Business Innovation Association, based in the United States, estimates that there are about 7,000 incubators worldwide (InBIA, 2020). In Latin America, the LAVCA Accelerator Directory identified 112 accelerators as
Figure B.29: Clusters are increasingly used as an innovation policy toolNumber of clusters reported as having been established under a country’s innovation policy (27 reporting economies)
Source: European Commission and OECD (2019).
Note: Some economies established more than one cluster.
2
1
3
4
1 1
2
4 4
1
3
5 5
8
9
7
8
13
15
17
20 20
19
26
19941995
19961997
19981999
20002001
20022003
20042005
20062007
20082009
20102011
20122013
20142015
20162017
Num
ber o
f est
ablis
hed
clus
ters

B. D
EF
ININ
G IN
NO
VA
TIO
N-
OR
IEN
TE
D G
OV
ER
NM
EN
T P
OLIC
IES
AN
D T
HE
IR
EV
OLU
TION
IN TH
E D
IGITA
L AG
E
71
GOVERNMENT POLICIES TO PROMOTE INNOVATION IN THE DIGITAL AGE
of 2016 (LAVCA Venture Investors, 2016), and in the Asia-Pacific region, the Global System for Mobile Communications Association (GSMA) estimated that there were 565 active tech hubs in 2018, versus 287 in 2016 (Bayen, 2018). In 2015, the World Bank counted 117 tech hubs in Africa (Kelly et al., 2016). The GSMA, which uses a slightly broader definition of tech hubs than the World Bank by adding coworking spaces, estimated the number of tech hubs spread across at least 26 economies at 314 in 2016, 442 in 2018 and 618 in 2019 (Giuliani and Ajadi, 2019).
(iii) New approaches to foster digital innovation and address digital challenges
While well-established government policy tools are commonly used to promote innovation and the digital transformation, as shown in the previous section, the specific features of the digital economy have led numerous governments to broaden their toolboxes. With data becoming a central element of today’s economy, and with transformation in the digital economy happening at a much faster pace than innovation in the traditional economy (see Section B.2(e)), traditional instruments no longer suffice. New approaches have
emerged to give companies the space to innovate outside of traditional regulatory frameworks. The growing importance of data in economic activities is also leading an increasing number of governments to put in place data-related regulations to address policy issues raised by the digital economy.
New regulatory approaches to promote digital innovation
The speed of digital innovation is pushing regulatory boundaries. In order to give high-tech companies the breathing space they need to innovate and to improve the regulator’s understanding of digital developments, a growing number of jurisdictions are developing new regulatory tools.
These can take the form of a dedicated point of contact for firms to raise enquiries with public authorities on regulatory requirements and to seek non-binding guidance on the conformity of innovative products or business models with regulatory requirements. Such points are sometimes referred to as innovation hubs or innovation offices (WTO, 2019a). They help to educate innovators on the regulatory environment in which they operate but
Figure B.30: Eighty-one governments have supported the establishment of at least one high-tech clusterNumber of high-tech clusters established by governments
Source: UNESCO (2020a).
0
5
10
15
20
25
30
Europe Asia Middle East andNorth Africa
Africa South America Australia andNew Zealand
North America

WORLD TRADE REPORT 2020
72
also to improve the regulator’s understanding of the sector. Innovation offices are often the first approach to improve regulator-innovator dialogue and are a good first option for resource-constrained regulators in emerging and developing economies, since they are easier to implement and operate than other regulatory initiatives.
Regulatory sandboxes are another new regulatory tool used by policy makers to stimulate business innovation. First tested in the financial technology (fintech) industry,27 regulatory sandboxes create an environment whereby businesses can draw on the expertise and advice of a regulator and test their products under less stringent regulatory requirements resulting in lower compliance costs, thereby promoting the inclusion of new and small firms which often have limited resources. Regulators generally put in place safeguards to ensure consumer protection, such as disclosure requirements, limitations on the number of clients, and compliance handling mechanisms.
Regulatory sandboxes are now used to promote innovation beyond the fintech sector. The United Kingdom Information Commissioner, for example, established in 2019 a regulatory sandbox for businesses relying on personal data, such as businesses that use biometrics to speed up airport passenger journey (ICO, 2019). Governments also use regulatory sandboxes to foster the deployment of products based on advanced technologies. Brazil, the Isle of Man, Lithuania, Mauritius and Turkey, for example, recently set up regulatory sandboxes for blockchain innovation.
Cross-border regulatory sandboxes have also emerged to allow foreign investors to interact with domestic regulators and to test their products across more than one jurisdiction. Most of these cross-border regulatory sandboxes have thus far been concentrated in the fintech industry. Since the establishment of the UK-Singapore FinTech Bridge in 2016, 63 bilateral cooperation fintech agreements have been established (KAE, 2020).
Other regulatory approaches aim to foster innovation through data-sharing (Coyle, 2020; European Commission, 2020). In the case of data in the custody or under the control of a public body, several governments have already opened access to government data to promote innovation and government transparency. These open government data initiatives are also included in newly adopted national strategies for advanced technologies. In the context of its Artificial Intelligence Strategy, Mexico, for instance, has created a data sandbox whereby
government data from public administrations are made publicly available.
In the case of data in the custody or under the control of a private company, data-sharing regulatory frameworks are scarce, but exist. In some cases, governments act as facilitators, enabling data-sharing between firms. For instance, in the context of its data strategy, the European Commission intends to fund the establishment of EU-wide interoperable data spaces in strategic sectors such as manufacturing, agriculture, health and mobility, with a view to encouraging data-sharing between companies (European Commission, 2020). In other cases, governments act as regulators, requiring data-sharing between firms. For instance, several governments, such as Brazil, Sri Lanka and the United Kingdom, have already introduced or plan to introduce an open banking framework for the standardized and secure exchange of data between banks and reliable third-party providers, including new entrants such as fintechs (Banco Central do Brasil, 2019; Central Bank of Sri Lanka, 2020). Some governments, like France and Germany, are also discussing sharing corporate data on public interest grounds in the context of their national AI development strategy (Struett, 2020).
Regulatory approaches used to address digital challenges
As data have increasingly become an integral part of innovation, data-related policy issues are turning out to be even more prevalent. While some data-related policies are motivated by concerns about privacy and security, others seem to be more closely linked to industrial policy objectives. Data generation, collection, storage, capture and analysis by private firms have triggered concerns both for individuals and governments and led a growing number of jurisdictions to pass new regulations to address data-related policy issues such as data privacy, consumer protection and national security. Privacy considerations, for instance, have led an increasing number of governments to pass personal data protection laws and regulations, particularly in the 2000s (see Figure B.31).
Some of these data regulations govern cross-border data flows. Restrictions to data flow across borders have been a major policy tool used by governments.
Casalini and López-González (2019) categorize regulations governing cross-border data flows into four illustrative categories. The first type of approach relates to the absence of any regulation on data flows. The second type of approach – free flows of data – identifies regulations that do not prohibit the

B. D
EF
ININ
G IN
NO
VA
TIO
N-
OR
IEN
TE
D G
OV
ER
NM
EN
T P
OLIC
IES
AN
D T
HE
IR
EV
OLU
TION
IN TH
E D
IGITA
L AG
E
73
GOVERNMENT POLICIES TO PROMOTE INNOVATION IN THE DIGITAL AGE
cross-border transfer of data or require any specific conditions to be fulfilled in order to move data across borders, but it provides for accountability after the fact if data sent abroad are misused. The third features a flow of data conditional on safeguards. These safeguards often rely on the notion of adequacy or equivalence as a condition, whereby the data exporter or a public body evaluates whether the recipient entity provides an equivalent or adequate level of data protection. Another type of safeguard allows firms to include standard contractual clauses or binding corporate rules in their individual data-sharing contracts, thereby providing firms with accountability. A fourth approach makes data flows conditional on authorizations received as necessary from a relevant authority. That is, for data to be transferred to a country that has not been granted adequacy, the sender must fulfil the standard conditions and ensure that data, when it is processed, is treated in the same way as it would be in the sending country. Different approaches may be applied to different kinds of data, even within the same jurisdiction. Their impact also depends on the level of transparency, efficiency and non-discriminatory treatment in their application and related decision-making processes.
Based on this categorization, the OECD finds that there are more than 200 data regulations affecting cross-border data flows (see Figure B.32).
According to Ferracane (2017), 87 cross-border data flow restrictions, among which 50 data localization requirements, were in force across 64 economies in 2017. These data policies were introduced mainly as of the 2000s. Governments more frequently impose conditions on cross-border data flows rather than full prohibition, and data localization requirements are often mandatory (Ferracane, 2017).
Overall, out of the 64 countries studied, data localization requirements account for 58 per cent of data flow policies, and regulations imposing conditions on cross-border data flows for 42 per cent (see Figure B.33). Cross-border data flow restrictions often target personal data used in different sectors, and therefore are more likely to be applied horizontally across sectors. Data localization requirements are more often sector-specific, and often target the financial sector, the public sector, telecoms services, gambling services, healthcare services or maps services (Ferracane, 2017).
Lastly, the digital economy raises new challenges for fiscal policies. One of the most significant challenges is whether and how governments can tax cross-border supplies of digital products that are increasingly delivered remotely so that domestic companies can be on an equal footing with foreign digital product suppliers. Another challenge is the growing number of global businesses without
Figure B.31: A growing number of governments have introduced privacy laws and regulations
Source: Author based on Greenleaf and Cottier (2020).
0
20
40
60
80
100
120
140
160
1973-79 1980-89 1990-99
Num
ber o
f gov
ernm
ents
2000-09 2010-19
New in decade Existing

WORLD TRADE REPORT 2020
74
physical representation, which raises questions about which jurisdictions would subject them to taxes. A third challenge is the substitution of digital products for previously physical products (e.g. CDs and music streaming platforms). As discussed in section D, the concerns about a loss of customs revenue has triggered a debate about whether to
extend the WTO moratorium not to impose customs duties on electronic transmissions.
In response to these challenges, governments have modernized their fiscal policies. Regarding the first challenge about taxation of foreign-supplied digital products, governments across the world are rapidly
Figure B.32: Data regulations have become more popular since the 2000sEvolution of data laws and regulations affecting cross-border data flows, 1972- 2018
Source: Casalini and López-González (2019).
0
50
100
150
200
250
0
2
4
6
8
10
12
14
19721978
19811985
19901993
19951997
19992001
20032005
20072009
20112013
20152017
2019
Num
ber o
f dat
a re
gula
tions
Num
ber o
f mod
ifica
tions
Modifications Count of data regulation
Figure B.33: Most restrictions take the form of data localization requirementsType of restrictions to data flows across borders in 64 countries (1960-2017)
Source: Ferracane (2017).
42%
33%
25%
Conditional flow regime
Local processing requirement/ban on transfer
Local storage requirement

B. D
EF
ININ
G IN
NO
VA
TIO
N-
OR
IEN
TE
D G
OV
ER
NM
EN
T P
OLIC
IES
AN
D T
HE
IR
EV
OLU
TION
IN TH
E D
IGITA
L AG
E
75
GOVERNMENT POLICIES TO PROMOTE INNOVATION IN THE DIGITAL AGE
extending their existing domestic value-added taxes/general sales taxes (VAT/GST). According to Musgrove (2020), 27 developing economies and nine developed economies (counting the European Union as one) and three LDCs now tax remote sales of digital products based on where the customer resides. In some cases, this means that non-resident businesses have to collect and register for VAT with a local tax agent for making sales to end-consumers. In other cases, tax registration is required above a particular value threshold. Likewise, in order to level the playing field, a few governments have determined that foreign video-on-demand operators should be subject to an audiovisual tax in the same way as local operators. According to the tariff policies of the International Telecommunication Union (ITU), three developed economies (counting the European Union as one), six developing economies and four LDCs have extended their domestic audiovisual taxes to foreign video-on-demand operators (ITU, 2019).
4. Conclusions
This section analysed the broad trends of government policies aimed at boosting innovation, technological upgrading and long-term growth. They have, over time, included a mix of “vertical” policies, meant to support production in a particular sector, and “horizontal” measures, which aim to improve the business, cost, legal and infrastructural environment in which economic actors operate, and to support cross-sectoral economic development across all sectors.
Several features of the digital economy underline the evolution of these policies in the digital age. As data become an essential input in the digital value chain, firms in the digital economy rely less on physical assets and more on intangible assets. This also makes firms much more scalable, allowing them to reach global markets; this scalability is also a factor in the dominance
of certain market players in the digital sector. As a result of the special features of the digital economy (see Section B.2(e)), government policy also needs to evolve. Data policies are an integral part of innovation and industrial policy, and support in building and upgrading telecommunication infrastructure has become a key priority for many economies. Government policies are also aiming to foster innovation through R&D support and by developing innovation hubs and promoting digital literacy. Government policies need to be broad and agile to keep up with the pace of change, and policies to address market concentration and encourage competition are also an integral part of today’s policies.
A close examination based on the WTO Trade Monitoring database complemented by the Global Trade Alert database shows that government policies are widely used to support traditional sectors and to attract investments. A relatively high density of policy tools is applied in the minerals, metals and chemical industries, textiles and clothing, electrical machinery and, to some extent, to the automotive sector. Many support measures are horizontal in nature, not attributed to a specific sector, for example tax holidays for corporate investment; while vertical support measures tend to focus on transport equipment, minerals and metals.
At the same time, an increasing focus has been placed on fostering innovation in the digital sector. Government innovation policies include public funding for R&D, innovation-oriented public procurement, promoting clusters and tech hubs, and new regulatory approaches, such as regulatory sandboxes and data-sharing schemes. While traditional policy instruments such as tariffs are becoming liberalized in the digital sector, there has been an increase in new types of government interventions such as data flow restrictions, data localization requirements and reforms of taxation policy, many of which stem from non-economic considerations.

WORLD TRADE REPORT 2020
76
Endnotes1 https://www.globaltradealert.org
2 Cherif and Hasanov (2019) made the point that industrial and innovation policies have been intertwined for decades in the emerging economies of Southeast Asia.
3 Examples of the narrow definition of industrial policy can be found in Tyson and Zysman (1983): “Industrial policy… means government policy aimed at or motivated by problems within specific sectors” and in Kim and Dobbin (2012): “an industrial policy is a government-sponsored economic growth programme that encourages development of, or investment in, a particular industry. Industrial policies may target local, regional or national development of an industry by any number of means”.
4 Such wide definitions are used by Krugman and Obstfeld (1991): “Industrial policy is an attempt by a government to encourage resources to move into particular sectors that the government views as important to future economic growth” and Chang (1994): “Industrial policy is aimed at particular industries, and firms as their components, to achieve the outcomes that are perceived by the state to be efficient for the economy as a whole”.
5 For example, the “Making Indonesia 4.0” programme, launched in April 2018, plans to reduce Indonesia’s reliance on the extractive industries and to increase high-value exports. The programme sets forth the following ten national priorities: (1) reforming material flows and enhancing domestic upstream production, such as petrochemicals; (2) redesigning industrial zones; (3) embracing energy sustainability; (4) empowering MSMEs; (5) building a nationwide digital infrastructure; (6) attracting foreign investment; (7) upgrading human capital, notably by redesigning the education curriculum and creating professional talent mobility programmes; (8) establishing innovation ecosystems, notably for R&D; (9) incentivizing technology investment, notably through tax exemption for technology adoption; and (10) optimizing market regulations and policies, in particular through better cross-ministry collaboration.
6 Industrial policy instruments are defined broadly as: “tools that governments have at their disposal to implement industrial policies’’ (UNCTAD, 2016). Given the wide variety of industrial policy objectives, instruments can be fiscal, trade, investment, competition, intellectual property and other related policy tools (Riess and Välilä, 2006). Such instruments can be used either to open or to restrict (import) competition in a sector (e.g. by reducing or increasing tariffs, or by reducing or increasing the list of sectors for foreign direct investment), depending on the industrial policy objective being pursued.
7 See ht tps: //dnh.com.my/budget2020-key-highl ights- i m p a c t i n g - t h e - s t a r t - u p - e c o s y s t e m - i n - m a l a y s i a / #:~:tex t=The%20Modif ied%20Nexus%20Approach% 20will,2020%20to%2031%20December%202022.
8 According to the OECD (Ubaldi, 2013), open government data is a philosophy – and increasingly a set of policies – that promotes transparency, accountability and value creation by making government data available to all. By making their datasets available, public institutions become more transparent and accountable to citizens.
9 ICT goods include electronic components, loaded printed circuits boards, computers, telecommunications equipment, consumer electronics, and magnetic and optical media. ICT services include the development, wholesaling and repair of computers, computer equipment and software, telecommunications, data processing, web portals, hosting and related activities.
10 See https://www.wipo.int/treaties/en/registration/pct/ for more information.
11 For example, in data centres and search engines, the initial investments in server farms, cooling systems and secure sites, as well as the cost of developing new software and applications, are high, but the costs rapidly decrease with scale.
12 The term “born globals” was first coined in a report by McKinsey (Rennie, 1993) to describe enterprises that are able to quickly and successfully engage in foreign exports. Born globals are characterized by an ability to overcome the initial barriers that are associated with entry into foreign markets without first establishing a strong home market presence. For example, in 2015, the Swedish government published an export strategy that specifically emphasized the importance of encouraging born global firms (Ferguson, Henrekson and Johannesson, 2019).
13 It is noteworthy that these shorter cycles of innovation do not necessarily imply progress at greater speed, as these innovations are also more incremental than before. For example, software updates can occur almost daily, with technical glitches quickly being resolved.
14 Trade remedies are counted based on the number of partners (e.g. a trade remedy that applies to two partners is counted twice).
15 Information on support measures is not available after 2016.
16 As highlighted in members’ discussions about the WTO trade monitoring reports, some trade remedy measures are taken to address what is perceived by some as a market distortion resulting from trade practices of entities in another trading partner. The WTO Antidumping Agreement and Subsidies and Countervailing Measures Agreement permit WTO members to impose antidumping or countervailing duties to offset what a member must prove to be injurious dumping or subsidization of products exported from another member to it. The trade monitoring reports cannot establish if, where or when such perceived distortive practices have taken place. Neither trade monitoring reports nor this report categorize the use of trade remedies as protectionist or WTO-inconsistent, nor do they criticize governments for using them. The main objective of monitoring these measures is to provide added transparency and to identify emerging trends in the application of trade policy measures.
17 Of the 153 quantitative restriction measures analysed, only five were implemented by LDCs.
18 Of the 43 different economies with quantitative restrictions, four (less than 10 per cent) were developed economies. In addition, very few measures were applied by LDCS (17 out of 354 measures analysed).

B. D
EF
ININ
G IN
NO
VA
TIO
N-
OR
IEN
TE
D G
OV
ER
NM
EN
T P
OLIC
IES
AN
D T
HE
IR
EV
OLU
TION
IN TH
E D
IGITA
L AG
E
77
GOVERNMENT POLICIES TO PROMOTE INNOVATION IN THE DIGITAL AGE
19 The Global Trade Alert classifies as “local content measures” all government interventions implying local sourcing, local operations, local labour and localization incentives.
20 The most recent Global Trade Alert data (as of July 2020) indicate that developing economies are using more financial support measures. This increase is due to the integration into the Global Trade Alert database of a substantial number of measures attributed to one big economy, as part of a specific research project for this country. No equivalent update was provided for other countries.
21 Economies are more and more concerned that citizens’ personal information could be targeted by malicious entities with detrimental personal and economic impacts. To try to ensure that this type of information remains secure, some economies are implementing measures to require that personal data remain physically within an economy or within the hands of nationals. One example includes the US Foreign Investment Risk Review Modernization Act of 2018, which requires foreign direct investment screening if the sensitive personal information of US citizens is involved (UNCTAD, 2019a).
22 Of these 51 economies, 28 are members of the European Union, 22 are non-EU members, and the remaining economy is the European Union itself.
23 ITA products cover a subset of ICT products.
24 Australia, Austria, Belgium, Brazil, Bulgaria, Canada, China, Croatia, Cyprus, Czech Republic, Denmark, Estonia, Finland, France, Germany, Greece, Hungary, India, Ireland, Italy, Japan, Republic of Korea, Latvia, Lithuania, Luxembourg, Malta, Netherlands, Norway, Poland, Portugal, Romania, Russian Federation, Slovakia, Slovenia, Spain, Sweden, Switzerland, Chinese Taipei, United Kingdom and United States.
25 The dataset encompasses 37 developed economies – including individual EU member states, plus the European Union as a separate entity, as some measures are specific to the European Union – and 28 developing economies.
26 See, for example American National Standards Institute (2018).
27 The first regulatory sandbox, the UK Financial Conduct Authority (FCA), was established for the financial services market in the United Kingdom in 2016. Since 2016, around 40 fintech regulatory sandboxes have been established worldwide (Shearman & Sterling, 2019).