Embed Size (px)
Citation preview

dt
dB
BKK/2
4
0Kr
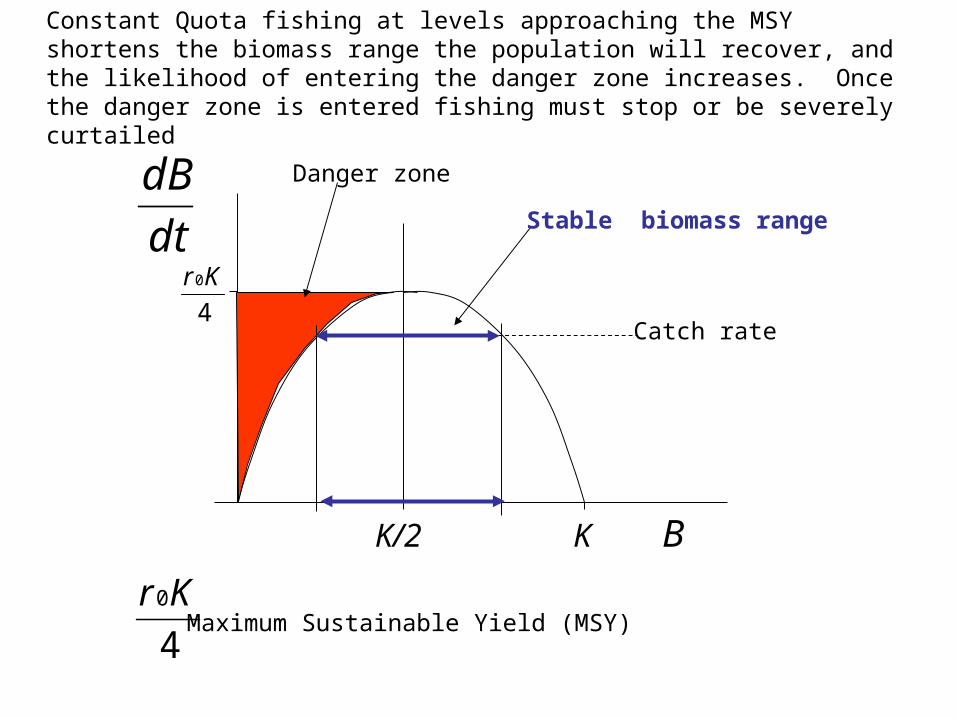
Catch rate
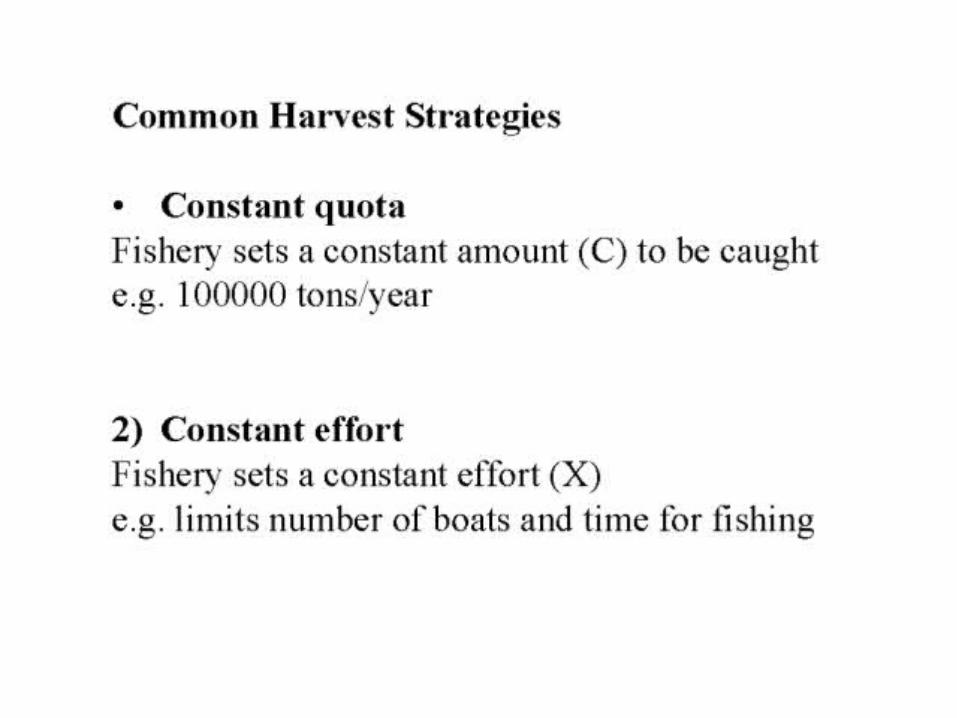
Constant Quota fishing at levels approaching the MSY shortens the biomass range the population will recover, and the likelihood of entering the danger zone increases. Once the danger zone is entered fishing must stop or be severely curtailed
4
0KrMaximum Sustainable Yield (MSY)
Danger zone
Stable biomass range
dt
dB
BKK/2
4
0Kr
C
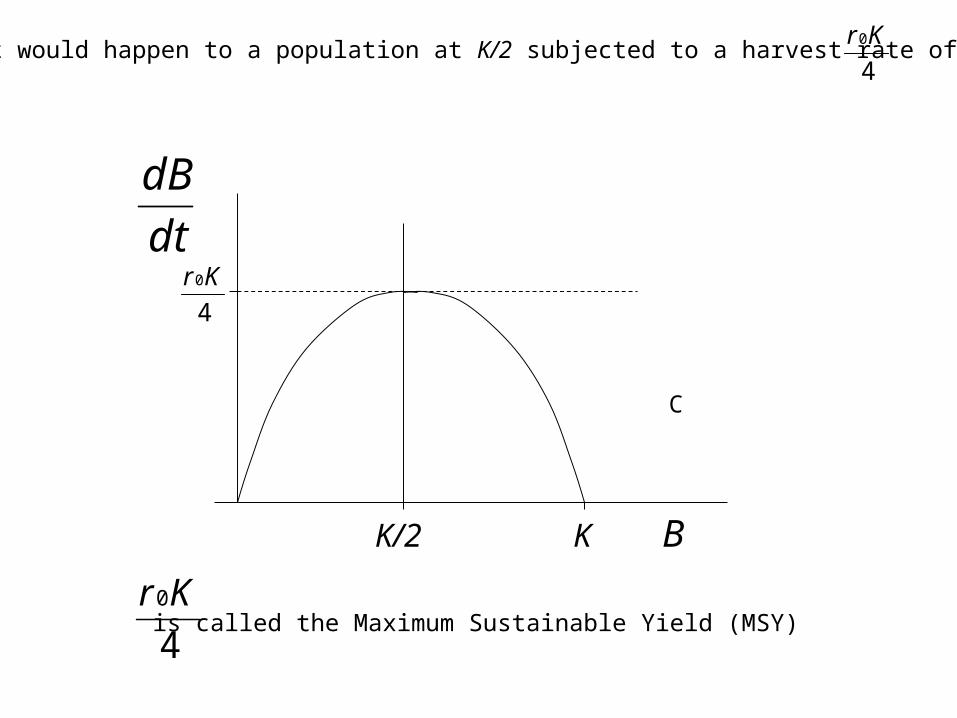
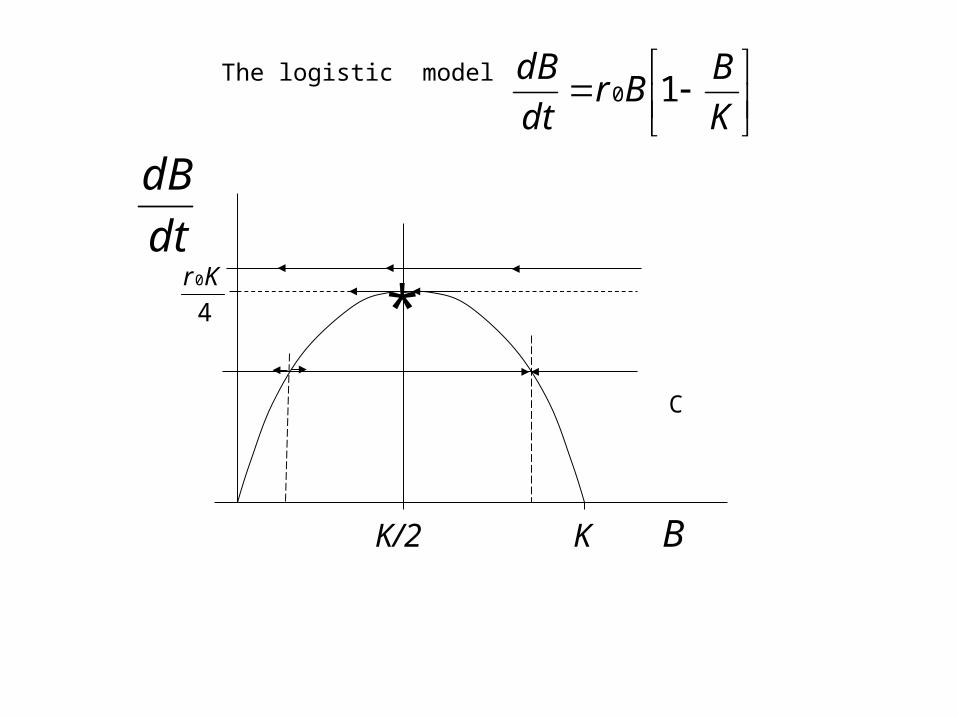
What would happen to a population at K/2 subjected to a harvest rate of4
0Kr
4
0Kris called the Maximum Sustainable Yield (MSY)
dt
dB
BKK/2
4
0Kr
C
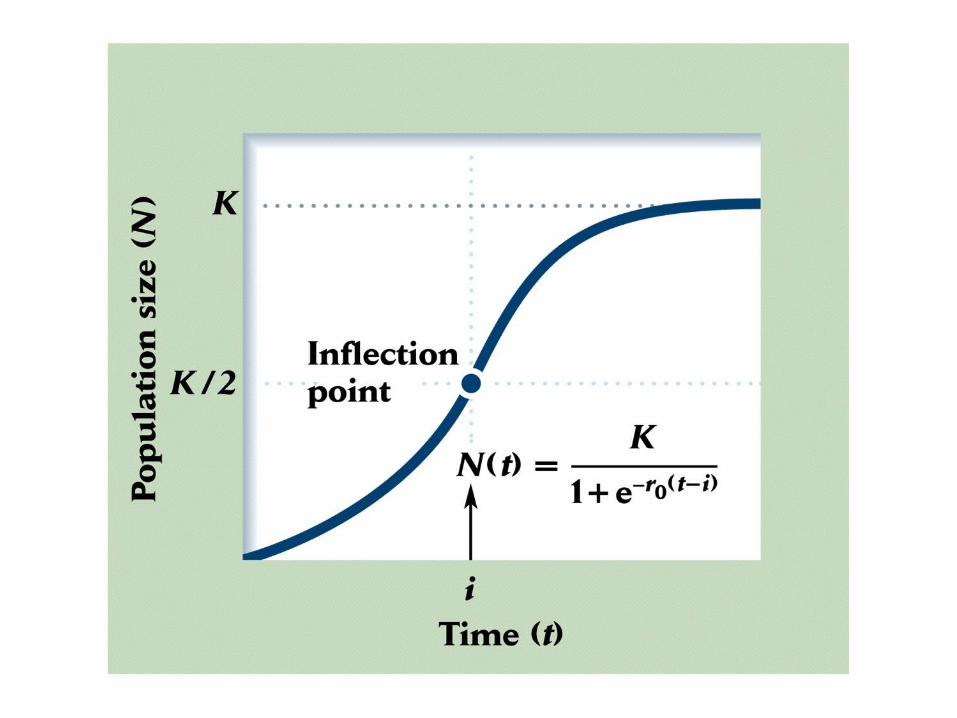
The logistic model
*
K
BBr
dt
dB10
CPUEKg/hr
0
0.2
0.4
0.6
0.8
1
1.2
0 5 10 15 20 25
Year
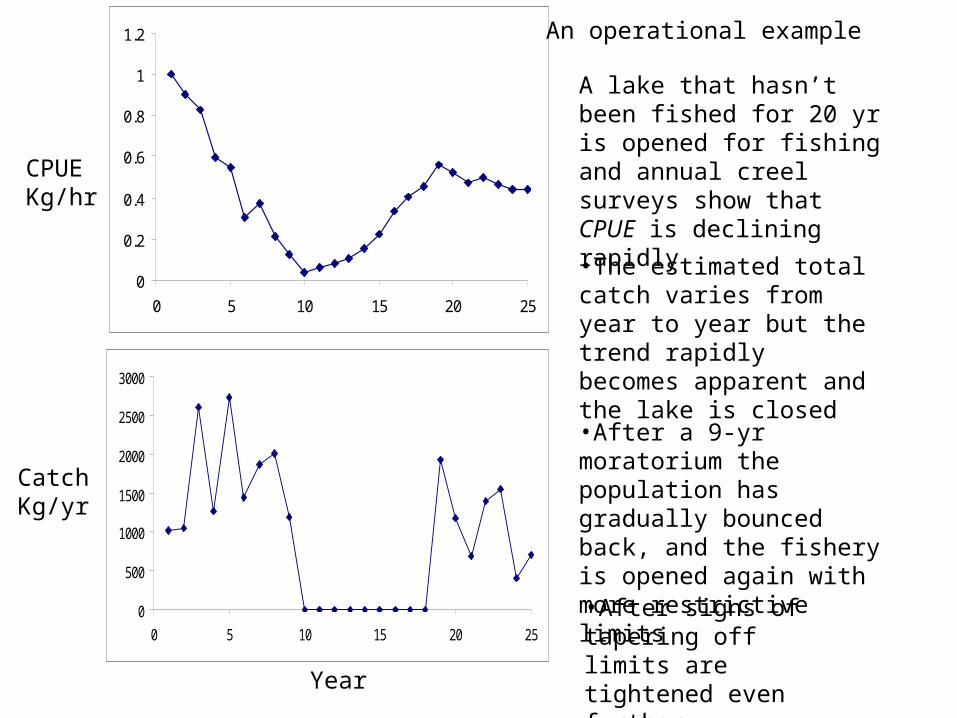
A lake that hasn’t been fished for 20 yr is opened for fishing and annual creel surveys show that CPUE is declining rapidly
CatchKg/yr
•The estimated total catch varies from year to year but the trend rapidly becomes apparent and the lake is closed
•After a 9-yr moratorium the population has gradually bounced back, and the fishery is opened again with more restrictive limits
•After signs of tapering off limits are tightened even further.
0
500
1000
1500
2000
2500
3000
0 5 10 15 20 25
An operational example
CPUEKg/hr
0
0.2
0.4
0.6
0.8
1
1.2
0 5 10 15 20 25
Year
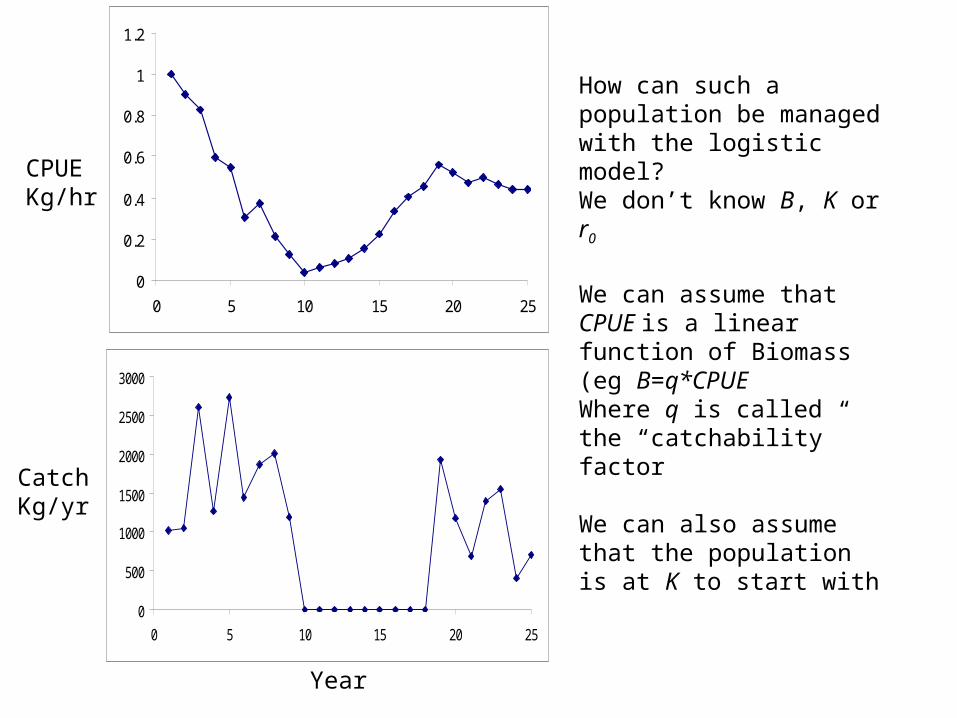
How can such a population be managed with the logistic model?We don’t know B, K or r0
We can assume that CPUE is a linear function of Biomass (eg B=q*CPUEWhere q is called the “catchability” factor
We can also assume that the population is at K to start with
CatchKg/yr
0
500
1000
1500
2000
2500
3000
0 5 10 15 20 25
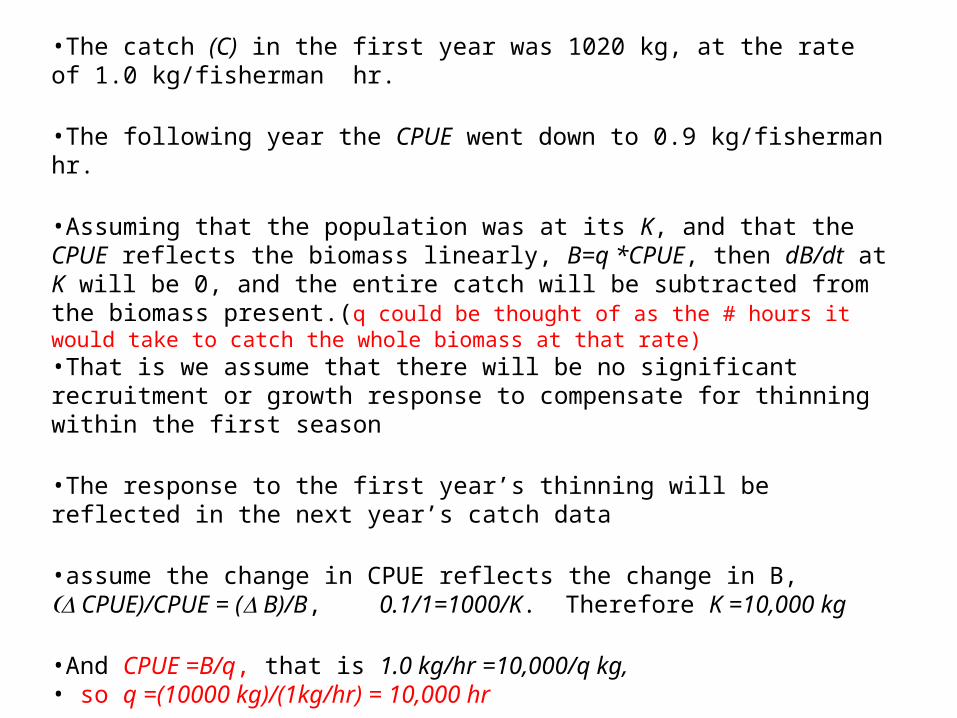
•The catch (C) in the first year was 1020 kg, at the rate of 1.0 kg/fisherman hr.
•The following year the CPUE went down to 0.9 kg/fisherman hr.
•Assuming that the population was at its K, and that the CPUE reflects the biomass linearly, B=q *CPUE, then dB/dt at K will be 0, and the entire catch will be subtracted from the biomass present.(q could be thought of as the # hours it would take to catch the whole biomass at that rate)•That is we assume that there will be no significant recruitment or growth response to compensate for thinning within the first season
•The response to the first year’s thinning will be reflected in the next year’s catch data
•assume the change in CPUE reflects the change in B, CPUE)/CPUE = ( B)/B, 0.1/1=1000/K. Therefore K =10,000 kg
•And CPUE =B/q, that is 1.0 kg/hr =10,000/q kg,• so q =(10000 kg)/(1kg/hr) = 10,000 hr
•The next year the catch rises to 1050 kg, and the CPUE falls to 0.83 kg/hr. This catch appears to be unsustainable at this B level, but how much would have been sustainable?
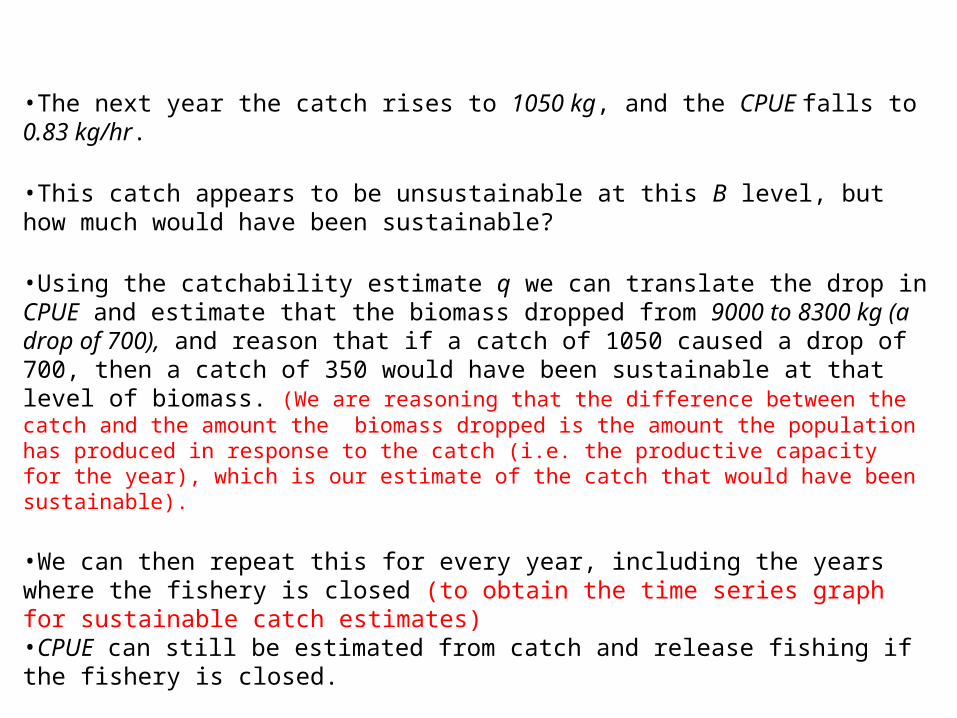
•The next year the catch rises to 1050 kg, and the CPUE falls to 0.83 kg/hr.
•This catch appears to be unsustainable at this B level, but how much would have been sustainable?
•Using the catchability estimate q we can translate the drop in CPUE and estimate that the biomass dropped from 9000 to 8300 kg (a drop of 700), and reason that if a catch of 1050 caused a drop of 700, then a catch of 350 would have been sustainable at that level of biomass. (We are reasoning that the difference between the catch and the amount the biomass dropped is the amount the population has produced in response to the catch (i.e. the productive capacity for the year), which is our estimate of the catch that would have been sustainable).
•We can then repeat this for every year, including the years where the fishery is closed (to obtain the time series graph for sustainable catch estimates)•CPUE can still be estimated from catch and release fishing if the fishery is closed.
•In this way each year’s catch combined with the change that takes place in CPUE the following year can allow you to estimate the sustainable catch for that year
0
500
1000
1500
2000
2500
3000
0 5 10 15 20 25
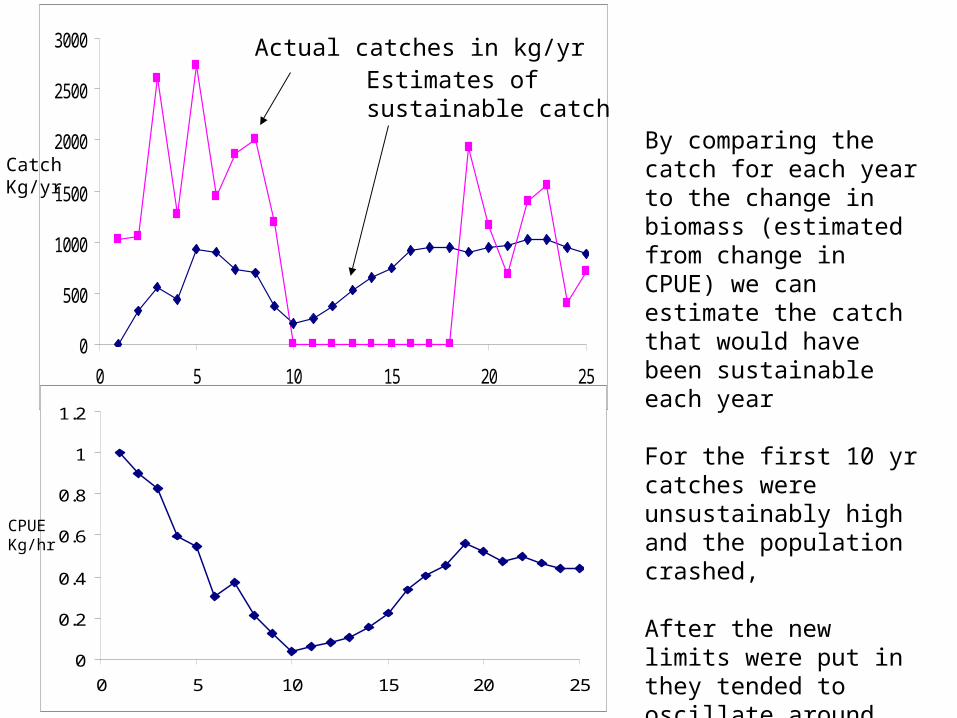
Actual catches in kg/yrEstimates of sustainable catch
By comparing the catch for each year to the change in biomass (estimated from change in CPUE) we can estimate the catch that would have been sustainable each year
For the first 10 yr catches were unsustainably high and the population crashed,
After the new limits were put in they tended to oscillate around the estimated catch.
0
0.2
0.4
0.6
0.8
1
1.2
0 5 10 15 20 25
CPUEKg/hr
CatchKg/yr
-200
0
200
400
600
800
1000
1200
0 2000 4000 6000 8000 10000 12000
K/2 = 5000
(r0K)/4=990
MSY
Biomass
dB/dt
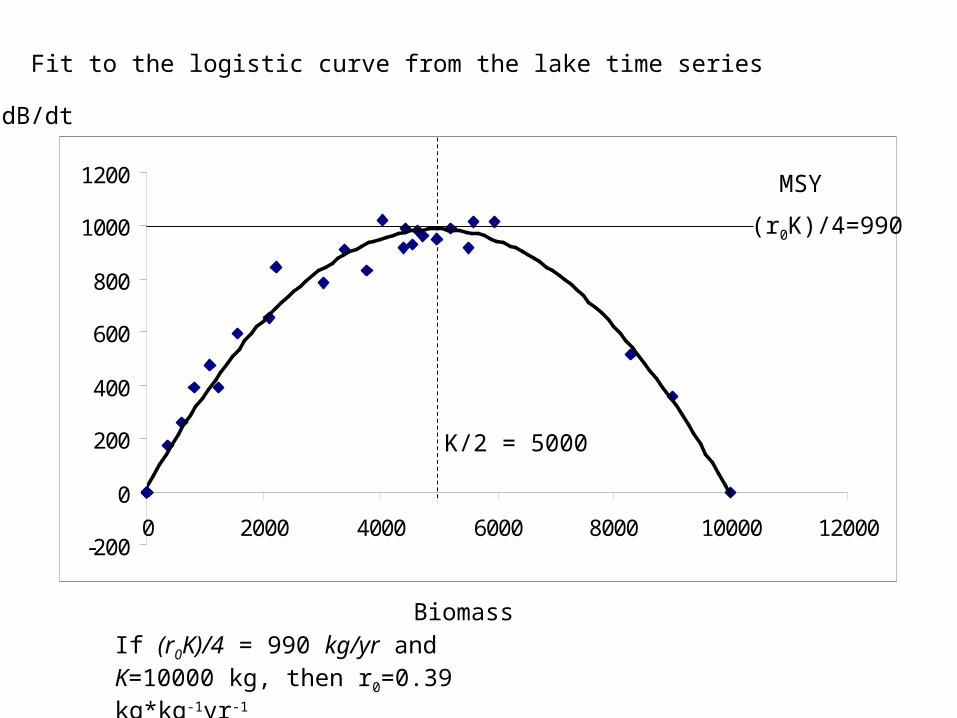
If (r0K)/4 = 990 kg/yr and K=10000 kg, then r0=0.39 kg*kg-1yr-1
Fit to the logistic curve from the lake time series
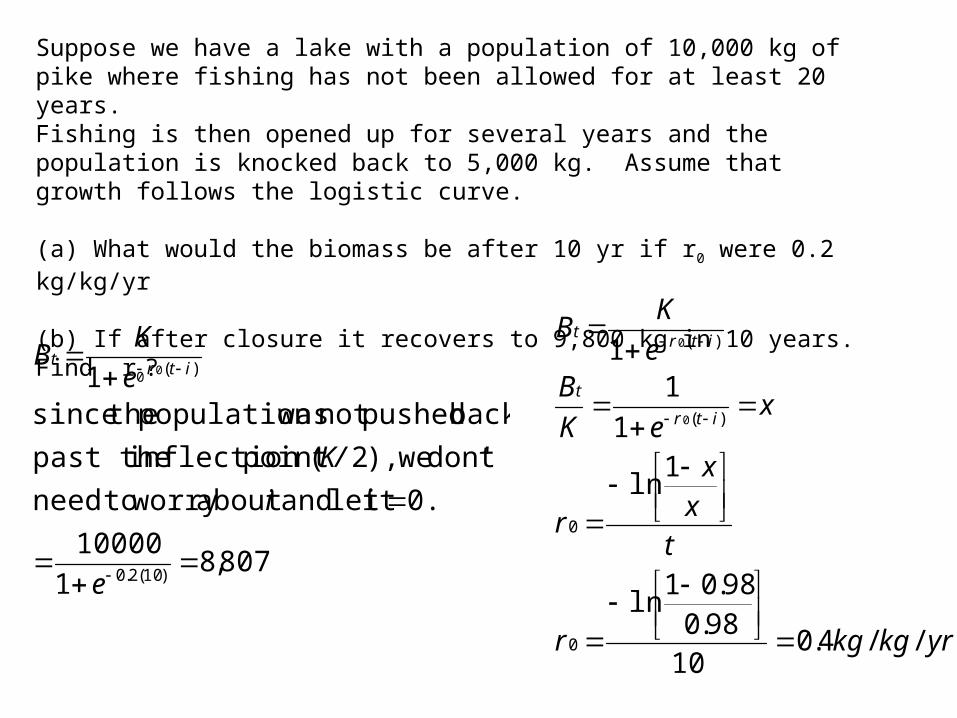
Suppose we have a lake with a population of 10,000 kg of pike where fishing has not been allowed for at least 20 years.Fishing is then opened up for several years and the population is knocked back to 5,000 kg. Assume that growth follows the logistic curve.
(a) What would the biomass be after 10 yr if r0 were 0.2 kg/kg/yr
(b) If after closure it recovers to 9,800 kg in 10 years. Find r0?
yrkgkgr
tx
x
r
xeK
Be
KB
itr
t
itrt
//4.010
98.098.01
ln
1ln
1
11
0
0
)(
)(
0
0
807,81
10000
0. itlet andabout worry toneed
t don' we),2(point inflection past the
back pushednot waspopulation thesince1
)10(2.0
)(0
e
i
K/
e
KB
itrt
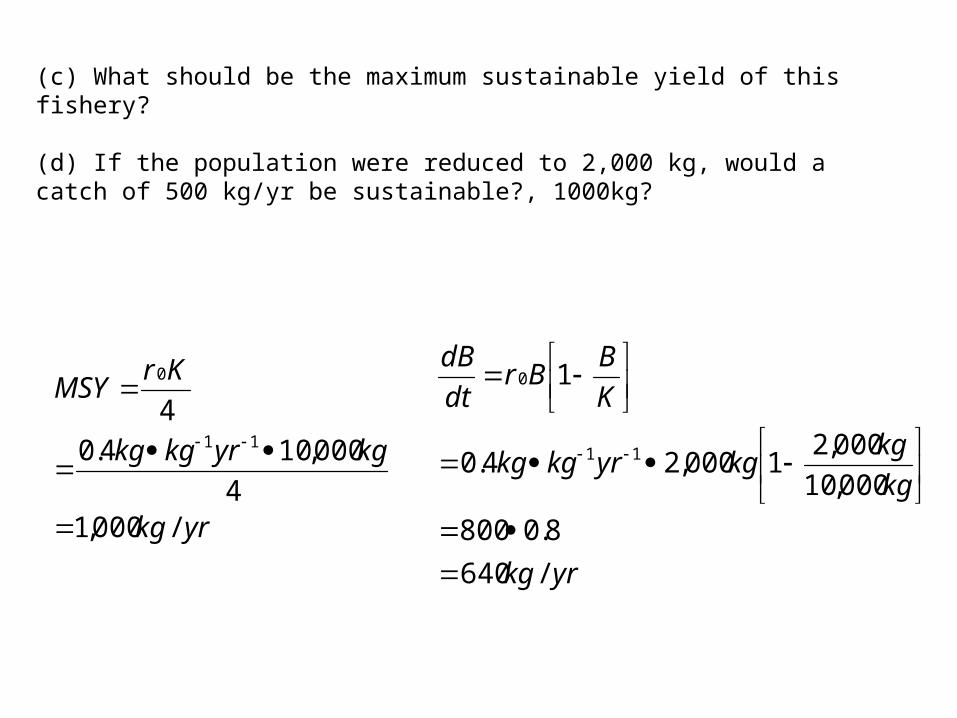
(c) What should be the maximum sustainable yield of this fishery?
(d) If the population were reduced to 2,000 kg, would a catch of 500 kg/yr be sustainable?, 1000kg?
yrkg
kg
kgkgyrkgkg
K
BBr
dt
dB
/640
8.0800
000,10
000,21000,24.0
1
11
0
yrkg
kgyrkgkg
KrMSY
/000,14
000,104.0
411
0
dt
dB
BKK/2
4
0Kr
Catch rate
Constant Quota fishing at levels approaching the MSY shortens the biomass range the population will recover, and the likelihood of entering the danger zone increases. Once the danger zone is entered fishing must stop or be severely curtailed
4
0KrMaximum Sustainable Yield (MSY)
Danger zone
Stable biomass range
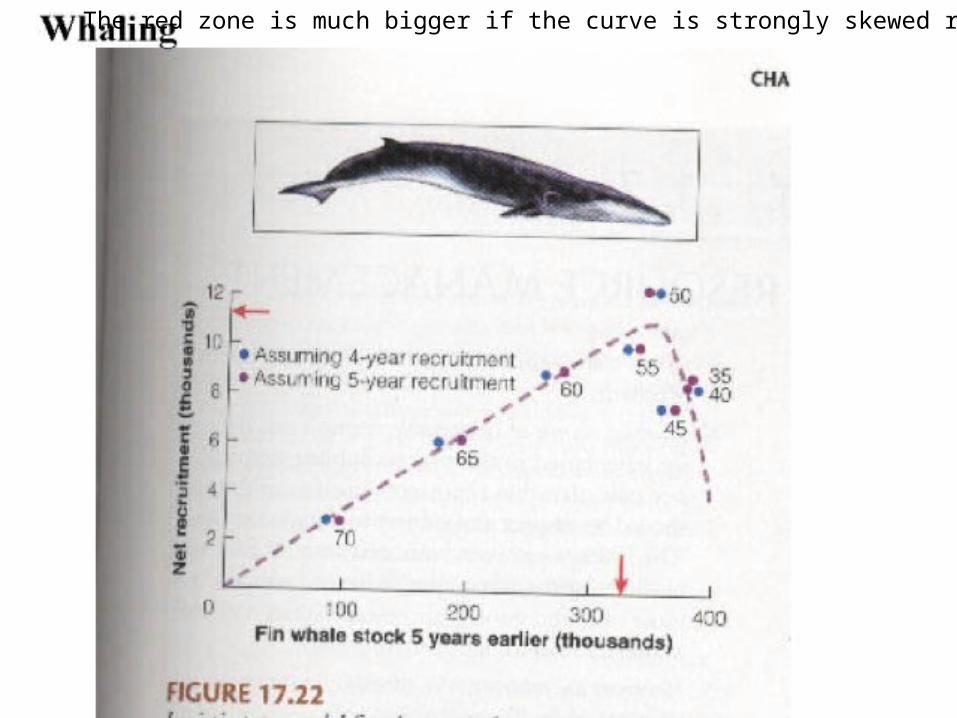
The red zone is much bigger if the curve is strongly skewed right
Solutions that are being considered by fish managers
dt
dB
BKK/2
4
0Kr
C
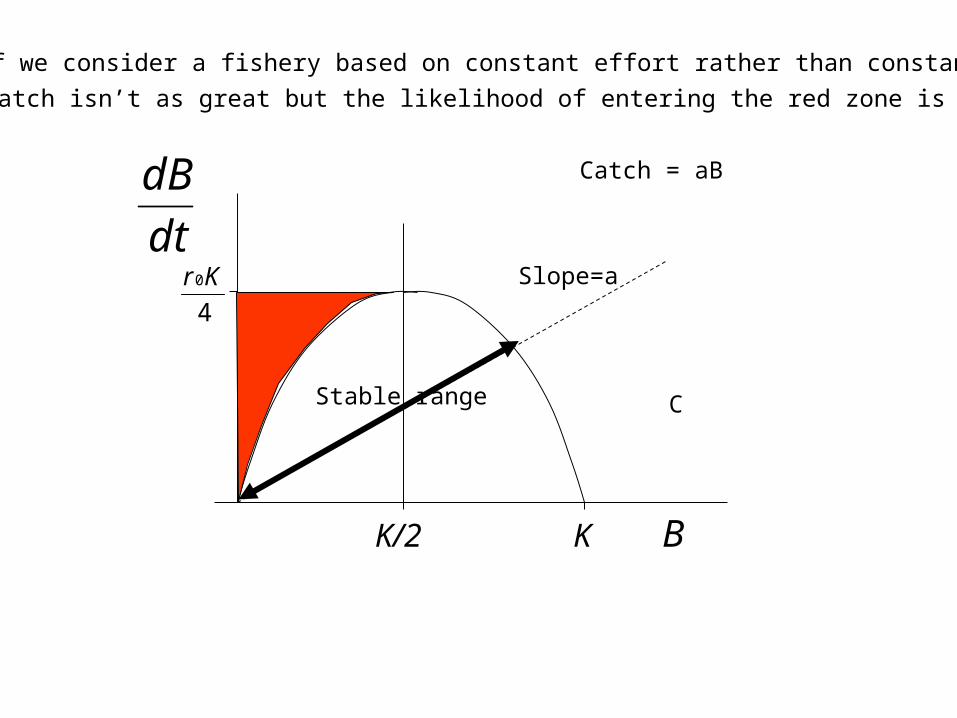
What if we consider a fishery based on constant effort rather than constant quota
Catch = aB
Slope=a
The catch isn’t as great but the likelihood of entering the red zone is lower
Stable range