Embed Size (px)
DESCRIPTION
B mixing and lifetimes at the Tevatron. FPCP 2006 Vancouver. Jónatan Piedra LPNHE-University Pierre et Marie Curie / CNRS-IN2P3 on behalf of the D and CDF Collaborations. Outline. THIS TALK. OTHER TALKS. CDF and D detectors CDF and D Hot Topics Detailed B s mixing at D - PowerPoint PPT Presentation
Citation preview

FPCP 2006Vancouver
Jónatan PiedraLPNHE-University Pierre et Marie Curie / CNRS-IN2P3
on behalf of the D and CDF Collaborations
B mixing and lifetimes at the Tevatron

April 9, 2006 2J. Piedra
Outline
Precision B Lifetimes
motivationb
Bs
Bs lifetime difference
B Mixing
current statusingredientsresults
Summary
CDF and D detectorsCDF and D Hot Topics
Detailed Bs mixing at DD. BuchholzD Hot Topics
Detailed B hhD. TonelliCDF Hot Topics
Bc lifetimeI. KravchenkoB Spectroscopy
Bs Ds DsR. Van KootenBs Decays and B leptonic decays
THIS TALK OTHER TALKS

Precision B Lifetimes
April 9, 2006 4J. Piedra
EXPERIMENT
THEORY(NLO)
C. Tarantino, hep-ph/0310241
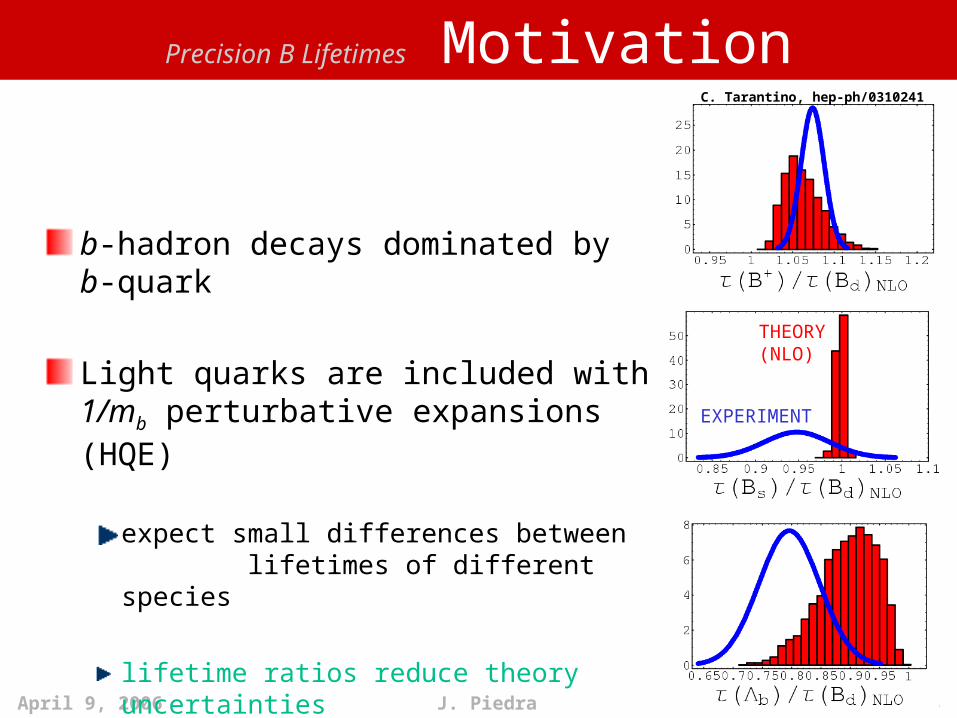
Precision B Lifetimes Motivation
b-hadron decays dominated by b-quark
Light quarks are included with 1/mb perturbative expansions (HQE)
expect small differences between lifetimes of different species
lifetime ratios reduce theory uncertainties

5
Precision B Lifetimes b LifetimeCDF and D have measured b J/ lifetime
Better proper time resolution than b c l (world average dominated)
Earlier (b)/(B0) predictions were 2 above experiment
new calculations including higher order effects predict lower ratioD 250 pb-1CDF 370 pb-1
ps 02.0 45.1 14.013.0 syststat
b
ps 04.0 22.1 22.018.0 syststat
b
PRL 94 102001 (2005)
April 9, 2006 6
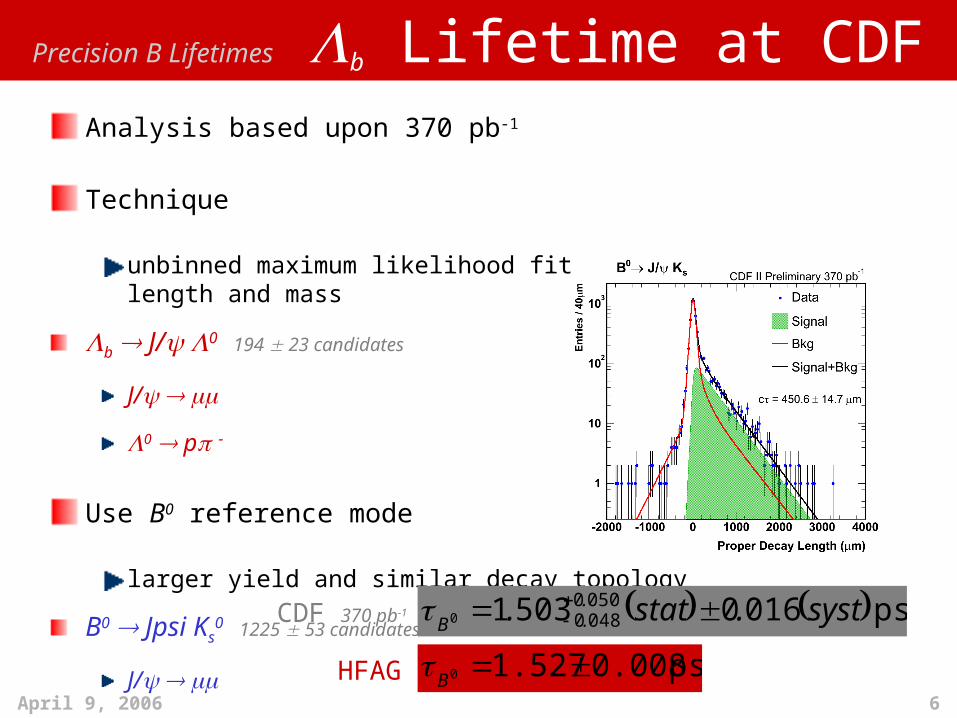
Precision B Lifetimes b Lifetime at CDFAnalysis based upon 370 pb-1
Technique
unbinned maximum likelihood fit to proper decay-length and mass
b J/ 0 194 23 candidates
J/
0 p
Use B0 reference mode
larger yield and similar decay topology
B0 Jpsi Ks0 1225 53 candidates
J/
Ks0
ps 0160 5031 050004800 syst.stat. ..B
ps 0.0081.5270 B
CDF 370 pb-1
HFAG

April 9, 2006 7
Precision B Lifetimes Bs LifetimeD and CDF measure lifetime in XlDB ss 0
D 400 pb-1CDF 360 pb-1
ps 055.0381.1 0.0520.046-0 syststat
sB ps 057.0 043.0420.10 syststat
sB
0sB
best in the world

April 9, 2006 8
Precision B Lifetimes Neutral Meson Mixing
Quark mixing non-diagonal Hamiltonian for
Diagonalizing the Hamiltonian results in
two eigenstates and
two masses mH and mL, with m mH – mL
two decay widths H and L, with L – H
BHB ||
*
12
12*12
12
2 i
MMMM
H
HeavysB Light
sB
R. Van KootenBs decays and B leptonic decays

April 9, 2006 9J. Piedra
Precision B Lifetimes Bs Lifetime DifferenceBs J/
Pseudoscalar Vector - Vector
Decay amplitude decomposed into 3 linear polarization states
A0 = S + D wave P even
A|| = S + D wave P even
A = P wave P odd
If CP violation neglected
Bs,Light CP even
Bs,Heavy CP odd
angular distributions are different
Angular analysis separates CP eigenstates measure two lifetimes

10
Precision B Lifetimes Bs Lifetime DifferenceD 800 pb-1CDF 260 pb-1
-1190240 ps syst 0.01stat 470
... -1030
040 ps syst stat 100150 ....

April 9, 2006 11
Precision B Lifetimes................... and
First measurement (~95% CP even)
CDF 360 pb-1
ps 02.0 18.053.1 syststatL
LKKBs
Expected
Lifetime extracted from decay
CDF 360 pb-1
ps 036.0 463.0 073.0065.0 syststat
cB
best in the world
D 210 pb-1
ps 1210 4480 12300960 syst.stat. .
.Bc
ec eJB /
cu BB 3~
I. KravchenkoB Spectroscopy
D. TonelliCDF Hot Topics

12
Precision B Lifetimes HFAGB+ and B0 at LEP/SLC, B factories and Tevatron (CDF/D)
dominated by Belle and BaBar
Bs dominated by Tevatron, LEP
Bc at Tevatron
b dominated by LEP, Tevatronb-hadron species measured lifetime [ps] /(B0) lifetime ratio predicted range
B+ 1.643 0.010 1.076 0.008 1.04 – 1.08
Bs ( flavor specific) 1.454 0.040 0.914 0.030 0.99 – 1.01
b 1.288 0.065 0.844 0.043 0.86 – 0.95
B0 1.527 0.008 hep-ex/0603003March 2006Bc 0.469 0.065

B Mixing

14J. Piedra
B Mixing Theoretical Prediction
1ps 00405080 ..md
CKM fit15.6
5.1s ps 3.18m
2td
2ts2
B
B
d
s
V
Vmm
mm
d
s
035.0014.0
2 02.021.1
SM prediction for the ratio of Bs and B0 mixing frequencies
md precisely measured
ms not yet measured precisely
Potential NP discovery
April 9, 2006 15
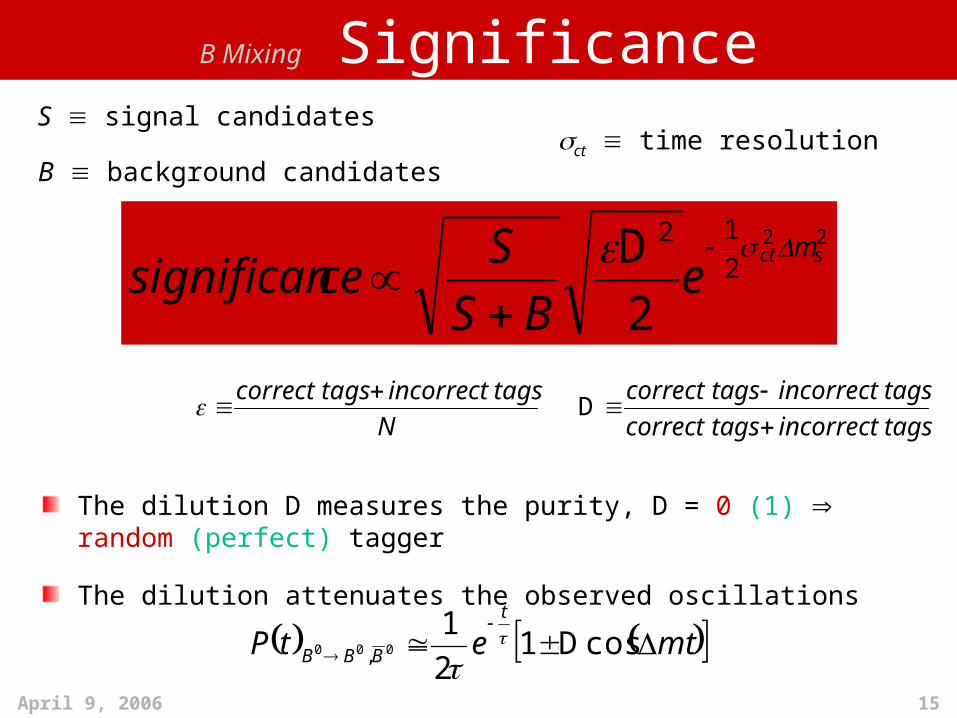
B Mixing Significance
22
212
2sct m
eBS
Scesignifican
D
The dilution D measures the purity, D = 0 (1) random (perfect) tagger
The dilution attenuates the observed oscillations
Ntags incorrect tags correct
tags incorrect tags correcttags incorrect tags correct
D
mtetPt
BBB
cos 121
000 ,
D
S signal candidates
B background candidatesct time resolution

B Mixing Ingredients1. Final State Reconstructionb-flavor at decay
2. Proper Decay TimeIn B rest frame
3. b-Flavor Taggingb-flavor at production
4. Amplitude Scan for Bs MixingSet a lower limit or observe ms Trigger SideOpposite Side

17
B Mixing Reconstructed......................D exploits semileptonic decays from trigger
CDF uses both electrons and muons
Dμ sDμ
D 1 fb-1
statNsDμ 55626710
KK,πDs
CDF 1 fb-1
/KK/D *s
0
53300~NsDl

April 9, 2006 18J. Piedra
B Mixing Reconstructed.....................CDF collects hadronic B decays by triggering on impact parameter
Around 3700 Bs signal candidates
sss
*sss
sss
D,DB
KKD,DB
D,DB
0

April 9, 2006 19J. Piedra
B Mixing Proper Decay Time
Procedure
measure pT of B daughter tracks
measure the decay length Lxy
boost B back to its rest frame
Fully reconstructed decays
all daughters reconstructed
Partially reconstructed decays
some tracks escape detection
need simulation

20J. Piedra
B Mixing b-Flavor TaggingA flavor tagger determines the b-flavor at production time
bb production flavor tagging on the Trigger Side or the Opposite Side
Trig
ger S
ide
Opp
osite
Sid
e
Soft Lepton Tagger
look for B lDX decay on the OS
lepton charge indicates b-flavor
Jet Charge Tagger
look for jet or secondary vertex from OS
jet charge indicates b-flavor
Same Side (Kaon) Tagger
look for a fragmentation track on the TS
it is charge correlated with the b-flavor
SLT
JQT
SS(K)T
bb

21
B Mixing Flavor Analysis on B+ and B0
Calibrate opposite side flavor taggers prior to ms analysis
combine several B+,0 decays
combine all taggers
Direct md measurement
cross-check for Bs mixing
XDB *
md = 0.509 0.010 (stat) 0.016 (syst) ps-1CDF semileptonic 1 fb-1
md = 0.508 0.004 ps-1world average
md = 0.536 0.028 (stat) 0.006 (syst) ps-1CDF hadronic 355 pb-1
md = 0.506 0.020 (stat) 0.016 (syst) ps-1D semileptonic 1 fb-1
asymmetry
combined D2 (%)
1.55 0.082.48 0.22
CDFD

22
B Mixing SSKT at CDFLook for the fragmentation track that is charge correlated with the B
ms not yet measured precisely
Parameterization from MC
Extensive data/MC comparisons on all tagging related quantities
Rely on MC prediction of SSKT performance for Bs mixing
23
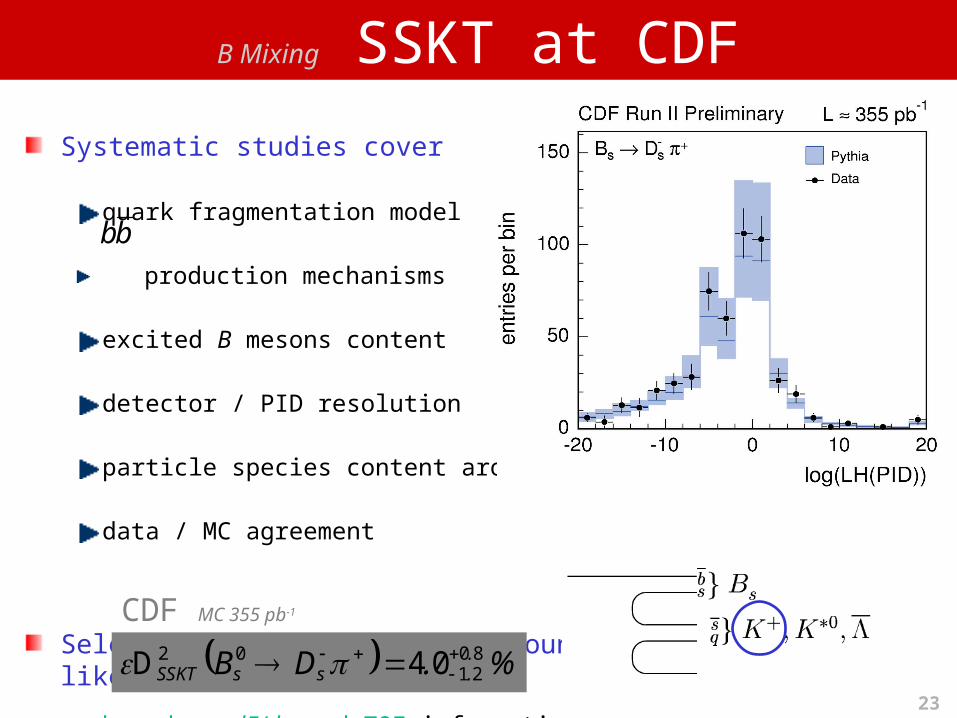
B Mixing SSKT at CDFSystematic studies cover
quark fragmentation model
bb production mechanisms
excited B mesons content
detector / PID resolution
particle species content around B
data / MC agreement
Select track within R < 0.7 around B most likely to be a kaon
based on dE/dx and TOF information
CDF MC 355 pb-1
%.DB ..ssSSKT 04 8021
0
2D
bb

24
B Mixing Fourier AnalysisTwo domains to fit for oscillations
time fit for a cosine wave
frequency examine f-spectrum
Time domain approach
fit for ms in P(t) ~ 1 D cos(mst)
Frequency domain approach
introduce amplitude, P(t) ~ 1 AD cos(mst)
fit for A at different ms
obtain frequency spectrum A(ms)
standard method for combining limits
with flavor taggers calibrated A = 1 for the true ms else A = 0
frequency domain
time domain

April 9, 2006 25
B Mixing Amplitude Scans on md
The yellow band is 1.645A around data points
m values where A + 1.645A < 1 are excluded at 95% CL
Sensitivity is where 1.645A = 1
Amplitude scan works on B0 decay modes
XDB DB,K/JB * 000
D Run II Preliminary
1 fb-1

April 9, 2006 26J. Piedra
B Mixing Amplitude Scans on ms
sensitivity95% CL limitD 1 fb-1
14.1 ps-1
14.8 ps-1
sensitivity95% CL limit
CDF 355 pb-1
13.0 ps-1
8.6 ps-1
A/A (ms = 19 ps-1) = 2.5 5% p-value SSKT not yet included

27
B Mixing Log Likelihood Scan
17 < ms < 21 ps-1 @ 90% CL assuming Gaussian uncertainties
hep-ex/0603029submitted to Phys. Rev. Lett.

28
B Mixing D Effect on World Average
D HFAG preliminary(correlated systematics not included)
A (ms = 19 ps-1)
1.5 A 2.3 AD

29
Summary
New b lifetimes reduce distance with theory
Tevatron measures the best Bs lifetimes in the world
Bs lifetime difference within SM
D Bs oscillation
1 fb-1
2.5 A excess at ms = 19 ps-1 (5% p-value)
17.1 < ms < 21.1 ps-1 @ 90% CL
CDF Bs oscillation
355 pb-1
ms > 8.6 ps -1 @ 95% CL

Backup
31J. Piedra
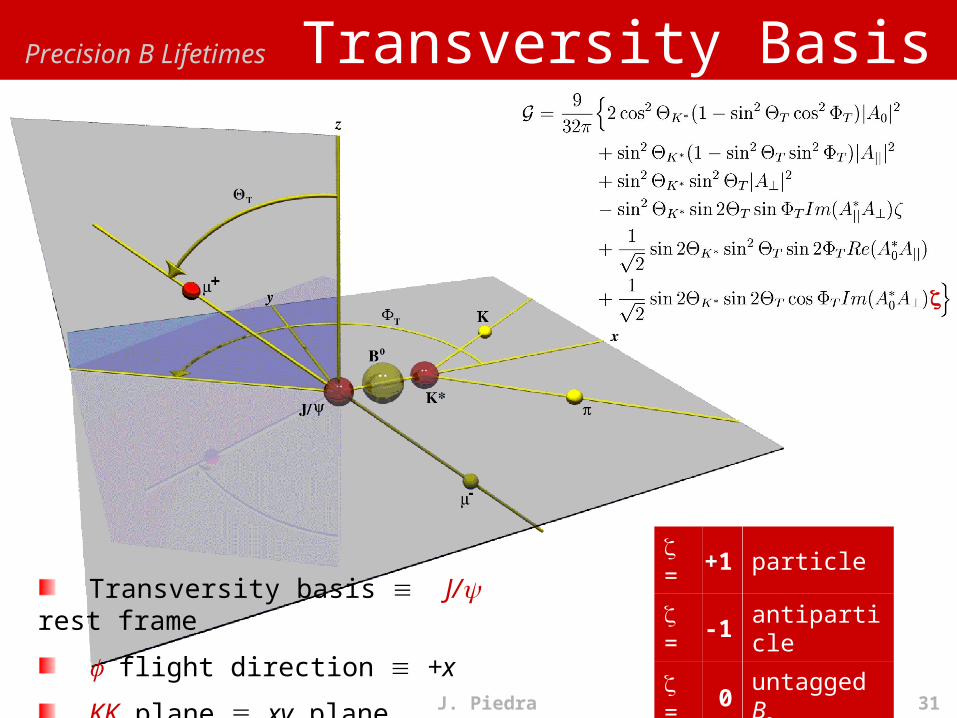
Precision B Lifetimes Transversity Basis
Transversity basis J/ rest frame
flight direction +x
KK plane xy plane
= +1 particle
= -1 antiparticle
= 0 untagged Bs

April 9, 2006 32J. Piedra
B Mixing Semileptonic Decay Time
Missing particles missing pT
Determine pseudo-ct from data
ct = ct* kMC
include kMC effect in signal PDF
lDT
Bxy p
mLct *
**MC*
MC* ctGaussctckctexp
ckctP
2
MCkF