Embed Size (px)
Citation preview

Increased demands for groundwater by agriculture, industries, and municipalities have raised concerns about the future availability of groundwater in Iowa. In 2007, the Iowa Legislature began funding a comprehensive Water Resources Management program, which would be implemented by the Iowa Department of Natural Resources. A key aspect of the program is to evaluate
and quantify the groundwater resources across the state using computer simulation models. These models help answer questions such as: “How much water can be pumped from an aquifer over 10, 20, or 100 years?” or “Will my well go dry?”
West Nishnabotna Alluvial AquiferSince regional bedrock aquifers are
absent in southwest Iowa, water users
Common Ground
Iowa Geological and Water Survey Resource Information Fact Sheet 2010-1ur
Iowa Department of Natural Resources
Groundwater Availability Modeling of the West Nishnabotna Alluvial Aquifer
Printed on Recycled Paper
Iowa Department of Natural Resources, Geological and Water Survey 109 Trowbridge Hall, Iowa City, IA 52242-1319(319) 335-1575www.igsb.uiowa.edu
in this area rely heavily on shallow alluvial aquifers, which are sand and gravel deposits associated with major rivers. The West Nishnabotna aquifer is an alluvial aquifer in southwest Iowa (Figure 1). The West Nishnabotna aquifer consists of alluvial deposits and some terrace deposits associated with the West Nishnabotna River. The aquifer varies from 0.25 miles wide north of
A high percentage of induced recharge and potential for low streamflow in the West Nishnabotna River combine to make the Manning area vulnerable to a severe drought. Wells in the Manning area receive a large percent of induced recharge, averaging 67% and reaching as high as 90%. The Manning area is near the headwaters of the West Nishnabotna River, and very few tributaries contribute to the overall flow. If the West Nishnabotna River were to dry up during a severe drought, a major source of recharge to the wells in the Manning area would be lost. No streamflow data exists in the Manning area to determine if the West Nishnabotna River dries up.
The computer simulation model was used to evaluate an existing water-use permit for a large dairy north of Harlan. The model results predicted
a maximum drop in water level of 10 feet but indicated that no existing wells in the area would be influenced by the withdrawal. The model gives water regulators assurance that there is sufficient quantity of water available for all users.
ConclusionThe computer simulation model
for the West Nishnabotna aquifer provides a powerful tool for water resource managers to evaluate the West Nishnabotna aquifer. The study’s results found a strong interaction between the West Nishnabotna River and the alluvial aquifer. As a result of this interaction, most wells in the West Nishnabotna aquifer will have water during droughts and dry periods as long as water flows in the West Nishnabotna River.
More detailed information about the West Nishnabotna aquifer and its computer simulation model can be found at www.igsb.uiowa.edu/webapps/gsbpubs/pdf/wri-3.pdf or www.igsb.uiowa.edu/WaterPlan/WaterPlan.htm.
AcknowledgementsA special thanks to Quad State
Services, Inc., Layne Christiansen, Inc., and the Iowa Department of Natural Resources Atlantic Field Office who provided data that was used to create the computer simulation models.
FundingWater resource management
activities of the Iowa Department of Natural Resources are funded by Iowa Infrastructure—Environment First Fund appropriations.
Figure 1. Extent of West Nishnabotna study area in southwest Iowa.W
. Nish
nabo
tna
R.
Wal
nut C
reekW
. Nis
hnab
otna
R.
Silv
er C
reek
West Fork
East Fork
Irwin
CASS ADAIR
MILLS
SHELBY GUTHRIEHARRISON
UNION
PAGE
ADAMS
POTTAWATTAMIE
AUDUBON
GREENE
TAYLOR
DALLAS
FREMONT
MONONA
CARROLL
CRAWFORD
MONTGOMERY
RINGGOLD
MADISON
BOONE
Ü
W. Nishnabotna River and Tributaries
W. Nishnabotna Aquifer
Miles0 20 4010 30
Photo. West Nishnabotna valley and uplands.

Harlan
Avoca
Manning
Oakland
Miles0 20 4010 30
Pottawattamie
Harrison
Monona Crawford Carroll
Shelby
Audubon
Cass
MAPWC1,091,327 gpd
(27%)
RegionalWater
859,865 gpd(21%)
Harlan674,120 gpd
(16%)Oakland
616,101 gpd(15%)
AllOthers
858,590 gpd(21%)
Manning in Carroll County, to over 3 miles wide in Mills and Fremont counties and ranges in thickness from 3 to over 40 feet.
From 2004 through 2009, urban and rural water users removed between 4.2 million gallons of water per day (mgd) to 5.7 mgd from the West Nishnabotna aquifer. Groundwater withdrawals from four regions, the City of Manning/Ag Processing/West Central Iowa Rural Water Association (MAPWC), City of Harlan, Regional Water, and City of Oakland, comprise approximately 80% of the total withdrawals from the main branch of the West Nishnabotna aquifer (Figure 2).
Aquifer StudyIn 2009, a hydrogeologic study
was initiated to more fully understand the shallow groundwater resources in the West Nishnabotna aquifer. A computer simulation model of the West Nishnabotna aquifer was created. This model quantifies the amount of
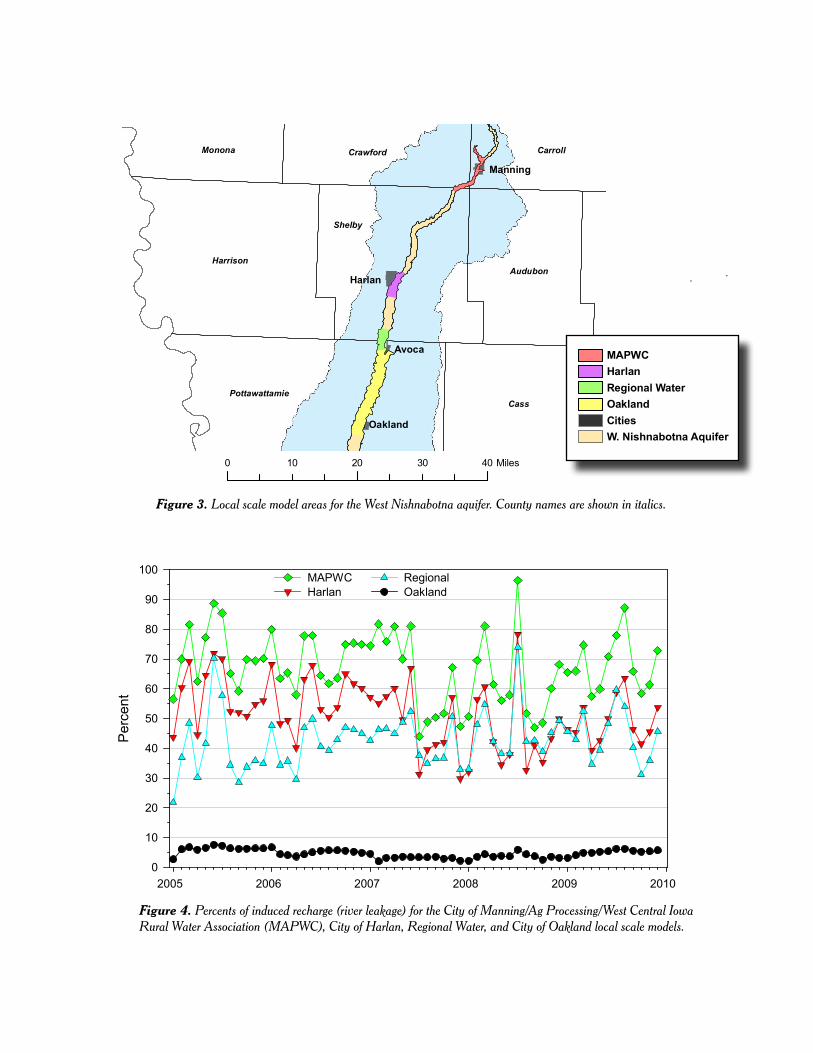
The amount of induced recharge a well can receive is partially dependent on the proximity of the well to the river. Figure 4 shows the percentage of induced recharge each month for the four major pumping regions. Wells in the Manning area are located a few hundred feet from the West Nishnabotna River and average 67% induced recharge. Conversely, wells in the City of Oakland region are located from 0.5 to 1 mile away from the river and only average 5% induced recharge.
Water AvailabilityThe lack of induced recharge
makes water availability in the City of Oakland an issue during droughts. The City of Oakland’s wells in the West Nishnabotna aquifer are recharged primarily by precipitation and not by induced recharge. These wells will not produce as much water during a severe drought. This forces the City of Oakland to depend more on wells open to other aquifers to maintain its water supply.
Figure 2. Average daily use and percentages of groundwater removed from the West Nishnabotna aquifer by the City of Manning/Ag Processing/West Central Iowa Rural Water Association (MAPWC), City of Harlan, City of Oakland, Regional Water, and others (gpd = gallons of water per day).
Figure 3. Local scale model areas for the West Nishnabotna aquifer. County names are shown in italics.
Ha r la n
Av o ca
M an n in g
Oa k la n d
Ma lv er nHa st ing s
Ra nd ol ph
MAPWCHarlanRegional WaterOaklandCitiesW. Nishnabotna Aquifer
Figure 4. Percents of induced recharge (river leakage) for the City of Manning/Ag Processing/West Central Iowa Rural Water Association (MAPWC), City of Harlan, Regional Water, and City of Oakland local scale models.
water in the West Nishnabotna aquifer and predicts the future availability of groundwater in the aquifer. More detailed models of the West Nishnabotna aquifer were created for the four major pumping regions (Figure 3). These models allowed closer examination of local issues, such as quantifying the amount of groundwater that can be pumped without adversely affecting nearby wells.
The results of the hydrogeologic study found a strong interaction between the West Nishnabotna River and the alluvial aquifer. On average, approximately 50% of the groundwater withdrawn from the aquifer is generated, or recharged, from the West Nishnabotna River. Precipitation accounts for the remainder of the recharge. The recharge from the river, or induced recharge, provides security for most users of the West Nishnabotna aquifer. As long as water flows in the river, induced recharge will provide water to most wells during droughts and dry periods.
2005 2006 2007 2008 2009 2010
Per
cent
0
10
20
30
40
50
60
70
80
90
100Regional Oakland
MAPWCHarlan
Harlan
Avoca
Manning
Oakland
Miles0 20 4010 30
Pottawattamie
Harrison
Monona Crawford Carroll
Shelby
Audubon
Cass
MAPWC1,091,327 gpd
(27%)
RegionalWater
859,865 gpd(21%)
Harlan674,120 gpd
(16%)Oakland
616,101 gpd(15%)
AllOthers
858,590 gpd(21%)
Manning in Carroll County, to over 3 miles wide in Mills and Fremont counties and ranges in thickness from 3 to over 40 feet.
From 2004 through 2009, urban and rural water users removed between 4.2 million gallons of water per day (mgd) to 5.7 mgd from the West Nishnabotna aquifer. Groundwater withdrawals from four regions, the City of Manning/Ag Processing/West Central Iowa Rural Water Association (MAPWC), City of Harlan, Regional Water, and City of Oakland, comprise approximately 80% of the total withdrawals from the main branch of the West Nishnabotna aquifer (Figure 2).
Aquifer StudyIn 2009, a hydrogeologic study
was initiated to more fully understand the shallow groundwater resources in the West Nishnabotna aquifer. A computer simulation model of the West Nishnabotna aquifer was created. This model quantifies the amount of
The amount of induced recharge a well can receive is partially dependent on the proximity of the well to the river. Figure 4 shows the percentage of induced recharge each month for the four major pumping regions. Wells in the Manning area are located a few hundred feet from the West Nishnabotna River and average 67% induced recharge. Conversely, wells in the City of Oakland region are located from 0.5 to 1 mile away from the river and only average 5% induced recharge.
Water AvailabilityThe lack of induced recharge
makes water availability in the City of Oakland an issue during droughts. The City of Oakland’s wells in the West Nishnabotna aquifer are recharged primarily by precipitation and not by induced recharge. These wells will not produce as much water during a severe drought. This forces the City of Oakland to depend more on wells open to other aquifers to maintain its water supply.
Figure 2. Average daily use and percentages of groundwater removed from the West Nishnabotna aquifer by the City of Manning/Ag Processing/West Central Iowa Rural Water Association (MAPWC), City of Harlan, City of Oakland, Regional Water, and others (gpd = gallons of water per day).
Figure 3. Local scale model areas for the West Nishnabotna aquifer. County names are shown in italics.
Ha r la n
Av o ca
M an n in g
Oa k la n d
Ma lv er nHa st ing s
Ra nd ol ph
MAPWCHarlanRegional WaterOaklandCitiesW. Nishnabotna Aquifer
Figure 4. Percents of induced recharge (river leakage) for the City of Manning/Ag Processing/West Central Iowa Rural Water Association (MAPWC), City of Harlan, Regional Water, and City of Oakland local scale models.
water in the West Nishnabotna aquifer and predicts the future availability of groundwater in the aquifer. More detailed models of the West Nishnabotna aquifer were created for the four major pumping regions (Figure 3). These models allowed closer examination of local issues, such as quantifying the amount of groundwater that can be pumped without adversely affecting nearby wells.
The results of the hydrogeologic study found a strong interaction between the West Nishnabotna River and the alluvial aquifer. On average, approximately 50% of the groundwater withdrawn from the aquifer is generated, or recharged, from the West Nishnabotna River. Precipitation accounts for the remainder of the recharge. The recharge from the river, or induced recharge, provides security for most users of the West Nishnabotna aquifer. As long as water flows in the river, induced recharge will provide water to most wells during droughts and dry periods.
2005 2006 2007 2008 2009 2010
Per
cent
0
10
20
30
40
50
60
70
80
90
100Regional Oakland
MAPWCHarlan

Increased demands for groundwater by agriculture, industries, and municipalities have raised concerns about the future availability of groundwater in Iowa. In 2007, the Iowa Legislature began funding a comprehensive Water Resources Management program, which would be implemented by the Iowa Department of Natural Resources. A key aspect of the program is to evaluate
and quantify the groundwater resources across the state using computer simulation models. These models help answer questions such as: “How much water can be pumped from an aquifer over 10, 20, or 100 years?” or “Will my well go dry?”
West Nishnabotna Alluvial AquiferSince regional bedrock aquifers are
absent in southwest Iowa, water users
Common Ground
Iowa Geological and Water Survey Resource Information Fact Sheet 2010-1ur
Iowa Department of Natural Resources
Groundwater Availability Modeling of the West Nishnabotna Alluvial Aquifer
Printed on Recycled Paper
Iowa Department of Natural Resources, Geological and Water Survey 109 Trowbridge Hall, Iowa City, IA 52242-1319(319) 335-1575www.igsb.uiowa.edu
in this area rely heavily on shallow alluvial aquifers, which are sand and gravel deposits associated with major rivers. The West Nishnabotna aquifer is an alluvial aquifer in southwest Iowa (Figure 1). The West Nishnabotna aquifer consists of alluvial deposits and some terrace deposits associated with the West Nishnabotna River. The aquifer varies from 0.25 miles wide north of
A high percentage of induced recharge and potential for low streamflow in the West Nishnabotna River combine to make the Manning area vulnerable to a severe drought. Wells in the Manning area receive a large percent of induced recharge, averaging 67% and reaching as high as 90%. The Manning area is near the headwaters of the West Nishnabotna River, and very few tributaries contribute to the overall flow. If the West Nishnabotna River were to dry up during a severe drought, a major source of recharge to the wells in the Manning area would be lost. No streamflow data exists in the Manning area to determine if the West Nishnabotna River dries up.
The computer simulation model was used to evaluate an existing water-use permit for a large dairy north of Harlan. The model results predicted
a maximum drop in water level of 10 feet but indicated that no existing wells in the area would be influenced by the withdrawal. The model gives water regulators assurance that there is sufficient quantity of water available for all users.
ConclusionThe computer simulation model
for the West Nishnabotna aquifer provides a powerful tool for water resource managers to evaluate the West Nishnabotna aquifer. The study’s results found a strong interaction between the West Nishnabotna River and the alluvial aquifer. As a result of this interaction, most wells in the West Nishnabotna aquifer will have water during droughts and dry periods as long as water flows in the West Nishnabotna River.
More detailed information about the West Nishnabotna aquifer and its computer simulation model can be found at www.igsb.uiowa.edu/webapps/gsbpubs/pdf/wri-3.pdf or www.igsb.uiowa.edu/WaterPlan/WaterPlan.htm.
AcknowledgementsA special thanks to Quad State
Services, Inc., Layne Christiansen, Inc., and the Iowa Department of Natural Resources Atlantic Field Office who provided data that was used to create the computer simulation models.
FundingWater resource management
activities of the Iowa Department of Natural Resources are funded by Iowa Infrastructure—Environment First Fund appropriations.
Figure 1. Extent of West Nishnabotna study area in southwest Iowa.W
. Nish
nabo
tna
R.
Wal
nut C
reekW
. Nis
hnab
otna
R.
Silv
er C
reek
West Fork
East Fork
Irwin
CASS ADAIR
MILLS
SHELBY GUTHRIEHARRISON
UNION
PAGE
ADAMS
POTTAWATTAMIE
AUDUBON
GREENE
TAYLOR
DALLAS
FREMONT
MONONA
CARROLL
CRAWFORD
MONTGOMERY
RINGGOLD
MADISON
BOONE
Ü
W. Nishnabotna River and Tributaries
W. Nishnabotna Aquifer
Miles0 20 4010 30
Photo. West Nishnabotna valley and uplands.