Embed Size (px)
Citation preview

Photo by Steve from Austin, TX, USA
B07 - Getting Insight from a Billion Rows in Seconds – Supercharge your Performance Database with IDAA Billy Sundarrajan Fifth Third Bank
Session Code: B07 Tue, May 24, 2016 (10:30 AM - 11:30 AM) | Platform: z/OS

Session objectives
• Overview of IDAA
• Fifth Third’s performance database
• Setting up the performance database to be IDAA ready
• Using IDAA to trend/forecast database performance, analyze database performance issues
• Using IDAA to effectively monitor your load tests
• Using IDAA storage saver to shrink the size of performance database

IBM DB2 Analytics Accelerator - Overview Product Components
OSA-Express
10 GbE
CLIENT
Data Studio Foundation
DB2 Analytics Accelerator
Admin Plug-in
zEnterprise
Data Warehouse application DB2 for z/OS enabled for IBM
DB2 Analytics Accelerator
IBM DB2 Analytics
Accelerator
Netezza Technology (PDA)
Users/
Applications
Dedicated highly available network connection

Fifth Third’s Performance Database
• Contains over 20 billion rows and growing
• Data from Omegamon Performance Database • Statistics and Accounting data
• Local and Group Bufferpool performance data
• System Parameter data
• Accelerator Performance Data
• Data from Query Monitor Repository
• Dynamic and Static SQL performance data
• Exception SQLs
• Exception SQLCODE information

Fifth Third’s Performance Database
• Custom SQL repository for dynamic and static SQL
• Unique list of all dynamic SQLs
• Static SQL – SYSPACKSTMT
• LISTCAT data
• Statement Cache Data
• IDAA Interface statistics

Why Fifth Third moved Omegamon PDB/QM data to DB2 Analytics Accelerator? • Significant increase in number of records in performance
database forced us to reduce the retention period
• Reporting on complex queries such as Bufferpool usage required CPU & IO intensive indexing on Very large objects (~5.5 Billion rows)
• Ability to trend data for periods not in the PDB became resource intensive. “Analyzing our Performance database started to become a performance/resource bottleneck”

Why Fifth Third moved Omegamon PDB/QM data to DB2 Analytics Accelerator? • Ad-hoc analysis on a database containing ~15 billion rows and
growing became a challenging effort
• Offloading the work to DB2 Analytics Accelerator allowed us to focus on database performance management, and focus less on tuning the performance database
• Over 50% additional compression observed on compressed DB2 data moved to the appliance

DB2 Analytics Accelerator Compression savings (GB)
0
500
1000
1500
2000
2500
3000
3500
3492
1128
2064
448 469 582
282 258 112 78
273 158 128 71 37
DB2 w/o compression
DB2 with compression
IDAA
More than 50%
compression seen
on already
compressed data

Getting your PDB to be IDAA ready

• Developed a flexible framework to handle partition management and acceleration of partitions to DB2 Analytics Accelerator
• Modified all large Omegamon PDB tables, Query Monitor repository tables, and in-house tables to be range partitioned by TIMESTAMP. • Partitioning allows DB2 Analytics Accelerator Stored procedures to
move only the changed partitions
• Developed control tables and Rexx routines to automate the rotation of tables and loading tables to DB2 Analytics Accelerator
• Developed custom Rexx to parse the output of AQTSCALL to capture and monitor data transfer rates
• Enhanced the custom query repository for static and dynamic SQLs –using MD5

DB2 Analytics Accelerator Transfer Rates (1-day sample)
1
10
100
1000
10000
100000
1000000
10000000
Rows Rows/sec MB MB/sec
6172481
19595 18265
58
5281029
352069
956
64
7620314
94078
4851
60
345435
69087
196
39
9723998
110500
3922
45
DB2PMFACCT_BUFFER
DB2PMFACCT_DDF
DB2PMFACCT_GENERAL
DB2PMFACCT_GBUFFER
DB2PMFACCT_PROGRAM
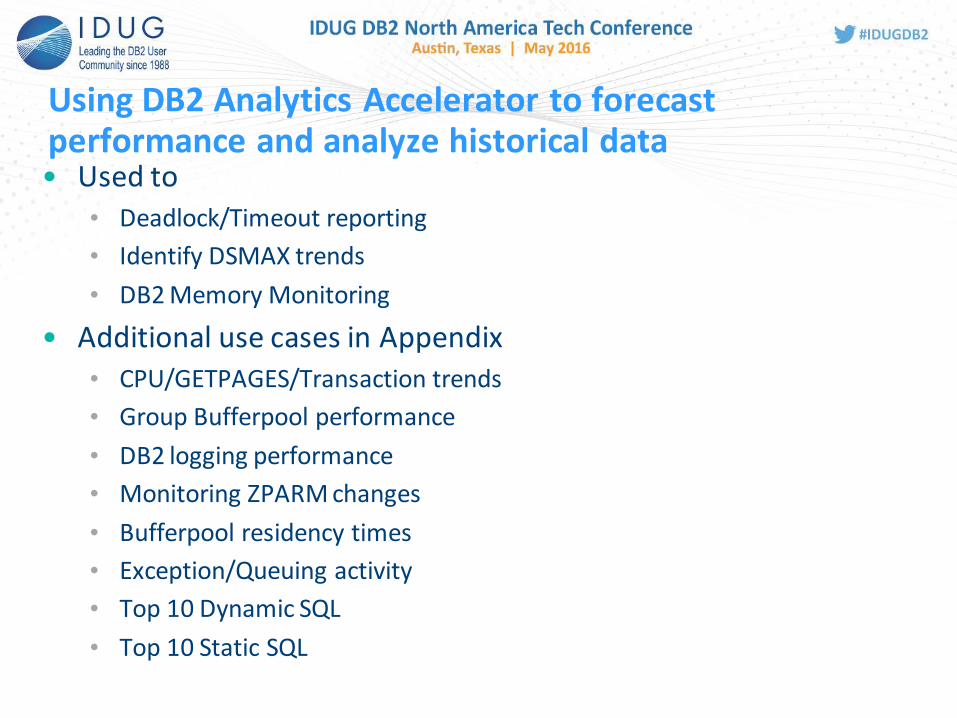
Using DB2 Analytics Accelerator to forecast performance and analyze historical data • Used to
• Deadlock/Timeout reporting
• Identify DSMAX trends
• DB2 Memory Monitoring
• Additional use cases in Appendix
• CPU/GETPAGES/Transaction trends
• Group Bufferpool performance
• DB2 logging performance
• Monitoring ZPARM changes
• Bufferpool residency times
• Exception/Queuing activity
• Top 10 Dynamic SQL
• Top 10 Static SQL

Performance Data Analysis with DB2 Analytics Accelerator
** SEO by Dan Hetteix from The Noun Project
0
1
10
100
1,000
10,000
100,000
1,000,000
10,000,000
100,000,000
1,000,000,000
10,000,000,000
Deadlock/timeoutreport (by Day)
Deadlock/timeoutreport (by Hour)
DSMAX - 1 yearanalysis
Groupbuffer poolanalysis
DB2 Memoryusage analysis - 1
year
1,500,000,000 1,500,000,000
5,000,000
48,000,000
5,000,000
11 13
1
5
20
423 424 485 400
140 98
284
47 89
5289
#rows
Elapsed time (seconds)
GETPAGES
CPU (milli seconds)
Minimal CPU
consumption in DB2 –
in the order of
hundreds of
milliseconds

DB2 Analytics Accelerator – Routing queries to Accelerator
• Routing was controlled through a combination of
• ZPARMs - ACCEL
• SET CURRENT QUERY ACCELERATION command
• ODBC CLI settings
• specialRegisters in db2dsdriver.cfg file
• JDBC settings (when using Data Studio)
• specialRegisters=CURRENT QUERY ACCELERATION=ELIGIBLE;
** SEO by Dan Hetteix from The Noun Project
specialRegisters
parm

Deadlock / Timeout trending
• Prior to DB2 Analytics Accelerator • Trending deadlock/timeouts for an
extended period was extremely resource intensive
• Consumed upwards of several hours if the data was not in PDB
• After DB2 Analytics Accelerator • Analyzed ~1.5 billion rows of
performance data in 10 seconds, 400 GETPAGES, 0.09 CPU seconds
• DB2 Analytics Accelerator compressed DB2 performance data from 687GB to 282GB.
• Allowed us to identify deadlock/timeout patterns with minimal effort and remediate them
Overall Deadlock/Timeout trends
SELECT DATE(ACCT.TIMESTAMP),
HOUR(ACCT.TIMESTAMP), SUM(ACCT.DEADLOCK),
SUM(ACCT.TIMEOUT)
FROM DB2PMFACCT_GENERAL ACCT,
WHERE ACCT.SUBSYSTEM_ID = ?
AND ACCT.TIMESTAMP >= ?
GROUP BY DATE(ACCT.TIMESTAMP), HOUR(ACCT.TIMESTAMP)
WITH UR

Deadlock / Timeout trending
• Determining the number of deadlocks/timeouts by an
application/authorization ID over a period of time SELECT
DATE(ACCT.TIMESTAMP),
HOUR(ACCT.TIMESTAMP),
ACCT.SUBSYSTEM_ID,
SUM(ACCT.DEADLOCK),
SUM(ACCT.TIMEOUT)
FROM
DB2PMFACCT_GENERAL ACCT,
WHERE
ACCT.PRIMAUTH = ?
AND ACCT.TIMESTAMP BETWEEN ? AND ?
GROUP BY DATE(ACCT.TIMESTAMP),
HOUR(ACCT.TIMESTAMP),
ACCT.SUBSYSTEM_ID
WITH UR
** SEO by Dan Hetteix from The Noun Project

DSMAX trends • Prior to DB2 Analytics Accelerator
• Monitoring DSMAX (#datasets closed due to DSMAX limit, High water mark for number of open datasets) by member was extremely challenging.
• After DB2 Analytics Accelerator
• Analyzed ~6 million rows of performance data in 5 seconds, ~400 GETPAGES, 0.04 CPU seconds
• Determining the High water mark for DSMAX for a subsystem over a period of time
• Able to detect Dataset open patterns
SELECT
STAT.SUBSYSTEM_ID, DATE(STAT.BEGIN_REC_TSTAMP),ZPRM.DSMAX AS “DSMAX_ZPARM”
MAX(STAT.CUR_OPEN_DATASETS), MAX(STAT.MAX_OPEN_DATASETS)
FROM DB2PM_STAT_GENERAL STAT,
DB2PMSYSPAR_106
WHERE
STAT.SUBSYSTEM_ID = ?
AND STAT.BEGIN_REC_TSTAMP >= ?
AND STAT.SUBSYSTEM_ID = ZPRM.SUBSYSTEM_ID AND ZPRM.TIMESTAMP = ?
GROUP BY
STAT.SUBSYSTEM_ID, DATE(STAT.BEGIN_REC_TSTAMP)
WITH UR

DSMAX trends
• Determining the DS pseudo-close rate for all environments over a period of time
SELECT
SUBSYSTEM_ID,
DATE(BEGIN_REC_TSTAMP),
MAX(DS_CLOSED_BY_DRAIN),
MAX(CONVERT_RW_TO_RO/INTERVAL_ELAPSED)
FROM
DB2PM_STAT_GENERAL
WHERE
SUBSYSTEM_ID = ? AND BEGIN_REC_TSTAMP >= ?
GROUP BY
SUBSYSTEM_ID, DATE(BEGIN_REC_TSTAMP) WITH UR
*DS_CLOSED_BY_DRAIN > 0 indicates that DSMAX or MVS DD limit was reached
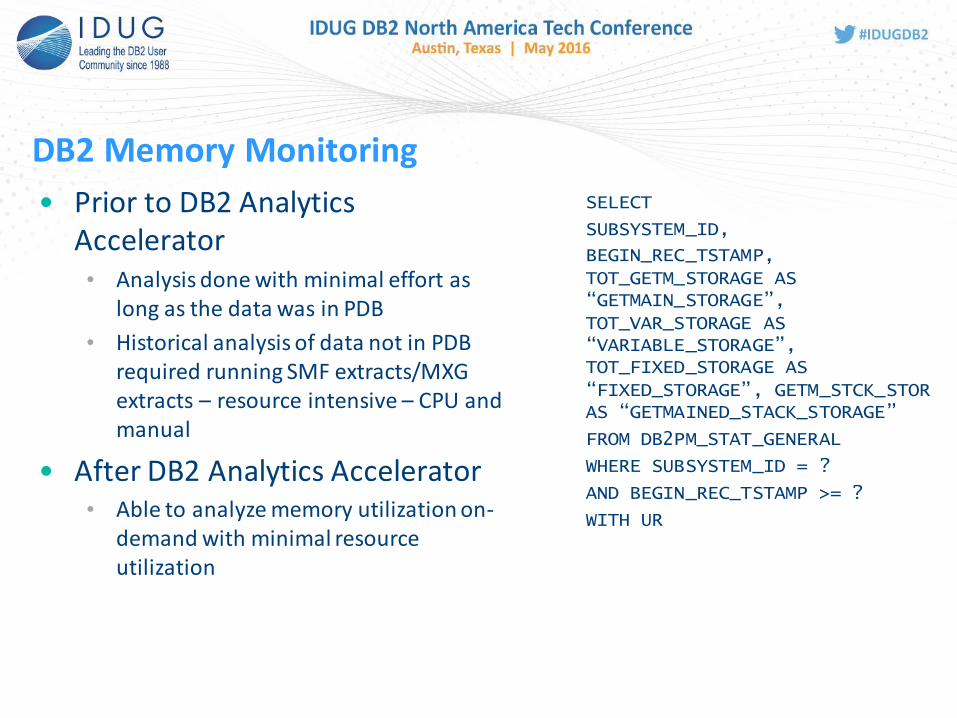
DB2 Memory Monitoring
• Prior to DB2 Analytics Accelerator • Analysis done with minimal effort as
long as the data was in PDB
• Historical analysis of data not in PDB required running SMF extracts/MXG extracts – resource intensive – CPU and manual
• After DB2 Analytics Accelerator • Able to analyze memory utilization on-
demand with minimal resource utilization
SELECT
SUBSYSTEM_ID,
BEGIN_REC_TSTAMP, TOT_GETM_STORAGE AS “GETMAIN_STORAGE”, TOT_VAR_STORAGE AS “VARIABLE_STORAGE”, TOT_FIXED_STORAGE AS “FIXED_STORAGE”, GETM_STCK_STOR AS “GETMAINED_STACK_STORAGE”
FROM DB2PM_STAT_GENERAL
WHERE SUBSYSTEM_ID = ?
AND BEGIN_REC_TSTAMP >= ?
WITH UR

V3 - Storage Saver/Shrink your PDB
• Reduced performance data foot print in DB2 without limiting our ability to analyze performance data
• Migrating partitions to storage save causes partitions to be placed in a Persistent Read Only (PRO) status
• Migration to storage saver performs an Imagecopy followed by a LOAD REPLACE with a DD DUMMY
• Tables with NPSIs may have a table outage
• DDLs such as ROTATE will fail. Custom process needed to remove PRO status on the first logical part prior to ROTATE
• SET CURRENT QUERY ACCELERATION ALL
• Forces the archives to be Searched with out setting CURRENT GET_ACCEL_ARCHIVE

V3 - Storage Saver
• AQTSCALL used to move partitions to Accelerator
• AQTP1/P2 used to specify Accelerator Name, and
partitions to be moved to Accelerator
• AQT_ARCHIVE_COPY1 parm in AQTENV defines the
name used for Imagecopy before a LOAD REPLACE is
done
• Small PRIQTY is needed to drive maximum storage
savings

Partitions element in XML
determine which parts
should be moved to
appliance for HPSS
V3 - Storage Saver
//*Parm 1 – Accelerator Name
//AQTP1 DD *
IDAATEST
/*
//* parameter #2 Tables to be archived
//AQTP2 DD *
<?xml version="1.0" encoding="UTF-8" ?>
<aqt:tableSetForArchiving
xmlns:aqt="http://www.ibm.com/xmlns/prod/dwa/2011" version="1.0">
<table schema="DBT1" name="TDB_TEST_TWO">
<partitions>4</partitions>
</table>
</aqt:tableSetForArchiving>
/*

Performance boost features in V4
• Multi-row fetch support for DSNTIAUL • Prior to V4 DSNTIAUL had to be used with ROWSET of 1
• V4 – DSNTEP4 and DSNTIAUL can be used to do Multi-row fetch from Accelerator
• Significant CPU/Elapsed time reduction with Multi-row fetch
• VARHCAR/CHAR for BIT data – used to query Query Monitor Data
• Requires DB2 Analytics Accelerator V4 PTF2 to accelerate the data to the appliance
• DB2 APAR PI09198/UI17240 needed to enable functionality
• Table(s) added prior to V4 will need to be dropped and re-added
• SUPPORTLEVEL column in SYSACCELERATEDTABLES contains the version number under which table was added
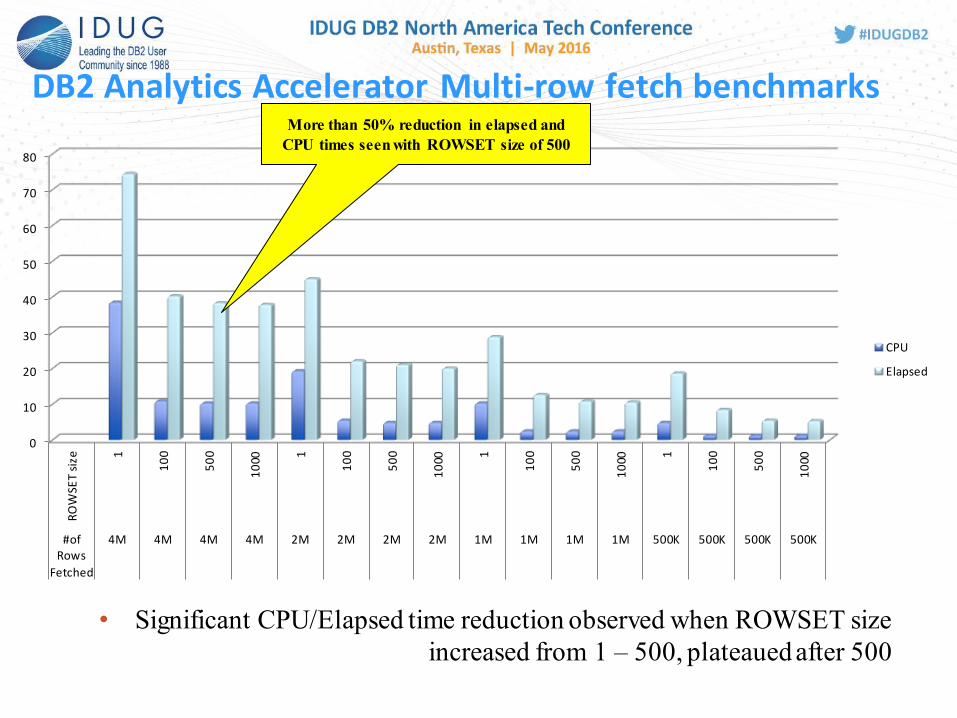
DB2 Analytics Accelerator Multi-row fetch benchmarks
• Significant CPU/Elapsed time reduction observed when ROWSET size
increased from 1 – 500, plateaued after 500
0
10
20
30
40
50
60
70
80
RO
WSE
T si
ze 1
10
0
50
0
10
00 1
10
0
50
0
10
00 1
10
0
50
0
10
00 1
10
0
50
0
10
00
#ofRows
Fetched
4M 4M 4M 4M 2M 2M 2M 2M 1M 1M 1M 1M 500K 500K 500K 500K
CPU
Elapsed
More than 50% reduction in elapsed and
CPU times seen with ROWSET size of 500

DB2 Analytics Accelerator’s impact
• Prior to implementing DB2 Analytics Accelerator, performing ad-hoc and long term trending of resource utilization required significant amounts of CPU resources and repetitive work
• Manual runs of OMEGAMON Accounting/Statistics reports for historical periods not in PDB
• Tracking data in Excel spreadsheets
• After implementation of DB2 Analytics Accelerator • Streamlined queries that can be run by the DBAs without impacting DB2
CPU
• Ability to run ad-hoc queries; makes discussions more productive rather than wait for information
• Ability to analyze long term performance data and provide value to IT-LOB customers
• Reliable trending and period-by-period analysis
Appendix – Use Cases/Sample SQLs used to query Performance Database
** RAM Chip by Mike Wirth from The Noun Project

DB2 Memory Monitoring
• Memory trends…. • Monitor storage cushion trends
• Monitor real and auxiliary storage usage
• How to get information on storage cushion trends SELECT
SUBSYSTEM_ID,
BEGIN_REC_TSTAMP,
TOT_STORAGE_RESERV AS “MUST_COMPLETE_STORAGE”,
TOT_AMOUNT_FOR_MVS AS “STORAGE_FOR_OS”,
WARN_CUSH_TO_CONTR AS “WARNING_TO_CONTRACT”,
AVAILABLE_STORAGE AS “AVAIL_STORAGE”
FROM
DB2PM_STAT_GENERAL
WHERE
SUBSYSTEM_ID = ? AND BEGIN_REC_TSTAMP >= ?
WITH UR
** RAM Chip by Mike Wirth from The Noun Project
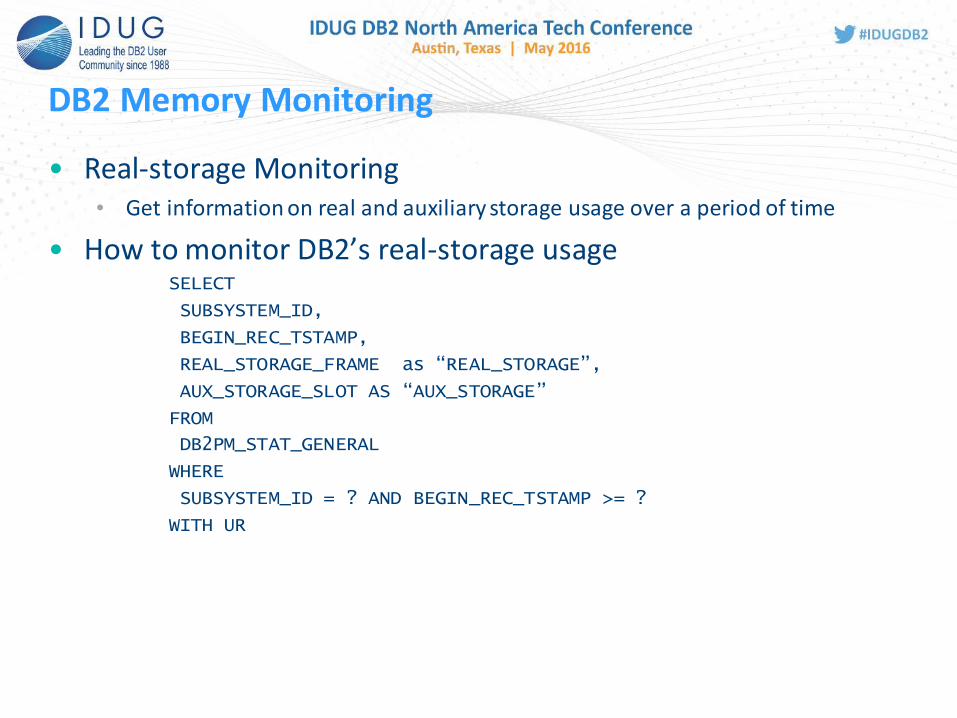
DB2 Memory Monitoring
• Real-storage Monitoring • Get information on real and auxiliary storage usage over a period of time
• How to monitor DB2’s real-storage usage SELECT
SUBSYSTEM_ID,
BEGIN_REC_TSTAMP,
REAL_STORAGE_FRAME as “REAL_STORAGE”,
AUX_STORAGE_SLOT AS “AUX_STORAGE”
FROM
DB2PM_STAT_GENERAL
WHERE
SUBSYSTEM_ID = ? AND BEGIN_REC_TSTAMP >= ?
WITH UR

Log Data trending
• Log data trending…. • Trend log write activity over a period of time
• Identify log hot spots
• How to determine the log write activity over a period of time SELECT
SUBSYSTEM_ID,
DATE(BEGIN_REC_TSTAMP),
HOUR(BEGIN_REC_TSTAMP),
SUM(LOG_CI_WRITTEN* 4096)
FROM
DB2PM_STAT_GENERAL
WHERE
SUBSYSTEM_ID = ? AND BEGIN_REC_TSTAMP >= ?
GROUP BY
SUBSYSTEM_ID, DATE(BEGIN_REC_TSTAMP), HOUR(BEGIN_REC_TSTAMP)
WITH UR

Log Data trending
• Log data trending…. • Trend log write activity over a period of time
• Identify log hot spots
• How to determine log write hotspots SELECT
SUBSYSTEM_ID,
BEGIN_REC_TSTAMP,
LOG_CI_WRITTEN,
LOG_BUF_PAGED_IN,
UNAVAIL_LOG_BUF,
LOG_RECS_CREATED
FROM
DB2PM_STAT_GENERAL
WHERE
SUBSYSTEM_ID = ? AND BEGIN_REC_TSTAMP >= ? AND UNAVAIL_LOG_BUF > 0 WITH UR
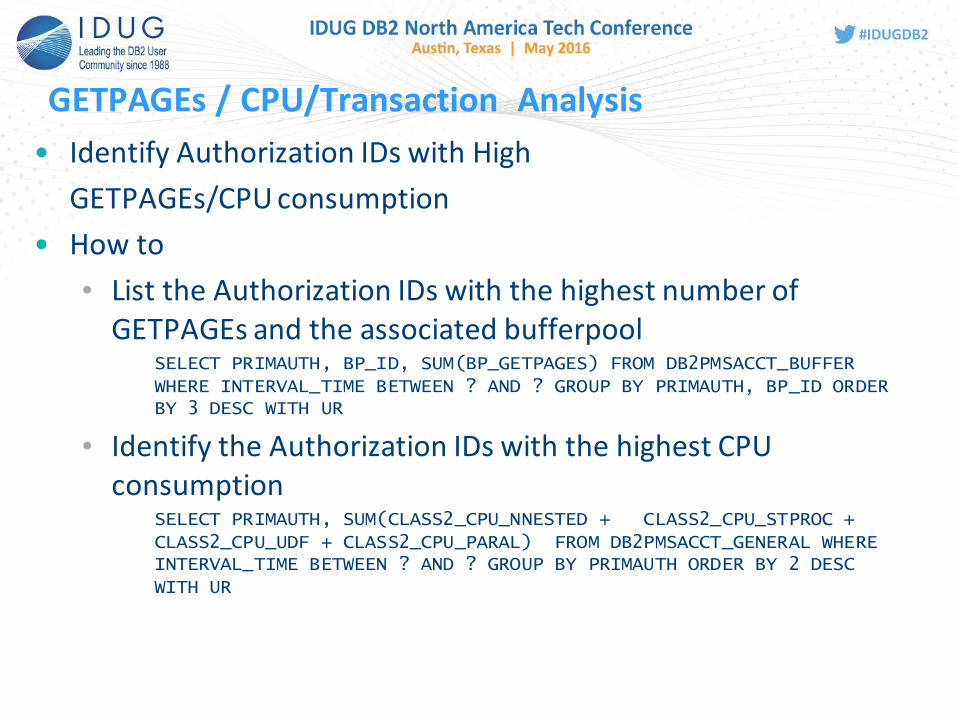
GETPAGEs / CPU/Transaction Analysis
• Identify Authorization IDs with High
GETPAGEs/CPU consumption
• How to
• List the Authorization IDs with the highest number of GETPAGEs and the associated bufferpool
SELECT PRIMAUTH, BP_ID, SUM(BP_GETPAGES) FROM DB2PMSACCT_BUFFER WHERE INTERVAL_TIME BETWEEN ? AND ? GROUP BY PRIMAUTH, BP_ID ORDER BY 3 DESC WITH UR
• Identify the Authorization IDs with the highest CPU consumption
SELECT PRIMAUTH, SUM(CLASS2_CPU_NNESTED + CLASS2_CPU_STPROC + CLASS2_CPU_UDF + CLASS2_CPU_PARAL) FROM DB2PMSACCT_GENERAL WHERE INTERVAL_TIME BETWEEN ? AND ? GROUP BY PRIMAUTH ORDER BY 2 DESC WITH UR
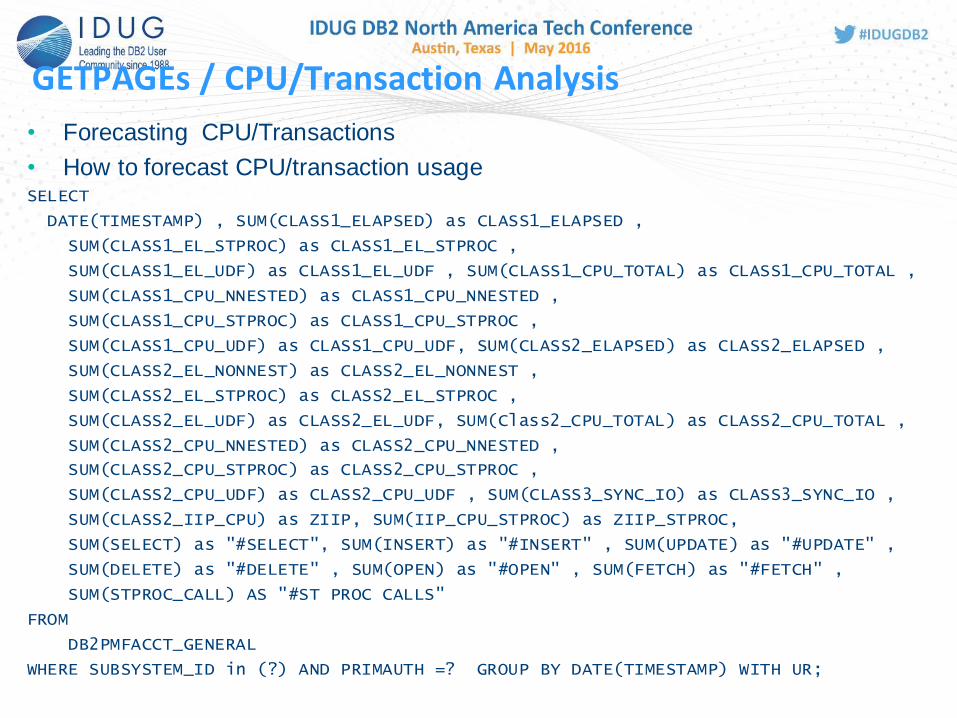
GETPAGEs / CPU/Transaction Analysis
• Forecasting CPU/Transactions
• How to forecast CPU/transaction usage SELECT
DATE(TIMESTAMP) , SUM(CLASS1_ELAPSED) as CLASS1_ELAPSED ,
SUM(CLASS1_EL_STPROC) as CLASS1_EL_STPROC ,
SUM(CLASS1_EL_UDF) as CLASS1_EL_UDF , SUM(CLASS1_CPU_TOTAL) as CLASS1_CPU_TOTAL ,
SUM(CLASS1_CPU_NNESTED) as CLASS1_CPU_NNESTED ,
SUM(CLASS1_CPU_STPROC) as CLASS1_CPU_STPROC ,
SUM(CLASS1_CPU_UDF) as CLASS1_CPU_UDF, SUM(CLASS2_ELAPSED) as CLASS2_ELAPSED ,
SUM(CLASS2_EL_NONNEST) as CLASS2_EL_NONNEST ,
SUM(CLASS2_EL_STPROC) as CLASS2_EL_STPROC ,
SUM(CLASS2_EL_UDF) as CLASS2_EL_UDF, SUM(Class2_CPU_TOTAL) as CLASS2_CPU_TOTAL ,
SUM(CLASS2_CPU_NNESTED) as CLASS2_CPU_NNESTED ,
SUM(CLASS2_CPU_STPROC) as CLASS2_CPU_STPROC ,
SUM(CLASS2_CPU_UDF) as CLASS2_CPU_UDF , SUM(CLASS3_SYNC_IO) as CLASS3_SYNC_IO ,
SUM(CLASS2_IIP_CPU) as ZIIP, SUM(IIP_CPU_STPROC) as ZIIP_STPROC,
SUM(SELECT) as "#SELECT", SUM(INSERT) as "#INSERT" , SUM(UPDATE) as "#UPDATE" ,
SUM(DELETE) as "#DELETE" , SUM(OPEN) as "#OPEN" , SUM(FETCH) as "#FETCH" ,
SUM(STPROC_CALL) AS "#ST PROC CALLS"
FROM
DB2PMFACCT_GENERAL
WHERE SUBSYSTEM_ID in (?) AND PRIMAUTH =? GROUP BY DATE(TIMESTAMP) WITH UR;

Lock analysis
• Using Lock data in the PDB …. • Identify those applications that are most likely
to have the largest number of deadlocks/timeouts
• Use the lock rate to determine if the GBPs are appropriately
sized
• How to: • Identify the Authorization IDs with the highest lock wait times
SELECT PRIMAUTH, SUM(CLASS3_LOCK_LATCH) FROM DB2PMSACCT_GENERAL WHERE INTERVAL_TIME BETWEEN ? AND ? GROUP BY PRIMAUTH ORDER BY 2 DESC WITH UR
• Identify Locking rate SELECT TIME(BEGIN_REC_TSTAMP) AS "INTERVAL", LOCK_REQ AS “#LOCK_REQUEST", UNLOCK_REQ AS "#UNLOCK_REQUESTS" , CHANGE_REQ AS “#LOCK_CHG_REQUESTS", (LOCK_REQ + UNLOCK_REQ + CHANGE_REQ) AS "TOTAL LOCKS“, SUSP_IRLM_LATCH AS “#IRLM_SUSPENSIONS” FROM DB2PM_STAT_GENERAL WHERE SUBSYSTEM_ID -= ? AND BEGIN_REC_TSTAMP BETWEEN ? AND ? WITH UR;

Data sharing Lock analysis
• Using Data sharing information in PDB to … • Understand Global contention trends
• False contention patterns
• P-Lock negotiation rates
• How to determine global contention trends? SELECT
SYNCH_XES_LOCK+ SYNCH_XES_UNLOCK + SYNCH_XES_CHANGE AS “#XES_REQUESTS”,
SUSPEND_IRLM_CONT+ SUSPEND_XES_CONT+ SUSPEND_FLSE_CONT AS “#SUSPENDS”,
(SUSPEND_IRLM_CONT+SUSPEND_XES_CONT+SUSPEND_FLSE_CONT)/
(SUSPEND_IRLM_CONT+SUSPEND_XES_CONT+ SUSPEND_FLSE_CONT+
SYNCH_XES_LOCK+ SYNCH_XES_UNLOCK +SYNCH_XES_CHANGE) AS
“GLOBAL_CONTETION_PCT”
FROM
DB2PM_STAT_GENERAL
WHERE
SUBSYSTEM_ID = ? AND BEGIN_REC_TSTAMP BETWEEN ? AND ?
WITH UR;

Data sharing Lock analysis
• Using Data sharing information in PDB to … • False contention patterns
• P-Lock negotiation rates
• How to determine false contention trends? SELECT
SUSPEND_FLSE_CONT AS “#FALSE_CONT_SUSPENDS”,
(SUSPEND_IRLM_CONT+ SUSPEND_XES_CONT+ SUSPEND_FLSE_CONT+
SYNCH_XES_LOCK+ SYNCH_XES_UNLOCK + SYNCH_XES_CHANGE)
AS “#XES_IRLM_REQUESTS”,
SUSPEND_FLSE_CONT/(SUSPEND_IRLM_CONT+ SUSPEND_XES_CONT+
SUSPEND_FLSE_CONT+ SYNCH_XES_LOCK+ SYNCH_XES_UNLOCK +
SYNCH_XES_CHANGE) AS “FALSE_CONTETION_PCT”
FROM
DB2PM_STAT_GENERAL
WHERE
SUBSYSTEM_ID = ? AND BEGIN_REC_TSTAMP BETWEEN ? AND ?
WITH UR;

Data sharing Lock analysis
• Using Data sharing information in PDB to … • P-Lock negotiation rates
• How to determine P-lock negotiation rates? SELECT
PSET_PART_PLCK_NEG + PAGE_P_LOCK_NEG + OTHER_P_LOCK_NEG AS “#PLOCK”,
(PSET_PART_PLCK_NEG + PAGE_P_LOCK_NEG + OTHER_P_LOCK_NEG)/INTERVAL_ELAPSED as “#PLOCKS_PER_SEC”, (PSET_PART_PLCK_NEG + PAGE_P_LOCK_NEG + OTHER_P_LOCK_NEG)/(SUSPEND_IRLM_CONT+ SUSPEND_XES_CONT+ SUSPEND_FLSE_CONT+ SYNCH_XES_LOCK+ SYNCH_XES_UNLOCK + SYNCH_XES_CHANGE) AS “PLOCK_PCT”
FROM
DB2PM_STAT_GENERAL
WHERE
SUBSYSTEM_ID = ? AND BEGIN_REC_TSTAMP BETWEEN ? AND ?
WITH UR;

Group Bufferpool - Bottlenecks
• How to monitor Group Bufferpool bottlenecks such as: • Castout/Write Engines are unavailable
• Reads failed due to lack of storage
• Writes failed due to lack of storage
• Determine cross invalidation rates
• How to determine Castout/Read/Write failures SELECT
SUBSYSTEM_ID, MEMBER_NAME, BEGIN_REC_TSTAMP, END_REC_TSTAMP,
GBP_ID, CASTOUT_ENG_UNAVL, WRITE_ENG_UNAVAIL, READ_FAIL_NO_STOR,
WRITE_FAIL_NO_STOR
FROM
DB2PM_STAT_GBUFFER
WHERE
SUBSYSTEM_ID = ? AND (CASTOUT_ENG_UNAVL >0 OR WRITE_ENG_UNAVAIL >0 OR READ_FAIL_NO_STOR > 0 OR WRITE_FAIL_NO_STOR > 0)
WITH UR;

Group Bufferpool - Bottlenecks
• Monitoring Cross Invalidation Rates
• How to determine whether cross invalidation resulted in data being found in GBP?
SELECT
SUBSYSTEM_ID,
MEMBER_NAME,
BEGIN_REC_TSTAMP,
END_REC_TSTAMP,
GBP_ID,
SYNC_READ_XI_RET AS “#CROSS_INVALID_FND_IN_GBP”,
SYNC_READ_XI_NORET AS “#CROSS_INVALID_NFD_IN_GBP”,
SYNC_READ_XI_NORET/(SYNC_READ_XI_NORET+ SYNC_READ_XI_RET)
FROM
DB2PM_STAT_GBUFFER
WHERE
SUBSYSTEM_ID = ? AND BEGIN_REC_TSTAMP BETWEEN ? AND ?
WITH UR

Monitoring Exception scenarios (Queuing/Failures)
• Monitoring RID pool failures/ EDM pool failures
• How to:
• Identify timeframes when RID pool failures happened SELECT PRIMAUTH, INTERVAL_TSTAMP,PLANNAME FROM DB2PMSACCT_GENERAL WHERE RID_POOL_FAIL_MXLT >0 OR RID_POOL_FAIL_NOSG > 0 WITH UR
• Identify EDM pool failures SELECT GROUP_NAME, MEMBER_NAME,SUBSYSTEM_ID, INTERVAL_TSTAMP, BEGIN_REC_TSTAMP,END_REC_TSTAMP FROM DB2PM_STAT_GENERAL WHERE BEGIN_REC_TSTAMP BETWEEN ? AND ? AND FAIL_POOL_FULL > 0 WITH UR

Exception scenarios (Queuing/Failures)
• Monitoring Queued DBATs, Inactive Connections
• How to
• Identify timeframes when DBATs are queued SELECT GROUP_NAME, MEMBER_NAME,SUBSYSTEM_ID, BEGIN_REC_TSTAMP,END_REC_TSTAMP FROM DB2PM_STAT_GENERAL WHERE SUBSYSTEM_ID = ? AND BEGIN_REC_TSTAMP BETWEEN ? AND ? AND DBAT_QUEUED > 0 WITH UR
• Identify Inactive Connection trends SELECT GROUP_NAME, MEMBER_NAME,SUBSYSTEM_ID, BEGIN_REC_TSTAMP,END_REC_TSTAMP, INACT_DBATS_T2, CONV_DEALLOC FROM DB2PM_STAT_GENERAL WHERE SUBSYSTEM_ID = ? AND BEGIN_REC_TSTAMP BETWEEN ? AND ? WITH UR
• Identify timeframes when Create Threads are queued SELECT GROUP_NAME, MEMBER_NAME,SUBSYSTEM_ID, INTERVAL_TSTAMP, BEGIN_REC_TSTAMP,END_REC_TSTAMP FROM DB2PM_STAT_GENERAL WHERE BEGIN_REC_TSTAMP BETWEEN ? AND ? AND CRT_THREAD_QUEUED > 0 WITH UR

Monitoring ZPARMs • Monitoring ZPARMs …
• Provides a easy view of the ZPARM settings without having to tool through DB2 started task and ZPARM Assembly JCLs
• Not all ZPARMs are stored in PDB. Custom process needed to store all ZPARMs
• How to monitor ZPARMs? SELECT
IDBACK, IDFORE, DSMAX, CONDBAT, MAXDBAT ….
FROM
DB2PMSYSPAR_106
WHERE
SUBSYSTEM_ID = ?
ORDER BY TIMESTAMP
WITH UR;
SELECT
IDTHTOIN, DDF, CMSTAT, TCPVALVER …
FROM DB2PMSYSPAR_FACPAR
WHERE
SUBSYSTEM_ID = ?
ORDER BY TIMESTAMP
WITH UR;

Monitoring started tasks
• How to monitor CPU utilization of started tasks SELECT DATE(BEGIN_REC_TSTAMP), MEMBER_NAME,
SUM(SSAS_TCB_TIME) as "MSTR TCB“, SUM(SSAS_SRB_TIME) as "MSTR SRB",
SUM(DSAS_TCB_TIME) as "DBM1 TCB“, SUM(DSAS_SRB_TIME) as "DBM1 SRB",
SUM(IRLM_TCB_TIME) as "IRLM TCB“, SUM(IRLM_SRB_TIME) as "IRLM SRB",
SUM(DDF_TCB_TIME) as "DDF TCB“, SUM(DDF_SRB_TIME) as "DDF SRB“,
SUM(IRLM_PRE_IIP_SRB +SSAS_PRE_IIP_SRB +DSAS_PRE_IIP_SRB
+DDF_PRE_IIP_SRB ) as "zIIP“,
SUM(SSAS_TCB_TIME +SSAS_SRB_TIME + DSAS_TCB_TIME +DSAS_SRB_TIME +IRLM_TCB_TIME +IRLM_SRB_TIME +DDF_TCB_TIME +DDF_SRB_TIME) as "CP",
SUM(SSAS_TCB_TIME +SSAS_SRB_TIME + DSAS_TCB_TIME +DSAS_SRB_TIME
+IRLM_TCB_TIME+IRLM_SRB_TIME +DDF_TCB_TIME +DDF_SRB_TIME) +
SUM( IRLM_PRE_IIP_SRB +SSAS_PRE_IIP_SRB +DSAS_PRE_IIP_SRB
+DDF_PRE_IIP_SRB ) as "Total"
FROM
DB2PM_STAT_GENERAL
WHERE
BEGIN_REC_TSTAMP BETWEEN ? AND ?
GROUP BY
DATE(BEGIN_REC_TSTAMP), MEMBER_NAME
WITH UR

Monitoring Bufferpool residency times • Buffer Pool residency times …
• Monitor system, random, and sequential page residency time SELECT
(A.INTERVAL_ELAPSED*A.VIRTUAL_BUFFERS/ (A.SYNC_READ_IO+A.SEQ_PREFETCH_PAGE +A.LIST_PREFETCH_PAGE+A.DYN_PREFETCH_PAGE) ) AS SYS_RES_TIME
, (A.INTERVAL_ELAPSED *(B.VPOOL_SSEQ_THRESH*A.VIRTUAL_BUFFERS/100) /
(A.SEQ_PREFETCH_PAGE+A.LIST_PREFETCH_PAGE +A.DYN_PREFETCH_PAGE)
AS ASYNC_RES_TIME
,(A.INTERVAL_ELAPSED*A.VIRTUAL_BUFFERS/(A.SYNC_READ_IO+A.SEQ_PREFETCH_PAGE
+A.LIST_PREFETCH_PAGE+A.DYN_PREFETCH_PAGE) ) AS SYNC_RES_TIME
FROM DB2PM_STAT_BUFFER A
, DB2PMSYSPAR_202 B
WHERE B.MEMBER_NAME = A.MEMBER_NAME
AND B.SUBSYSTEM_ID = A.SUBSYSTEM_ID
AND B.GRPNAME = A.GROUP_NAME
AND B.LOCAL_LOCATION = A.LOCAL_LOCATION
AND A.GROUP_NAME = ?
AND A.BEGIN_REC_TSTAMP BETWEEN ? AND ?
AND B.TIMESTAMP = ?
AND A.BP_ID = ?
AND B.BUFFERPOOL_ID = ? WITH UR

Questions ?
44

Billy Sundarrajan Fifth Third Bank [email protected]
B07 Getting Insight from Billions of Rows in seconds - Supercharge your Performance Database with IDAA
Please fill out your session
evaluation before leaving!
Photo by Steve from Austin, TX, USA