Embed Size (px)
Citation preview
Final Report
Electric Cost-of-Service and Rate Design Study
New Ulm Public Utilities, MN
January 2012


B1830
Electric Cost-of-Service and Rate Design Study
New Ulm Public Utilities
Table of Contents
Letter of Transmittal Table of Contents List of Exhibits List of Tables
Section 1 Introduction
Section 2 Estimated Operating Results – Existing Rates Electric Division ................................................................................................ 2-1
Historical and Forecasted Electric Requirements .................................... 2-1 Estimated Revenue Requirements ........................................................... 2-3
Generation and Purchased Power Expenses ................................ 2-3 Operating and Maintenance Expenses ......................................... 2-4 Non-Operating Revenue and Expenses ....................................... 2-4 New Long Term Debt .................................................................. 2-4 Transfer to the City ...................................................................... 2-5 Capital Improvements .................................................................. 2-5 Debt Service ................................................................................. 2-5 Revenue Requirements ............................................................... 2-5
Estimated Electric Revenues – Existing Rates ........................................ 2-5 Estimated Electric Operating Results ..................................................... 2-6 Electric Cash Reserves ............................................................................ 2-7
Section 3 Cost-of-Service Study Introduction ....................................................................................................... 3-1 Test Year Adjustments ...................................................................................... 3-1 Classification of Costs ....................................................................................... 3-1 Allocation to Customer Classifications ............................................................. 3-2
Demand Allocations ................................................................................. 3-3 Energy Allocations ................................................................................... 3-3 Customer Allocations............................................................................... 3-3
Cost-of-Service Study Results ........................................................................... 3-4
Section 4 Unbundled Rates Electric Rate Components ................................................................................. 4-1
Wholesale Power ..................................................................................... 4-1 Transmission ............................................................................................ 4-1 Distribution .............................................................................................. 4-1 Customer .................................................................................................. 4-1
Unbundled Electric Rates .................................................................................. 4-2
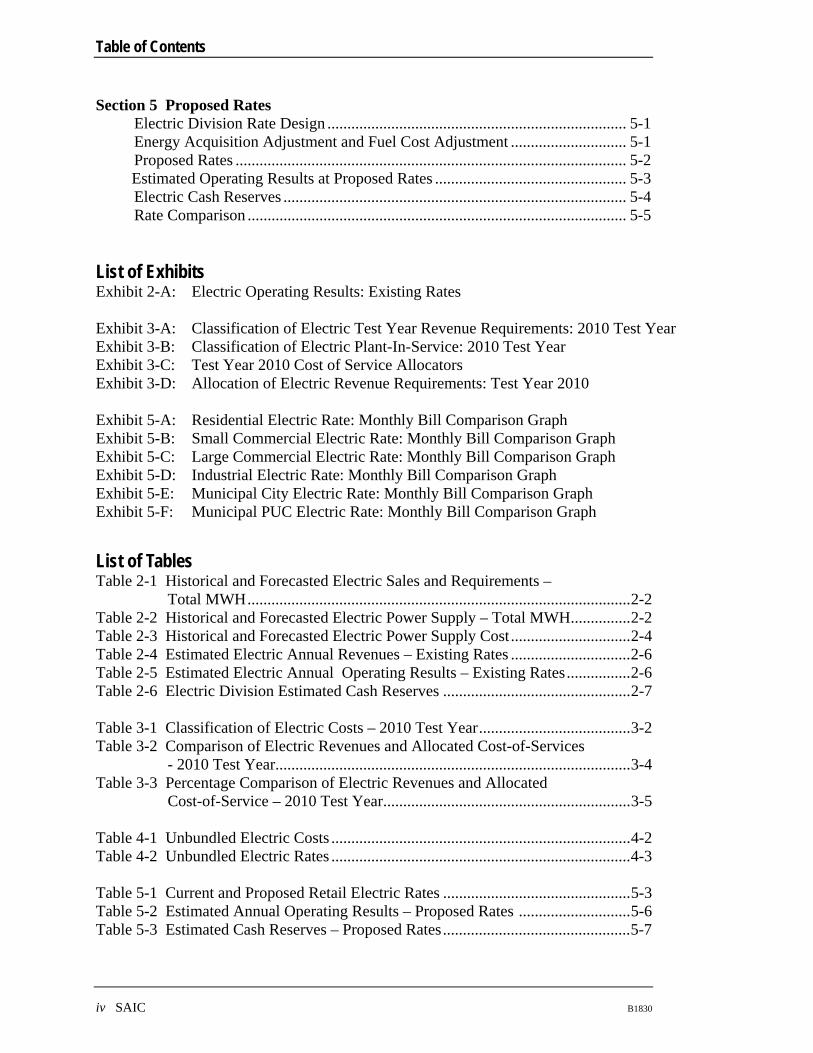
Table of Contents
iv SAIC B1830
Section 5 Proposed Rates Electric Division Rate Design ........................................................................... 5-1 Energy Acquisition Adjustment and Fuel Cost Adjustment ............................. 5-1 Proposed Rates .................................................................................................. 5-2
Estimated Operating Results at Proposed Rates ................................................ 5-3 Electric Cash Reserves ...................................................................................... 5-4 Rate Comparison ............................................................................................... 5-5
List of Exhibits Exhibit 2-A: Electric Operating Results: Existing Rates Exhibit 3-A: Classification of Electric Test Year Revenue Requirements: 2010 Test Year Exhibit 3-B: Classification of Electric Plant-In-Service: 2010 Test Year Exhibit 3-C: Test Year 2010 Cost of Service Allocators Exhibit 3-D: Allocation of Electric Revenue Requirements: Test Year 2010 Exhibit 5-A: Residential Electric Rate: Monthly Bill Comparison Graph Exhibit 5-B: Small Commercial Electric Rate: Monthly Bill Comparison Graph Exhibit 5-C: Large Commercial Electric Rate: Monthly Bill Comparison Graph Exhibit 5-D: Industrial Electric Rate: Monthly Bill Comparison Graph Exhibit 5-E: Municipal City Electric Rate: Monthly Bill Comparison Graph Exhibit 5-F: Municipal PUC Electric Rate: Monthly Bill Comparison Graph
List of Tables Table 2-1 Historical and Forecasted Electric Sales and Requirements – Total MWH ................................................................................................ 2-2 Table 2-2 Historical and Forecasted Electric Power Supply – Total MWH ............... 2-2 Table 2-3 Historical and Forecasted Electric Power Supply Cost .............................. 2-4 Table 2-4 Estimated Electric Annual Revenues – Existing Rates .............................. 2-6 Table 2-5 Estimated Electric Annual Operating Results – Existing Rates ................ 2-6 Table 2-6 Electric Division Estimated Cash Reserves ............................................... 2-7 Table 3-1 Classification of Electric Costs – 2010 Test Year ...................................... 3-2 Table 3-2 Comparison of Electric Revenues and Allocated Cost-of-Services - 2010 Test Year......................................................................................... 3-4 Table 3-3 Percentage Comparison of Electric Revenues and Allocated Cost-of-Service – 2010 Test Year .............................................................. 3-5 Table 4-1 Unbundled Electric Costs ........................................................................... 4-2 Table 4-2 Unbundled Electric Rates ........................................................................... 4-3 Table 5-1 Current and Proposed Retail Electric Rates ............................................... 5-3 Table 5-2 Estimated Annual Operating Results – Proposed Rates ............................ 5-6 Table 5-3 Estimated Cash Reserves – Proposed Rates ............................................... 5-7
Table of Contents
B1830 SAIC Energy, Environment & Infrastructure, LLC v
This report has been prepared for the use of the client for the specific purposes identified in the report. The conclusions, observations and recommendations contained herein attributed to SAIC constitute the opinions of SAIC. To the extent that statements, information and opinions provided by the client or others have been used in the preparation of this report, SAIC has relied upon the same to be accurate, and for which no assurances are intended and no representations or warranties are made. SAIC makes no certification and gives no assurances except as explicitly set forth in this report.
© 2012 SAIC All rights reserved.
3153101007-0101 | New Ulm Electric Cover Letter.docx
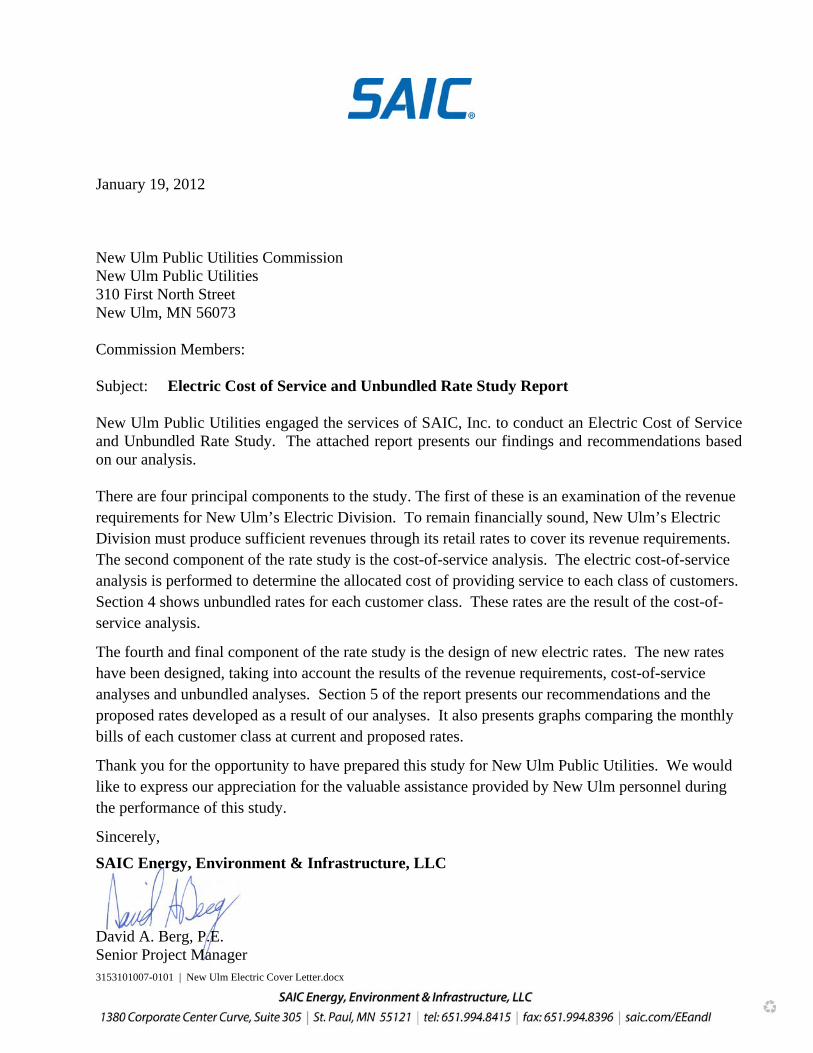
January 19, 2012 New Ulm Public Utilities Commission New Ulm Public Utilities 310 First North Street New Ulm, MN 56073 Commission Members: Subject: Electric Cost of Service and Unbundled Rate Study Report New Ulm Public Utilities engaged the services of SAIC, Inc. to conduct an Electric Cost of Service and Unbundled Rate Study. The attached report presents our findings and recommendations based on our analysis. There are four principal components to the study. The first of these is an examination of the revenue requirements for New Ulm’s Electric Division. To remain financially sound, New Ulm’s Electric Division must produce sufficient revenues through its retail rates to cover its revenue requirements. The second component of the rate study is the cost-of-service analysis. The electric cost-of-service analysis is performed to determine the allocated cost of providing service to each class of customers. Section 4 shows unbundled rates for each customer class. These rates are the result of the cost-of-service analysis.
The fourth and final component of the rate study is the design of new electric rates. The new rates have been designed, taking into account the results of the revenue requirements, cost-of-service analyses and unbundled analyses. Section 5 of the report presents our recommendations and the proposed rates developed as a result of our analyses. It also presents graphs comparing the monthly bills of each customer class at current and proposed rates.
Thank you for the opportunity to have prepared this study for New Ulm Public Utilities. We would like to express our appreciation for the valuable assistance provided by New Ulm personnel during the performance of this study.
Sincerely,
SAIC Energy, Environment & Infrastructure, LLC David A. Berg, P.E. Senior Project Manager

B1830
Section 1 INTRODUCTION
The City of New Ulm, Minnesota through New Ulm Public Utilities (New Ulm), owns, operates and maintains a municipal utility which provides retail electric service to its residents and businesses. New Ulm provides electric service to approximately 7,000 retail customers through its electric utility (Electric Division). Overall responsibility for the operations of the electric utility is charged to the Public Utilities Commission, which has the authority to review and set the rates for service charged by the Electric Division.
SAIC has performed a cost-of-service and rate design study for the Electric Division. The study includes an analysis of estimated revenue requirements for 2011-2015 (the "Study Period"), the preparation of detailed cost-of-service analyses based on a 2010 Test Year, a rate analysis and the development of proposed new electric rates for each customer classification. This report summarizes the analyses undertaken in our study of New Ulm’s retail electric rates and describes the results of our study and our recommendations. The cost-of-service analysis performed for each of New Ulm’s retail electric customer classifications was based on fully embedded costs. The rate design portion of the study includes recommendations on retail rates for each customer classification.

B1830
Section 2 ESTIMATED OPERATING RESULTS – EXISTING RATES
To remain financially sound, New Ulm’s electric rates must produce sufficient revenues to cover the cost of providing electric service and to permit the continued replacement and expansion of its facilities. These expenditures are commonly referred to as "revenue requirements" and consist of normal operating expenses, capital improvements and additions, contributions to the City and non-operating expenses.
Periodically, a utility must examine its current and forecasted revenues and expenses to verify that the total revenue, including interest earnings and miscellaneous income is sufficient to cover all revenue requirements. This part of the study compares projected income earned from revenues at existing rates to the expenses expected to be incurred in serving customers during the Study Period.
In order to determine the adequacy of the Electric Division’s existing electric rates, we have worked with the electric utility’s personnel to develop estimates of the annual revenues and revenue requirements for the Study Period. These estimates serve as the basis for determining the overall level of revenue recovery and provide a foundation for our cost-of-service analyses. The analyses and assumptions incorporated in our development of estimated revenues and revenue requirements are described below.
Electric Division
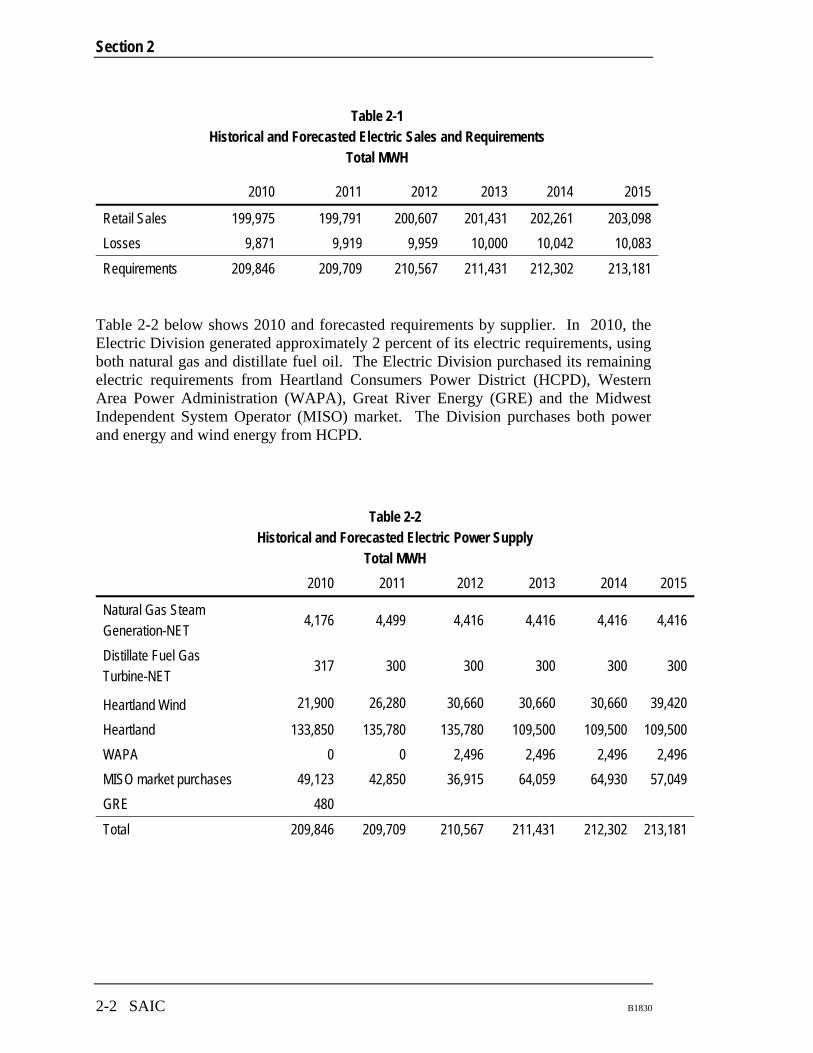
Historical and Forecasted Electric Requirements The Electric Division’s 2010 and forecasted electric sales and requirements for the Study Period are shown in Table 2-1 below. These requirements reflect sales to the Electric Division’s retail customers, the electric utility’s internal use and system losses. System losses are approximately 5 percent. Energy requirements are forecasted to increase by approximately 0.4 percent per year during the 5-year Study Period.
Section 2
2-2 SAIC B1830
Table 2-1 Historical and Forecasted Electric Sales and Requirements
Total MWH
2010 2011 2012 2013 2014 2015
Retail Sales 199,975 199,791 200,607 201,431 202,261 203,098
Losses 9,871 9,919 9,959 10,000 10,042 10,083
Requirements 209,846 209,709 210,567 211,431 212,302 213,181
Table 2-2 below shows 2010 and forecasted requirements by supplier. In 2010, the Electric Division generated approximately 2 percent of its electric requirements, using both natural gas and distillate fuel oil. The Electric Division purchased its remaining electric requirements from Heartland Consumers Power District (HCPD), Western Area Power Administration (WAPA), Great River Energy (GRE) and the Midwest Independent System Operator (MISO) market. The Division purchases both power and energy and wind energy from HCPD.
Table 2-2 Historical and Forecasted Electric Power Supply
Total MWH
2010 2011 2012 2013 2014 2015
Natural Gas Steam Generation-NET
4,176 4,499 4,416 4,416 4,416 4,416
Distillate Fuel Gas Turbine-NET
317 300 300 300 300 300
Heartland Wind 21,900 26,280 30,660 30,660 30,660 39,420
Heartland 133,850 135,780 135,780 109,500 109,500 109,500
WAPA 0 0 2,496 2,496 2,496 2,496
MISO market purchases 49,123 42,850 36,915 64,059 64,930 57,049
GRE 480
Total 209,846 209,709 210,567 211,431 212,302 213,181
ESTIMATED OPERATING RESULTS – EXISTING RATES
B1830 SAIC 2-3
Estimated Revenue Requirements A forecast of the Division’s electric utility expenses, called revenue requirements, has been prepared for the Study Period. These revenue requirements consist of generation and purchased power costs and operating and non-operating expenses.
Estimated revenues from the sale of electricity at current rates during the Study Period have been forecasted and compared to the revenue requirements. The estimates of the Study Period revenues and revenue requirements are contained as Exhibit 2-A at the end of this report.
Estimated revenue requirements for the Study Period were developed based on New Ulm’s annual financial report for 2010, the budget for 2011, and forecasted revenue requirements for the remainder of the Study Period, after discussion with New Ulm’s personnel. The assumptions used in these estimates are explained in detail below.
Generation and Purchased Power Expenses
Generation, purchased power and transmission expenses for 2010 were $13,984,258. The cost of natural gas and distillate fuel oil used by the Electric Division in its generation have been forecasted to increase by 2 percent per year during the Study Period.
MISO market costs were escalated at 5 percent per year. The cost escalation rate for HCPD ranged from 3 percent to 9 percent per year, based on discussions with Electric Division personnel. The WAPA and HCPD capacity credit were both escalated at 3 percent per year. Overall, generation and purchased power costs are forecasted to increase by an average of 5 percent per year during the Study Period.

Section 2
2-4 SAIC B1830
Table 2-3
Historical and Forecasted Electric Power Supply Cost
2010 2011 2012 2013 2014 2015
Fuel $1,523,762 $1,576,487 $1,593,084 $1,624,945 $1,657,444 $1,690,593
Purchased Power
11,052,173 11,338,323 12,189,385 12,732,580 13,530,838 13,977,407
Other Production
1,259,882 1,370,000 1,411,100 1,453,433 1,497,036 1,541,947
Transmission 148,441 150,600 155,118 159,772 164,565 169,502
Total Power Supply Cost
13,984,258 14,435,411 15,348,687 15,970,730 16,849,883 17,379,449
Power Reqmts (MWh)
209,846 209,709 210,567 211,431 212,302 213,181
Cost per MWh $66.64 $68.84 $72.89 $75.54 $79.37 $81.52
Percent Change
3% 6% 4% 5% 3%
Operating and Maintenance Expenses
Operating and maintenance expenses, other than for power supplies and transmission, are related to distribution facilities and services, administration & general expenses, which include customer account costs, depreciation and payments in lieu of taxes. Expenses for 2011 have been based on the Electric Division’s budgeted expenses and discussion with Division staff. For the years 2012 through 2015, expenses were escalated from 2011 estimated expenses by 3.0 percent per year, except for Depreciation. Depreciation expenses were based on the existing depreciation expenses plus typical depreciation schedules for planned capital improvements during the Study Period.
Non-Operating Revenue and Expenses
Revenues from non-utility operations are classified as non-operating revenue and include investment income, penalties, miscellaneous income and gain on sale of assets. Non-operating expenses include interest on existing long-term debt, interest on new long-term debt and bond discounts.
New Long Term Debt
The Electric Division has a planned $3,000,000 bond issuance to provide funds for boiler plant improvements and improvements to its north side and south side substations.
ESTIMATED OPERATING RESULTS – EXISTING RATES
B1830 SAIC 2-5
Transfers to the City
Transfers are provided to the City of New Ulm by the Electric Division. The Division pays 5 percent of its gross revenue to the City. Transfers in the year 2010 were $1,048,160. Transfers based on existing rates are expected to increase to $1,160,774 by 2015.
Capital Improvements
The capital improvements used in forecasting operating results are based on the Division’s Capital Improvements Plan, plus discussion with Division staff. Capital improvements during the Study Period will be financed through current operating revenues, as well as new long term debt, as described above.
Debt Service
The Division currently makes debt service payments on two bond series from 2007 and 2008. The annual principal and interest payments through 2014 on these two bonds are approximately $900,000. The 2008 bond issuance is scheduled to be paid off by the end of 2014. In 2015, the existing debt service payments will drop to $225,000 per year. The new debt to be issued is estimated to have annual principal and interest payments of approximately $289,000.
Revenue Requirements
Each category included in the calculation of revenue requirements has been described above. The revenue requirements indicate the amount of funds on an annual basis necessary to operate the system.
Estimated Electric Revenues - Existing Rates Estimated operating revenues have been developed by SAIC for the Study Period to compare to forecasted revenue requirements during the same period. Operating revenues include retail sales revenue from the six rate classes, street lights, the Steam Division and the Energy Acquisition Adjustment (EAA), plus miscellaneous other operating revenues.
High and low pressure steam is sold to the Steam Division for sale to individual industrial and non-industrial retail customers. Revenues have been approximately $331,000 per year through 2010, based on the cost of coal as the fuel for steam generation. The cost calculation method has been changed, due to the current use of natural gas as the fuel for steam generation. Consequently, the revenue from the Steam Division has been forecasted to increase to cover the cost of fuel as it is now calculated. The annual cost of fuel for steam for 2012 is estimated at $722,000.
EAA revenues are based on an annual flat rate per kWh sales. This rate represents the average cost of power purchases and fuel for generation, less the EAA base rate of $0.05849 per kWh. The EAA is then adjusted to include the 5 percent payment to the City in lieu of taxes. In 2010, the EAA rate for all customer classes was $0.00965 per kWh. In 2011, the EAA rate remained the same until it was increased to $0.01265 to

Section 2
2-6 SAIC B1830
apply to kWh sales in September through December. The EAA rate is expected to drop from its 2011 weighted average of $0.01064 per kWh to $0.00744 per kWh in 2012 and then continue to increase throughout the Study Period, with an estimated EAA rate of $0.01619 per kWh by 2015.
Table 2-4 Estimated Electric Annual Revenues
Existing Rates
Year 2011 2012 2013 2014 2015
Sales Revenues
$20,797,539 $20,638,945 $21,271,908 $22,175,453 $22,709,484
Other Oper Revenues 506,000 506,000 506,000 506,000 506,000
Total Operating Revenues
$21,303,539 $21,144,945 $21,777,908 $22,681,453 $23,215,484
Estimated Electric Operating Results Based on the estimates described above, we have prepared the following tables which summarize the Electric Division’s estimated annual operating results at existing rates for the Study Period. As shown below, net income based on the Electric Division’s existing rates will not be sufficient to cover basic operating expenses during the Study Period. Our summary of the Electric Division’s cash reserves is shown in Table 2-6. Our estimate of the Electric Division’s annual operating results is presented in detail in Exhibit 2-A at the end of this report.
Table 2-5 Estimated Electric Annual Operating Results
Existing Rates
Year 2011 2012 2013 2014 2015
Estimated Revenues $21,303,539 $21,144,945 $21,777,908 $22,681,453 $23,215,484
Estimated Revenue Requirements
20,577,273 21,759,923 22,592,026 23,671,158 24,402,097
Net Income 726,265 (614,978) (814,117) (989,704) (1,186,614)
Net Income as Percent of Revenues
3.4% (2.9%) (3.7%) (4.4%) (5.1%)

ESTIMATED OPERATING RESULTS – EXISTING RATES
B1830 SAIC 2-7
Electric Cash Reserves Cash reserves for the Electric Division are presented below.
Table 2-6 Electric Division Estimated Cash Reserves
Existing Rates
Year 2011 2012 2013 2014 2015
Beginning of Year Cash Reserves
$2,925,951 $3,275,216 $2,844,544 $1,224,966 ($1,346,966)
Plus Electric Net Income
726,265 (614,978) (814,117) (989,704) (1,186,614)
Plus Depreciation 1,348,000 1,398,833 1,491,517 1,536,050 1,606,550
Less Electric Capital Improvements from Revenue
(985,000) (320,500) (1,336,000) (2,115,000) (1,605,000)
Less Existing Bond Principal Payments
(740,000) (755,000) (815,000) (850,000) (200,000)
Less New Bond Principal Payments
0 (139,027) (145,978) (153,277) (160,941)
End of Year Cash Reserves
$3,275,216 $2,844,544 $1,224,966 ($1,346,966) ($2,892,971)
B1830
Section 3 COST-OF-SERVICE STUDY
Introduction In order to compare Electric Division revenues to revenue requirements by class, we have performed an analysis of the cost to serve each customer classification based on adjusted 2010 revenue requirements ("Test Year"). In the cost-of-service study, the functionalized costs of providing service are first classified by cost component and then allocated to each class of service based upon certain specific service characteristics. The results of the study indicate the degree to which existing rates recover revenues from each customer classification on a cost of service basis and are considered in designing new rates.
The cost-of-service analyses used in this study have been based on:
Test Year reported revenue requirements and revenues based on current rates,
Total system and customer classification power and energy requirements,
Actual and assumed customer service characteristics, and
Information obtained from customer accounts and records.
Test Year Adjustments Adjustments have been made to 2010 recorded wholesale power expenses and debt service costs to more accurately reflect costs during the Study Period. The cost of natural gas is expected to increase during the Study Period, as well as the net amount of generation. In addition, purchased power and transmission costs are expected to increase. New Ulm is planning a new bond issuance that will increase its debt service payments during the Study Period. All of these significant increases in operating expenses have been reflected in the adjustments to Test Year expenses.
Classification of Costs As a basis for allocating costs to individual customer classifications, we have first classified the Electric Division’s adjusted Test Year revenue requirements to four specific cost components. These components and the type of costs assigned to each are described below.
Demand Component - Those costs incurred to provide an electric system capable of meeting the total combined demands of customers. Demand costs include the portion of purchased power and generation, operating and maintenance expenses, capital expenditures and other costs which are generally fixed and do not vary materially with

Section 3
3-2 SAIC B1830
the amount of electricity consumed or which cannot be designated specifically as a customer or energy cost.
Energy Component - Those costs that vary substantially or directly with the amount of energy purchased or generated. Energy costs are those costs which could be expected to vary with electricity consumption.
Customer Service Component - Those costs directly related to the number and type of customers, such as customer service, customer accounting, billing and collection.
Customer Facilities Component - Those costs directly related to the number and size of customers, such as the costs of meters and services and other equipment needed to provide service.
Adjustments have been made to the Test Year revenue requirements to more accurately reflect costs during the Study Period. The cost of fuel for electric and steam generation has been increased, as well as the cost of purchased power and transmission.
The table below summarizes the adjusted Test Year revenue requirements of the Electric Division by cost classification. The classification of adjusted revenue requirements is shown in Exhibit 3-A at the end of this report. Exhibit 3-B details the classification of electric plant-in-service.
Table 3-1 Classification Of Electric Costs
2010 Test Year
Cost Component
Revenue Requirements
Demand $10,138,526
Energy 10,752,136
Customer Service 315,147
Customer Facilities
Total
935,813
$22,141,623
Allocation To Customer Classifications Based upon actual and assumed customer service characteristics, we have developed various factors for use in allocating the Electric Division’s adjusted Test Year revenue requirements to individual customer classifications. These allocation factors reflect accepted ratemaking principles and are based upon fully-distributed, embedded cost allocation procedures. The following summary describes the specific allocation factors used in our cost-of-service analysis. Exhibit 3-C at the end of this report shows the development of each of these factors.
COST-OF-SERVICE STUDY
B1830 SAIC 3-3
Demand Allocations Coincident peak demands by customer class reflect the maximum monthly and annual demands on the system. We have estimated class monthly peak demands coincident with the system monthly peaks for Test Year 2010. Non-coincident peak demands reflect the peak demand of customer classes whenever that may occur; it does not have to coincide with the overall system peak. Coincident and non-coincident demand is typically calculated considering one, four or 12-month time periods.
Class demand allocators are based on the metered demand during the system monthly peaks for the classes with demand data – Large Commercial and Industrial. Class demand allocators were estimated for the non-demand metered classes, Residential, Small Commercial, Municipal–City and Municipal-PUC, based on the results of load research studies for other utilities and the experience of other utilities relative to the load characteristics of individual classes of service.
For customer class allocation purposes, the annual coincident peak (1 CP), summer peak (Summer 4 CP), 12-month coincident peak (12 CP), and 12-month non-coincident peak (12 NCP) were used to allocate the Electric Division’s fixed production, transmission and distribution costs. The method used to allocate the costs depended on the utility function and specific demand cost items.
The Summer 4 CP method was used to allocate production related costs to the customer classes, while the 12 CP method was used to allocate purchased power and production plant depreciation. The 1 CP method was used to allocate all transmission related costs and transmission plant depreciation to the customer classes in proportion to their respective contributions to the utility’s annual system peak demand. The 12 NCP method was used to allocate distribution related costs and distribution plant depreciation to the customer classes. This method was used because distribution facilities are typically sized to meet the customers’ localized demands.
Energy Allocations The costs related to the energy component of purchased power have been allocated on the basis of each customer classification's annual energy requirements for the Test Year at the inlet to the Division’s electrical system.
Customer Allocations Customer Service related costs have been allocated among the customer classifications based on the Customer Service allocation factor. This factor allocates customer related costs such as customer billing, customer service and meter reading in proportion to each classification’s weighted number of customers. Such weighting factors are developed to represent the difference in service configurations between customer classifications.
Customer Facilities related costs have been allocated among the customer classifications based on the Customer Facilities allocation factor. This factor allocates customer facilities related costs in proportion to each classification’s weighted number
Section 3
3-4 SAIC B1830
of customers. The weighting factor represents the difference in the cost of equipment used by different classifications, as well as each class’ proportional use of the system facilities. These two weighting factors were developed based on the experience of other utilities, as well as analysis of the Electric Division’s customer data.
Exhibit 3-C shows the development of these allocation factors in detail.
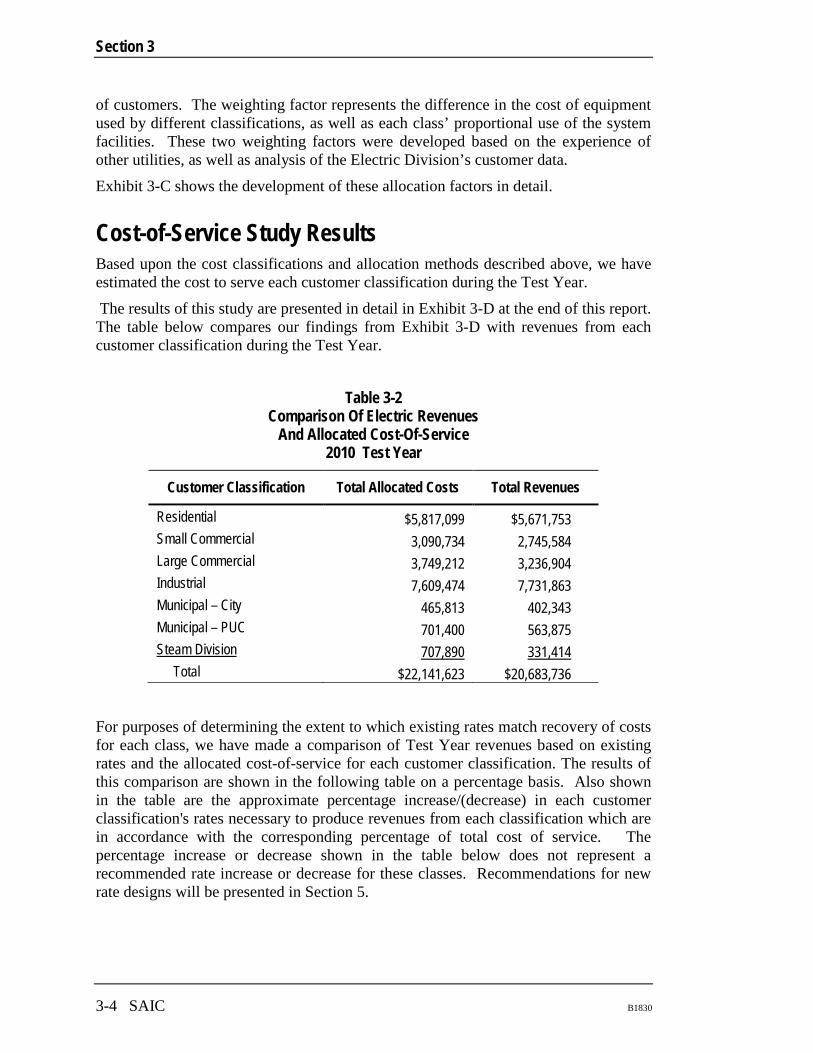
Cost-of-Service Study Results Based upon the cost classifications and allocation methods described above, we have estimated the cost to serve each customer classification during the Test Year.
The results of this study are presented in detail in Exhibit 3-D at the end of this report. The table below compares our findings from Exhibit 3-D with revenues from each customer classification during the Test Year.
Table 3-2 Comparison Of Electric Revenues
And Allocated Cost-Of-Service 2010 Test Year
Customer Classification Total Allocated Costs Total Revenues
Residential $5,817,099 $5,671,753 Small Commercial 3,090,734 2,745,584 Large Commercial 3,749,212 3,236,904 Industrial 7,609,474 7,731,863 Municipal – City 465,813 402,343 Municipal – PUC 701,400 563,875 Steam Division 707,890 Total
331,414
$22,141,623 $20,683,736
For purposes of determining the extent to which existing rates match recovery of costs for each class, we have made a comparison of Test Year revenues based on existing rates and the allocated cost-of-service for each customer classification. The results of this comparison are shown in the following table on a percentage basis. Also shown in the table are the approximate percentage increase/(decrease) in each customer classification's rates necessary to produce revenues from each classification which are in accordance with the corresponding percentage of total cost of service. The percentage increase or decrease shown in the table below does not represent a recommended rate increase or decrease for these classes. Recommendations for new rate designs will be presented in Section 5.

COST-OF-SERVICE STUDY
B1830 SAIC 3-5
Table 3-3 Percentage Comparison Of Electric Revenues
And Allocated Cost-Of-Service 2010 Test Year
Customer Classification Percentage Allocated Costs
Percentage Revenues
Increase/ (Decrease) (1)
Residential 26.3% 27.4% (4.2%) Small Commercial 14.0% 13.3% 5.2% Large Commercial 16.9% 15.6% 8.2% Industrial 34.4% 37.4% (8.1%) Municipal – City 2.1% 1.9% 8.2% Municipal – PUC 3.2% 2.7% 16.2% Steam Division 3.2% 1.6% Total
100% 100% 100% 0%
(1) Adjustment represents Test Year data used for cost of service analysis and does not represent a proposed rate increase or decrease.
As indicated by the above comparison, the Electric Division’s existing electric rates are not in line with the cost to serve each customer class. Cost based rates are one of several goals in establishing rates. The relationship between allocated costs and revenues for each class should be considered, in addition to other rate related goals, in developing recommended rates.
B1830
Section 4 UNBUNDLED RATES
Based on the results of the cost of service study presented in Section 3 of this report, electric unbundled rates have been developed. The unbundled electric rates have been designed to collect the same total revenue as the Electric Division’s test year revenue requirements, including EAA revenues.
Electric Rate Components The Division’s electric rates have been unbundled into four components: wholesale power, transmission, distribution and customer. Each of these components is described below.
Wholesale Power The wholesale power component consists of power generation, fuel and purchased power charges. For retail classes billed on the basis of demand and energy, the retail demand portion of the wholesale power component represents wholesale demand charges and the energy portion represents wholesale energy charges. For retail classes billed on the basis of energy only, the retail energy charge represents the combined total of wholesale demand and energy charges.
Transmission The transmission component represents the transmission costs associated with the Division’s wholesale power supply. The transmission charge is a demand related charge. This is shown as a retail demand charge for retail demand and energy billed classes and as an energy charge for energy-only retail classes.
Distribution The majority of the Electric Division’s local electric revenue requirements are reflected in the distribution portion of the unbundled retail rates. It includes a portion of the O&M expenses on the distribution system, a good portion of the depreciation expenses, certain A&G and non-operating expenses, and a credit for non-operating income. The distribution charge is a demand related charge. This is shown as a retail demand charge for retail demand and energy billed classes and as an energy charge for energy- only retail classes.
Customer The customer charge reflects both customer service and customer facilities expenses, including customer accounting and collecting charges, certain A&G expenses, O&M

Section 4
4-2 SAIC B1830
and depreciation on the customer portion of the system, and a credit for non-operating income. The customer charge is a monthly per customer charge.
Unbundled Electric Rates Unbundled electric costs and resulting retail rates for the Residential, Small Commercial, Large Commercial, Industrial, Municipal City and Municipal PUC classes are shown in the tables below. Existing rates are also shown, for comparison. The individual unbundled components have been summed to show a total unbundled rate. Note that the following rates are not necessarily the proposed rates recommended by SAIC as a result of this study. The following unbundled rates:
Generate the same revenues as the adjusted Test Year 2010 revenue requirements, including the revenues collected from the EAA.
Reflect the results of the cost-of-service analysis. The cost to serve each customer class is different. The cost depends on the combination of demand needs, the timing and amount energy use compared to demand and the cost of customer facilities and services.
Reflect the results of the unbundling of electric utility services.
Table 4-1 Unbundled Electric Costs
Rate Class
Unbund Cost Rate Res
Small Coml
Large Coml Indus Muni City
Muni PUC Steam Total
Wholesle Power
Dmd $1,401,108 $770,125 $936,888 $1,551,232 $123,271 $187,192 $4,969,817
Energy 2,053,396 1,144,463 1,492,422 3,612,202 173,551 258,807 707,890 9,442,731
Trans Dmd 585,873 291,751 334,030 497,802 37,232 56,312 1,803,000
Dist Dmd 988,696 531,893 622,282 1,011,139 84,002 127,700 3,365,710
Cust 307,816 171,562 223,723 541,491 26,016 38,797 1,309,405
Cust Cust 480,210 180,941 139,868 395,608 21,742 32,592 1,250,960
Total $5,817,099 $3,090,734 $3,749,212 $7,609,474 $465,813 $701,400 $707,890 $22,141,623
The Steam rate has not been included in the unbundled rates below, as its rate is based on a per thousand pounds of steam (Mlbs).

UNBUNDLED RATES
B1830 SAIC 4-3
Table 4-2 Unbundled Electric Rates
Rate Class
Unbundled Rate
Rate Component Res
Small Coml
Large Coml Indus Muni City Muni PUC
Wholesale Power
Demand ($/kW)
$9.00 $9.53
Energy ($/kWh)
0.07437 0.07395 0.04420 0.04420 0.07560 0.07618
Transmission
Demand ($/kW
3.21 3.06
Energy ($/kWh)
0.01261 0.01127 0.00948 0.00962
Distribution
Demand ($/kW)
5.98 6.21
Energy ($/kWh) 0.02791 0.02717 0.00663 0.00663 0.02802 0.02844
Customer Customer ($/mo)
6.72 17.04 195.62 3,663.04 27.84 60.24
Total Unbundled Rate
Customer ($/mo)
$6.72 $17.04 $195.62 $3,663.04 $27.84 $60.24
Demand ($/kW)
18.19 18.80
Energy ($/kWh)
0.11489 0.11239 0.05083 0.05083 0.11311 0.11423
Existing Rate
Customer ($/mo)
$9.00 $16.00 $20.00 $22.00 $14.00 $17.00
Demand ($/kW)
10.43
Energy ($/kWh)
0.0995 0.0895 0.0858 0.0638 0.0918 0.0898
EAA applicable to all classes for 2010 is $0.00965 per kWh.

B1830
Section 5 PROPOSED RATES
Retail rate adjustments are generally made in response to revenue requirements and cost-of–service. In Section 2 of this report, the Electric Division’s estimated annual operating results for the Study Period were presented. The operating results were developed utilizing the Electric Division’s existing rates. Section 3 of this report summarizes the results of the cost of service analysis. Section 4 presents an analysis of unbundled rates. All of these factors have been considered in the development of the proposed electric rates included in this section of the report.
Electric Division Rate Design Forecasted revenues at current rates are not sufficient to adequately cover forecasted revenue requirements during the Study Period. The cost-of-service analysis has shown that current rates do not accurately reflect the class revenue requirements, nor do the current rates reflect unbundled costs.
The proposed rates are forecasted to increase electric sales revenues by 9 percent and are expected to generate sufficient revenue to cover forecasted revenue requirements during the Study Period. The proposed rates also more closely reflect costs in all the rate classes. Proposed rates for all classes have been increased in two phases, in order to collect additional needed revenue for the Division, while introducing the rate increases gradually. Phase 1 proposed rates are recommended to be implemented in March 2012. Phase 2 proposed rates are recommended to be implemented in September 2012. Forecasted revenues at proposed rates reflect these implementation dates.
The rates for the Industrial class have been increased by a lower percentage than the rates of the non-Industrial classes, to reflect the results of the cost of service analysis. The Large Commercial class was given the highest percentage increase in the proposed rates, also due to the cost of service analysis results. The Large Commercial class is currently being billed on an energy-only rate. The Electric Division has been collecting demand data on the customers in this class and the proposed rates include a demand rate component based on the billing demand data that has been collected.
Proposed rates for steam sales to the Steam Department are recommended to be based on the forecasted cost of steam generation, as discussed later in this report section.
Energy Acquisition Adjustment and Fuel Cost Adjustment The Electric Division currently uses an annual Energy Acquisition Adjustment (EAA) to adjust for differences between its actual fuel and purchased power costs and the cost included in the customer rate schedules. Each month this amount is applied to customers’ bills.

Section 5
5-2 SAIC B1830
SAIC has followed the same methodology as the Electric Division in calculating the EAA rate for the Study Period. However, we have included in the EAA only the cost of fuel used for generation for the Electric Division. We recommend that no change be made in the base energy rate for the EAA, which is currently $0.05849 per kWh. We also recommend that the EAA rate continue to be calculated as in the past, except that only the cost of fuel used for generation for the Electric Division be included in the determination of the EAA.
We recommend that the Steam Division be responsible for fluctuations in the cost of fuel used to generate steam for the Steam Division. Consequently, we recommend that the fuel cost adjustment (FCA) that has been employed in the past be reinstated for use in adjusting the monthly bills for the Steam Division.
Proposed Rates 1. Residential: The customer charge remains the same. The Phase 1 energy rate was
increased so that Phase 1 revenues would be increased by 4.75 percent over revenues at existing rates. Phase 2 energy rates were also increased to gain an additional overall revenue increase of 4.75 percent. Consequently, all customers will see an increase in their monthly bills.
2. Small Commercial: The customer charge remains the same. The Phase 1 energy rate was increased so that Phase 1 revenues would be increased by 4.75 percent over revenues at existing rates. Phase 2 energy rates were also increased to gain an additional overall revenue increase of 4.75 percent. Consequently, all customers will see an increase in their monthly bills.
3. Large Commercial: The customer charge was increased in Phase 1 and a demand rate of $4.00 per kW-month was introduced. The energy rate was reduced to gain an overall revenue increase of 8.1 percent in Phase 1. In Phase 2, the demand rate was increased to $8.00 per kW-month and the energy rate was further reduced to gain an overall revenue increase of an additional 8.1 percent in Phase 2. Consequently, all customers will see an increase in their monthly bills. However, the level of increase will vary significantly based on the individual customer’s monthly load factor. It is recommended that any rate changes subsequent to Phase 2 rates should continue to move in the direction of the demand and energy rates of the Industrial class.
4. Industrial: The customer charge and the demand rate were increased, to gain an overall revenue increase of 2.4 percent in Phase 1. In Phase 2, the demand and energy rates were both increased, to gain an additional overall revenue increase of 2.4 percent. All customers will see an increase in their monthly bills.
5. Municipal - City: The customer charge remains the same. The Phase 1 energy rate was increased so that Phase 1 revenues would be increased by 4.75 percent over revenues at existing rates. Phase 2 energy rates were also increased to gain an additional overall revenue increase of 4.75 percent. Consequently, all customers will see an increase in their monthly bills.
PROPOSED RATES
B1830 SAIC 5-3
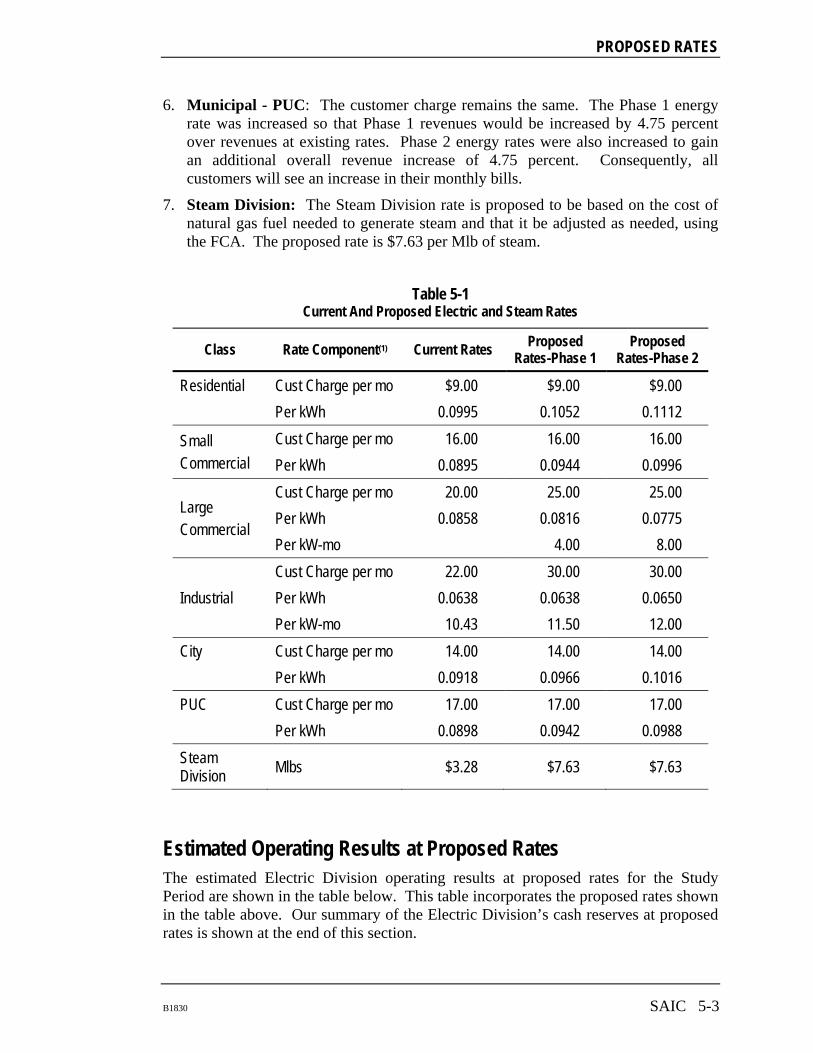
6. Municipal - PUC: The customer charge remains the same. The Phase 1 energy rate was increased so that Phase 1 revenues would be increased by 4.75 percent over revenues at existing rates. Phase 2 energy rates were also increased to gain an additional overall revenue increase of 4.75 percent. Consequently, all customers will see an increase in their monthly bills.
7. Steam Division: The Steam Division rate is proposed to be based on the cost of natural gas fuel needed to generate steam and that it be adjusted as needed, using the FCA. The proposed rate is $7.63 per Mlb of steam.
Table 5-1 Current And Proposed Electric and Steam Rates
Class Rate Component(1) Current Rates Proposed
Rates-Phase 1 Proposed
Rates-Phase 2
Residential Cust Charge per mo $9.00 $9.00 $9.00
Per kWh 0.0995 0.1052 0.1112
Small Commercial
Cust Charge per mo 16.00 16.00 16.00
Per kWh 0.0895 0.0944 0.0996
Large Commercial
Cust Charge per mo 20.00 25.00 25.00
Per kWh 0.0858 0.0816 0.0775
Per kW-mo 4.00 8.00
Industrial
Cust Charge per mo 22.00 30.00 30.00
Per kWh 0.0638 0.0638 0.0650
Per kW-mo 10.43 11.50 12.00
City Cust Charge per mo 14.00 14.00 14.00
Per kWh 0.0918 0.0966 0.1016
PUC Cust Charge per mo 17.00 17.00 17.00
Per kWh 0.0898 0.0942 0.0988
Steam Division Mlbs $3.28 $7.63 $7.63
Estimated Operating Results at Proposed Rates The estimated Electric Division operating results at proposed rates for the Study Period are shown in the table below. This table incorporates the proposed rates shown in the table above. Our summary of the Electric Division’s cash reserves at proposed rates is shown at the end of this section.

Section 5
5-4 SAIC B1830
Table 5-2 Estimated Annual Operating Results
Proposed Rates
Year 2011 2012 2013 2014 2015
Estimated Revenues
$21,303,539 $22,207,362 $23,615,353 $24,527,486 $25,070,182
Estimated Revenue Requirements
20,577,274 21,813,044 22,663,712 23,707,958 24,430,086
Net Income $726,265 $394,318 $951,641 $819,528 $640,096
Net Income as Percent of Revenues
3.4% 1.8% 4.0% 3.3% 2.6%
Electric Cash Reserves Estimated cash reserves for the Electric Division are presented in the table below.
Table 5-3 Estimated Cash Reserves
Proposed Rates
Year 2011 2012 2013 2014 2015
Beginning of Year Cash Reserves $2,925,951 $3,275,216 $3,853,840 $4,000,020 $3,237,321
Plus Net Income 726,265 394,318 951,641 819,528 640,096
Plus Depreciation 1,348,000 1,398,833 1,491,517 1,536,050 1,606,550
Less Capital Imprv from Rev (985,000) (320,500) (1,336,000) (2,115,000) (1,605,000)
Less Existing Bond Principal (740,000) (755,000) (815,000) (850,000) (200,000)
Less New Bond Principal 0 (139,027) (145,978) (153,277) (160,941)
End of Year Cash Reserves $3,275,216 $3,853,840 $4,000,020 $3,237,321 $3,518,026
PROPOSED RATES
B1830 SAIC 5-5
Rate Comparisons Exhibits 5-A through 5-F show graphically the monthly electric bills under current and proposed rates:
Graphs are shown for the Residential, Small Commercial, Large Commercial, Industrial, Municipal-City and Municipal-PUC customer classes, based on a range of monthly consumption for each class.
Exhibit 5-A graph shows the average monthly electric bill for Residential customers under current and proposed rates. All Phase 1 bills will be higher than existing bills. All Phase 2 bills will be higher than Phase 1 bills.
Exhibit 5-B graph shows the average monthly electric bill for Small Commercial customers under current and proposed rates. All Phase 1 bills will be higher than existing bills. All Phase 2 bills will be higher than Phase 1 bills.
Exhibit 5-C graph shows the average monthly electric bill for Large Commercial customers under current and proposed rates. As this class is moving to a demand based rate, the graph shows the bill comparison for a customer at 150 kW with a range of load factors. Under Phase 1 rates, customers with lower than 30 percent load factor will see a bill increase ranging from 10 percent to 45 percent, while customers with a 70 percent or higher load factor will see no increase or even a bill decrease. Phase 2 rates will continue the trend of higher load factors yielding lower bill increases, although all customers will receive a bill increase.
Exhibit 5-D graph shows the average monthly electric bill for Industrial customers under current and proposed rates, assuming a customer at 1500 kW with a range of load factors. Under Phase 1 rates, customers with higher than 45 percent load factor will see a bill decrease. Customers with lower than 45 percent load factors will see a bill increase. Phase 2 rates will yield a bill increase for all customers, although the higher load factor customers will receive the lower bill increases.
Exhibit 5-E graph shows the average monthly electric bill for Municipal-City customers under current and proposed rates. All Phase 1 bills will be higher than existing bills. All Phase 2 bills will be higher than Phase 1 bills.
Exhibit 5-F graph shows the average monthly electric bill for Municipal-PUC customers under current and proposed rates. All Phase 1 bills will be higher than existing bills. All Phase 2 bills will be higher than Phase 1 bills.
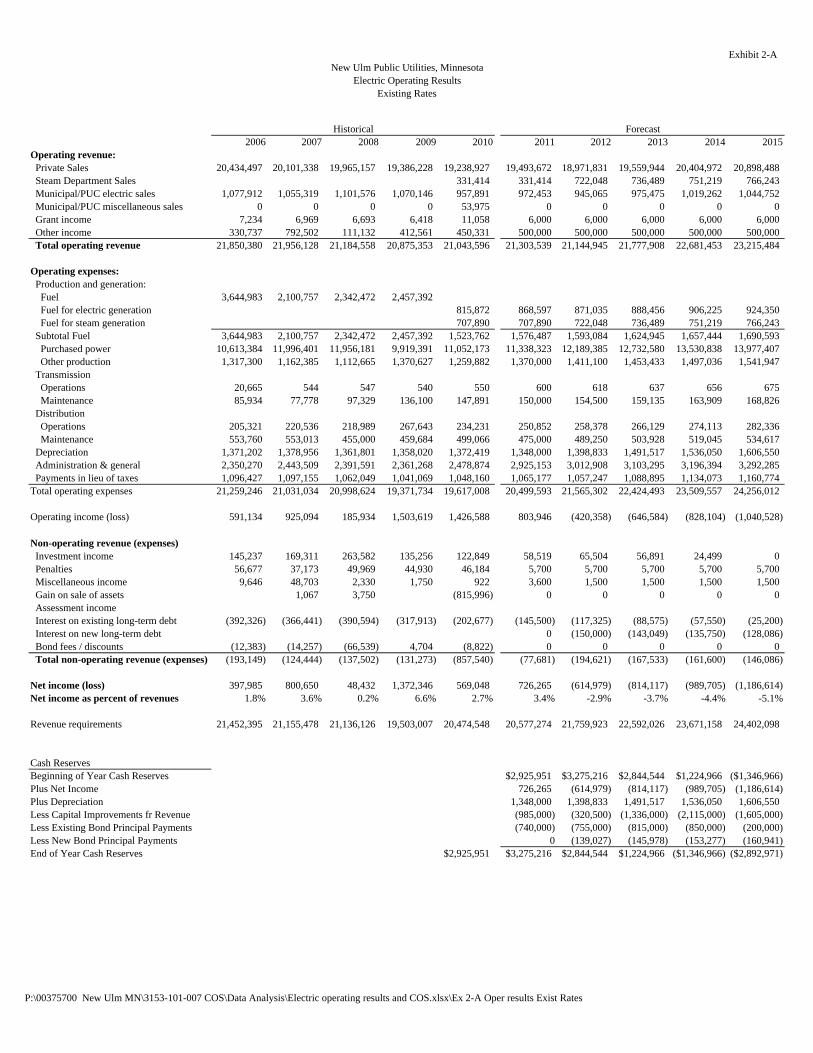
Exhibit 2-A
2006 2007 2008 2009 2010 2011 2012 2013 2014 2015Operating revenue: Private Sales 20,434,497 20,101,338 19,965,157 19,386,228 19,238,927 19,493,672 18,971,831 19,559,944 20,404,972 20,898,488 Steam Department Sales 331,414 331,414 722,048 736,489 751,219 766,243 Municipal/PUC electric sales 1,077,912 1,055,319 1,101,576 1,070,146 957,891 972,453 945,065 975,475 1,019,262 1,044,752 Municipal/PUC miscellaneous sales 0 0 0 0 53,975 0 0 0 0 0 Grant income 7,234 6,969 6,693 6,418 11,058 6,000 6,000 6,000 6,000 6,000 Other income 330,737 792,502 111,132 412,561 450,331 500,000 500,000 500,000 500,000 500,000 Total operating revenue 21,850,380 21,956,128 21,184,558 20,875,353 21,043,596 21,303,539 21,144,945 21,777,908 22,681,453 23,215,484
Operating expenses: Production and generation: Fuel 3,644,983 2,100,757 2,342,472 2,457,392 Fuel for electric generation 815,872 868,597 871,035 888,456 906,225 924,350 Fuel for steam generation 707,890 707,890 722,048 736,489 751,219 766,243 Subtotal Fuel 3,644,983 2,100,757 2,342,472 2,457,392 1,523,762 1,576,487 1,593,084 1,624,945 1,657,444 1,690,593 Purchased power 10,613,384 11,996,401 11,956,181 9,919,391 11,052,173 11,338,323 12,189,385 12,732,580 13,530,838 13,977,407 Other production 1,317,300 1,162,385 1,112,665 1,370,627 1,259,882 1,370,000 1,411,100 1,453,433 1,497,036 1,541,947 Transmission Operations 20,665 544 547 540 550 600 618 637 656 675 Maintenance 85,934 77,778 97,329 136,100 147,891 150,000 154,500 159,135 163,909 168,826 Distribution Operations 205,321 220,536 218,989 267,643 234,231 250,852 258,378 266,129 274,113 282,336 Maintenance 553,760 553,013 455,000 459,684 499,066 475,000 489,250 503,928 519,045 534,617 Depreciation 1,371,202 1,378,956 1,361,801 1,358,020 1,372,419 1,348,000 1,398,833 1,491,517 1,536,050 1,606,550 Administration & general 2,350,270 2,443,509 2,391,591 2,361,268 2,478,874 2,925,153 3,012,908 3,103,295 3,196,394 3,292,285 Payments in lieu of taxes 1,096,427 1,097,155 1,062,049 1,041,069 1,048,160 1,065,177 1,057,247 1,088,895 1,134,073 1,160,774Total operating expenses 21,259,246 21,031,034 20,998,624 19,371,734 19,617,008 20,499,593 21,565,302 22,424,493 23,509,557 24,256,012
Operating income (loss) 591,134 925,094 185,934 1,503,619 1,426,588 803,946 (420,358) (646,584) (828,104) (1,040,528)
Non-operating revenue (expenses) Investment income 145,237 169,311 263,582 135,256 122,849 58,519 65,504 56,891 24,499 0 Penalties 56,677 37,173 49,969 44,930 46,184 5,700 5,700 5,700 5,700 5,700 Miscellaneous income 9,646 48,703 2,330 1,750 922 3,600 1,500 1,500 1,500 1,500 Gain on sale of assets 1,067 3,750 (815,996) 0 0 0 0 0 Assessment income Interest on existing long-term debt (392,326) (366,441) (390,594) (317,913) (202,677) (145,500) (117,325) (88,575) (57,550) (25,200) Interest on new long-term debt 0 (150,000) (143,049) (135,750) (128,086) Bond fees / discounts (12,383) (14,257) (66,539) 4,704 (8,822) 0 0 0 0 0 Total non-operating revenue (expenses) (193,149) (124,444) (137,502) (131,273) (857,540) (77,681) (194,621) (167,533) (161,600) (146,086)
Net income (loss) 397,985 800,650 48,432 1,372,346 569,048 726,265 (614,979) (814,117) (989,705) (1,186,614)Net income as percent of revenues 1.8% 3.6% 0.2% 6.6% 2.7% 3.4% -2.9% -3.7% -4.4% -5.1%
Revenue requirements 21,452,395 21,155,478 21,136,126 19,503,007 20,474,548 20,577,274 21,759,923 22,592,026 23,671,158 24,402,098
Cash ReservesBeginning of Year Cash Reserves $2,925,951 $3,275,216 $2,844,544 $1,224,966 ($1,346,966)Plus Net Income 726,265 (614,979) (814,117) (989,705) (1,186,614)Plus Depreciation 1,348,000 1,398,833 1,491,517 1,536,050 1,606,550Less Capital Improvements fr Revenue (985,000) (320,500) (1,336,000) (2,115,000) (1,605,000)Less Existing Bond Principal Payments (740,000) (755,000) (815,000) (850,000) (200,000)Less New Bond Principal Payments 0 (139,027) (145,978) (153,277) (160,941)End of Year Cash Reserves $2,925,951 $3,275,216 $2,844,544 $1,224,966 ($1,346,966) ($2,892,971)
Historical Forecast
New Ulm Public Utilities, MinnesotaElectric Operating Results
Existing Rates
P:\00375700 New Ulm MN\3153-101-007 COS\Data Analysis\Electric operating results and COS.xlsx\Ex 2-A Oper results Exist Rates
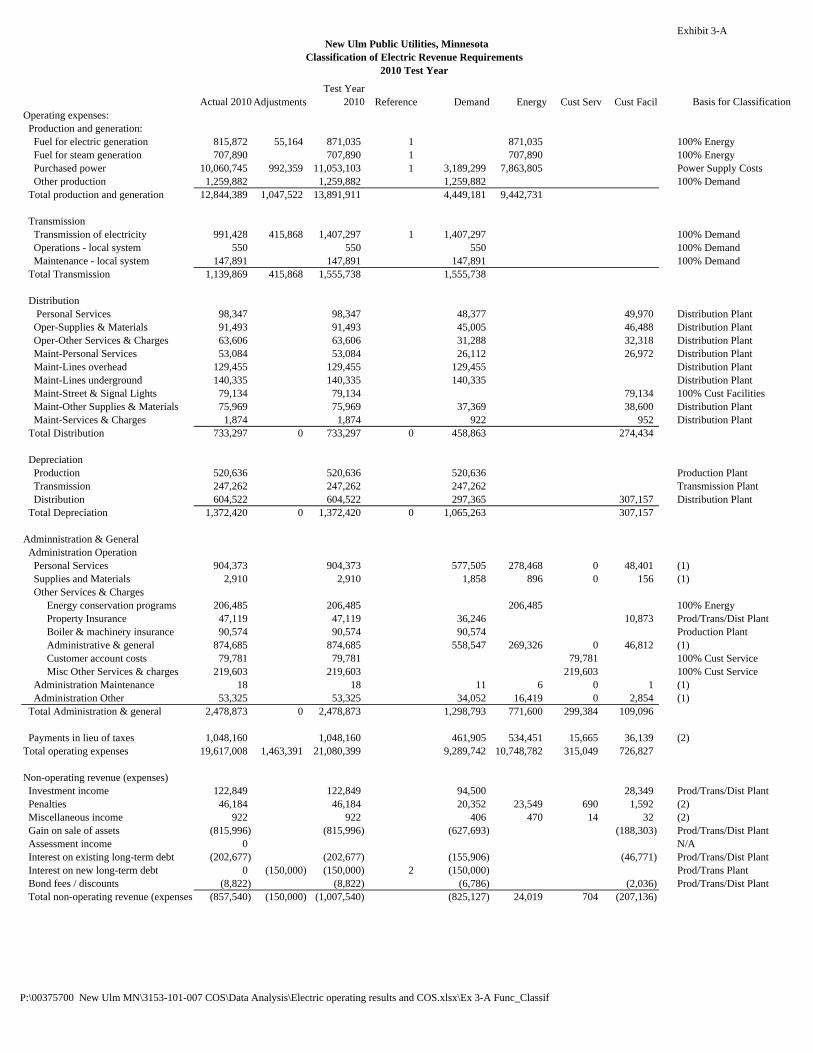
Exhibit 3-A
Actual 2010 AdjustmentsTest Year
2010 Reference Demand Energy Cust Serv Cust Facil Basis for ClassificationOperating expenses: Production and generation: Fuel for electric generation 815,872 55,164 871,035 1 871,035 100% Energy Fuel for steam generation 707,890 707,890 1 707,890 100% Energy Purchased power 10,060,745 992,359 11,053,103 1 3,189,299 7,863,805 Power Supply Costs Other production 1,259,882 1,259,882 1,259,882 100% Demand Total production and generation 12,844,389 1,047,522 13,891,911 4,449,181 9,442,731
Transmission Transmission of electricity 991,428 415,868 1,407,297 1 1,407,297 100% Demand Operations - local system 550 550 550 100% Demand Maintenance - local system 147,891 147,891 147,891 100% Demand Total Transmission 1,139,869 415,868 1,555,738 1,555,738
Distribution Personal Services 98,347 98,347 48,377 49,970 Distribution Plant Oper-Supplies & Materials 91,493 91,493 45,005 46,488 Distribution Plant Oper-Other Services & Charges 63,606 63,606 31,288 32,318 Distribution Plant Maint-Personal Services 53,084 53,084 26,112 26,972 Distribution Plant Maint-Lines overhead 129,455 129,455 129,455 Distribution Plant Maint-Lines underground 140,335 140,335 140,335 Distribution Plant Maint-Street & Signal Lights 79,134 79,134 79,134 100% Cust Facilities Maint-Other Supplies & Materials 75,969 75,969 37,369 38,600 Distribution Plant Maint-Services & Charges 1,874 1,874 922 952 Distribution Plant Total Distribution 733,297 0 733,297 0 458,863 274,434
Depreciation Production 520,636 520,636 520,636 Production Plant Transmission 247,262 247,262 247,262 Transmission Plant Distribution 604,522 604,522 297,365 307,157 Distribution Plant Total Depreciation 1,372,420 0 1,372,420 0 1,065,263 307,157
Adminnistration & General Administration Operation Personal Services 904,373 904,373 577,505 278,468 0 48,401 (1) Supplies and Materials 2,910 2,910 1,858 896 0 156 (1) Other Services & Charges Energy conservation programs 206,485 206,485 206,485 100% Energy Property Insurance 47,119 47,119 36,246 10,873 Prod/Trans/Dist Plant Boiler & machinery insurance 90,574 90,574 90,574 Production Plant Administrative & general 874,685 874,685 558,547 269,326 0 46,812 (1) Customer account costs 79,781 79,781 79,781 100% Cust Service Misc Other Services & charges 219,603 219,603 219,603 100% Cust Service Administration Maintenance 18 18 11 6 0 1 (1) Administration Other 53,325 53,325 34,052 16,419 0 2,854 (1) Total Administration & general 2,478,873 0 2,478,873 1,298,793 771,600 299,384 109,096
Payments in lieu of taxes 1,048,160 1,048,160 461,905 534,451 15,665 36,139 (2)Total operating expenses 19,617,008 1,463,391 21,080,399 9,289,742 10,748,782 315,049 726,827
Non-operating revenue (expenses) Investment income 122,849 122,849 94,500 28,349 Prod/Trans/Dist Plant Penalties 46,184 46,184 20,352 23,549 690 1,592 (2) Miscellaneous income 922 922 406 470 14 32 (2) Gain on sale of assets (815,996) (815,996) (627,693) (188,303) Prod/Trans/Dist Plant Assessment income 0 N/A Interest on existing long-term debt (202,677) (202,677) (155,906) (46,771) Prod/Trans/Dist Plant Interest on new long-term debt 0 (150,000) (150,000) 2 (150,000) Prod/Trans Plant Bond fees / discounts (8,822) (8,822) (6,786) (2,036) Prod/Trans/Dist Plant Total non-operating revenue (expenses) (857,540) (150,000) (1,007,540) (825,127) 24,019 704 (207,136)
New Ulm Public Utilities, MinnesotaClassification of Electric Revenue Requirements
2010 Test Year
P:\00375700 New Ulm MN\3153-101-007 COS\Data Analysis\Electric operating results and COS.xlsx\Ex 3-A Func_Classif

Exhibit 3-A
Actual 2010 AdjustmentsTest Year
2010 Reference Demand Energy Cust Serv Cust Facil Basis for Classification
New Ulm Public Utilities, MinnesotaClassification of Electric Revenue Requirements
2010 Test Year
Less Grant Income (11,058) (11,058) (4,873) (5,638) (165) (381) (2)Less Muni/ PUC misc sales rev (53,975) (53,975) (23,786) (27,522) (807) (1,861) (2)Less Other Income (450,331) (450,331) (198,453) (229,621) (6,730) (15,527) (2)Subtotal Revenue Requirements 19,959,184 1,613,391 21,572,575 9,887,758 10,461,981 306,643 916,193Margin 569,048 569,048 250,769 290,155 8,504 19,620 (2)Revenue Requirements 20,528,232 1,613,391 22,141,623 10,138,526 10,752,136 315,147 935,813Percentage Revenue Requirements 46% 49% 1% 4%
(1) Allocated based on production, transmission and distribution costs, less purchased power costs.(2) Subtotaled operating expenses
References1. Adjust for change in forecast for 2012.2. New bond in 2012
P:\00375700 New Ulm MN\3153-101-007 COS\Data Analysis\Electric operating results and COS.xlsx\Ex 3-A Func_Classif
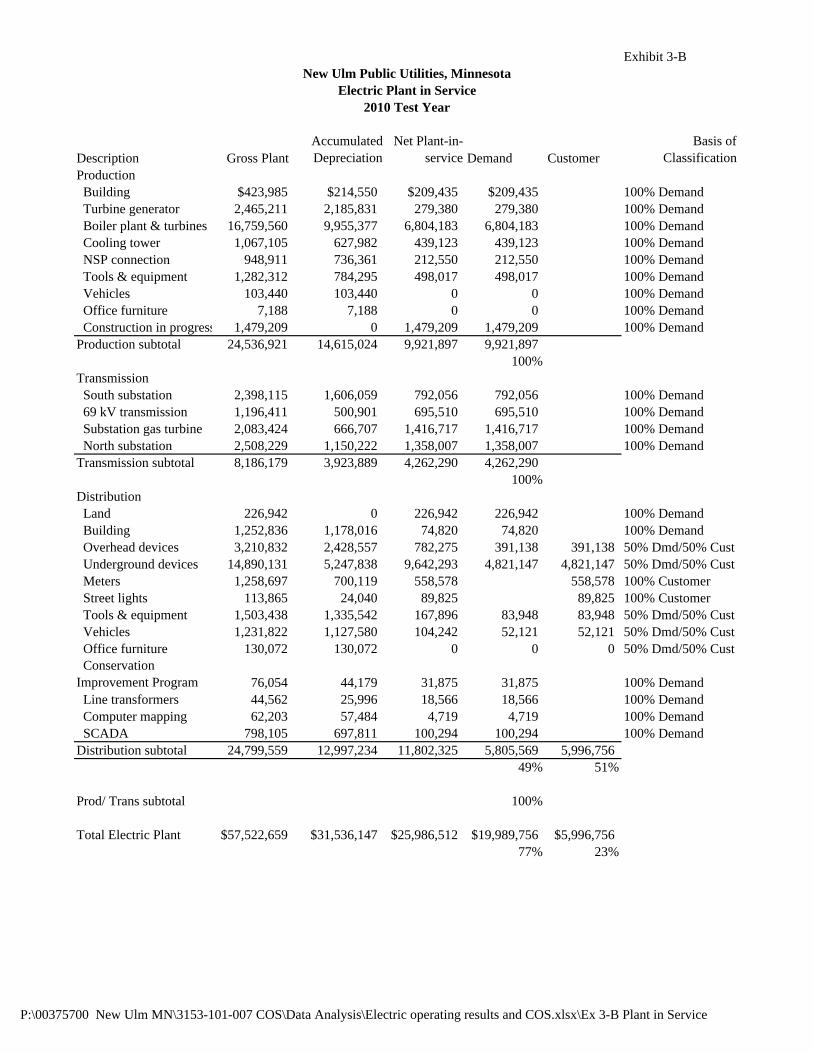
Exhibit 3-B
Description Gross Plant Accumulated Depreciation
Net Plant-in-service Demand Customer
Basis of Classification
Production Building $423,985 $214,550 $209,435 $209,435 100% Demand Turbine generator 2,465,211 2,185,831 279,380 279,380 100% Demand Boiler plant & turbines 16,759,560 9,955,377 6,804,183 6,804,183 100% Demand Cooling tower 1,067,105 627,982 439,123 439,123 100% Demand NSP connection 948,911 736,361 212,550 212,550 100% Demand Tools & equipment 1,282,312 784,295 498,017 498,017 100% Demand Vehicles 103,440 103,440 0 0 100% Demand Office furniture 7,188 7,188 0 0 100% Demand Construction in progress 1,479,209 0 1,479,209 1,479,209 100% DemandProduction subtotal 24,536,921 14,615,024 9,921,897 9,921,897
100%Transmission South substation 2,398,115 1,606,059 792,056 792,056 100% Demand 69 kV transmission 1,196,411 500,901 695,510 695,510 100% Demand Substation gas turbine 2,083,424 666,707 1,416,717 1,416,717 100% Demand North substation 2,508,229 1,150,222 1,358,007 1,358,007 100% DemandTransmission subtotal 8,186,179 3,923,889 4,262,290 4,262,290
100%Distribution Land 226,942 0 226,942 226,942 100% Demand Building 1,252,836 1,178,016 74,820 74,820 100% Demand Overhead devices 3,210,832 2,428,557 782,275 391,138 391,138 50% Dmd/50% Cust Underground devices 14,890,131 5,247,838 9,642,293 4,821,147 4,821,147 50% Dmd/50% Cust Meters 1,258,697 700,119 558,578 558,578 100% Customer Street lights 113,865 24,040 89,825 89,825 100% Customer Tools & equipment 1,503,438 1,335,542 167,896 83,948 83,948 50% Dmd/50% Cust Vehicles 1,231,822 1,127,580 104,242 52,121 52,121 50% Dmd/50% Cust Office furniture 130,072 130,072 0 0 0 50% Dmd/50% Cust Conservation Improvement Program 76,054 44,179 31,875 31,875 100% Demand Line transformers 44,562 25,996 18,566 18,566 100% Demand Computer mapping 62,203 57,484 4,719 4,719 100% Demand SCADA 798,105 697,811 100,294 100,294 100% DemandDistribution subtotal 24,799,559 12,997,234 11,802,325 5,805,569 5,996,756
49% 51%
Prod/ Trans subtotal 100%
Total Electric Plant $57,522,659 $31,536,147 $25,986,512 $19,989,756 $5,996,75677% 23%
New Ulm Public Utilities, MinnesotaElectric Plant in Service
2010 Test Year
P:\00375700 New Ulm MN\3153-101-007 COS\Data Analysis\Electric operating results and COS.xlsx\Ex 3-B Plant in Service

Exhibit 3-C
Demand Allocators Residential Small Coml Large Coml IndustrialMunicipal
CityMunicipal
PUC Total14,899 7,419 8,495 12,659 947 1,432 45,852
1 CP 32% 16% 19% 28% 2% 3% 100%49,164 27,553 30,117 49,886 4,105 6,140 166,966
4 CP (Summer season) 29% 17% 18% 30% 2% 4% 100%115,588 63,085 79,626 131,822 10,356 15,806 416,284
12 CP 28% 15% 19% 32% 2% 4% 100%146,014 79,744 88,473 146,469 13,808 21,074 495,583
12 NCP 29% 16% 18% 30% 3% 4% 100%
Energy Allocators Residential Small Coml Large Coml IndustrialMunicipal
CityMunicipal
PUC Total46,451,966 25,890,052 33,761,582 81,715,293 3,926,070 5,854,725 197,599,688
Annual kWh 24% 13% 17% 41% 2% 3% 100%
Customer Allocators Residential Small Coml Large Coml IndustrialMunicipal
CityMunicipal
PUC TotalCustomer Count 5,957 885 60 9 65 45 7,021 kWh per cust per month 650 2,438 47,219 756,623 5,027 10,822 822,779 ratio to Res 1 4 73 1,164 8 17 1,266 Cust Facilities weighting 1 3 50 1,000 6 15 1,075 Cust Services Weighting 1 2 5 20 2 2 32
5,957 2,655 2,979 9,000 391 676 21,658 Facilities Weighted Customer 28% 12% 14% 42% 2% 3% 100%
5,957 1,770 298 180 130 90 8,425 Service Weighted Customers 71% 21% 4% 2% 2% 1% 100%
2010 Test Year Jan Feb Mar Apr May Jun Jul Aug Sep Oct Nov Dec YearDays per Month 31 28 31 30 31 30 31 31 30 31 30 31 365Hours per month 744 672 744 720 744 720 744 744 720 744 720 744 8,760
Residential Jan Feb Mar Apr May Jun Jul Aug Sep Oct Nov Dec YearCustomer count 5,957 5,957 5,957 5,957 5,957 5,957 5,957 5,957 5,957 5,957 5,957 5,957 5,957kWh 4,553,915 3,654,547 3,389,091 3,384,732 2,728,909 3,281,772 4,142,444 5,868,519 5,803,360 3,217,257 2,974,951 3,452,469 46,451,966Monthly load factor-assumed 48% 49% 45% 48% 28% 32% 35% 45% 70% 42% 48% 42%NCP - calculated 12,752 11,099 10,123 9,794 13,100 14,244 15,908 17,528 11,515 10,296 8,608 11,049 146,014Coincidence Factor- assumed 75% 75% 75% 75% 85% 85% 85% 85% 75% 75% 75% 75%CP - calculated 9,564 8,324 7,592 7,345 11,135 12,107 13,522 14,899 8,636 7,722 6,456 8,286 115,588
Test Year 2010 Cost of Service AllocatorsNew Ulm Public Utilities, Minnesota
P:\00375700 New Ulm MN\3153-101-007 COS\Data Analysis\Electric operating results and COS.xlsx\Ex 3-C Alloc Factors
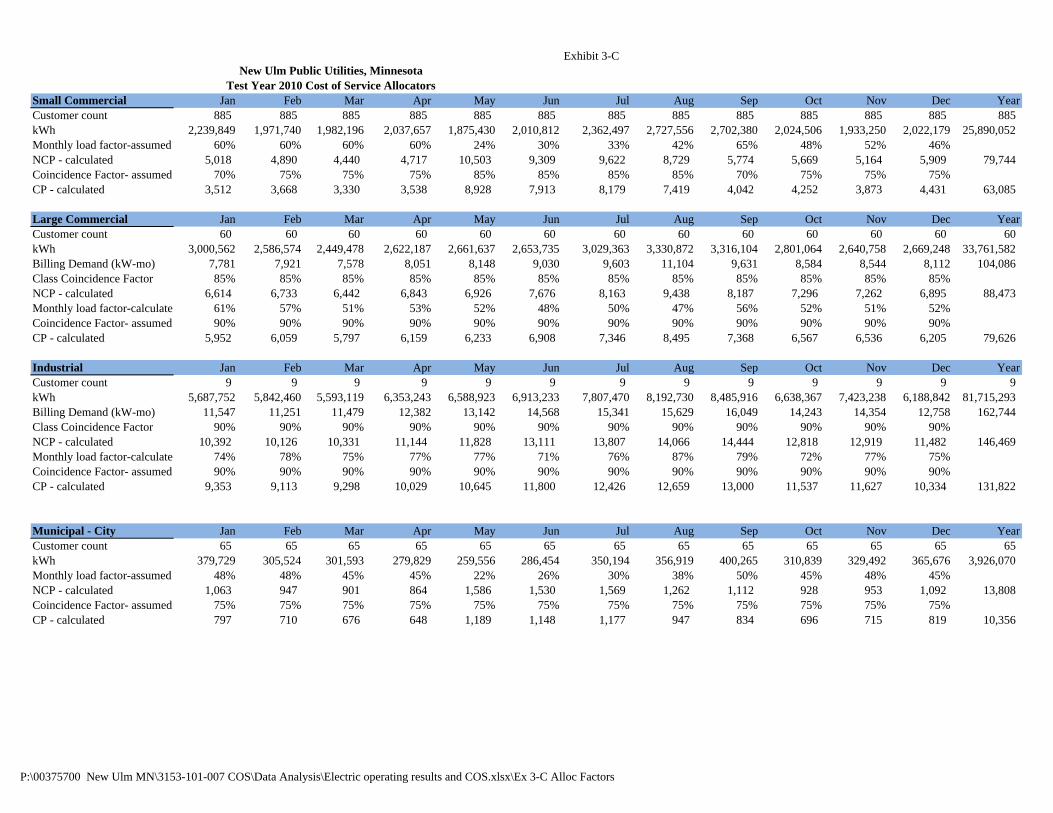
Exhibit 3-C
Test Year 2010 Cost of Service AllocatorsNew Ulm Public Utilities, Minnesota
Small Commercial Jan Feb Mar Apr May Jun Jul Aug Sep Oct Nov Dec YearCustomer count 885 885 885 885 885 885 885 885 885 885 885 885 885kWh 2,239,849 1,971,740 1,982,196 2,037,657 1,875,430 2,010,812 2,362,497 2,727,556 2,702,380 2,024,506 1,933,250 2,022,179 25,890,052Monthly load factor-assumed 60% 60% 60% 60% 24% 30% 33% 42% 65% 48% 52% 46%NCP - calculated 5,018 4,890 4,440 4,717 10,503 9,309 9,622 8,729 5,774 5,669 5,164 5,909 79,744Coincidence Factor- assumed 70% 75% 75% 75% 85% 85% 85% 85% 70% 75% 75% 75%CP - calculated 3,512 3,668 3,330 3,538 8,928 7,913 8,179 7,419 4,042 4,252 3,873 4,431 63,085
Large Commercial Jan Feb Mar Apr May Jun Jul Aug Sep Oct Nov Dec YearCustomer count 60 60 60 60 60 60 60 60 60 60 60 60 60kWh 3,000,562 2,586,574 2,449,478 2,622,187 2,661,637 2,653,735 3,029,363 3,330,872 3,316,104 2,801,064 2,640,758 2,669,248 33,761,582Billing Demand (kW-mo) 7,781 7,921 7,578 8,051 8,148 9,030 9,603 11,104 9,631 8,584 8,544 8,112 104,086Class Coincidence Factor 85% 85% 85% 85% 85% 85% 85% 85% 85% 85% 85% 85%NCP - calculated 6,614 6,733 6,442 6,843 6,926 7,676 8,163 9,438 8,187 7,296 7,262 6,895 88,473Monthly load factor-calculate 61% 57% 51% 53% 52% 48% 50% 47% 56% 52% 51% 52%Coincidence Factor- assumed 90% 90% 90% 90% 90% 90% 90% 90% 90% 90% 90% 90%CP - calculated 5,952 6,059 5,797 6,159 6,233 6,908 7,346 8,495 7,368 6,567 6,536 6,205 79,626
Industrial Jan Feb Mar Apr May Jun Jul Aug Sep Oct Nov Dec YearCustomer count 9 9 9 9 9 9 9 9 9 9 9 9 9kWh 5,687,752 5,842,460 5,593,119 6,353,243 6,588,923 6,913,233 7,807,470 8,192,730 8,485,916 6,638,367 7,423,238 6,188,842 81,715,293Billing Demand (kW-mo) 11,547 11,251 11,479 12,382 13,142 14,568 15,341 15,629 16,049 14,243 14,354 12,758 162,744Class Coincidence Factor 90% 90% 90% 90% 90% 90% 90% 90% 90% 90% 90% 90%NCP - calculated 10,392 10,126 10,331 11,144 11,828 13,111 13,807 14,066 14,444 12,818 12,919 11,482 146,469Monthly load factor-calculate 74% 78% 75% 77% 77% 71% 76% 87% 79% 72% 77% 75%Coincidence Factor- assumed 90% 90% 90% 90% 90% 90% 90% 90% 90% 90% 90% 90%CP - calculated 9,353 9,113 9,298 10,029 10,645 11,800 12,426 12,659 13,000 11,537 11,627 10,334 131,822
Municipal - City Jan Feb Mar Apr May Jun Jul Aug Sep Oct Nov Dec YearCustomer count 65 65 65 65 65 65 65 65 65 65 65 65 65kWh 379,729 305,524 301,593 279,829 259,556 286,454 350,194 356,919 400,265 310,839 329,492 365,676 3,926,070Monthly load factor-assumed 48% 48% 45% 45% 22% 26% 30% 38% 50% 45% 48% 45%NCP - calculated 1,063 947 901 864 1,586 1,530 1,569 1,262 1,112 928 953 1,092 13,808Coincidence Factor- assumed 75% 75% 75% 75% 75% 75% 75% 75% 75% 75% 75% 75%CP - calculated 797 710 676 648 1,189 1,148 1,177 947 834 696 715 819 10,356
P:\00375700 New Ulm MN\3153-101-007 COS\Data Analysis\Electric operating results and COS.xlsx\Ex 3-C Alloc Factors

Exhibit 3-C
Test Year 2010 Cost of Service AllocatorsNew Ulm Public Utilities, Minnesota
Municipal - PUC Jan Feb Mar Apr May Jun Jul Aug Sep Oct Nov Dec YearCustomer count 45 45 45 45 45 45 45 45 45 45 45 45 45kWh 494,058 503,735 483,771 475,959 460,679 502,972 479,992 539,831 518,376 482,860 465,564 446,928 5,854,725Monthly load factor-assumed 48% 48% 45% 45% 22% 26% 30% 38% 50% 45% 45% 45%NCP - calculated 1,383 1,562 1,445 1,469 2,815 2,687 2,151 1,909 1,440 1,442 1,437 1,335 21,074Coincidence Factor- assumed 75% 75% 75% 75% 75% 75% 75% 75% 75% 75% 75% 75%CP - calculated 1,038 1,171 1,084 1,102 2,111 2,015 1,613 1,432 1,080 1,082 1,078 1,001 15,806
Class Total kWh 16,355,865 14,864,580 14,199,248 15,153,607 14,575,134 15,648,978 18,171,960 21,016,427 21,226,401 15,474,893 15,767,253 15,145,342 197,599,688
2010 Test Year Jan Feb Mar Apr May Jun Jul Aug Sep Oct Nov Dec YearAdjusted Monthly Sys Pk-M 29,200 27,830 27,450 28,035 41,145 42,235 45,045 45,654 33,730 31,690 28,575 30,425 411,014Class CP Residential 9,564 8,324 7,592 7,345 11,135 12,107 13,522 14,899 8,636 7,722 6,456 8,286 115,588 General Power 3,512 3,668 3,330 3,538 8,928 7,913 8,179 7,419 4,042 4,252 3,873 4,431 63,085 Large Power 5,952 6,059 5,797 6,159 6,233 6,908 7,346 8,495 7,368 6,567 6,536 6,205 79,626 Industrial 9,353 9,113 9,298 10,029 10,645 11,800 12,426 12,659 13,000 11,537 11,627 10,334 131,822 Municipal - City 797 710 676 648 1,189 1,148 1,177 947 834 696 715 819 10,356 Municipal - PUC 1,038 1,171 1,084 1,102 2,111 2,015 1,613 1,432 1,080 1,082 1,078 1,001 15,806Total 6 classes 30,217 29,046 27,777 28,820 40,241 41,891 44,263 45,852 34,960 31,855 30,284 31,077 416,284
Difference (1,017) (1,216) (327) (785) 904 344 782 (198) (1,230) (165) (1,709) (652) (5,270)% difference -3% -4% -1% -3% 2% 1% 2% 0% -4% -1% -6% -2% -1%
Annual Peak 45,654 August4 Summer Month's Peak kW 166,664
P:\00375700 New Ulm MN\3153-101-007 COS\Data Analysis\Electric operating results and COS.xlsx\Ex 3-C Alloc Factors
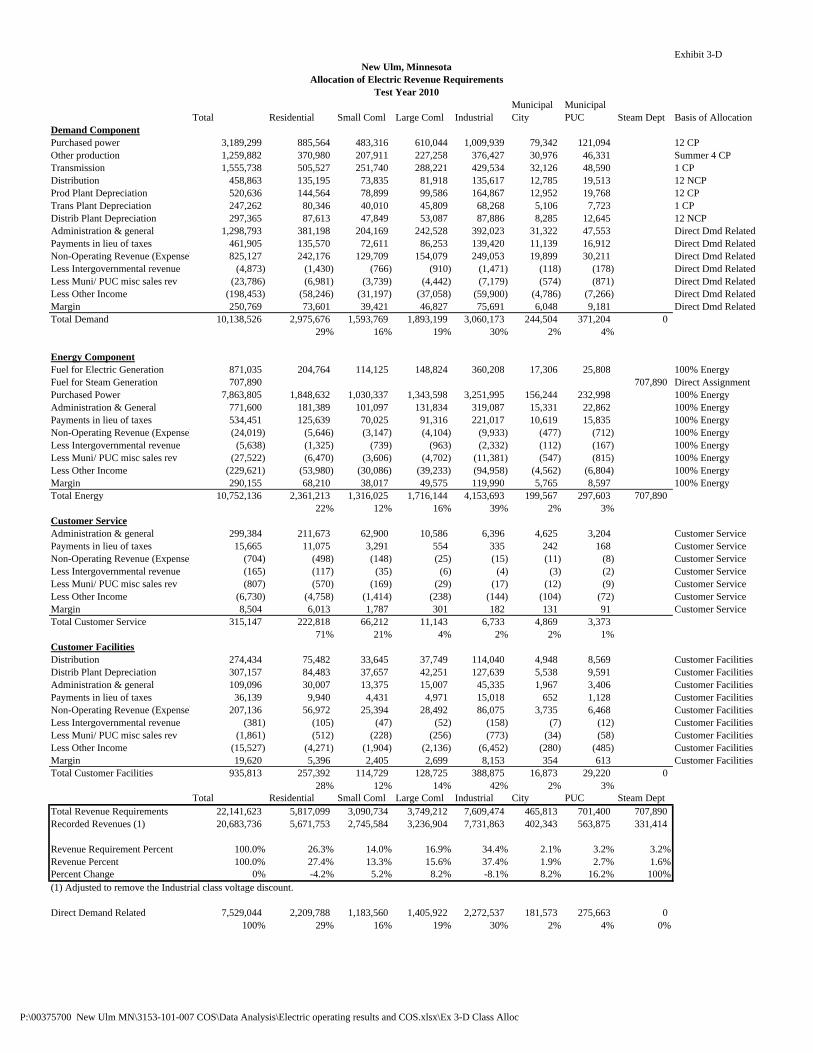
Exhibit 3-D
Municipal MunicipalTotal Residential Small Coml Large Coml Industrial City PUC Steam Dept Basis of Allocation
Demand ComponentPurchased power 3,189,299 885,564 483,316 610,044 1,009,939 79,342 121,094 12 CPOther production 1,259,882 370,980 207,911 227,258 376,427 30,976 46,331 Summer 4 CPTransmission 1,555,738 505,527 251,740 288,221 429,534 32,126 48,590 1 CPDistribution 458,863 135,195 73,835 81,918 135,617 12,785 19,513 12 NCPProd Plant Depreciation 520,636 144,564 78,899 99,586 164,867 12,952 19,768 12 CPTrans Plant Depreciation 247,262 80,346 40,010 45,809 68,268 5,106 7,723 1 CPDistrib Plant Depreciation 297,365 87,613 47,849 53,087 87,886 8,285 12,645 12 NCPAdministration & general 1,298,793 381,198 204,169 242,528 392,023 31,322 47,553 Direct Dmd RelatedPayments in lieu of taxes 461,905 135,570 72,611 86,253 139,420 11,139 16,912 Direct Dmd RelatedNon-Operating Revenue (Expense) 825,127 242,176 129,709 154,079 249,053 19,899 30,211 Direct Dmd RelatedLess Intergovernmental revenue (4,873) (1,430) (766) (910) (1,471) (118) (178) Direct Dmd RelatedLess Muni/ PUC misc sales rev (23,786) (6,981) (3,739) (4,442) (7,179) (574) (871) Direct Dmd RelatedLess Other Income (198,453) (58,246) (31,197) (37,058) (59,900) (4,786) (7,266) Direct Dmd RelatedMargin 250,769 73,601 39,421 46,827 75,691 6,048 9,181 Direct Dmd RelatedTotal Demand 10,138,526 2,975,676 1,593,769 1,893,199 3,060,173 244,504 371,204 0
29% 16% 19% 30% 2% 4%
Energy ComponentFuel for Electric Generation 871,035 204,764 114,125 148,824 360,208 17,306 25,808 100% EnergyFuel for Steam Generation 707,890 707,890 Direct AssignmentPurchased Power 7,863,805 1,848,632 1,030,337 1,343,598 3,251,995 156,244 232,998 100% EnergyAdministration & General 771,600 181,389 101,097 131,834 319,087 15,331 22,862 100% EnergyPayments in lieu of taxes 534,451 125,639 70,025 91,316 221,017 10,619 15,835 100% EnergyNon-Operating Revenue (Expense) (24,019) (5,646) (3,147) (4,104) (9,933) (477) (712) 100% EnergyLess Intergovernmental revenue (5,638) (1,325) (739) (963) (2,332) (112) (167) 100% EnergyLess Muni/ PUC misc sales rev (27,522) (6,470) (3,606) (4,702) (11,381) (547) (815) 100% EnergyLess Other Income (229,621) (53,980) (30,086) (39,233) (94,958) (4,562) (6,804) 100% EnergyMargin 290,155 68,210 38,017 49,575 119,990 5,765 8,597 100% EnergyTotal Energy 10,752,136 2,361,213 1,316,025 1,716,144 4,153,693 199,567 297,603 707,890
22% 12% 16% 39% 2% 3%Customer ServiceAdministration & general 299,384 211,673 62,900 10,586 6,396 4,625 3,204 Customer ServicePayments in lieu of taxes 15,665 11,075 3,291 554 335 242 168 Customer ServiceNon-Operating Revenue (Expense) (704) (498) (148) (25) (15) (11) (8) Customer ServiceLess Intergovernmental revenue (165) (117) (35) (6) (4) (3) (2) Customer ServiceLess Muni/ PUC misc sales rev (807) (570) (169) (29) (17) (12) (9) Customer ServiceLess Other Income (6,730) (4,758) (1,414) (238) (144) (104) (72) Customer ServiceMargin 8,504 6,013 1,787 301 182 131 91 Customer ServiceTotal Customer Service 315,147 222,818 66,212 11,143 6,733 4,869 3,373
71% 21% 4% 2% 2% 1%Customer FacilitiesDistribution 274,434 75,482 33,645 37,749 114,040 4,948 8,569 Customer FacilitiesDistrib Plant Depreciation 307,157 84,483 37,657 42,251 127,639 5,538 9,591 Customer FacilitiesAdministration & general 109,096 30,007 13,375 15,007 45,335 1,967 3,406 Customer FacilitiesPayments in lieu of taxes 36,139 9,940 4,431 4,971 15,018 652 1,128 Customer FacilitiesNon-Operating Revenue (Expense) 207,136 56,972 25,394 28,492 86,075 3,735 6,468 Customer FacilitiesLess Intergovernmental revenue (381) (105) (47) (52) (158) (7) (12) Customer FacilitiesLess Muni/ PUC misc sales rev (1,861) (512) (228) (256) (773) (34) (58) Customer FacilitiesLess Other Income (15,527) (4,271) (1,904) (2,136) (6,452) (280) (485) Customer FacilitiesMargin 19,620 5,396 2,405 2,699 8,153 354 613 Customer FacilitiesTotal Customer Facilities 935,813 257,392 114,729 128,725 388,875 16,873 29,220 0
28% 12% 14% 42% 2% 3%Total Residential Small Coml Large Coml Industrial City PUC Steam Dept
Total Revenue Requirements 22,141,623 5,817,099 3,090,734 3,749,212 7,609,474 465,813 701,400 707,890Recorded Revenues (1) 20,683,736 5,671,753 2,745,584 3,236,904 7,731,863 402,343 563,875 331,414
Revenue Requirement Percent 100.0% 26.3% 14.0% 16.9% 34.4% 2.1% 3.2% 3.2%Revenue Percent 100.0% 27.4% 13.3% 15.6% 37.4% 1.9% 2.7% 1.6%Percent Change 0% -4.2% 5.2% 8.2% -8.1% 8.2% 16.2% 100%(1) Adjusted to remove the Industrial class voltage discount.
Direct Demand Related 7,529,044 2,209,788 1,183,560 1,405,922 2,272,537 181,573 275,663 0100% 29% 16% 19% 30% 2% 4% 0%
New Ulm, MinnesotaAllocation of Electric Revenue Requirements
Test Year 2010
P:\00375700 New Ulm MN\3153-101-007 COS\Data Analysis\Electric operating results and COS.xlsx\Ex 3-D Class Alloc

Exhibit 5-A
$0 $20 $40 $60 $80
$100 $120 $140 $160 $180 $200 $220 $240 $260 $280
100 300 500 700 900 1100 1300 1500 1700 1900 2100
Mon
thly
Bill
($)
kWh
New Ulm, MinnesotaResidential Electric RateMonthly Bill Comparison
Current Rate Proposed Rate-Phase 1 Proposed Rate-Phase 2

Exhibit 5-B
$0
$50
$100
$150
$200
$250
$300
$350
$400
$450
$500
$550
$600
$650
$700
500 1000 1500 2000 2500 3000 3500 4000 4500 5000 5500
Mon
thly
Bill
($)
kWh
New Ulm, MinnesotaSmall Commercial Electric Rate
Monthly Bill Comparison
Current Rate Proposed Rate - Phase 1 Proposed Rate - Phase 2
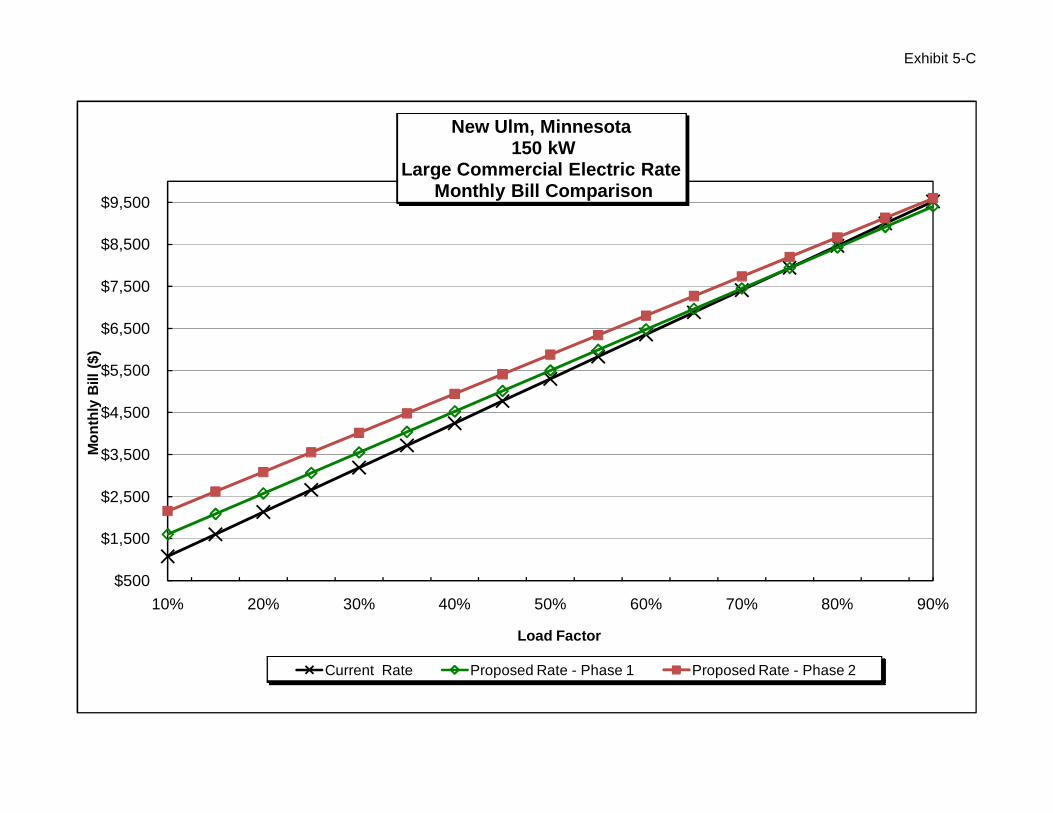
Exhibit 5-C
$500
$1,500
$2,500
$3,500
$4,500
$5,500
$6,500
$7,500
$8,500
$9,500
10% 20% 30% 40% 50% 60% 70% 80% 90%
Mon
thly
Bill
($)
Load Factor
New Ulm, Minnesota150 kW
Large Commercial Electric RateMonthly Bill Comparison
Current Rate Proposed Rate - Phase 1 Proposed Rate - Phase 2

Exhibit 5-D
$15,000
$25,000
$35,000
$45,000
$55,000
$65,000
$75,000
$85,000
$95,000
10% 20% 30% 40% 50% 60% 70% 80% 90%
Mon
thly
Bill
($)
Load Factor
New Ulm, Minnesota1500 kW
Industrial Electric RateMonthly Bill Comparison
Current Rate Proposed Rate - Phase 1 Proposed Rate - Phase 2

Exhibit 5-E
$0 $100 $200 $300 $400 $500 $600 $700 $800 $900
$1,000 $1,100 $1,200 $1,300 $1,400 $1,500
1000 2000 3000 4000 5000 6000 7000 8000 9000 10000 11000
Mon
thly
Bill
($)
kWh
New Ulm, MinnesotaMunicipal City Electric Rate
Monthly Bill Comparison
Current Rate Proposed Rate - Phase 1 Proposed Rate - Phase 2
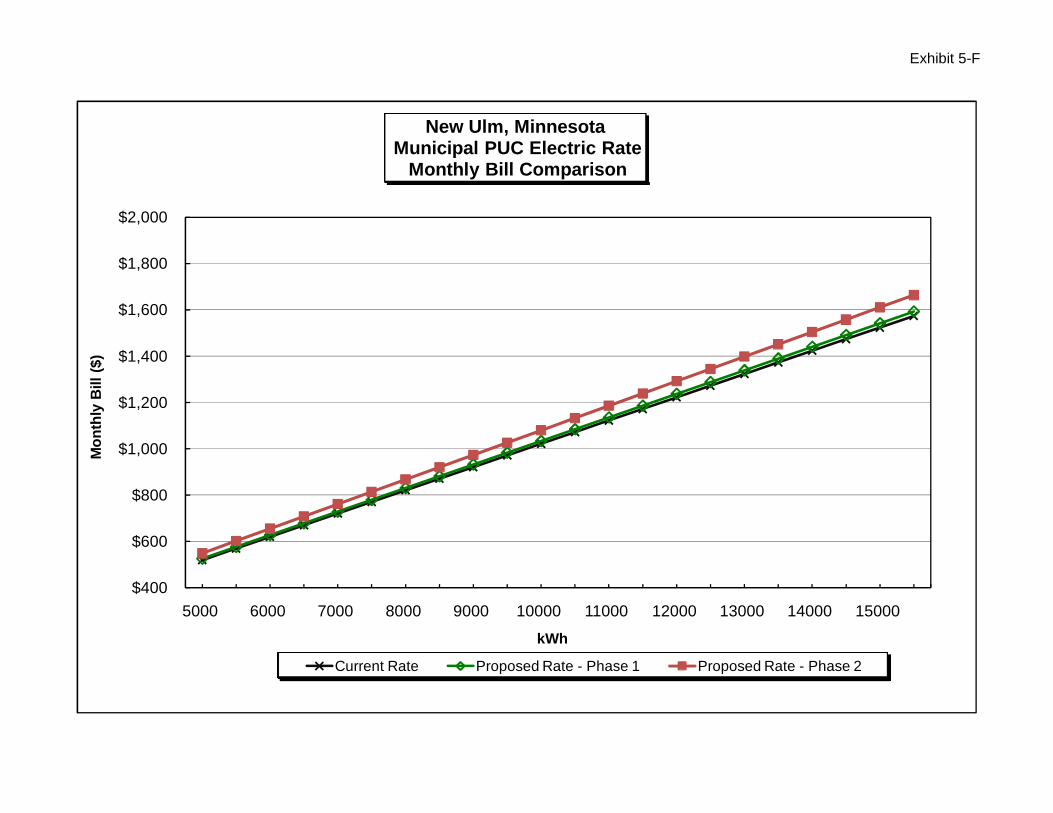
Exhibit 5-F
$400
$600
$800
$1,000
$1,200
$1,400
$1,600
$1,800
$2,000
5000 6000 7000 8000 9000 10000 11000 12000 13000 14000 15000
Mon
thly
Bill
($)
kWh
New Ulm, MinnesotaMunicipal PUC Electric Rate
Monthly Bill Comparison
Current Rate Proposed Rate - Phase 1 Proposed Rate - Phase 2


![v v µ o & ] v v ] o Z } - New Ulm, Minnesota1E9156B6... · 2019-08-01 · Jason Stadtherr Landon Rathmann Travis Leskey Chad Freiderich Chief Mechanic Paul Waibel Admin. Asst I Senior](https://img.pdfslide.net/doc/110x75/5f06923d7e708231d418a651/v-v-o-v-v-o-z-new-ulm-minnesota-1e9156b6-2019-08-01-jason.jpg)