Embed Size (px)
Citation preview
Foreword p.3
Section one: Executive summary p.4
Section two: Introduction p.7
Section three: Transport infrastructure p.9
Section four: Transport infrastructureand its effect on business p.20
Section five: Governmenttransport initiatives p.23
Appendix one: Sample profile p.29
Appendix two: Participatingchambers p.30
The British Chambers of Commerce is thenational body for a powerful and influentialNetwork of Accredited Chambers ofCommerce across the UK; a Network thatdirectly serves not only its memberbusinesses, but the wider business community.
Representing 100,000 businesses whotogether employ more than 5 millionemployees, the British Chambers ofCommerce is The Ultimate BusinessNetwork. Every Chamber sits at the veryheart of its local community working withbusinesses to grow and develop by sharingopportunities, knowledge and know-how.
Written and researched by:Gareth Elliott, Policy Adviser
Acknowledgements:Chris Hannant, Head of Policy
The British Chambers of Commerce65 Petty FranceSt. James’s ParkLondonSW1H 9EUTel: 020 7654 5800Fax: 020 7654 5819Email: [email protected]: http://www.britishchambers.org.uk
CONTENTS
Designed and printed by EVC GraphicDesign and Print, Pangbourne, Berkshire,UK, a registered 14001 environmentalprinter. Printed on paper from a managedsustainable source, using pulp that is TCF& ECF, and printed with vegetable soyabased inks.
ABOUTUS
FOREWORD
3
David Frost
Director General
British Chambers of Commerce
Transport is critical to the economy and in a
time of economic downturn it is essential that
our transport networks are up to the task.
Unfortunately, however, the picture that has
been painted by our businesses is one of despair.
Our roads are congested and our railways
cannot cope with the demand placed on them.
Airports have reached their capacity and
passengers and airlines are being forced
elsewhere. The grim result of decades of
underinvestment is that over the last 12 months
the cost of congestion to British business is
£23.2 billion, a staggering rise of £5.7 billion over
the year.
As I have travelled across the country businesses
have told me that the inadequate state of our
transport infrastructure is affecting their ability
to operate. Many firms are finding it difficult to
attract or retain staff due to difficulties in travel
to and from the workplace while delays due to
travel are resulting in missed deadlines. Recent
increases in the price of fuel have only
exacerbated the problem forcing businesses to
raise prices or postpone investments adding
pressure on an already delicate economy.
What this survey highlights is the need for a
long term strategy that is prepared to take
drastic action to improve and upgrade our
dilapidated transport networks. High profile
projects such as the third runway at Heathrow
and a new high speed railway must happen.
Amending the definition of overcrowding on the
railways does nothing to solve the problem
except infuriating already uncomfortable
passengers. Short term schemes such as high
occupancy vehicle lanes or extra rail carriages,
while helpful, are merely sticking plasters which
do nothing to answer the long term problem of
capacity. It is essential we look long term. If our
transport system cannot cope now how do we
expect it to when future projections of
population growth are taken into account? If the
UK is to maintain its position in the world it must
invest in its infrastructure. A first rate country
cannot operate with a third rate network.
INTRODUCTIONTwelve months on from the previous transport
survey and the cost to British business of an
inadequate transport system continues to rise. Our
transport networks are struggling to cope under
the demand. Congestion on the roads, railways
and at our major airports is stifling British
business. It affects companies in several ways, lost
business, recruitment difficulties, wasted time and
above all increased costs. The debate over the
rising price of fuel has highlighted the difficulty
businesses have faced trying to cope. Over the
last 12 months the cost to business of the poor
state of Britain’s infrastructure has risen by a
staggering £5.7 billion pounds to a total of
£23.2bn. This survey highlights the urgent need
for investment in our transport infrastructure. As
the economy begins to slow down transport must
not become a victim of the credit crunch. British
business needs to be able to access a high quality
and efficient transport network in order to access
new and existing markets. Major projects such as
a third runway at Heathrow and a new high speed
railway must not be put to one side but should
be brought forward. Indeed, opportunities for
further public investment during this economic
downturn they should be directed at transport
improvements. However, the government must
plan early. We don’t want to see major projects
trapped in an overly complex planning process
when they are required now.
THE ROAD NETWORKThe road network continues to dominate transport
flows with nearly all businesses using it and three
quarters claiming it is essential. However, as usage
continues to increase, congestion remains the
prime concern of businesses. Over four fifths
claim that congestion locally, regionally and
nationally is a problem. At a local level this is
largely put down to peak time flows such as the
school run but nationally the sheer volume of
traffic is the biggest problem with poor road
design, planning delays and the lack of alternative
transportation adding to the problem. This has
been exacerbated over the last year due to the
high price of oil which has resulted in an increase
in running costs for over five sixths of businesses.
Even as the price of oil has dropped it is likely
that the era of cheap oil is over and will continue
to represent an added cost to business. In a
further blow to the economy many firms have
been forced either to raise prices to cover costs or
have been forced to postpone investment
decisions. Nearly a quarter of businesses surveyed
claimed that they have become less competitive
over the last 12 months due to poor infrastructure.
THE RAIL NETWORKThe railways are reaching critical capacity. Already
the government has been forced to amend its
own definition of overcrowding to shield the true
extent of the problem. Nearly a quarter of
businesses have indicated that they have
increased their usage of the network but this is
due, in part, to rising congestion on the roads.
However, as the railways are stretched businesses
are concerned at the growing expense of using
rail. Over two thirds of businesses rated a
reduction in fares as the most important aspect to
address on the rail network. Punctuality and
reliability still rank high although the inability to
park at stations was rated as the third highest
issue that needs improving. This reflects a
growing unease that congestion is pricing people
off the roads yet subsequent rises in rail fares and
reducing capacity is making rail less attractive. If
the government is to fulfil its policy of modal shift
to public transport it must address these issues.
High Speed Rail was also rated highly by
businesses as a necessary improvement. As
capacity reaches its limits the railway network will
require new infrastructure and a new high speed
rail network will release capacity on the traditional
network while also allowing more freight to be
taken on rail. It is therefore important that the
government considers high speed rail in
association with capacity problems.
THE AIR NETWORKAir transport remains critical to the success of the
UK economy with nine out of ten businesses
claiming they have maintained or increased their
usage of the air network. At a time when
businesses are becoming more internationally
focussed now is not the time to restrict airport
expansion. Two out of every five businesses claim
that Heathrow, the UK’s only major hub airport, is
important to their business operations rising to
three fifths for larger organisations. Capacity
constraints threaten its position and already we
are seeing evidence that businesses are beginning
to look to continental airports in order to conduct
business. Roughly a third of businesses stated that
access to non-UK airports is important, rising to
two in five businesses in the North of England and
Scotland. At a time when the global economic
outlook is so uncertain it is important that we
maintain our international links.
4
SECTIONONE:
EXECUTIVESUMMARY
Capacity constraints at our major airports are also
having negative affects on the passenger
experience. Nearly 40% of businesses stated that
the number one priority for the air transport
network to improve is the management of
passengers. As gateways to the UK it is imperative
that our airports provide an efficient and
exemplary service. The recent debacle following
the opening of Terminal 5 did much to damage
the UK’s reputation as a place to come to or to do
business in.
MOVEMENT OF FREIGHTFreight movement continues to rely heavily on the
road network with almost all businesses using the
road network as opposed to only one in ten who
use rail. The dominance of road continues to be
down to the lack of alternatives that offer the
flexibility, responsiveness and timeliness of road.
Although rail is considered the best alternative to
road its low usage suggests it continues to find it
difficult to compete on a level playing field. The
government has stated that it wants to transfer
freight from road to rail. This survey suggests that
there is more work needed before this can
become a reality. Improvements to rail freight
terminals or extra capacity on the network could
go a long way to making rail freight a practical
reality.
TRANSPORT INFRASTRUCTURE AND ITS EFFECTON BUSINESSThe inadequacies of the transport system are
having serious consequences on the ability of
businesses to operate. Nine out of ten businesses
have experienced increased operating costs while
four fifths claimed a loss of man hours. Over half of
those surveyed stated that they have lost business
or are suffering recruitment difficulties. This all adds
up to a real cost which on average is estimated at
£17,350 per business. On a national scale this
equates to a staggering £23.2 billion pounds, a rise
of £5.7 billion over the last 12 months.
These costs have been exacerbated over the last
year by rising fuel costs. Nearly nine in ten
businesses stated that the price of oil has led to
increased running costs. While a third have passed
this cost on to customers, adding to inflationary
pressures, a quarter have stated that they have
been forced to curtail investment in their
company while a similar amount have found it
difficult to compete.
TRANSPORT INITIATIVES TO COMBATCONGESTIONThe need to upgrade the network is paramount
yet what is clear from this survey is that the
business community remain sceptical about
government initiatives to ease congestion. Just
under half of businesses favoured road widening
and the building of new roads as opposed to
roughly a third who preferred hard shoulder
running or a fifth who indicated a preference for
high occupancy vehicle lanes. Support for some
kind of national road pricing scheme, backed up
by up-front investment in public transport or a
re-evaluation of road user taxation, remained
static reflecting confusion over the government’s
general strategy. However, businesses indicated
that they would resist attempts by government to
raise revenue through business only taxes for
infrastructure improvements.
PLANNINGPlanning remains a major cause of frustration
among businesses. Ninety five per cent believe
that the planning of the UK’s major transport
infrastructure schemes takes too many years to
materialise while nine out of ten agreed that major
transport schemes are too bureaucratic in their
design and implementation. This frustration was
represented by the overwhelming support, four
fifths of all businesses, for the Infrastructure
Planning Commission as proposed in the
government’s Planning Bill. The BCC strongly
supports the Planning Bill’s proposals to reform
the system. In these challenging times, we believe
that the removal of undue barriers on public
investment in infrastructure projects of critical
national importance for our economic and energy
future must be prioritised.
ENVIRONMENTAs the economy worsens it is encouraging to see
that the business community has not lessened its
willingness to take measures to reduce its
environmental impact. Nearly two thirds of those
responding indicated that they had implemented
at least one measure in response to the
environment agenda. Two out of five businesses
had introduced working from home strategies
while a third have implemented IT and e-business
solutions. Reflecting concerns about congestion
and the wishes of employees nearly a third of
businesses have introduced flexi-time or
staggered working hours.
5
SECTIONONE:
EXECUTIVESUMMARY
RECOMMENDATIONS:The UK’s transport infrastructure is still built
around its Victorian foundations. This report
points to the failings and inadequacies of the
transport network and points to the urgent need
for a complete revision of current transport policy.
The BCC recommends that:
� As the economic downturn begins to bite we
urge the government to bring forward public
spending proposals on infrastructure projects
that can quickly release capacity onto our
transport network. Infrastructure investment
will enhance the productivity of all transport
modes and ensure the wheels of the economy
keep on turning.
� A new north-south high speed rail line is
needed as a matter of urgency. The
construction of a truly high speed rail network
will relieve pressure on existing conventional
lines freeing up capacity for freight and
commuter services.
� As an island trading nation the ability of the
UK to access international markets is vital. The
decision on Heathrow’s third runway cannot be
delayed. Heathrow is the UK’s only major hub
airport providing connectivity to the rest of
the world. Without expansion the UK will lose
direct connections and will become a feed-in
airport to European airports. Any expansion
must meet strict environmental criteria.
� Due to the nature of the planning process and
the complicated arrangements between
regional, local and national bodies there are
several important road enhancement projects
that are unnecessarily delayed. We urge the
government to prioritise and fast-track those
projects that offer the best return on
investment.
� The planning system currently takes too long
and is too bureaucratic. It is therefore essential
that the government’s proposals for national
policy statements and an Infrastructure
Planning Commission are implemented in full.
6
SECTIONONE:
EXECUTIVESUMMARY
2.1 BACKGROUNDBritish business requires an effective transport
network. A survey undertaken by the British
Chambers of Commerce (BCC) amongst
Chamber Members in 2007 revealed that the
network is failing British business, and as a result
the economy was suffering.
As things stand, the BCC does not believe that
the government’s attempts to address failings in
the transport system are translating into the
improvements that businesses need to see.
It believes that the reputation of the UK as an
accessible nation and a good place to do
business is being undermined by a woefully
inadequate transport system; the ability of
business to compete in a global market place is
at stake, as are jobs and the future economic
attractiveness of the UK as a vibrant and
competitive economy.
2.2 BUSINESS AND RESEARCH OBJECTIVESThe research objectives of this study are to:
1. Determine usage and relative importance ofroad, rail, sea and air transport;
2. Understand the perceived impact of thecurrent transport infrastructure on business,in terms of business costs, lost opportunities,decisions on business growth and location;and
3. Establish opinion on possible solutions to thetransport problems and issues ofsustainability.
2.3 SAMPLE AND RESPONSE RATEIn all, 48 Accredited Chambers chose to
participate in the study. 40 Chambers provided
data allowing Research by Design Ltd to
automate the initial invitation to participate and
subsequent reminder emails with the remaining
8 supporting the online survey only. Fieldwork
was undertaken between 28th August and
23rd September 2008.
In total 2,675 business members responded to
the 2008 Transport Survey. 2,363 replied to an
invitation to participate in the survey
administered by Research by Design Ltd, and 312
completed a survey administered in-house by
selected Chambers. Appendix 1 provides profile
details of respondents to the survey.
2.4 ANALYSIS AND REPORTINGThis report provides the findings given by the
total sample (all member businesses). It also
provides the findings of sub-groups of the total
sample, defined by number of employees,
business sector, and region/country, where they
are statistically significant compared to the
national picture.
By the very nature that surveys typically
represent the views of a sample of the
population, sampling error must be considered
when evaluating the findings. This is measured
by the confidence level and interval of the data.
Most commonly, market research studies require
a 95% confidence level, indicating that we can
be 95% confident that we have not arrived at the
estimate by chance.
The confidence interval shows the variation that
may exist in the findings drawn from a sample.
For example, the survey shows that 70% of
businesses believe that improved reliability and
punctuality would encourage them, their
colleagues and employees, to use the public
transport network more often. However, due to
intrinsic characteristics of sampling, this will be
surrounded by a confidence interval, in this case
±1.9%. This indicates that the real figure, (the
‘true’ figure if the whole population were
surveyed) lies somewhere between 68.1%
and 71.9%.
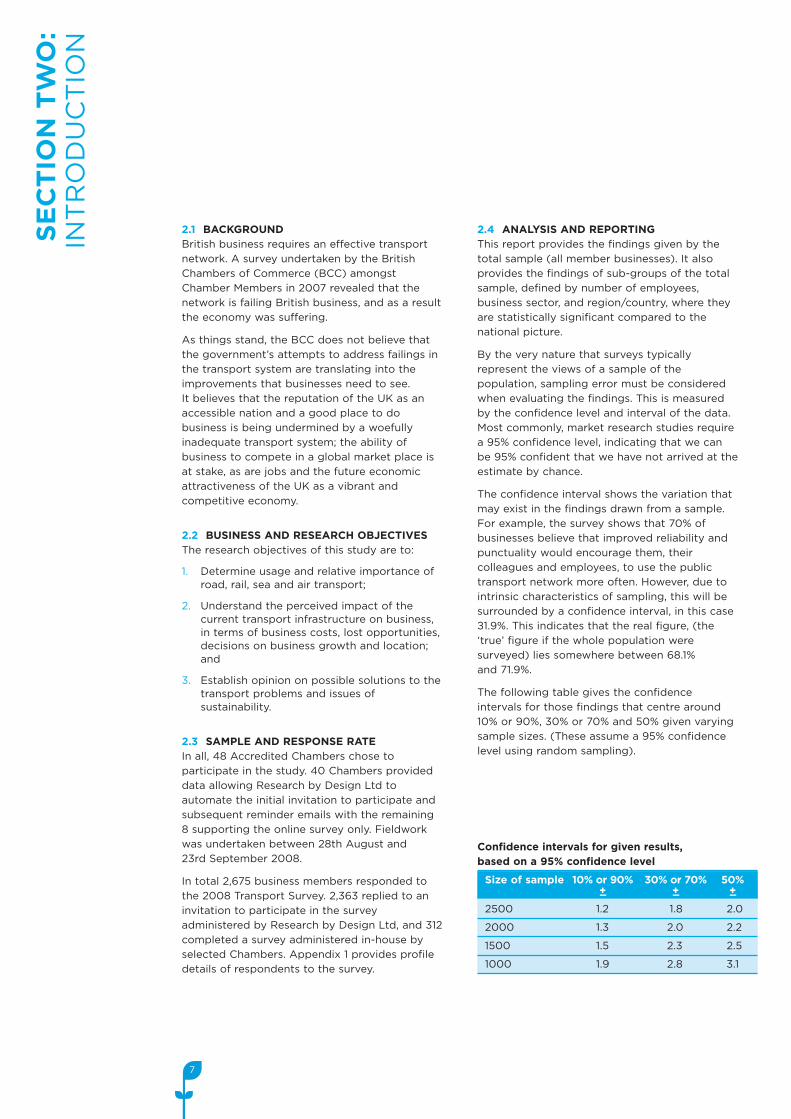
The following table gives the confidence
intervals for those findings that centre around
10% or 90%, 30% or 70% and 50% given varying
sample sizes. (These assume a 95% confidence
level using random sampling).
7
SECTIONTWO:
INTRODUCTION
Confidence intervals for given results,based on a 95% confidence level
Size of sample 10% or 90% 30% or 70% 50%+_ +_ +_
2500 1.2 1.8 2.0
2000 1.3 2.0 2.2
1500 1.5 2.3 2.5
1000 1.9 2.8 3.1
When comparing the results from different groups
within a sample, for instance those with less than
50 employees and those with 50 or more, the
difference in results are tested for statistical
significance. This way we know whether the
differences are ‘real’ or whether they could have
occurred by chance. The test reflects the size of
the samples, the percentage giving a certain
answer and the degree of confidence chosen.
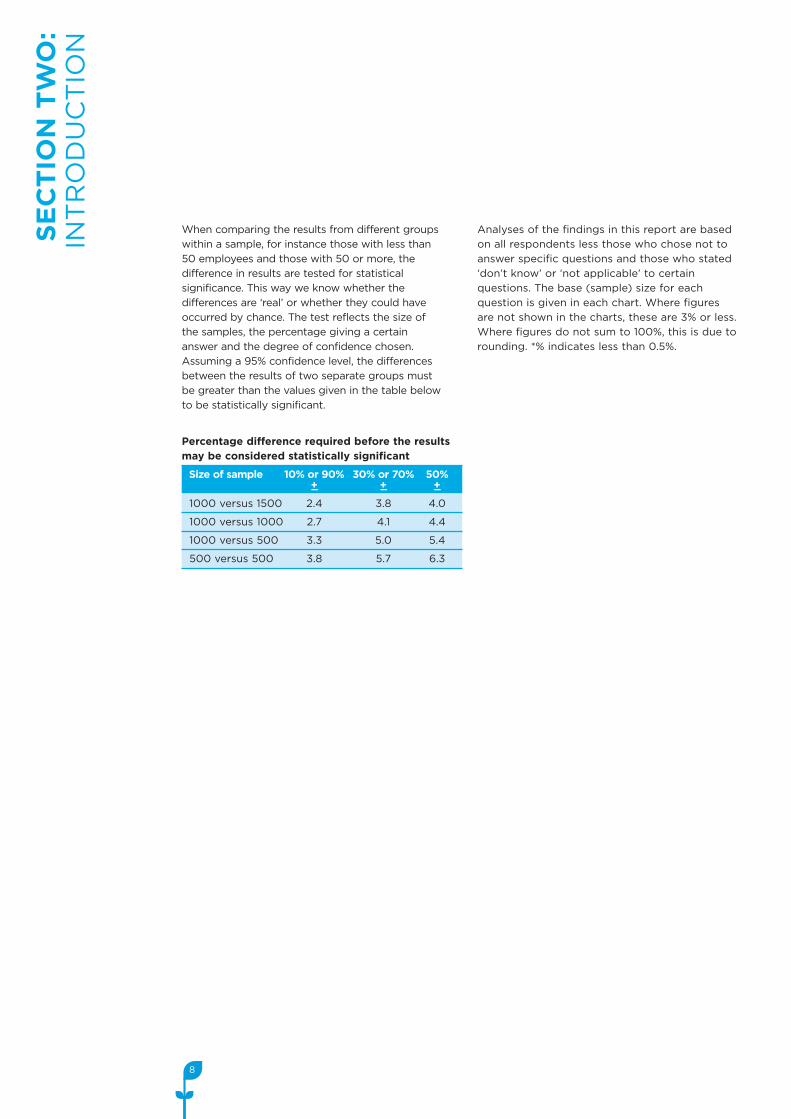
Assuming a 95% confidence level, the differences
between the results of two separate groups must
be greater than the values given in the table below
to be statistically significant.
Analyses of the findings in this report are based
on all respondents less those who chose not to
answer specific questions and those who stated
‘don’t know’ or ‘not applicable’ to certain
questions. The base (sample) size for each
question is given in each chart. Where figures
are not shown in the charts, these are 3% or less.
Where figures do not sum to 100%, this is due to
rounding. *% indicates less than 0.5%.
8
Percentage difference required before the resultsmay be considered statistically significant
Size of sample 10% or 90% 30% or 70% 50%+_ +_ +_
1000 versus 1500 2.4 3.8 4.0
1000 versus 1000 2.7 4.1 4.4
1000 versus 500 3.3 5.0 5.4
500 versus 500 3.8 5.7 6.3
SECTIONTWO:
INTRODUCTION
9
SECTIONTHREE:
TRANSPORT
INFRASTRUCTURE
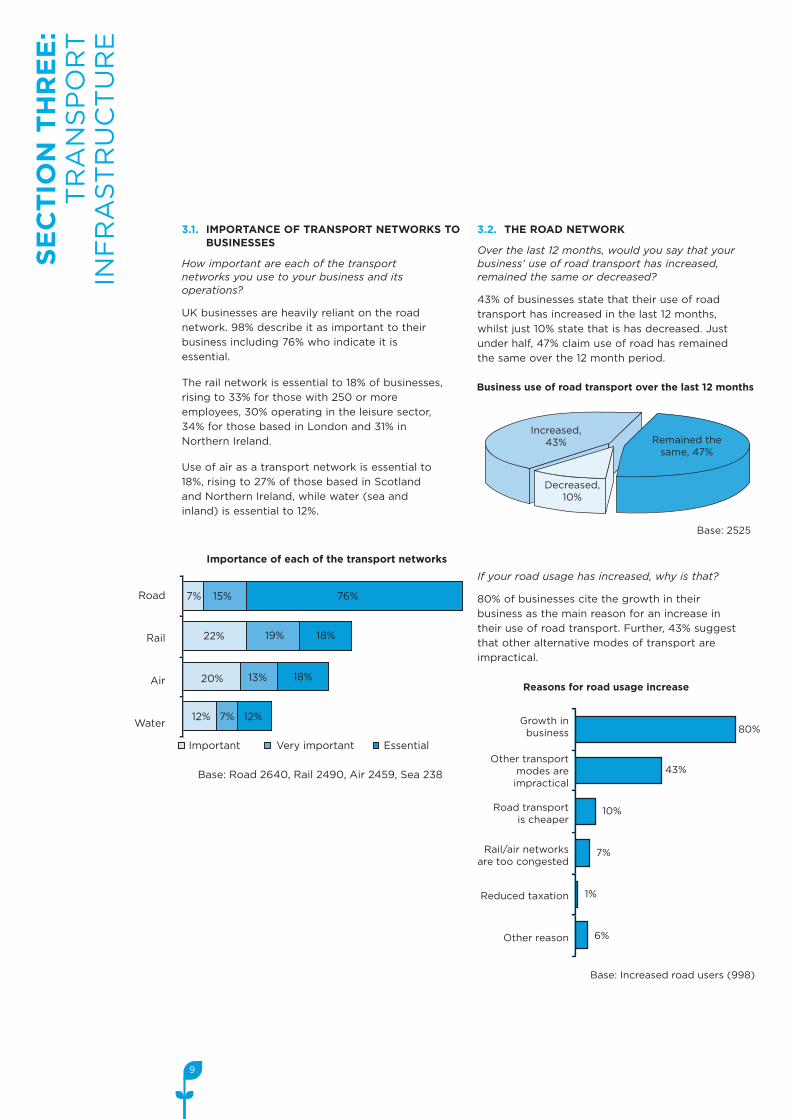
3.1. IMPORTANCE OF TRANSPORT NETWORKS TOBUSINESSES
How important are each of the transportnetworks you use to your business and itsoperations?
UK businesses are heavily reliant on the road
network. 98% describe it as important to their
business including 76% who indicate it is
essential.
The rail network is essential to 18% of businesses,
rising to 33% for those with 250 or more
employees, 30% operating in the leisure sector,
34% for those based in London and 31% in
Northern Ireland.
Use of air as a transport network is essential to
18%, rising to 27% of those based in Scotland
and Northern Ireland, while water (sea and
inland) is essential to 12%.
3.2. THE ROAD NETWORK
Over the last 12 months, would you say that yourbusiness’ use of road transport has increased,remained the same or decreased?
43% of businesses state that their use of road
transport has increased in the last 12 months,
whilst just 10% state that is has decreased. Just
under half, 47% claim use of road has remained
the same over the 12 month period.
If your road usage has increased, why is that?
80% of businesses cite the growth in their
business as the main reason for an increase in
their use of road transport. Further, 43% suggest
that other alternative modes of transport are
impractical.
Road
Rail
Air
Water
Importance of each of the transport networks
Base: Road 2640, Rail 2490, Air 2459, Sea 238
7%
7%
15% 76%
19% 18%
18%13%
22%
20%
12% 12%
Important Very important Essential
Business use of road transport over the last 12 months
Base: 2525
Increased,43%
Decreased,10%
Remained thesame, 47%
Growth inbusiness
Other transportmodes areimpractical
Road transportis cheaper
Rail/air networksare too congested
Reduced taxation
Other reason
Reasons for road usage increase
80%
43%
10%
7%
1%
6%
Base: Increased road users (998)
10
SECTIONTHREE:
TRANSPORT
INFRASTRUCTURE
Fuel costs
Change inbusiness needs
Roadcongestion
Increasedtaxation
Rail ischeaper
Air ischeaper
Otherreason
Reasons for road usage decrease
57%
41%
38%
14%
11%
2%
19%
Base: Decreased road users (238)
Problem of road congestion for business
41%
Base: 2435 2404 2322
A significantproblem
Somewhatof aproblem
Not aproblemat all 15%
Locally Regionally Nationally
45%
40%
44%
46%
46%
39%
15%15% 10%
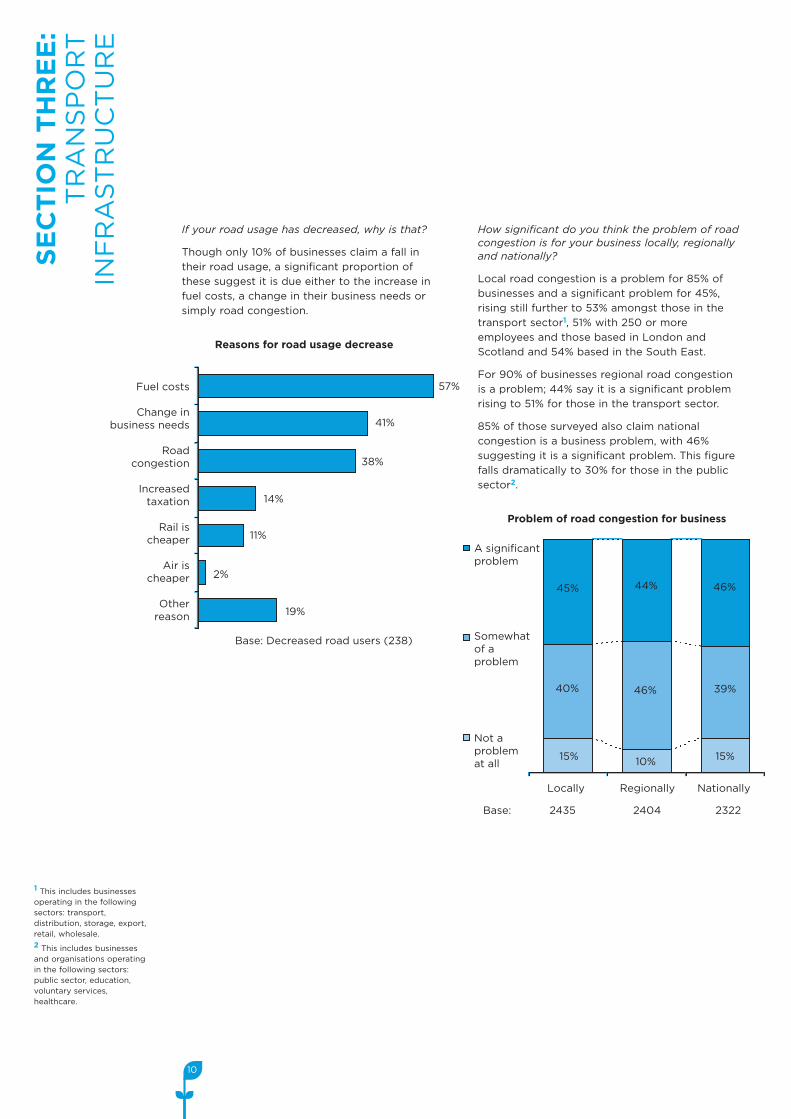
If your road usage has decreased, why is that?
Though only 10% of businesses claim a fall in
their road usage, a significant proportion of
these suggest it is due either to the increase in
fuel costs, a change in their business needs or
simply road congestion.
How significant do you think the problem of roadcongestion is for your business locally, regionallyand nationally?
Local road congestion is a problem for 85% of
businesses and a significant problem for 45%,
rising still further to 53% amongst those in the
transport sector1, 51% with 250 or more
employees and those based in London and
Scotland and 54% based in the South East.
For 90% of businesses regional road congestion
is a problem; 44% say it is a significant problem
rising to 51% for those in the transport sector.
85% of those surveyed also claim national
congestion is a business problem, with 46%
suggesting it is a significant problem. This figure
falls dramatically to 30% for those in the public
sector2.
1 This includes businessesoperating in the followingsectors: transport,distribution, storage, export,retail, wholesale.
2 This includes businessesand organisations operatingin the following sectors:public sector, education,voluntary services,healthcare.
11
SECTIONTHREE:
TRANSPORT
INFRASTRUCTURE
Main causes of congestion
Base: 2401 2291 2211Local roads A roads Motorways87%
23%
3%
52%
75%78%
49%49%
24%
48%53%
47%44%
54%
61%
10% 10%8%
16%
44%46%
Schoolrun
Sheer volumeof traffic
Poor roaddesign &planning
Lack ofalternatives
Poor drivingbehaviour
Roadaccidents
Otherproblems
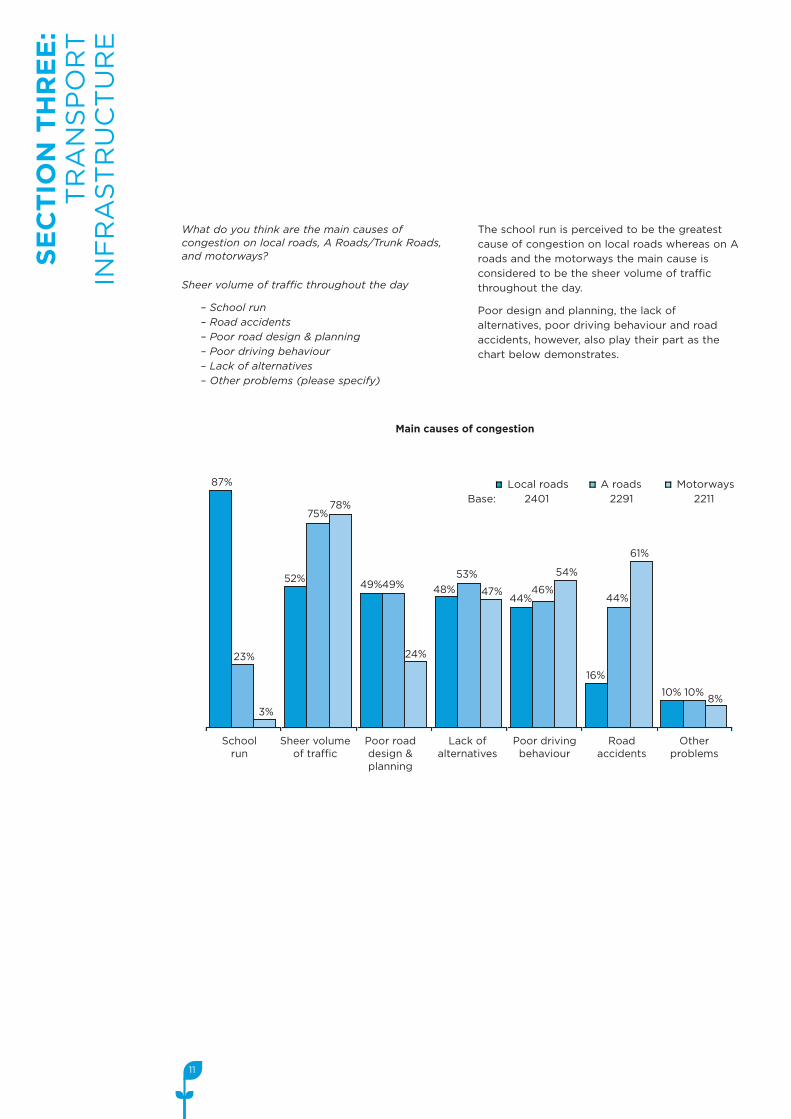
What do you think are the main causes ofcongestion on local roads, A Roads/Trunk Roads,and motorways?
Sheer volume of traffic throughout the day
– School run– Road accidents– Poor road design & planning– Poor driving behaviour– Lack of alternatives– Other problems (please specify)
The school run is perceived to be the greatest
cause of congestion on local roads whereas on A
roads and the motorways the main cause is
considered to be the sheer volume of traffic
throughout the day.
Poor design and planning, the lack of
alternatives, poor driving behaviour and road
accidents, however, also play their part as the
chart below demonstrates.
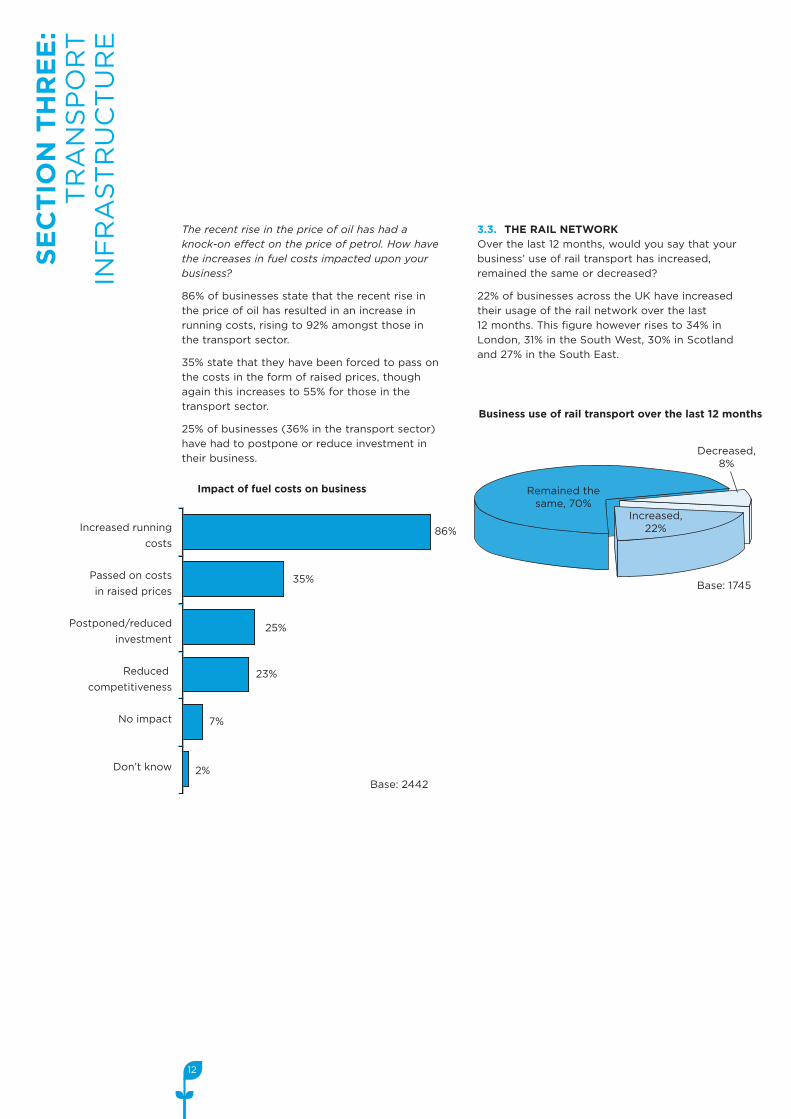
The recent rise in the price of oil has had aknock-on effect on the price of petrol. How havethe increases in fuel costs impacted upon yourbusiness?
86% of businesses state that the recent rise in
the price of oil has resulted in an increase in
running costs, rising to 92% amongst those in
the transport sector.
35% state that they have been forced to pass on
the costs in the form of raised prices, though
again this increases to 55% for those in the
transport sector.
25% of businesses (36% in the transport sector)
have had to postpone or reduce investment in
their business.
3.3. THE RAIL NETWORKOver the last 12 months, would you say that your
business’ use of rail transport has increased,
remained the same or decreased?
22% of businesses across the UK have increased
their usage of the rail network over the last
12 months. This figure however rises to 34% in
London, 31% in the South West, 30% in Scotland
and 27% in the South East.
12
SECTIONTHREE:
TRANSPORT
INFRASTRUCTURE
Increased runningcosts
Passed on costsin raised prices
Postponed/reducedinvestment
Reducedcompetitiveness
No impact
Don’t know
Impact of fuel costs on business
Base: 2442
86%
35%
25%
23%
7%
2%
Business use of rail transport over the last 12 months
Base: 1745
Decreased,8%
Remained thesame, 70%
Increased,22%
SECTIONTHREE:
TRANSPORT
INFRASTRUCTURE
13
Road network istoo congested
Easier accessto city centre
Ability to work on trains
Environmental reasons
Change inbusiness needs
Rail transport is cheaper
Improved schedulingand capacity
Concerns about security at airports
Other
Reasons for rail usage increase
Base: Increased rail users (377)
54%
54%
53%
29%
20%
19%
12%
2%
5%
Poor scheduling
Other transportcheaper
Change inbusiness needs
Other transportless congested
Environmentalreasons
Other
Reasons for rail usage decrease
Base: Decreased rail users (132)
52%
51%
29%
14%
2%
9%
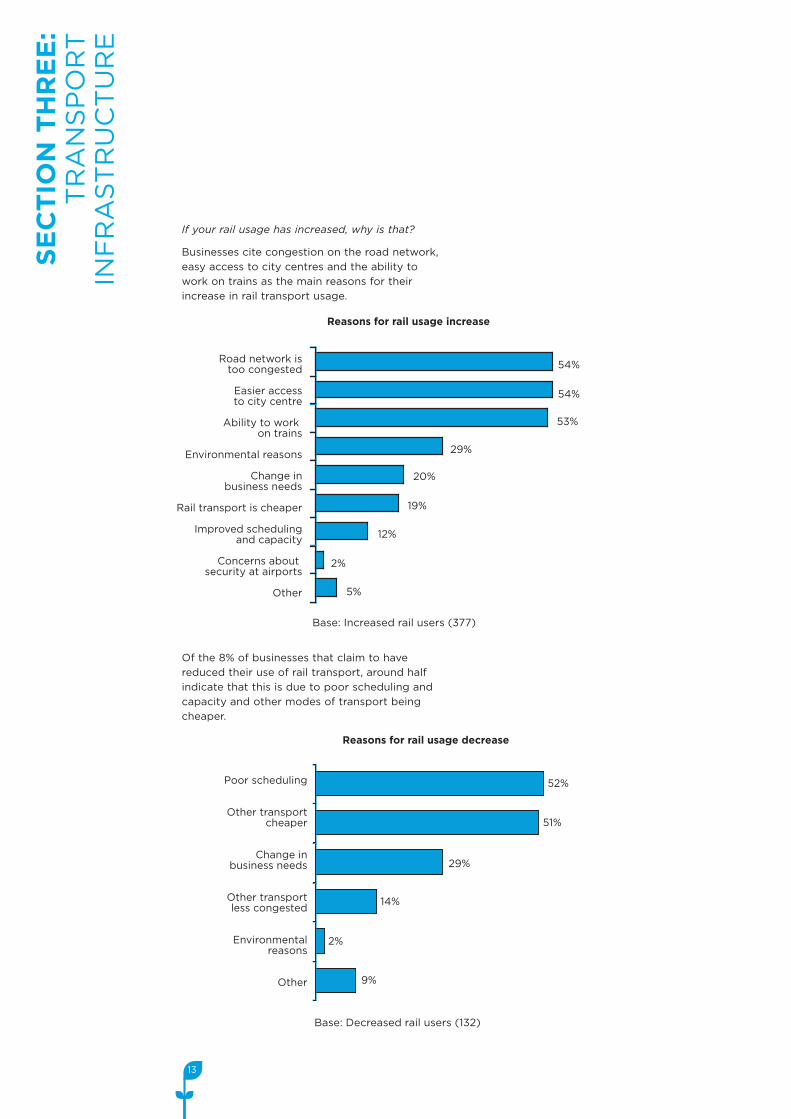
If your rail usage has increased, why is that?
Businesses cite congestion on the road network,
easy access to city centres and the ability to
work on trains as the main reasons for their
increase in rail transport usage.
Of the 8% of businesses that claim to have
reduced their use of rail transport, around half
indicate that this is due to poor scheduling and
capacity and other modes of transport being
cheaper.
14
SECTIONTHREE:
TRANSPORT
INFRASTRUCTURE
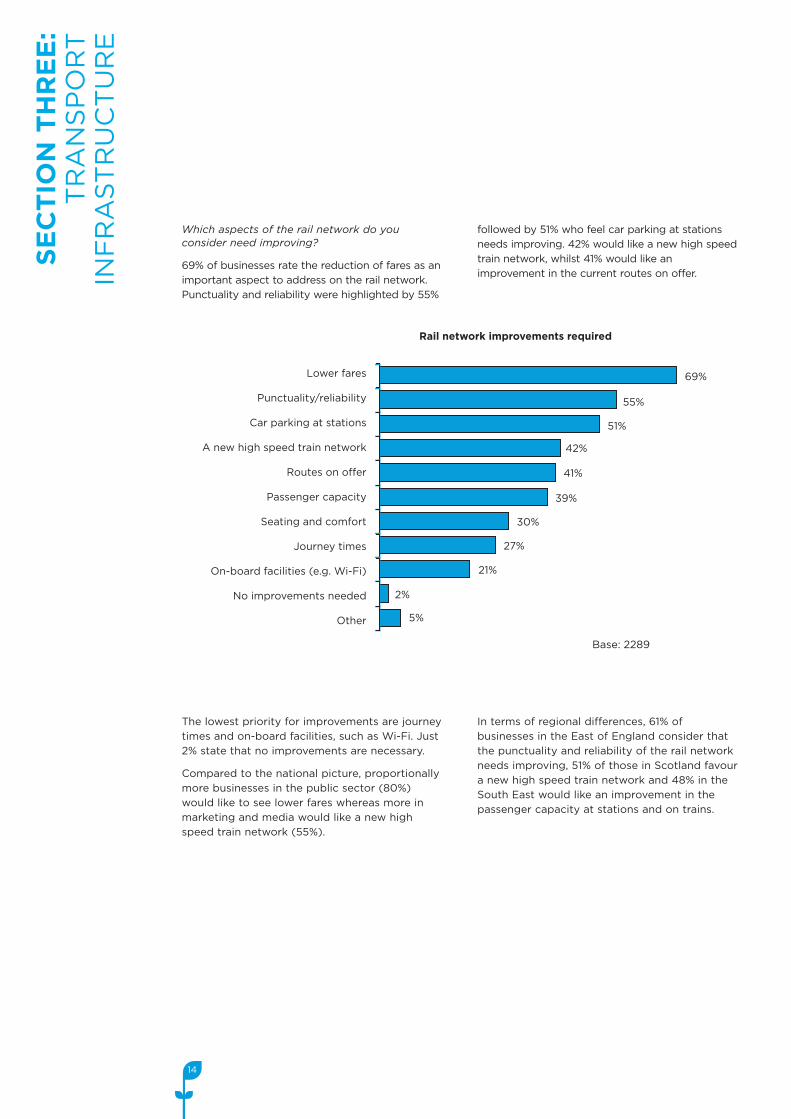
Which aspects of the rail network do youconsider need improving?
69% of businesses rate the reduction of fares as an
important aspect to address on the rail network.
Punctuality and reliability were highlighted by 55%
followed by 51% who feel car parking at stations
needs improving. 42% would like a new high speed
train network, whilst 41% would like an
improvement in the current routes on offer.
The lowest priority for improvements are journey
times and on-board facilities, such as Wi-Fi. Just
2% state that no improvements are necessary.
Compared to the national picture, proportionally
more businesses in the public sector (80%)
would like to see lower fares whereas more in
marketing and media would like a new high
speed train network (55%).
In terms of regional differences, 61% of
businesses in the East of England consider that
the punctuality and reliability of the rail network
needs improving, 51% of those in Scotland favour
a new high speed train network and 48% in the
South East would like an improvement in the
passenger capacity at stations and on trains.
Lower fares
Punctuality/reliability
Car parking at stations
A new high speed train network
Routes on offer
Passenger capacity
Seating and comfort
Journey times
On-board facilities (e.g. Wi-Fi)
No improvements needed
Other
Rail network improvements required
Base: 2289
69%
55%
51%
42%
41%
39%
30%
27%
21%
2%
5%
15
SECTIONTHREE:
TRANSPORT
INFRASTRUCTURE
3.4. THE AIR NETWORK
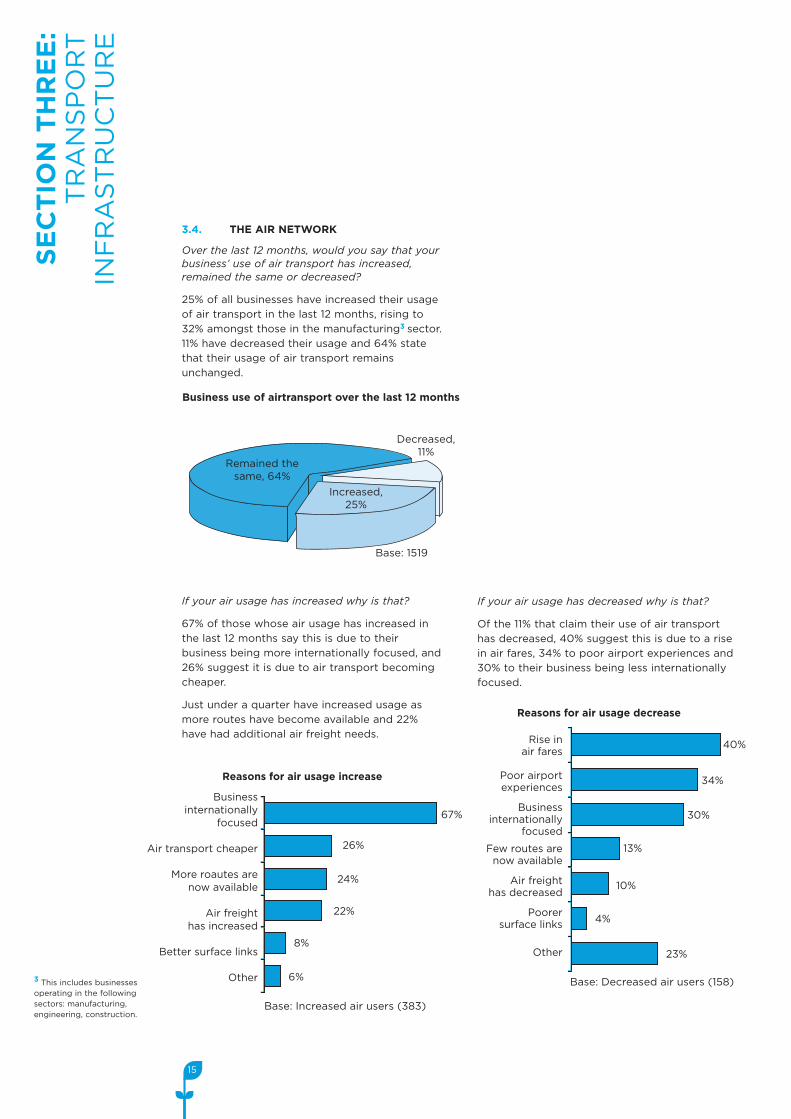
Over the last 12 months, would you say that yourbusiness’ use of air transport has increased,remained the same or decreased?
25% of all businesses have increased their usage
of air transport in the last 12 months, rising to
32% amongst those in the manufacturing3 sector.
11% have decreased their usage and 64% state
that their usage of air transport remains
unchanged.
If your air usage has increased why is that?
67% of those whose air usage has increased in
the last 12 months say this is due to their
business being more internationally focused, and
26% suggest it is due to air transport becoming
cheaper.
Just under a quarter have increased usage as
more routes have become available and 22%
have had additional air freight needs.
Business use of airtransport over the last 12 months
Base: 1519
Decreased,11%
Remained thesame, 64%
Increased,25%
Businessinternationally
focused
Air transport cheaper
More roautes arenow available
Air freighthas increased
Better surface links
Other
Reasons for air usage increase
Base: Increased air users (383)
67%
26%
24%
22%
8%
6%
Rise inair fares
Poor airportexperiences
Businessinternationally
focused
Few routes arenow available
Air freighthas decreased
Poorersurface links
Other
Reasons for air usage decrease
Base: Decreased air users (158)
40%
34%
30%
13%
10%
4%
23%
If your air usage has decreased why is that?
Of the 11% that claim their use of air transport
has decreased, 40% suggest this is due to a rise
in air fares, 34% to poor airport experiences and
30% to their business being less internationally
focused.
3 This includes businessesoperating in the followingsectors: manufacturing,engineering, construction.
Management of
passengers
Punctuality/reliability
Transfer/waiting times
Lower fares
Routes on offer
Seating and comfort
Aspect of air transport considered to need improving the most
Base: 1855 to 1957
1st - Highest priority 2nd 3rd 4th 5th 6th
39% 25% 16% 6% 6% 8%
35% 23% 23% 8% 7% 5%
26% 28% 22% 12% 7% 6%
26% 20% 25% 11% 9% 9%
23% 24% 23% 11% 8% 10%
14% 20% 24% 14% 14% 14%
16
SECTIONTHREE:
TRANSPORT
INFRASTRUCTURE
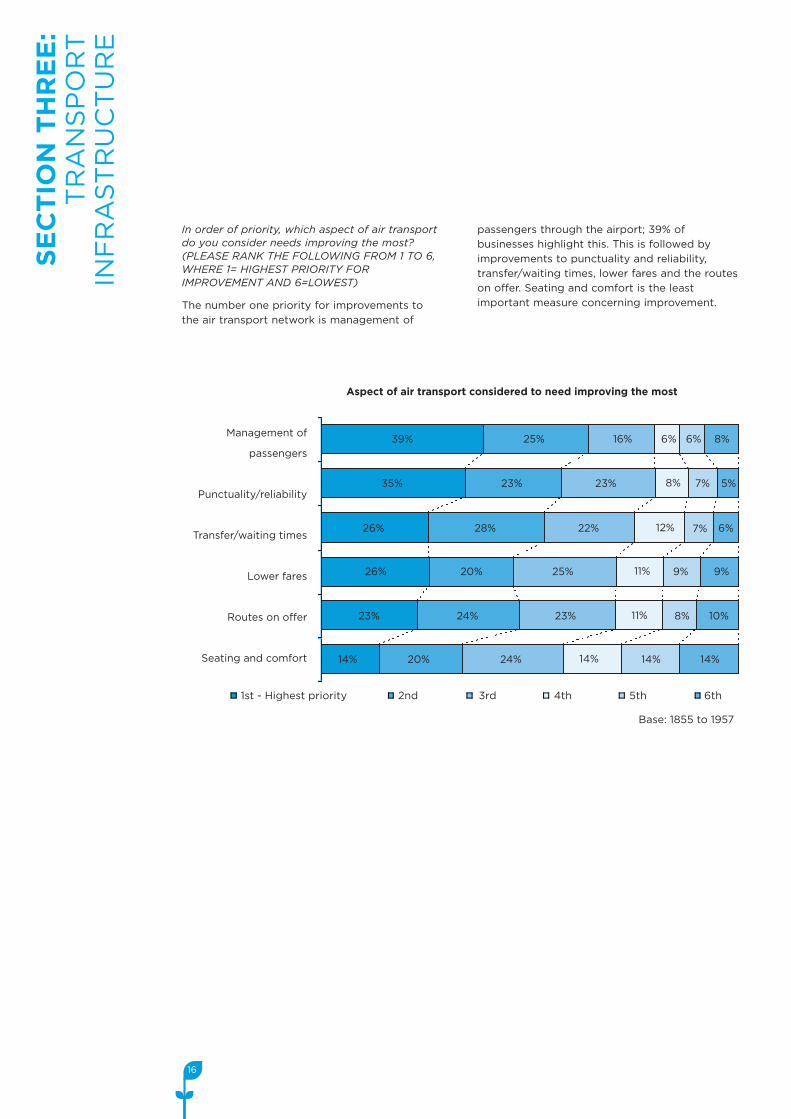
In order of priority, which aspect of air transportdo you consider needs improving the most?(PLEASE RANK THE FOLLOWING FROM 1 TO 6,WHERE 1= HIGHEST PRIORITY FORIMPROVEMENT AND 6=LOWEST)
The number one priority for improvements to
the air transport network is management of
passengers through the airport; 39% of
businesses highlight this. This is followed by
improvements to punctuality and reliability,
transfer/waiting times, lower fares and the routes
on offer. Seating and comfort is the least
important measure concerning improvement.
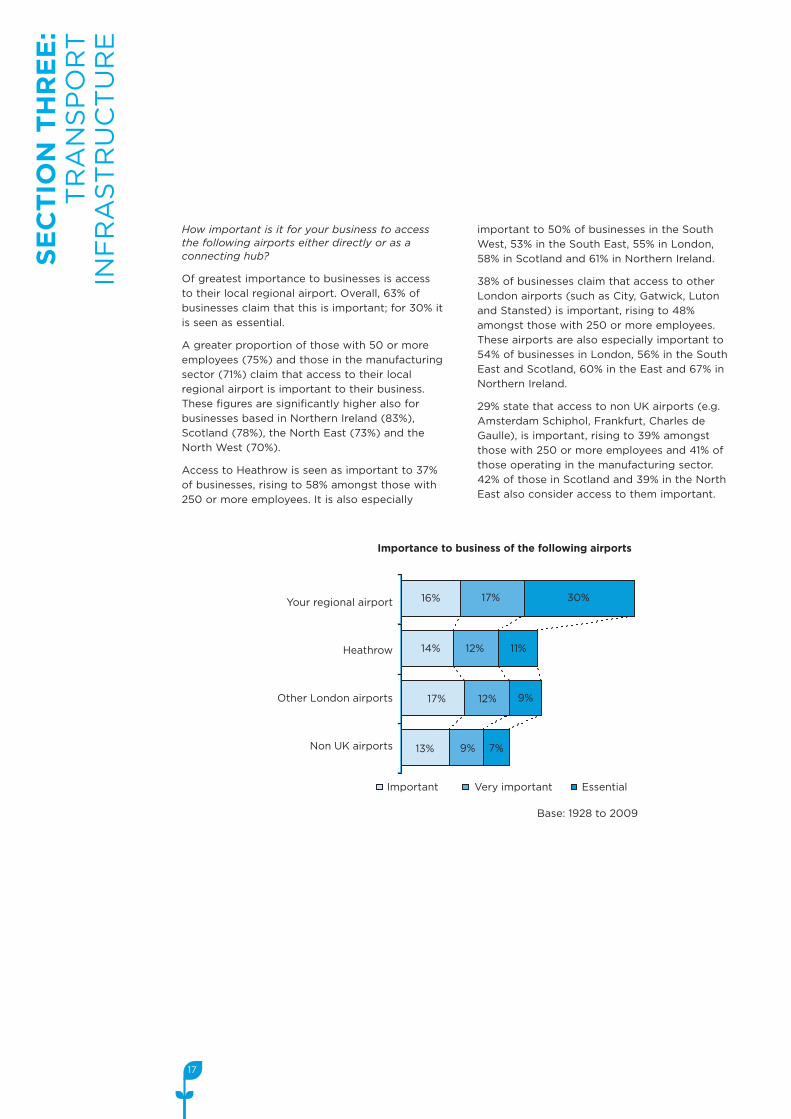
How important is it for your business to accessthe following airports either directly or as aconnecting hub?
Of greatest importance to businesses is access
to their local regional airport. Overall, 63% of
businesses claim that this is important; for 30% it
is seen as essential.
A greater proportion of those with 50 or more
employees (75%) and those in the manufacturing
sector (71%) claim that access to their local
regional airport is important to their business.
These figures are significantly higher also for
businesses based in Northern Ireland (83%),
Scotland (78%), the North East (73%) and the
North West (70%).
Access to Heathrow is seen as important to 37%
of businesses, rising to 58% amongst those with
250 or more employees. It is also especially
important to 50% of businesses in the South
West, 53% in the South East, 55% in London,
58% in Scotland and 61% in Northern Ireland.
38% of businesses claim that access to other
London airports (such as City, Gatwick, Luton
and Stansted) is important, rising to 48%
amongst those with 250 or more employees.
These airports are also especially important to
54% of businesses in London, 56% in the South
East and Scotland, 60% in the East and 67% in
Northern Ireland.
29% state that access to non UK airports (e.g.
Amsterdam Schiphol, Frankfurt, Charles de
Gaulle), is important, rising to 39% amongst
those with 250 or more employees and 41% of
those operating in the manufacturing sector.
42% of those in Scotland and 39% in the North
East also consider access to them important.
17
SECTIONTHREE:
TRANSPORT
INFRASTRUCTURE
Your regional airport
Heathrow
Other London airports
Non UK airports
Importance to business of the following airports
Base: 1928 to 2009
Important Very important Essential
13%
12%
12% 11%
30%
14%
16%
17%
17%
7%9%
9%
18
SECTIONTHREE:
TRANSPORT
INFRASTRUCTURE
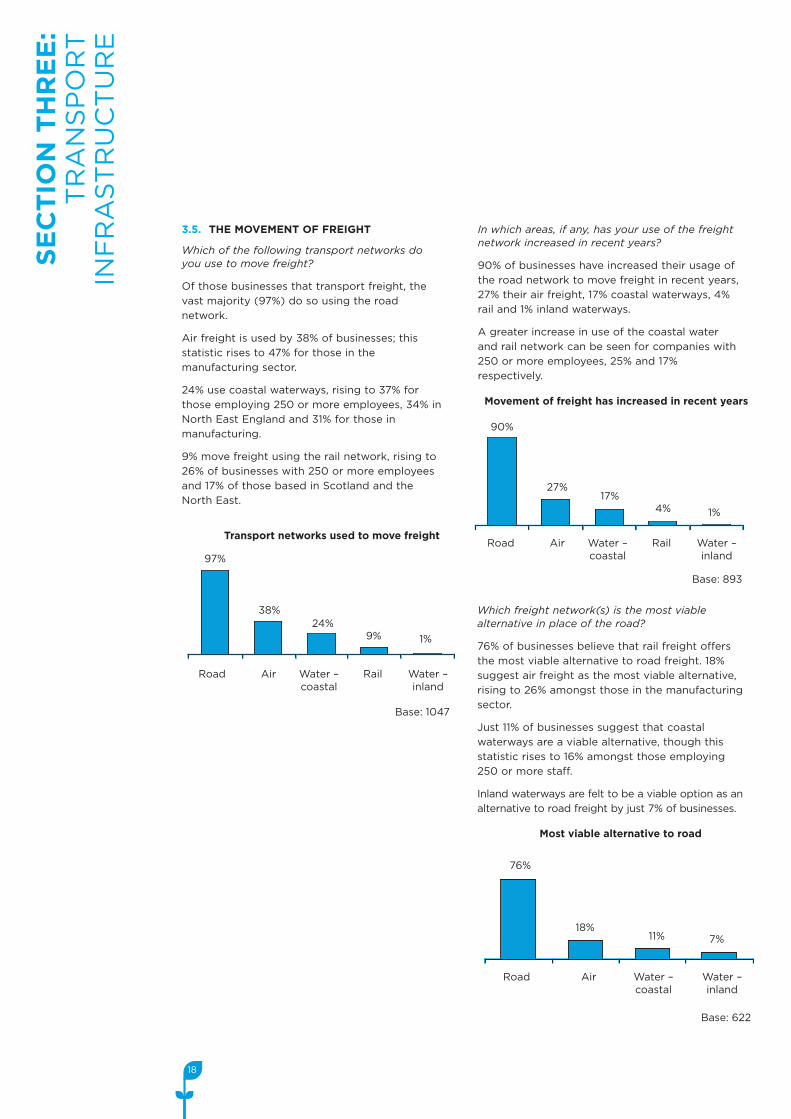
3.5. THE MOVEMENT OF FREIGHT
Which of the following transport networks doyou use to move freight?
Of those businesses that transport freight, the
vast majority (97%) do so using the road
network.
Air freight is used by 38% of businesses; this
statistic rises to 47% for those in the
manufacturing sector.
24% use coastal waterways, rising to 37% for
those employing 250 or more employees, 34% in
North East England and 31% for those in
manufacturing.
9% move freight using the rail network, rising to
26% of businesses with 250 or more employees
and 17% of those based in Scotland and the
North East.
In which areas, if any, has your use of the freightnetwork increased in recent years?
90% of businesses have increased their usage of
the road network to move freight in recent years,
27% their air freight, 17% coastal waterways, 4%
rail and 1% inland waterways.
A greater increase in use of the coastal water
and rail network can be seen for companies with
250 or more employees, 25% and 17%
respectively.
Transport networks used to move freight
M
97%
38%24%
Road Air Water –coastal
Rail Water –inland
9% 1%
1
Base: 1047
B
Movement of freight has increased in recent years
90%
Road Air Water –coastal
Rail Water –inland
R
27%17%
1%4%
Base: 893
Most viable alternative to road
76%
18%11%
Road Air Water –coastal
Water –inland
7%
Base: 622
Which freight network(s) is the most viablealternative in place of the road?
76% of businesses believe that rail freight offers
the most viable alternative to road freight. 18%
suggest air freight as the most viable alternative,
rising to 26% amongst those in the manufacturing
sector.
Just 11% of businesses suggest that coastal
waterways are a viable alternative, though this
statistic rises to 16% amongst those employing
250 or more staff.
Inland waterways are felt to be a viable option as an
alternative to road freight by just 7% of businesses.
19
SECTIONTHREE:
TRANSPORT
INFRASTRUCTURE
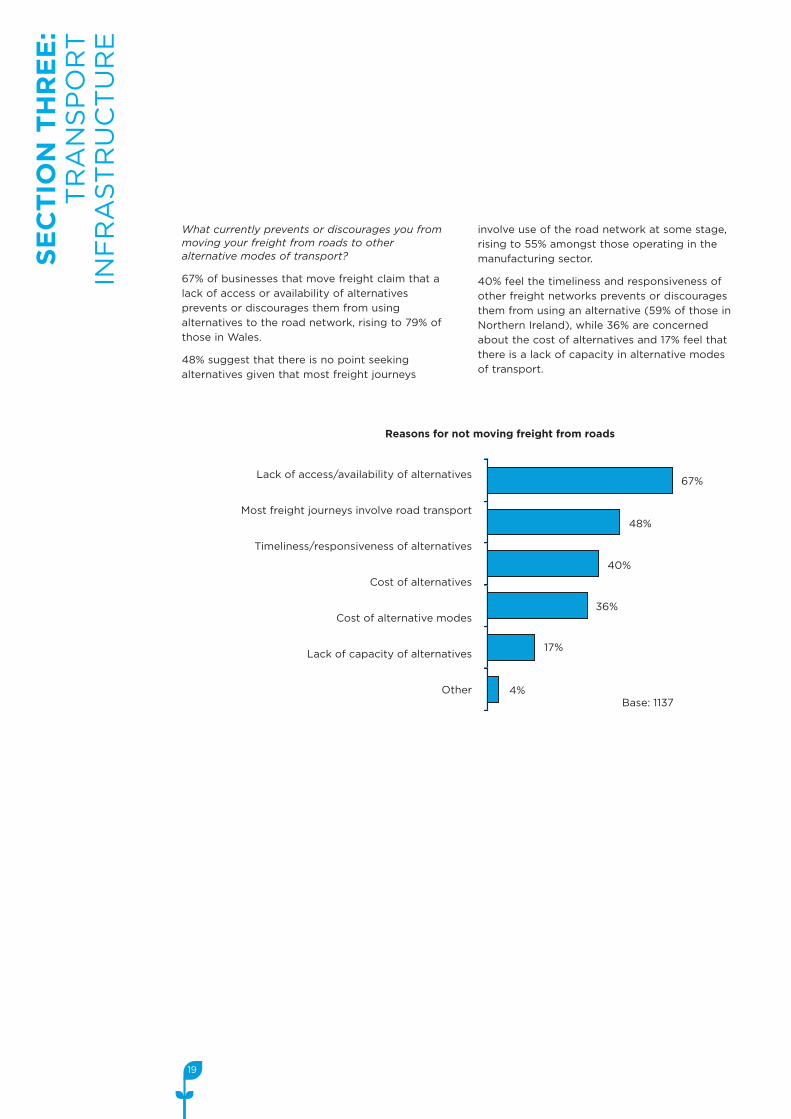
What currently prevents or discourages you frommoving your freight from roads to otheralternative modes of transport?
67% of businesses that move freight claim that a
lack of access or availability of alternatives
prevents or discourages them from using
alternatives to the road network, rising to 79% of
those in Wales.
48% suggest that there is no point seeking
alternatives given that most freight journeys
involve use of the road network at some stage,
rising to 55% amongst those operating in the
manufacturing sector.
40% feel the timeliness and responsiveness of
other freight networks prevents or discourages
them from using an alternative (59% of those in
Northern Ireland), while 36% are concerned
about the cost of alternatives and 17% feel that
there is a lack of capacity in alternative modes
of transport.
Lack of access/availability of alternatives
Most freight journeys involve road transport
Timeliness/responsiveness of alternatives
Cost of alternatives
Cost of alternative modes
Lack of capacity of alternatives
Other
Reasons for not moving freight from roads
67%
48%
40%
36%
17%
4%Base: 1137
20
SECTIONFOUR:
TRANSPORTINFRASTRUCTURE
ANDITSEFFECTONBUSINESS
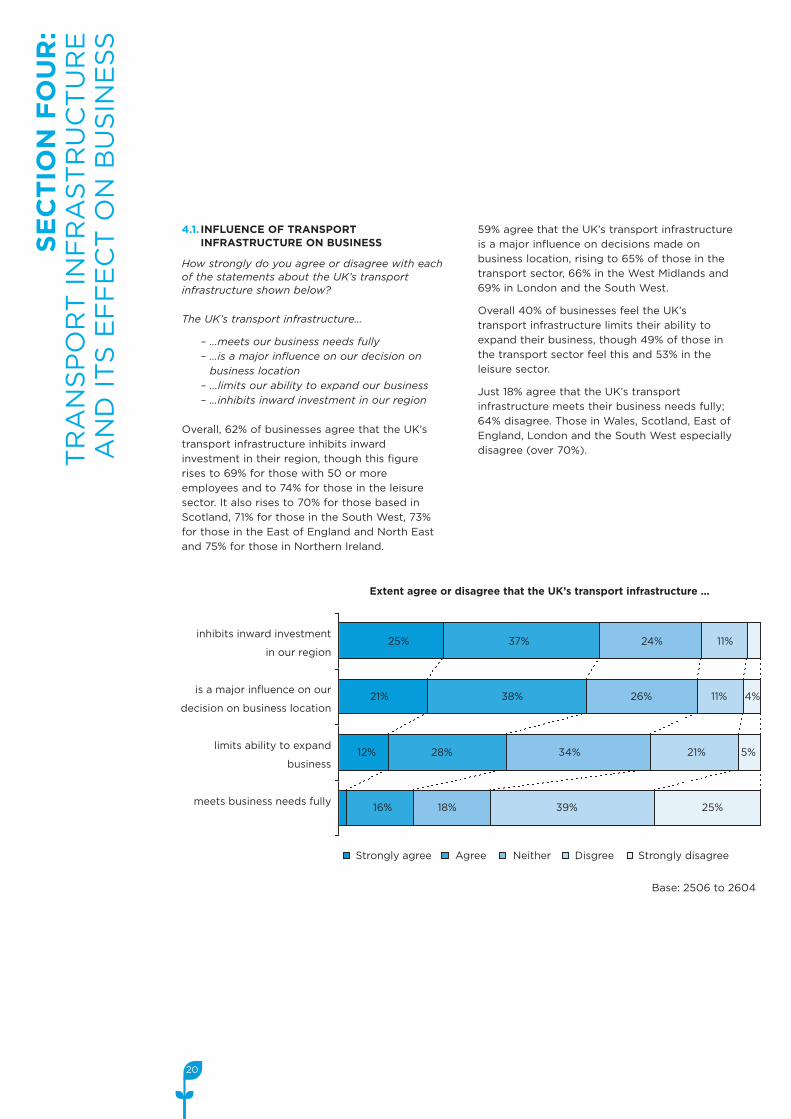
4.1. INFLUENCE OF TRANSPORTINFRASTRUCTURE ON BUSINESS
How strongly do you agree or disagree with eachof the statements about the UK’s transportinfrastructure shown below?
The UK’s transport infrastructure…
– …meets our business needs fully– …is a major influence on our decision onbusiness location
– ...limits our ability to expand our business– …inhibits inward investment in our region
Overall, 62% of businesses agree that the UK’s
transport infrastructure inhibits inward
investment in their region, though this figure
rises to 69% for those with 50 or more
employees and to 74% for those in the leisure
sector. It also rises to 70% for those based in
Scotland, 71% for those in the South West, 73%
for those in the East of England and North East
and 75% for those in Northern Ireland.
59% agree that the UK’s transport infrastructure
is a major influence on decisions made on
business location, rising to 65% of those in the
transport sector, 66% in the West Midlands and
69% in London and the South West.
Overall 40% of businesses feel the UK’s
transport infrastructure limits their ability to
expand their business, though 49% of those in
the transport sector feel this and 53% in the
leisure sector.
Just 18% agree that the UK’s transport
infrastructure meets their business needs fully;
64% disagree. Those in Wales, Scotland, East of
England, London and the South West especially
disagree (over 70%).
inhibits inward investment
in our region
is a major influence on our
decision on business location
limits ability to expand
business
meets business needs fully
Extent agree or disagree that the UK’s transport infrastructure …
Base: 2506 to 2604
Strongly agree Strongly disagreeAgree Neither Disgree
18% 39% 25%16%
28% 34% 21% 5%12%
38% 26% 11% 4%21%
37% 24% 11%25%
21
SECTIONFOUR:
TRANSPORTINFRASTRUCTURE
ANDITSEFFECTONBUSINESS
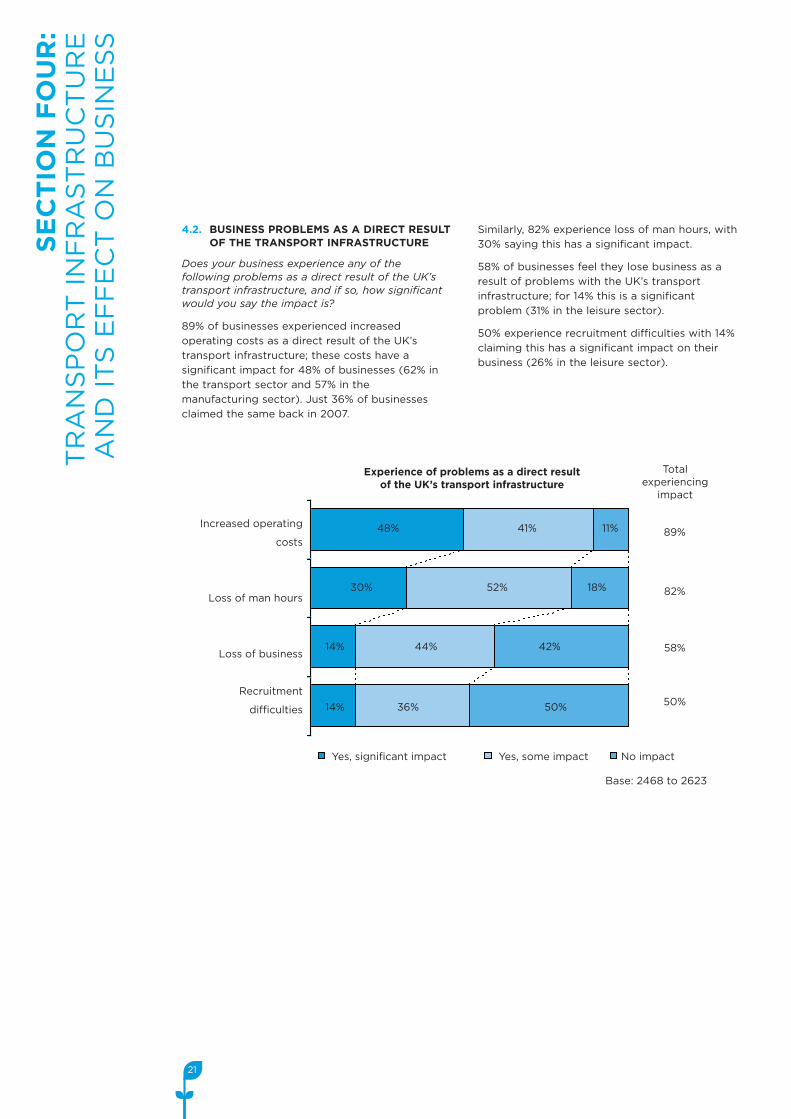
4.2. BUSINESS PROBLEMS AS A DIRECT RESULTOF THE TRANSPORT INFRASTRUCTURE
Does your business experience any of thefollowing problems as a direct result of the UK’stransport infrastructure, and if so, how significantwould you say the impact is?
89% of businesses experienced increased
operating costs as a direct result of the UK’s
transport infrastructure; these costs have a
significant impact for 48% of businesses (62% in
the transport sector and 57% in the
manufacturing sector). Just 36% of businesses
claimed the same back in 2007.
Similarly, 82% experience loss of man hours, with
30% saying this has a significant impact.
58% of businesses feel they lose business as a
result of problems with the UK’s transport
infrastructure; for 14% this is a significant
problem (31% in the leisure sector).
50% experience recruitment difficulties with 14%
claiming this has a significant impact on their
business (26% in the leisure sector).
Increased operating
costs
Loss of man hours
Loss of business
Recruitment
difficulties
Experience of problems as a direct resultof the UK’s transport infrastructure
Base: 2468 to 2623
Yes, significant impact Yes, some impact No impact
Totalexperiencing
impact
89%
82%
58%
50%50%36%14%
14% 44%
48% 41% 11%
52%30% 18%
42%
22
SECTIONFOUR:
TRANSPORTINFRASTRUCTURE
ANDITSEFFECTONBUSINESS
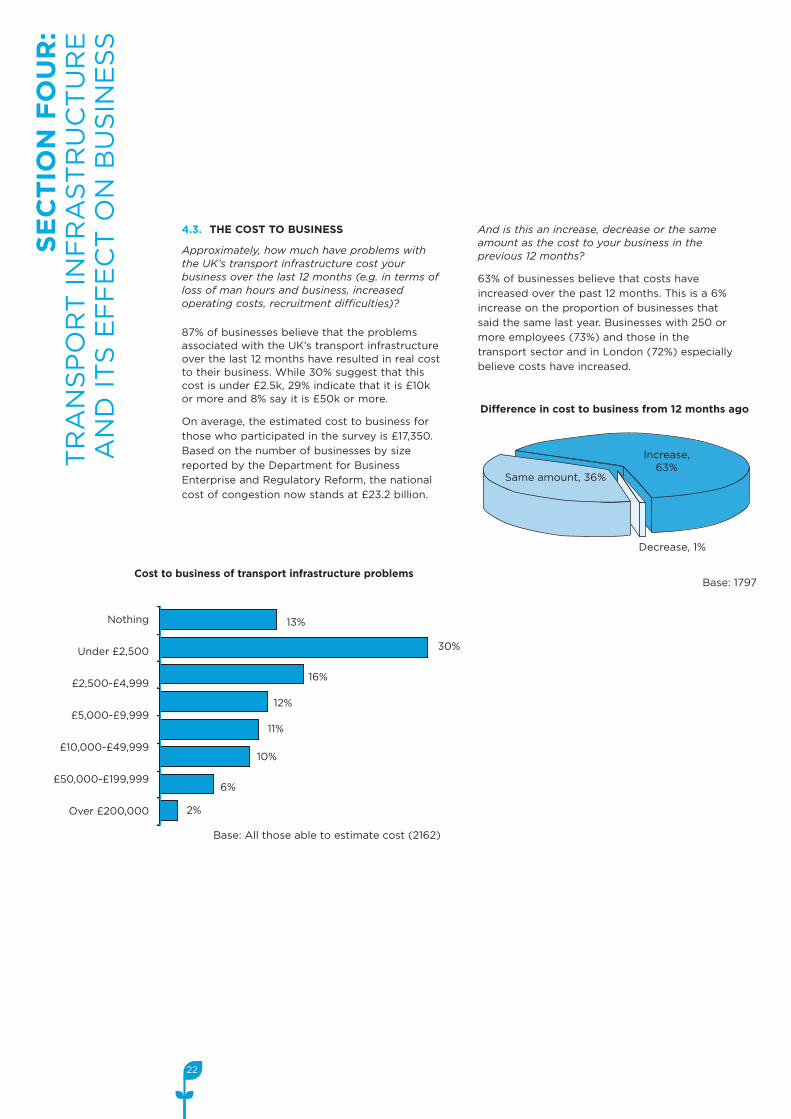
4.3. THE COST TO BUSINESS
Approximately, how much have problems withthe UK’s transport infrastructure cost yourbusiness over the last 12 months (e.g. in terms ofloss of man hours and business, increasedoperating costs, recruitment difficulties)?
87% of businesses believe that the problemsassociated with the UK’s transport infrastructureover the last 12 months have resulted in real costto their business. While 30% suggest that thiscost is under £2.5k, 29% indicate that it is £10kor more and 8% say it is £50k or more.
On average, the estimated cost to business for
those who participated in the survey is £17,350.
Based on the number of businesses by size
reported by the Department for Business
Enterprise and Regulatory Reform, the national
cost of congestion now stands at £23.2 billion.
And is this an increase, decrease or the sameamount as the cost to your business in theprevious 12 months?
63% of businesses believe that costs have
increased over the past 12 months. This is a 6%
increase on the proportion of businesses that
said the same last year. Businesses with 250 or
more employees (73%) and those in the
transport sector and in London (72%) especially
believe costs have increased.
Nothing
Under £2,500
£2,500-£4,999
£5,000-£9,999
£10,000-£49,999
£50,000-£199,999
Over £200,000
Cost to business of transport infrastructure problems
Base: All those able to estimate cost (2162)
6%
11%
10%
16%
13%
30%
12%
2%
Di�erence in cost to business from 12 months ago
Base: 1797
Decrease, 1%
Increase,63%
Same amount, 36%
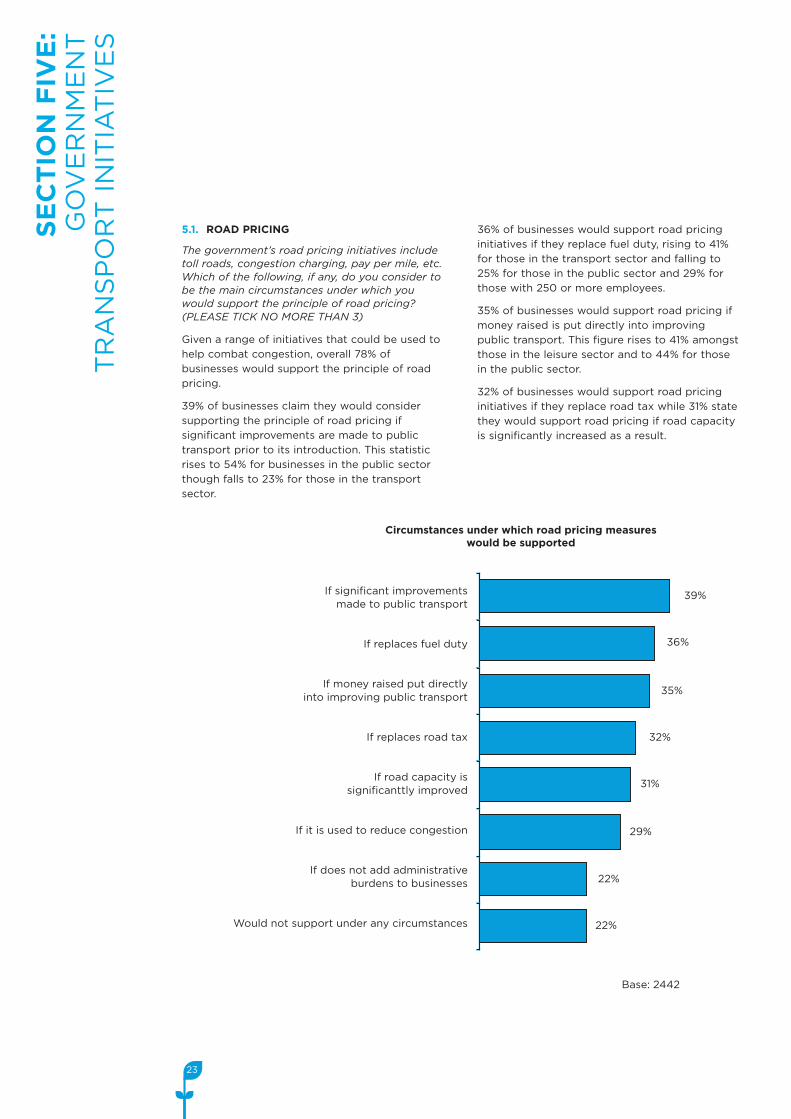
5.1. ROAD PRICING
The government’s road pricing initiatives includetoll roads, congestion charging, pay per mile, etc.Which of the following, if any, do you consider tobe the main circumstances under which youwould support the principle of road pricing?(PLEASE TICK NO MORE THAN 3)
Given a range of initiatives that could be used to
help combat congestion, overall 78% of
businesses would support the principle of road
pricing.
39% of businesses claim they would consider
supporting the principle of road pricing if
significant improvements are made to public
transport prior to its introduction. This statistic
rises to 54% for businesses in the public sector
though falls to 23% for those in the transport
sector.
36% of businesses would support road pricing
initiatives if they replace fuel duty, rising to 41%
for those in the transport sector and falling to
25% for those in the public sector and 29% for
those with 250 or more employees.
35% of businesses would support road pricing if
money raised is put directly into improving
public transport. This figure rises to 41% amongst
those in the leisure sector and to 44% for those
in the public sector.
32% of businesses would support road pricing
initiatives if they replace road tax while 31% state
they would support road pricing if road capacity
is significantly increased as a result.
23
SECTIONFIVE:
GOVERNMENT
TRANSPORTINITIATIVES
If significant improvementsmade to public transport
If replaces fuel duty
If money raised put directlyinto improving public transport
If replaces road tax
If road capacity issignificanttly improved
If it is used to reduce congestion
If does not add administrativeburdens to businesses
Would not support under any circumstances
Circumstances under which road pricing measureswould be supported
39%
36%
35%
32%
31%
29%
22%
22%
Base: 2442
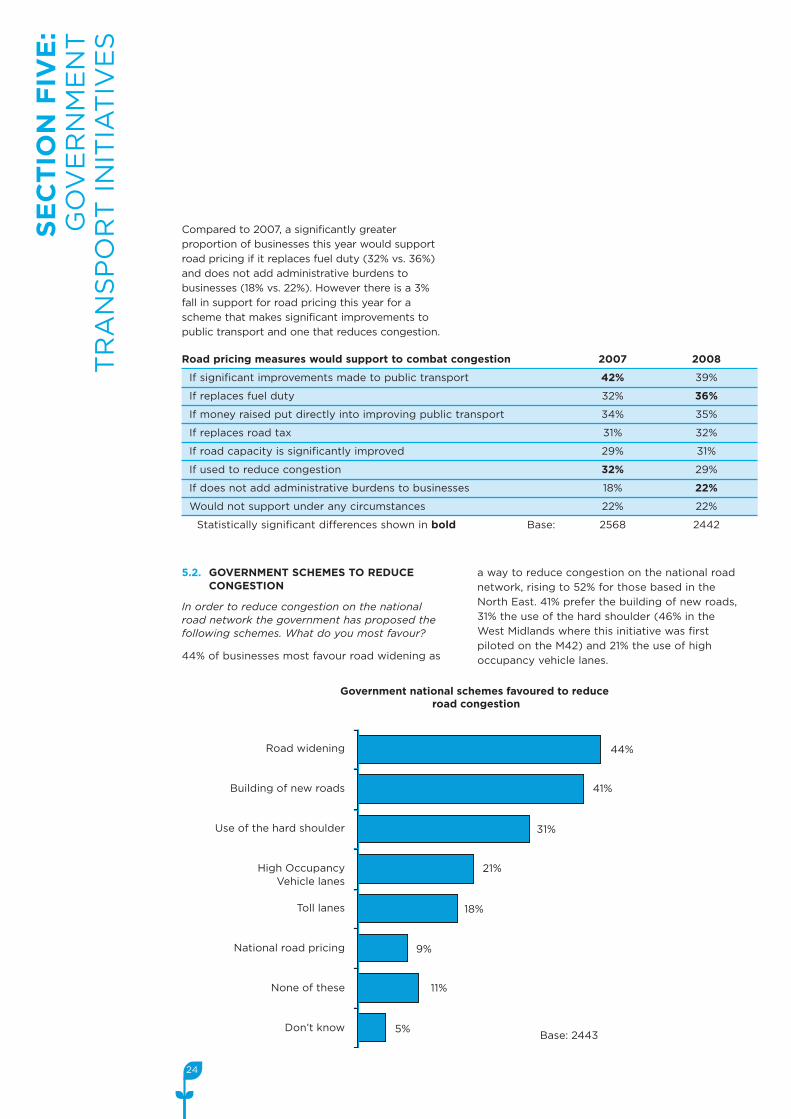
Compared to 2007, a significantly greater
proportion of businesses this year would support
road pricing if it replaces fuel duty (32% vs. 36%)
and does not add administrative burdens to
businesses (18% vs. 22%). However there is a 3%
fall in support for road pricing this year for a
scheme that makes significant improvements to
public transport and one that reduces congestion.
24
SECTIONFIVE:
GOVERNMENT
TRANSPORTINITIATIVES
Road pricing measures would support to combat congestion 2007 2008
If significant improvements made to public transport 42% 39%
If replaces fuel duty 32% 36%
If money raised put directly into improving public transport 34% 35%
If replaces road tax 31% 32%
If road capacity is significantly improved 29% 31%
If used to reduce congestion 32% 29%
If does not add administrative burdens to businesses 18% 22%
Would not support under any circumstances 22% 22%
Statistically significant differences shown in bold Base: 2568 2442
5.2. GOVERNMENT SCHEMES TO REDUCECONGESTION
In order to reduce congestion on the nationalroad network the government has proposed thefollowing schemes. What do you most favour?
44% of businesses most favour road widening as
a way to reduce congestion on the national road
network, rising to 52% for those based in the
North East. 41% prefer the building of new roads,
31% the use of the hard shoulder (46% in the
West Midlands where this initiative was first
piloted on the M42) and 21% the use of high
occupancy vehicle lanes.
Road widening
Building of new roads
Use of the hard shoulder
High OccupancyVehicle lanes
Toll lanes
National road pricing
None of these
Don’t know
Government national schemes favoured to reduceroad congestion
44%
41%
31%
21%
18%
9%
11%
5%Base: 2443
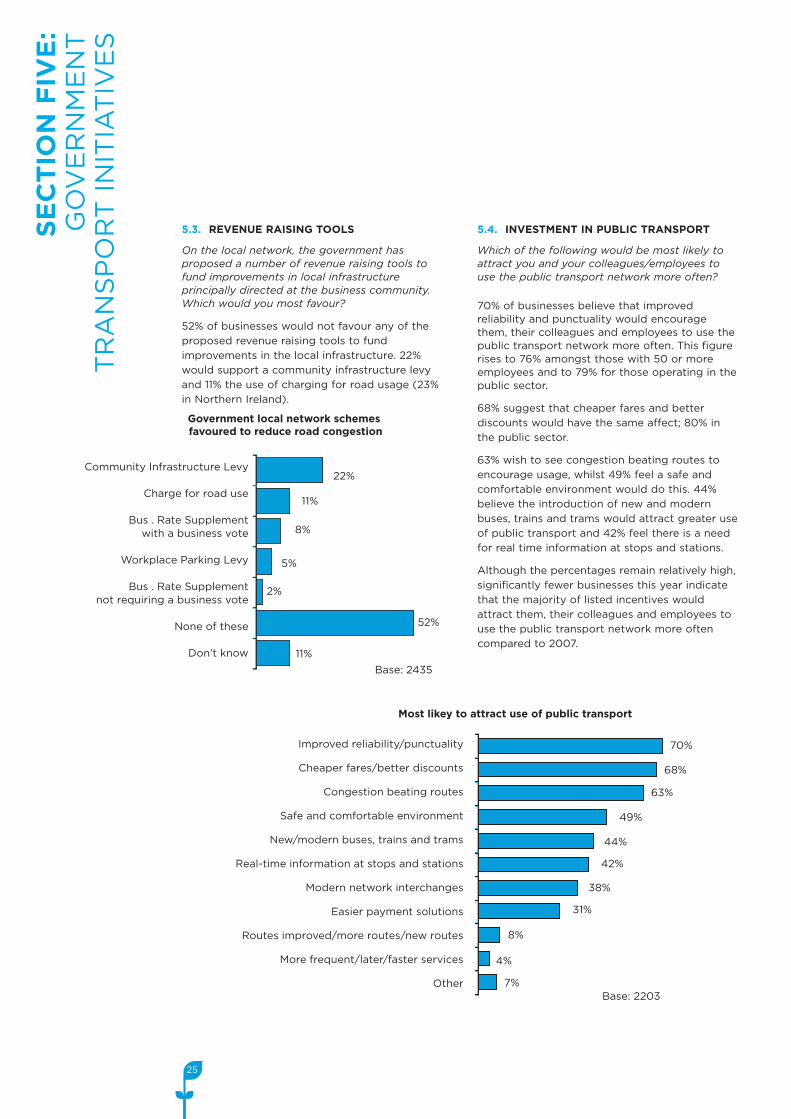
5.3. REVENUE RAISING TOOLS
On the local network, the government hasproposed a number of revenue raising tools tofund improvements in local infrastructureprincipally directed at the business community.Which would you most favour?
52% of businesses would not favour any of the
proposed revenue raising tools to fund
improvements in the local infrastructure. 22%
would support a community infrastructure levy
and 11% the use of charging for road usage (23%
in Northern Ireland).
5.4. INVESTMENT IN PUBLIC TRANSPORT
Which of the following would be most likely toattract you and your colleagues/employees touse the public transport network more often?
70% of businesses believe that improvedreliability and punctuality would encouragethem, their colleagues and employees to use thepublic transport network more often. This figurerises to 76% amongst those with 50 or moreemployees and to 79% for those operating in thepublic sector.
68% suggest that cheaper fares and better
discounts would have the same affect; 80% in
the public sector.
63% wish to see congestion beating routes to
encourage usage, whilst 49% feel a safe and
comfortable environment would do this. 44%
believe the introduction of new and modern
buses, trains and trams would attract greater use
of public transport and 42% feel there is a need
for real time information at stops and stations.
Although the percentages remain relatively high,
significantly fewer businesses this year indicate
that the majority of listed incentives would
attract them, their colleagues and employees to
use the public transport network more often
compared to 2007.
25
SECTIONFIVE:
GOVERNMENT
TRANSPORTINITIATIVES
Community Infrastructure Levy
Charge for road use
Bus . Rate Supplementwith a business vote
Workplace Parking Levy
Bus . Rate Supplementnot requiring a business vote
None of these
Don’t know
Government local network schemesfavoured to reduce road congestion
11%
22%
8%
5%
2%
52%
11%
Base: 2435
Improved reliability/punctuality
Cheaper fares/better discounts
Congestion beating routes
Safe and comfortable environment
New/modern buses, trains and trams
Real-time information at stops and stations
Modern network interchanges
Easier payment solutions
Routes improved/more routes/new routes
More frequent/later/faster services
Other
Most likey to attract use of public transport
70%
68%
63%
49%
44%
42%
38%
31%
8%
4%
7%Base: 2203
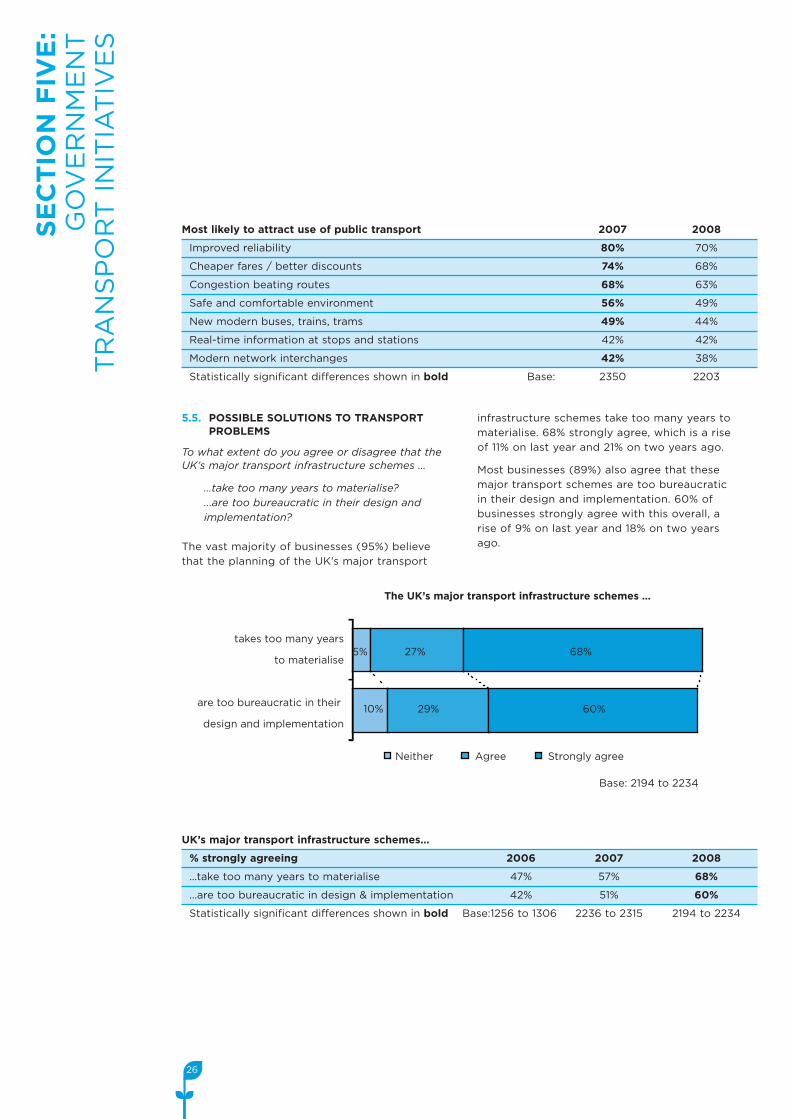
5.5. POSSIBLE SOLUTIONS TO TRANSPORTPROBLEMS
To what extent do you agree or disagree that theUK’s major transport infrastructure schemes …
…take too many years to materialise?...are too bureaucratic in their design andimplementation?
The vast majority of businesses (95%) believe
that the planning of the UK’s major transport
infrastructure schemes take too many years to
materialise. 68% strongly agree, which is a rise
of 11% on last year and 21% on two years ago.
Most businesses (89%) also agree that these
major transport schemes are too bureaucratic
in their design and implementation. 60% of
businesses strongly agree with this overall, a
rise of 9% on last year and 18% on two years
ago.
26
SECTIONFIVE:
GOVERNMENT
TRANSPORTINITIATIVES
Most likely to attract use of public transport 2007 2008
Improved reliability 80% 70%
Cheaper fares / better discounts 74% 68%
Congestion beating routes 68% 63%
Safe and comfortable environment 56% 49%
New modern buses, trains, trams 49% 44%
Real-time information at stops and stations 42% 42%
Modern network interchanges 42% 38%
Statistically significant differences shown in bold Base: 2350 2203
UK’s major transport infrastructure schemes…
% strongly agreeing 2006 2007 2008
…take too many years to materialise 47% 57% 68%
…are too bureaucratic in design & implementation 42% 51% 60%
Statistically significant differences shown in bold Base:1256 to 1306 2236 to 2315 2194 to 2234
takes too many years
to materialise
are too bureaucratic in their
design and implementation
The UK’s major transport infrastructure schemes …
Base: 2194 to 2234
Neither Agree Strongly agree
5% 27% 68%
10% 29% 60%
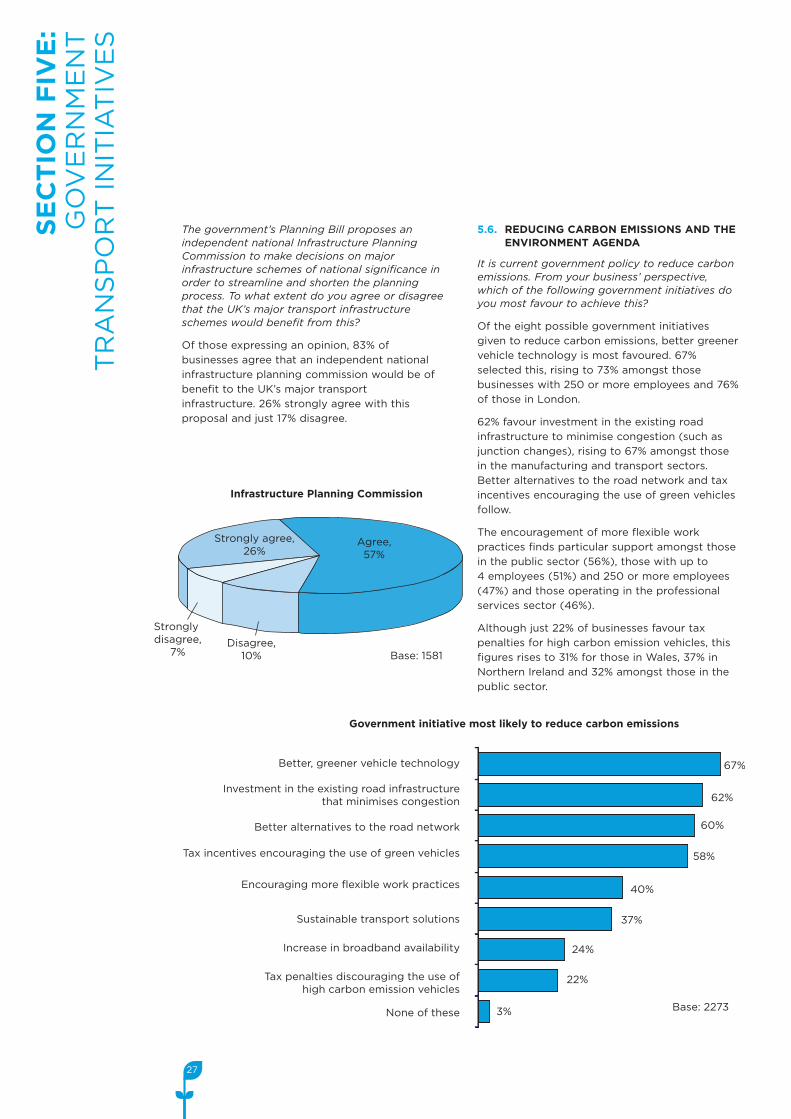
The government’s Planning Bill proposes anindependent national Infrastructure PlanningCommission to make decisions on majorinfrastructure schemes of national significance inorder to streamline and shorten the planningprocess. To what extent do you agree or disagreethat the UK’s major transport infrastructureschemes would benefit from this?
Of those expressing an opinion, 83% of
businesses agree that an independent national
infrastructure planning commission would be of
benefit to the UK’s major transport
infrastructure. 26% strongly agree with this
proposal and just 17% disagree.
5.6. REDUCING CARBON EMISSIONS AND THEENVIRONMENT AGENDA
It is current government policy to reduce carbonemissions. From your business’ perspective,which of the following government initiatives doyou most favour to achieve this?
Of the eight possible government initiatives
given to reduce carbon emissions, better greener
vehicle technology is most favoured. 67%
selected this, rising to 73% amongst those
businesses with 250 or more employees and 76%
of those in London.
62% favour investment in the existing road
infrastructure to minimise congestion (such as
junction changes), rising to 67% amongst those
in the manufacturing and transport sectors.
Better alternatives to the road network and tax
incentives encouraging the use of green vehicles
follow.
The encouragement of more flexible work
practices finds particular support amongst those
in the public sector (56%), those with up to
4 employees (51%) and 250 or more employees
(47%) and those operating in the professional
services sector (46%).
Although just 22% of businesses favour tax
penalties for high carbon emission vehicles, this
figures rises to 31% for those in Wales, 37% in
Northern Ireland and 32% amongst those in the
public sector.
27
SECTIONFIVE:
GOVERNMENT
TRANSPORTINITIATIVES
Infrastructure Planning Commission
Base: 1581Disagree,
10%
Stronglydisagree,
7%
Agree,57%
Strongly agree,26%
Better, greener vehicle technology
Investment in the existing road infrastructurethat minimises congestion
Better alternatives to the road network
Tax incentives encouraging the use of green vehicles
Encouraging more flexible work practices
Sustainable transport solutions
Increase in broadband availability
Tax penalties discouraging the use ofhigh carbon emission vehicles
None of these
Government initiative most likely to reduce carbon emissions
67%
62%
60%
58%
40%
37%
24%
22%
3% Base: 2273
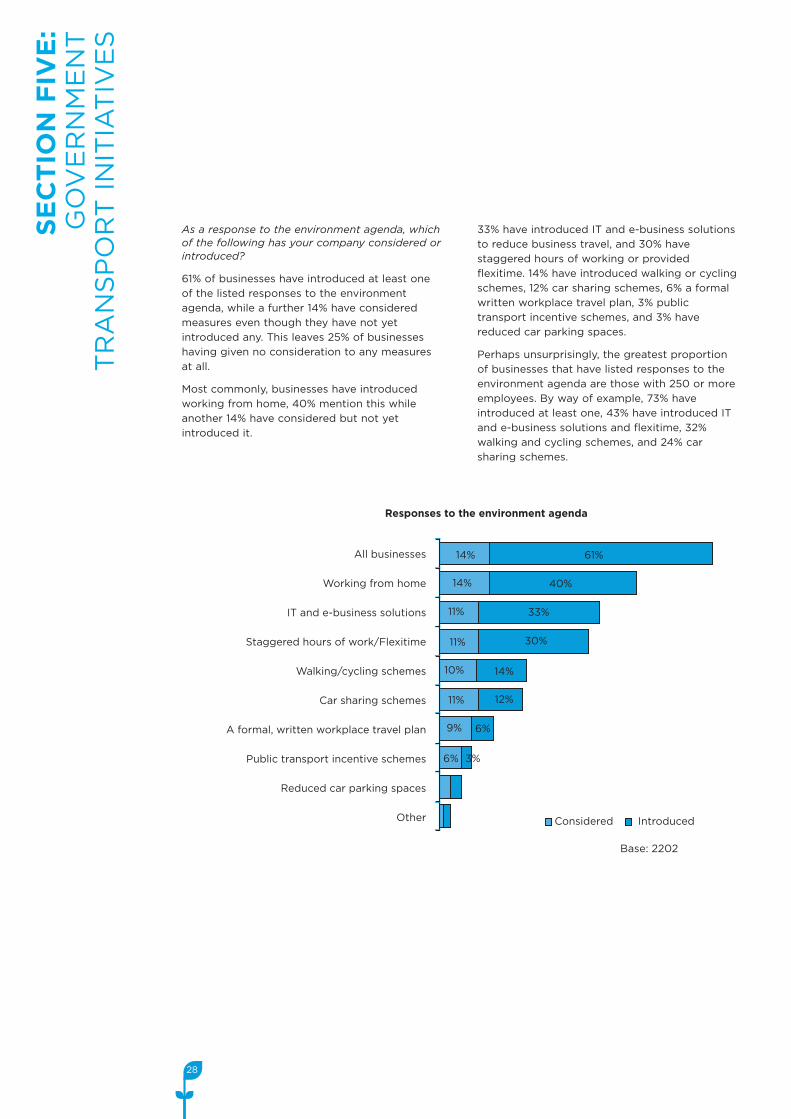
As a response to the environment agenda, whichof the following has your company considered orintroduced?
61% of businesses have introduced at least one
of the listed responses to the environment
agenda, while a further 14% have considered
measures even though they have not yet
introduced any. This leaves 25% of businesses
having given no consideration to any measures
at all.
Most commonly, businesses have introduced
working from home, 40% mention this while
another 14% have considered but not yet
introduced it.
33% have introduced IT and e-business solutions
to reduce business travel, and 30% have
staggered hours of working or provided
flexitime. 14% have introduced walking or cycling
schemes, 12% car sharing schemes, 6% a formal
written workplace travel plan, 3% public
transport incentive schemes, and 3% have
reduced car parking spaces.
Perhaps unsurprisingly, the greatest proportion
of businesses that have listed responses to the
environment agenda are those with 250 or more
employees. By way of example, 73% have
introduced at least one, 43% have introduced IT
and e-business solutions and flexitime, 32%
walking and cycling schemes, and 24% car
sharing schemes.
28
SECTIONFIVE:
GOVERNMENT
TRANSPORTINITIATIVES
All businesses
Working from home
IT and e-business solutions
Staggered hours of work/Flexitime
Walking/cycling schemes
Car sharing schemes
A formal, written workplace travel plan
Public transport incentive schemes
Reduced car parking spaces
Other
Responses to the environment agenda
Base: 2202
Considered Introduced
61%
40%
33%
30%
14%
12%
6%
6%
9%
11%
11%
11%
14%
14%
10%
3%
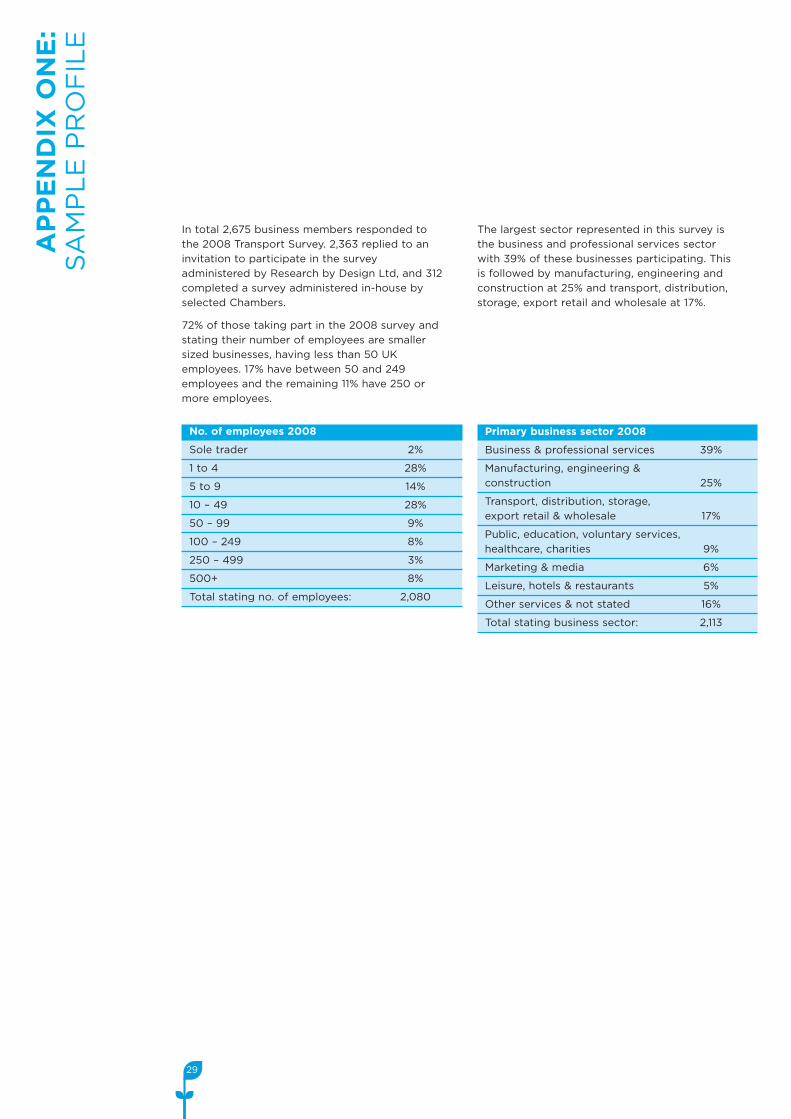
In total 2,675 business members responded to
the 2008 Transport Survey. 2,363 replied to an
invitation to participate in the survey
administered by Research by Design Ltd, and 312
completed a survey administered in-house by
selected Chambers.
72% of those taking part in the 2008 survey and
stating their number of employees are smaller
sized businesses, having less than 50 UK
employees. 17% have between 50 and 249
employees and the remaining 11% have 250 or
more employees.
The largest sector represented in this survey is
the business and professional services sector
with 39% of these businesses participating. This
is followed by manufacturing, engineering and
construction at 25% and transport, distribution,
storage, export retail and wholesale at 17%.
29
APPENDIXONE:
SAMPLEPROFILE
No. of employees 2008
Sole trader 2%
1 to 4 28%
5 to 9 14%
10 – 49 28%
50 – 99 9%
100 – 249 8%
250 – 499 3%
500+ 8%
Total stating no. of employees: 2,080
Primary business sector 2008
Business & professional services 39%
Manufacturing, engineering &
construction 25%
Transport, distribution, storage,
export retail & wholesale 17%
Public, education, voluntary services,
healthcare, charities 9%
Marketing & media 6%
Leisure, hotels & restaurants 5%
Other services & not stated 16%
Total stating business sector: 2,113
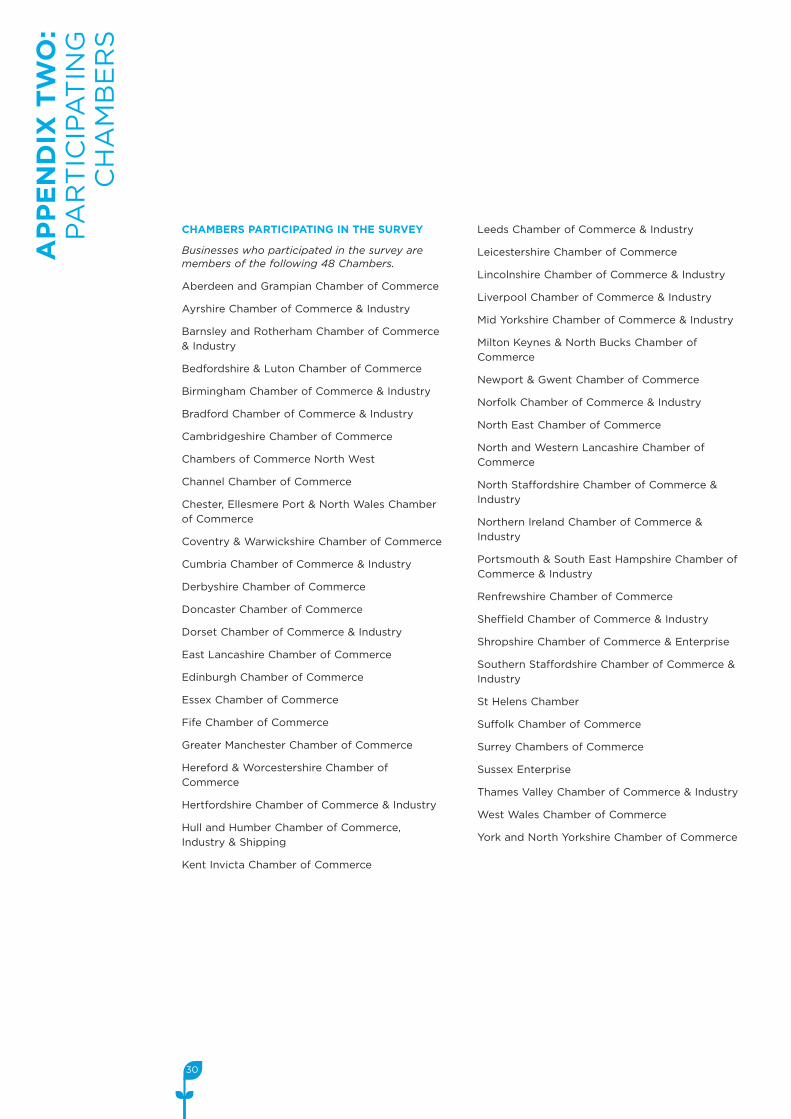
CHAMBERS PARTICIPATING IN THE SURVEY
Businesses who participated in the survey aremembers of the following 48 Chambers.
Aberdeen and Grampian Chamber of Commerce
Ayrshire Chamber of Commerce & Industry
Barnsley and Rotherham Chamber of Commerce
& Industry
Bedfordshire & Luton Chamber of Commerce
Birmingham Chamber of Commerce & Industry
Bradford Chamber of Commerce & Industry
Cambridgeshire Chamber of Commerce
Chambers of Commerce North West
Channel Chamber of Commerce
Chester, Ellesmere Port & North Wales Chamber
of Commerce
Coventry & Warwickshire Chamber of Commerce
Cumbria Chamber of Commerce & Industry
Derbyshire Chamber of Commerce
Doncaster Chamber of Commerce
Dorset Chamber of Commerce & Industry
East Lancashire Chamber of Commerce
Edinburgh Chamber of Commerce
Essex Chamber of Commerce
Fife Chamber of Commerce
Greater Manchester Chamber of Commerce
Hereford & Worcestershire Chamber of
Commerce
Hertfordshire Chamber of Commerce & Industry
Hull and Humber Chamber of Commerce,
Industry & Shipping
Kent Invicta Chamber of Commerce
Leeds Chamber of Commerce & Industry
Leicestershire Chamber of Commerce
Lincolnshire Chamber of Commerce & Industry
Liverpool Chamber of Commerce & Industry
Mid Yorkshire Chamber of Commerce & Industry
Milton Keynes & North Bucks Chamber of
Commerce
Newport & Gwent Chamber of Commerce
Norfolk Chamber of Commerce & Industry
North East Chamber of Commerce
North and Western Lancashire Chamber of
Commerce
North Staffordshire Chamber of Commerce &
Industry
Northern Ireland Chamber of Commerce &
Industry
Portsmouth & South East Hampshire Chamber of
Commerce & Industry
Renfrewshire Chamber of Commerce
Sheffield Chamber of Commerce & Industry
Shropshire Chamber of Commerce & Enterprise
Southern Staffordshire Chamber of Commerce &
Industry
St Helens Chamber
Suffolk Chamber of Commerce
Surrey Chambers of Commerce
Sussex Enterprise
Thames Valley Chamber of Commerce & Industry
West Wales Chamber of Commerce
York and North Yorkshire Chamber of Commerce
30
APPENDIXTWO:
PARTICIPATING
CHAMBERS

BRITISH CHAMBERS OF COMMERCE65 PETTY FRANCE
LONDON SW1H 9EU
UNITED KINGDOM
T +44 (0)20 7654 5800
F +44 (0)20 7654 5819
www.britishchambers.org.uk