Embed Size (px)
Citation preview
www.HQOntario.ca
Health Quality Ontario The provincial advisor on the quality of health care in Ontario
B7 Data For Outcomes – Moving Past the Numbers June 8 11:00 pm – 12:00 pm
2
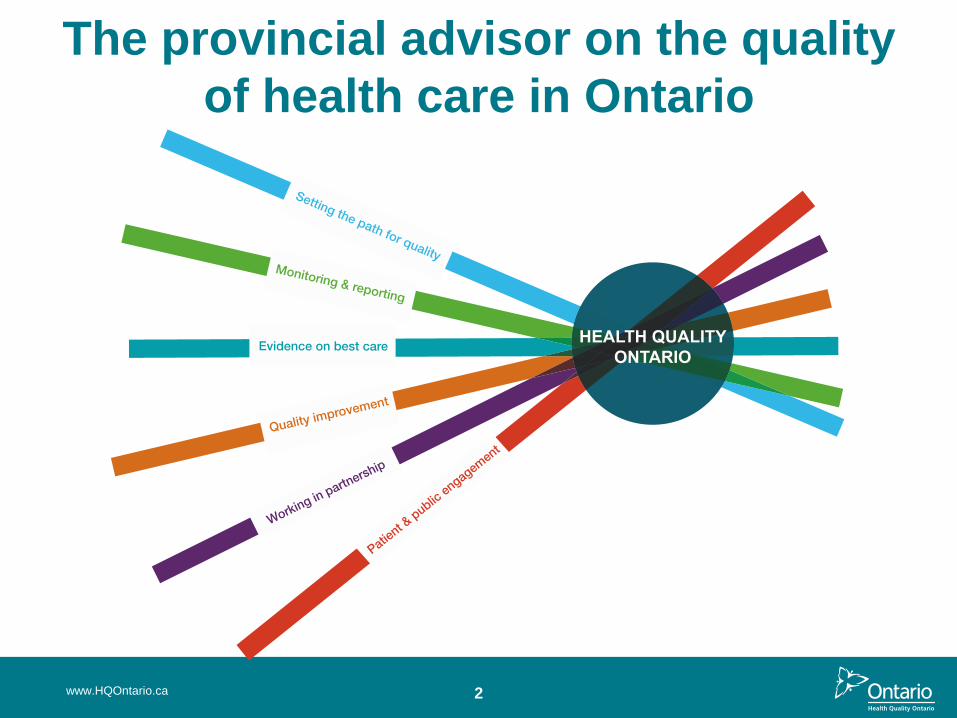
The provincial advisor on the quality
of health care in Ontario
www.HQOntario.ca

3
Welcome
From AOHC facilitating today’s workshop:
Mark Mycyk – Business Intelligence Report Tool
From HQO facilitating today’s workshop:
Maria Krahn – Clinical Adoption team
Marg Millward – Quality Improvement Plan team
Dave Zago - Clinical Adoption team
www.HQOntario.ca

4
Presenter Disclosures
• No relationship with commercial interests
• No financial support
• No in-kind support
• No known conflict of interest
• No plan to mitigate potential bias as none are known
www.HQOntario.ca

5
Learning Objectives
After active engagement in this workshop, participants will be better
able to:
• Describe three key sources of information to assist with care
system improvement at their organization
• Demonstrate use of these sources to support improvement on
one of three areas:
– Improved outcomes for prevention and screening (Cancer)
– Improved outcomes for people living with chronic illness (Diabetes)
– Follow up or care coordination with hospital care
www.HQOntario.ca
6
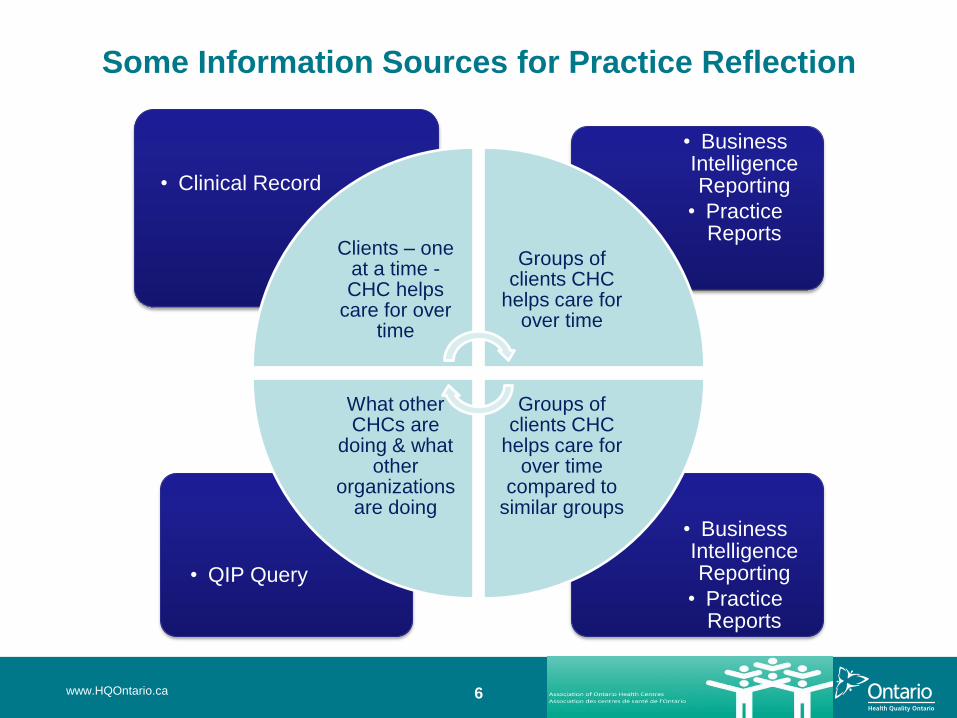
Some Information Sources for Practice Reflection
• Business Intelligence Reporting
• Practice Reports
• QIP Query
• Business Intelligence Reporting
• Practice Reports
• Clinical Record
Clients – one at a time - CHC helps
care for over time
Groups of clients CHC
helps care for over time
Groups of clients CHC
helps care for over time
compared to similar groups
What other CHCs are
doing & what other
organizations are doing
www.HQOntario.ca
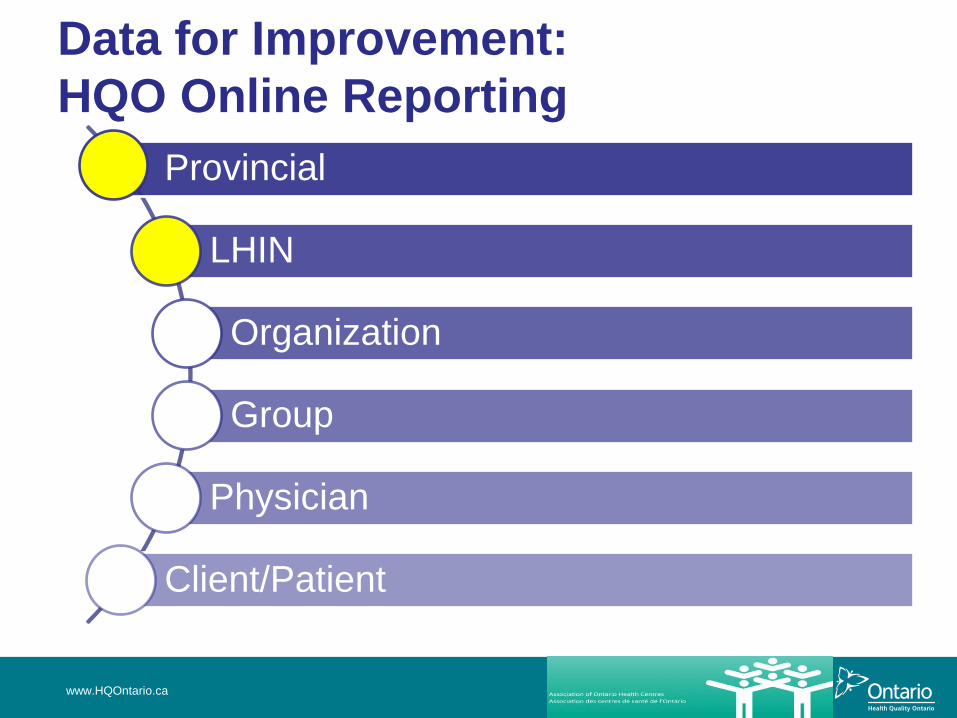
Data for Improvement:
HQO Online Reporting
www.HQOntario.ca
Provincial
LHIN
Organization
Group
Physician
Client/Patient

Primary Care Sector Performance
www.HQOntario.ca
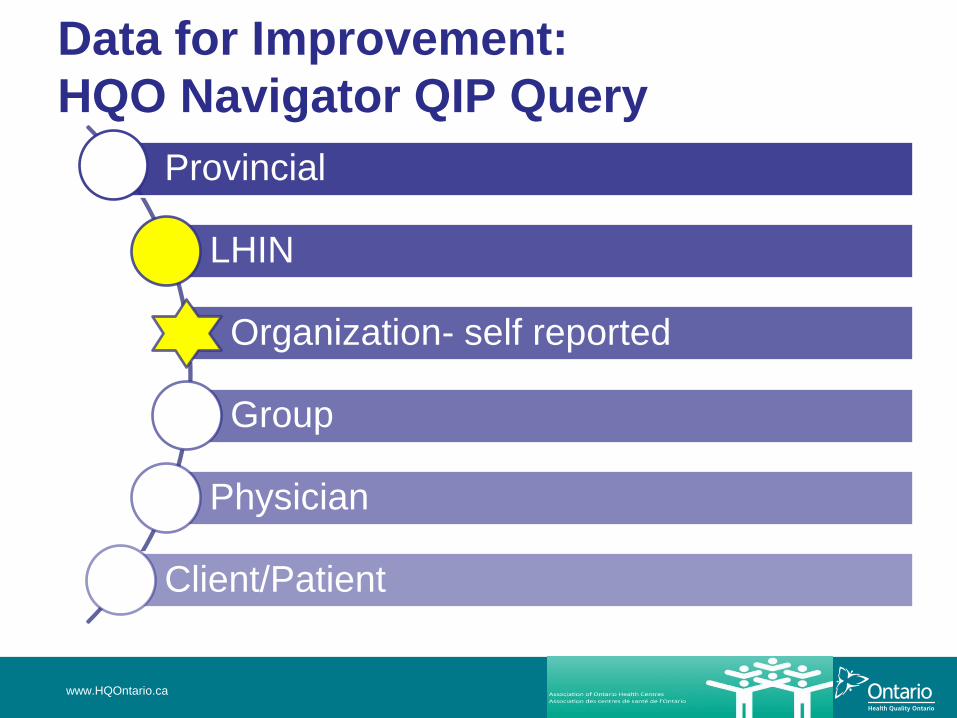
Data for Improvement:
HQO Navigator QIP Query
www.HQOntario.ca
Provincial
LHIN
Organization- self reported
Group
Physician
Client/Patient
10
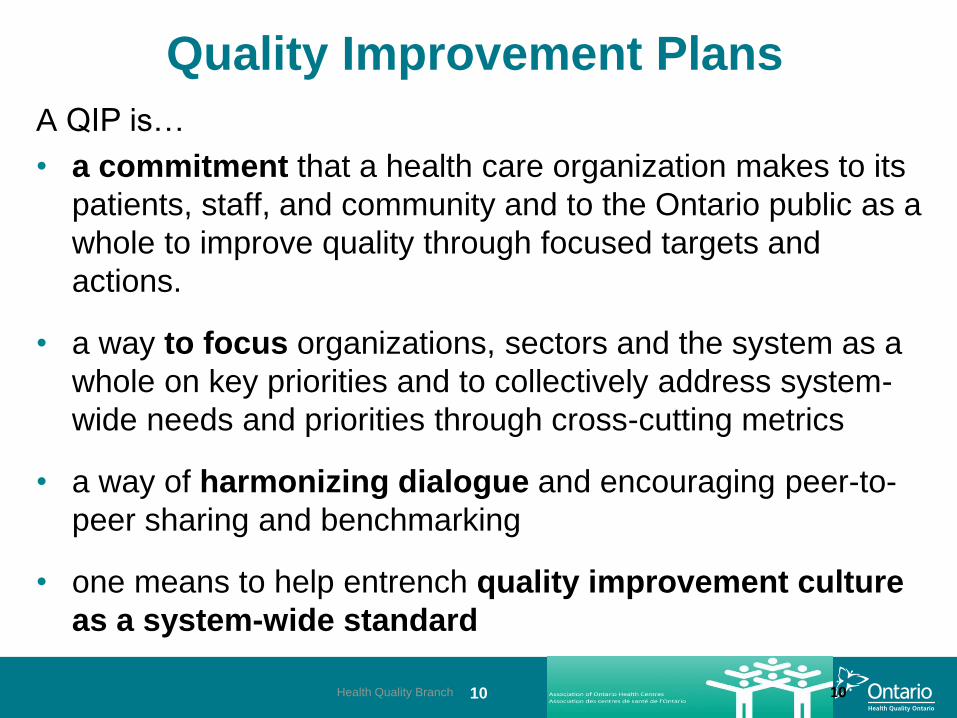
Quality Improvement Plans
A QIP is…
• a commitment that a health care organization makes to its
patients, staff, and community and to the Ontario public as a
whole to improve quality through focused targets and
actions.
• a way to focus organizations, sectors and the system as a
whole on key priorities and to collectively address system-
wide needs and priorities through cross-cutting metrics
• a way of harmonizing dialogue and encouraging peer-to-
peer sharing and benchmarking
• one means to help entrench quality improvement culture
as a system-wide standard
Health Quality Branch 10
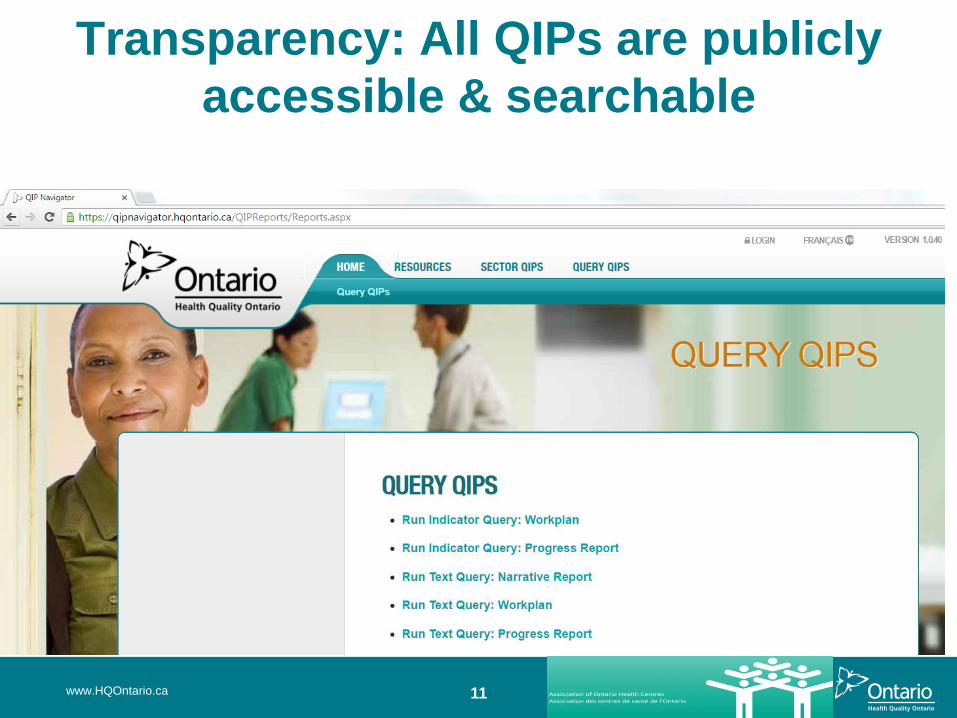
11
Transparency: All QIPs are publicly
accessible & searchable
www.HQOntario.ca
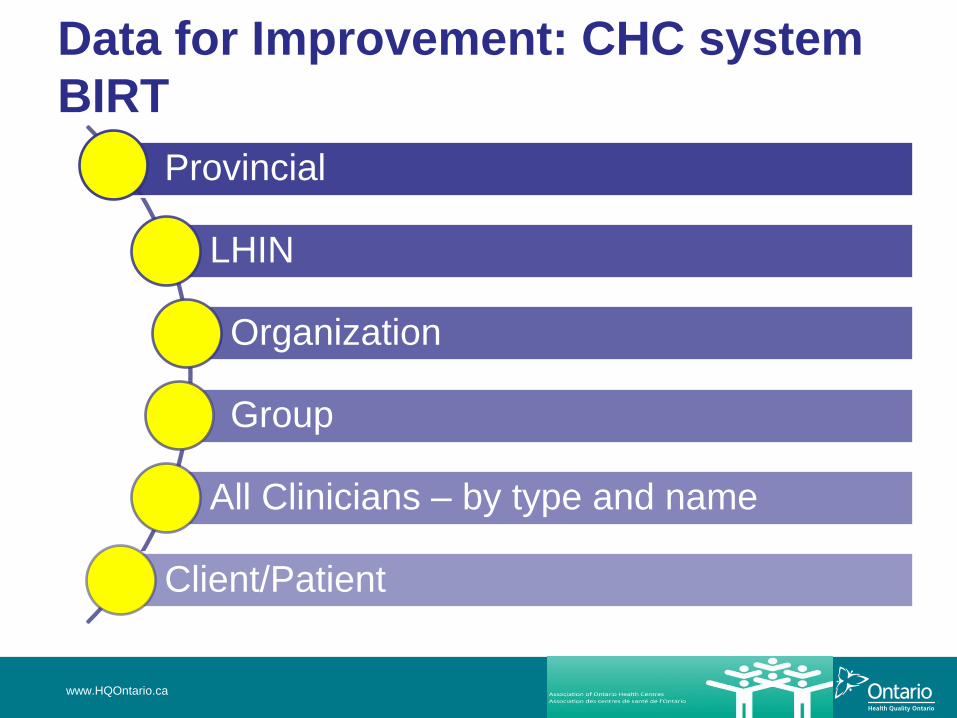
Data for Improvement: CHC system
BIRT
www.HQOntario.ca
Provincial
LHIN
Organization
Group
All Clinicians – by type and name
Client/Patient
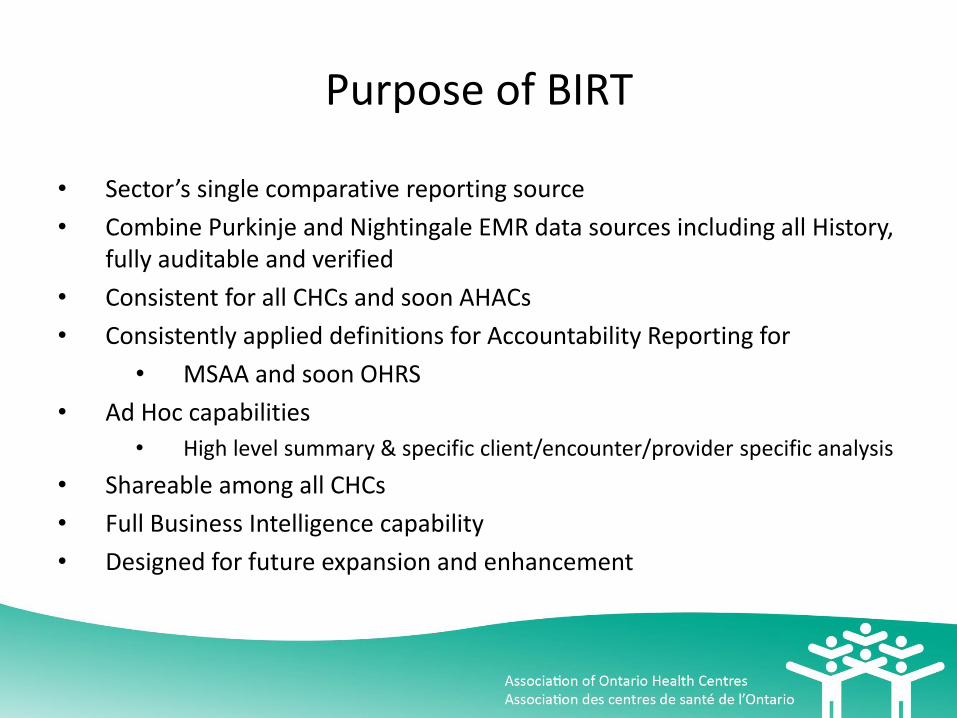
Purpose of BIRT
• Sector’s single comparative reporting source
• Combine Purkinje and Nightingale EMR data sources including all History, fully auditable and verified
• Consistent for all CHCs and soon AHACs
• Consistently applied definitions for Accountability Reporting for
• MSAA and soon OHRS
• Ad Hoc capabilities
• High level summary & specific client/encounter/provider specific analysis
• Shareable among all CHCs
• Full Business Intelligence capability
• Designed for future expansion and enhancement

BIRT – NORA Strategy 3-D “Discover Demonstrate Deliver ”
• EMR data from 73 CHCs • EMR data from Purkinje Dossier and Nightingale On Demand • All Historical PHI Content for up to 25 years
– Client Demographics – Inter-professional Provider details – Individual Client Interactions/Encounters – Diagnosis (ENCODE-FM, ICPC, ICD10-CA) – Procedures – Immunizations – Referral activities – Group activities
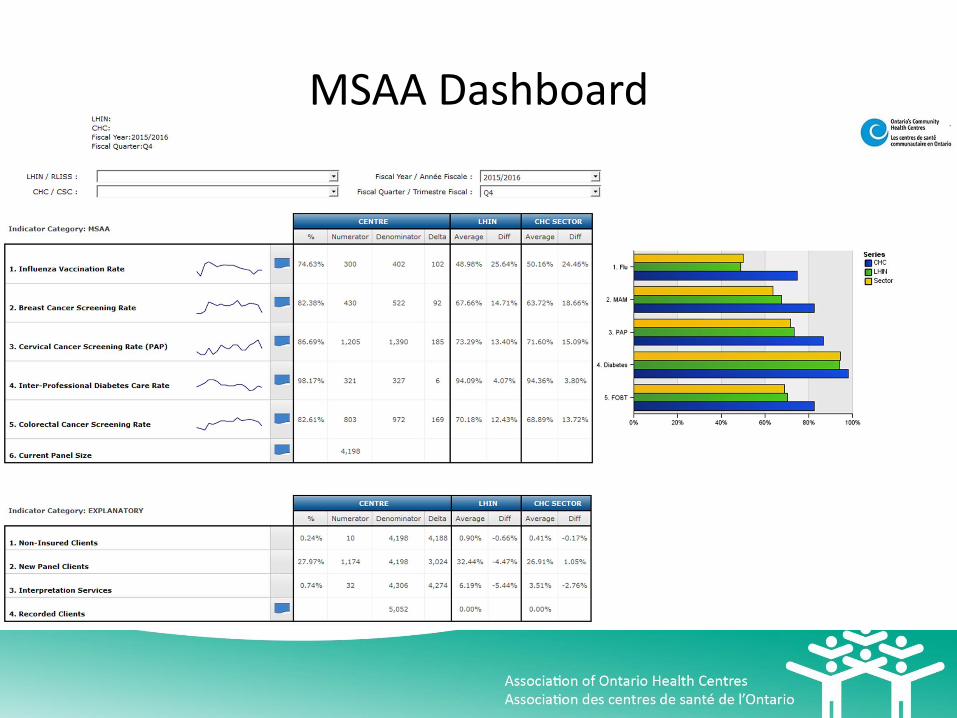
MSAA Dashboard


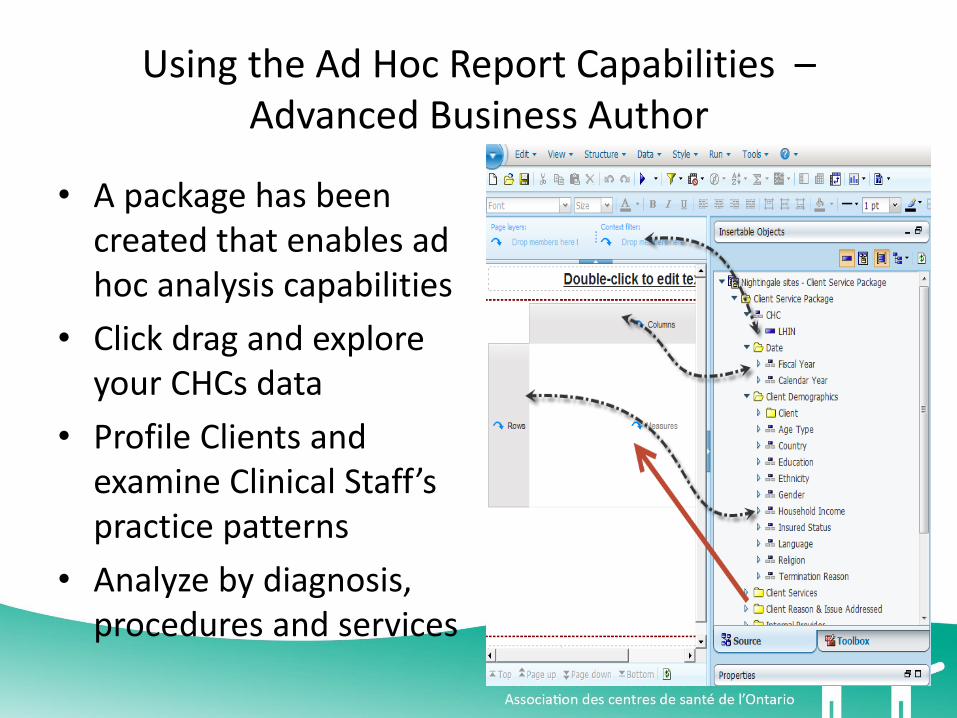
Using the Ad Hoc Report Capabilities – Advanced Business Author
• A package has been created that enables ad hoc analysis capabilities
• Click drag and explore your CHCs data
• Profile Clients and examine Clinical Staff’s practice patterns
• Analyze by diagnosis, procedures and services

The Goals are Discovery, Gaining Knowledge
and Sharing Wisdom for the Benefit of All

Shared Environment – Shared Wisdom
Sharing the knowledge and Experience for all users As little and as much shared data as the CHCs choose
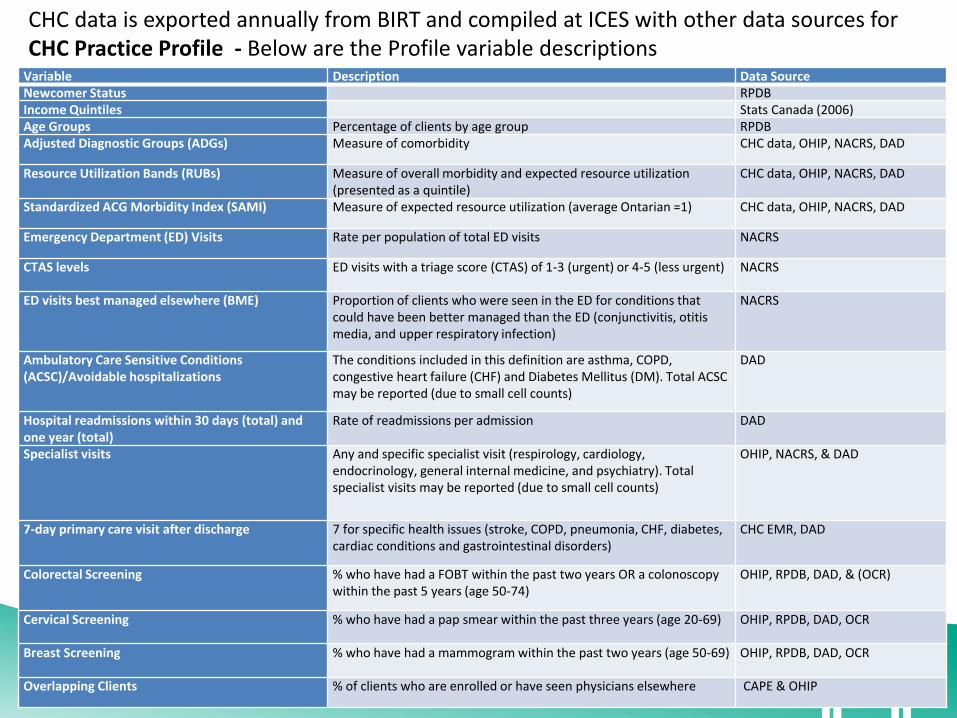
Variable Description Data Source Newcomer Status RPDB Income Quintiles Stats Canada (2006) Age Groups Percentage of clients by age group RPDB Adjusted Diagnostic Groups (ADGs) Measure of comorbidity CHC data, OHIP, NACRS, DAD
Resource Utilization Bands (RUBs) Measure of overall morbidity and expected resource utilization (presented as a quintile)
CHC data, OHIP, NACRS, DAD
Standardized ACG Morbidity Index (SAMI) Measure of expected resource utilization (average Ontarian =1) CHC data, OHIP, NACRS, DAD
Emergency Department (ED) Visits Rate per population of total ED visits NACRS
CTAS levels ED visits with a triage score (CTAS) of 1-3 (urgent) or 4-5 (less urgent) NACRS
ED visits best managed elsewhere (BME) Proportion of clients who were seen in the ED for conditions that could have been better managed than the ED (conjunctivitis, otitis media, and upper respiratory infection)
NACRS
Ambulatory Care Sensitive Conditions (ACSC)/Avoidable hospitalizations
The conditions included in this definition are asthma, COPD, congestive heart failure (CHF) and Diabetes Mellitus (DM). Total ACSC may be reported (due to small cell counts)
DAD
Hospital readmissions within 30 days (total) and one year (total)
Rate of readmissions per admission DAD
Specialist visits Any and specific specialist visit (respirology, cardiology, endocrinology, general internal medicine, and psychiatry). Total specialist visits may be reported (due to small cell counts)
OHIP, NACRS, & DAD
7-day primary care visit after discharge 7 for specific health issues (stroke, COPD, pneumonia, CHF, diabetes, cardiac conditions and gastrointestinal disorders)
CHC EMR, DAD
Colorectal Screening % who have had a FOBT within the past two years OR a colonoscopy within the past 5 years (age 50-74)
OHIP, RPDB, DAD, & (OCR)
Cervical Screening % who have had a pap smear within the past three years (age 20-69) OHIP, RPDB, DAD, OCR
Breast Screening % who have had a mammogram within the past two years (age 50-69) OHIP, RPDB, DAD, OCR
Overlapping Clients % of clients who are enrolled or have seen physicians elsewhere CAPE & OHIP
CHC data is exported annually from BIRT and compiled at ICES with other data sources for CHC Practice Profile - Below are the Profile variable descriptions

Data for Improvement: HQO Primary Care Practice Reports – CHC Group
Reports
www.HQOntario.ca
Provincial
LHIN
Organization
Group
Physician
Client/Patient

23
Overview of the PCP Reports
www.HQOntario.ca
• The Primary Care Practice Report provides cross-sectional and longitudinal data on practice
demographics and case mix, patterns of service use, chronic disease prevention and management,
and the health status of the practice population.
• CHC reports provide information at the CHC, CHC comparison of rural or urban and provincial levels.
Reports are generated annually, and include data up to March 31 of the previous year.
24
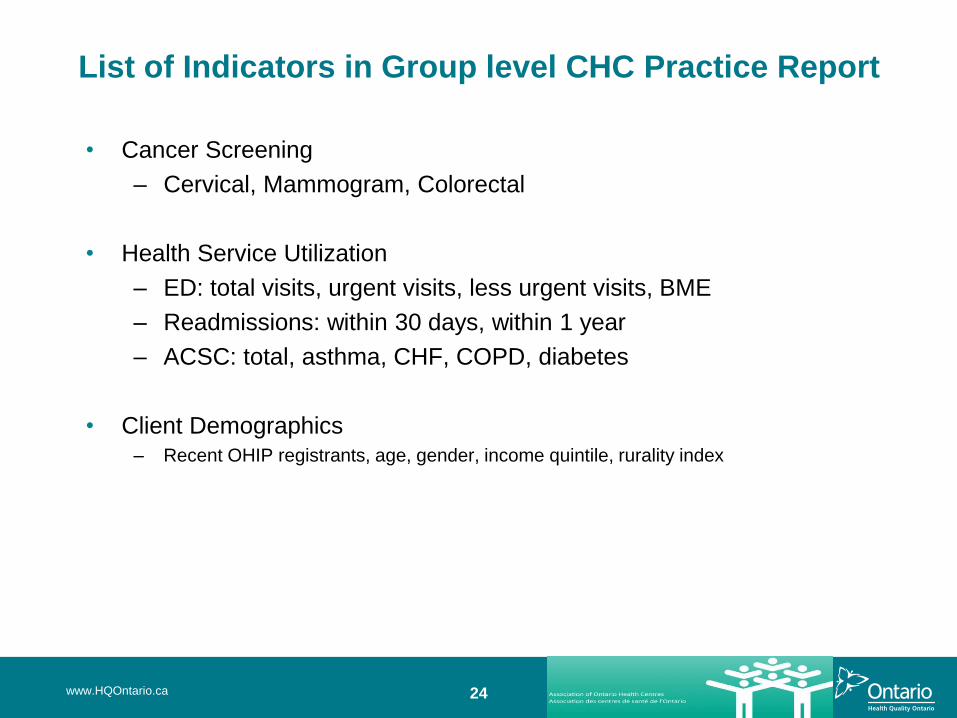
List of Indicators in Group level CHC Practice Report
• Cancer Screening
– Cervical, Mammogram, Colorectal
• Health Service Utilization
– ED: total visits, urgent visits, less urgent visits, BME
– Readmissions: within 30 days, within 1 year
– ACSC: total, asthma, CHF, COPD, diabetes
• Client Demographics – Recent OHIP registrants, age, gender, income quintile, rurality index
www.HQOntario.ca
25
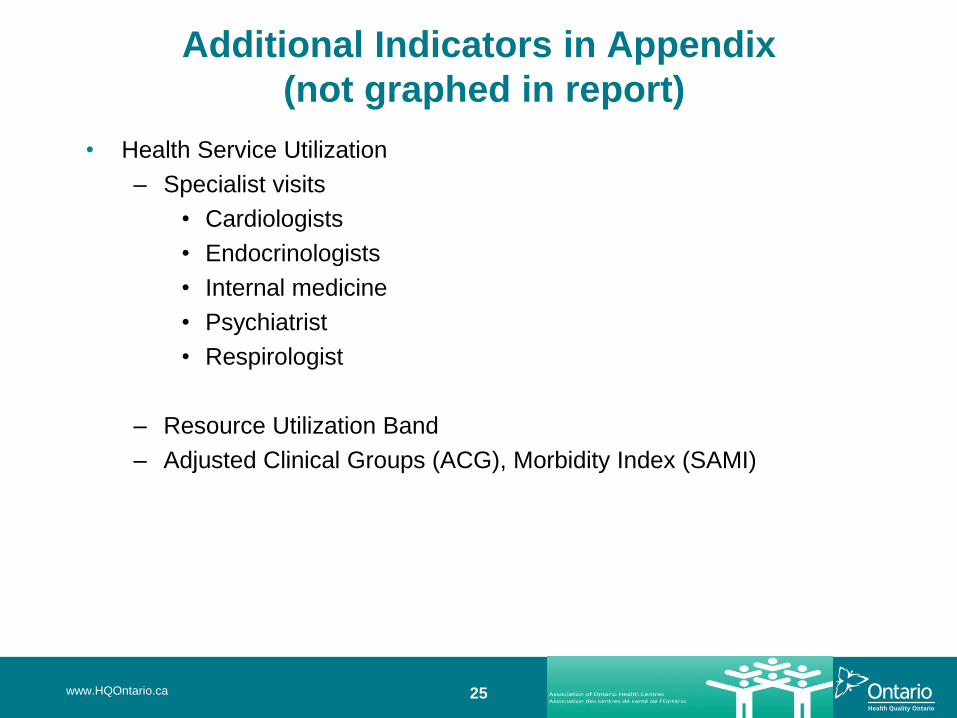
Additional Indicators in Appendix
(not graphed in report)
• Health Service Utilization
– Specialist visits
• Cardiologists
• Endocrinologists
• Internal medicine
• Psychiatrist
• Respirologist
– Resource Utilization Band
– Adjusted Clinical Groups (ACG), Morbidity Index (SAMI)
www.HQOntario.ca
26
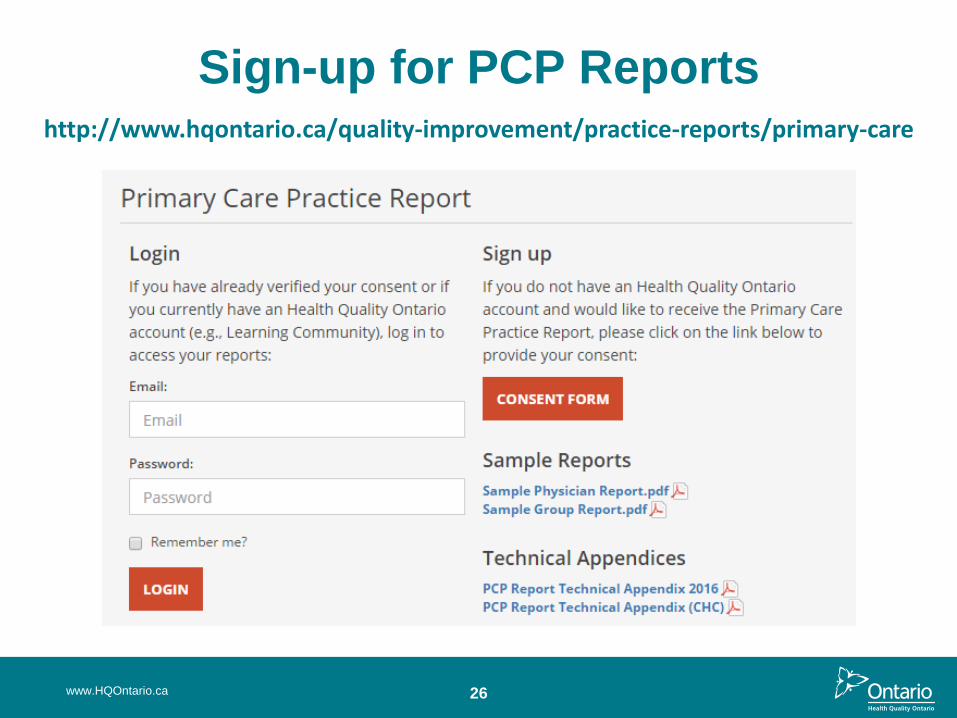
Sign-up for PCP Reports
www.HQOntario.ca
http://www.hqontario.ca/quality-improvement/practice-reports/primary-care
27
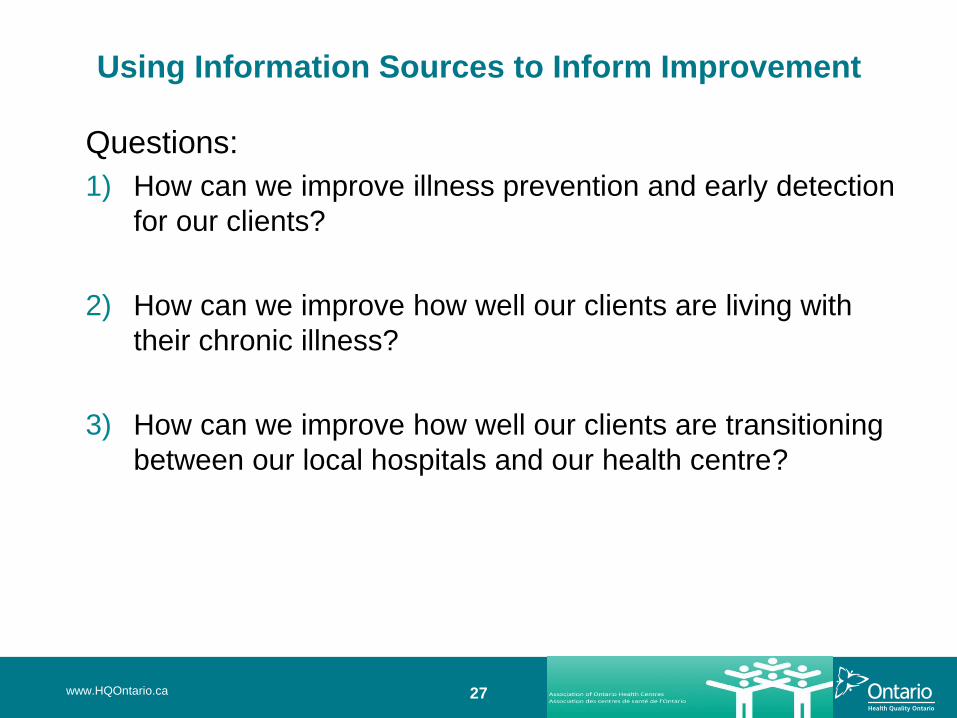
Using Information Sources to Inform Improvement
Questions:
1) How can we improve illness prevention and early detection
for our clients?
2) How can we improve how well our clients are living with
their chronic illness?
3) How can we improve how well our clients are transitioning
between our local hospitals and our health centre?
www.HQOntario.ca
28
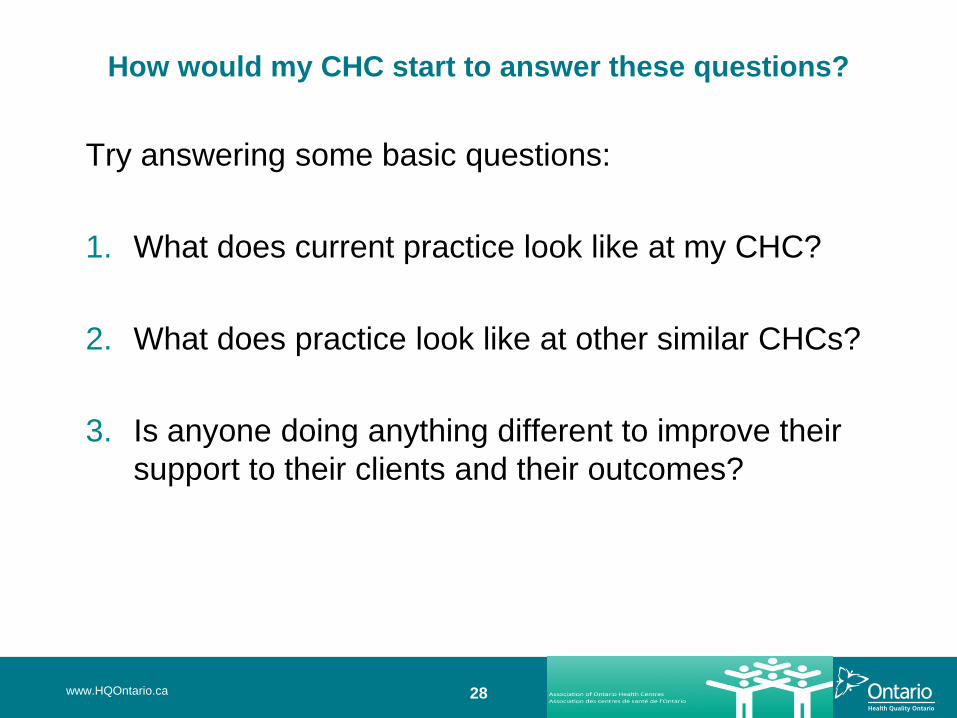
How would my CHC start to answer these questions?
Try answering some basic questions:
1. What does current practice look like at my CHC?
2. What does practice look like at other similar CHCs?
3. Is anyone doing anything different to improve their
support to their clients and their outcomes?
www.HQOntario.ca

29
How would my CHC start to answer these questions?
Table Exercise - Case Study
Step 1: Pick one of the following questions to think about:
1) How can we improve illness prevention and early detection for
our clients? (Consider cancer screening)
2) How can we improve how well our clients are living with their
chronic illness? (Consider diabetes)
3) How can we improve how well our clients are transitioning
between our local hospitals and our health centre? (Consider
hospital readmissions)
www.HQOntario.ca
30
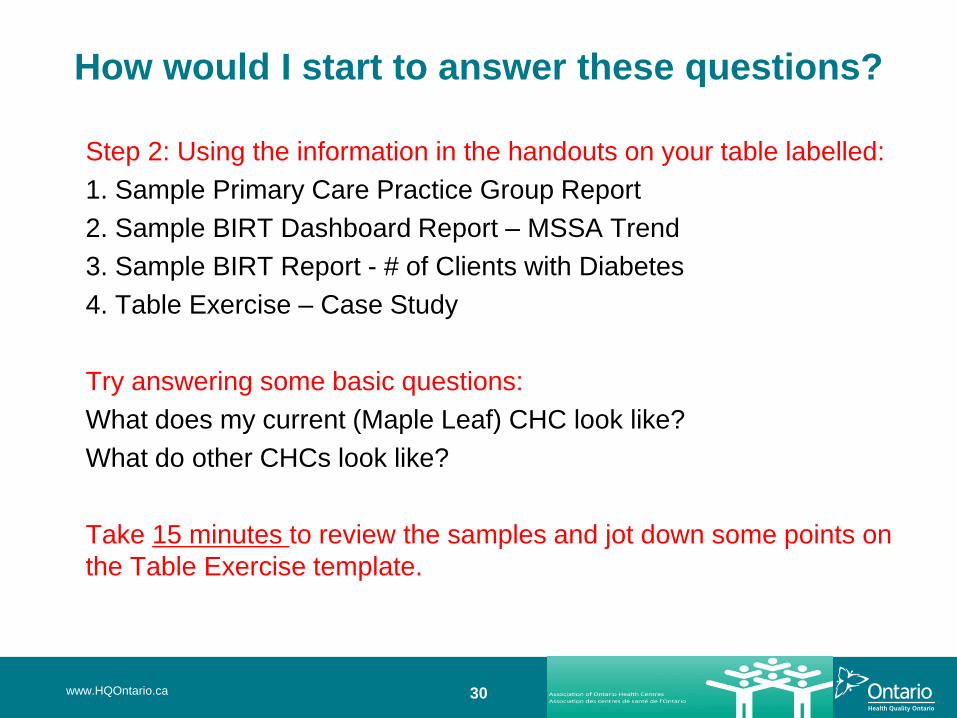
How would I start to answer these questions?
Step 2: Using the information in the handouts on your table labelled:
1. Sample Primary Care Practice Group Report
2. Sample BIRT Dashboard Report – MSSA Trend
3. Sample BIRT Report - # of Clients with Diabetes
4. Table Exercise – Case Study
Try answering some basic questions:
What does my current (Maple Leaf) CHC look like?
What do other CHCs look like?
Take 15 minutes to review the samples and jot down some points on
the Table Exercise template.
www.HQOntario.ca

31
Exercise Recap
www.HQOntario.ca

32
QIP Query
www.HQOntario.ca

33
How would I start to answer these questions?
Step 3: Using the information in the handouts on your table labelled:
Sample QIP Query Output – Cancer Screening
Sample QIP Query Output – Diabetes
Sample QIP Query Output – Hospital Admissions
Try answering a basic question:
Is anyone doing anything different to improve their support to their
clients and their outcomes for:
– illness prevention and early detection (cancer screening)
– chronic illness management (diabetes)
– transitions between chc and hospital (readmissions)
Take 20 minutes to review the samples and jot down some
points on the Table Exercise template.
www.HQOntario.ca

34
Exercise Recap
www.HQOntario.ca
• Is anyone doing anything different on…cancer
screening…diabetes care…hospital admissions…?
• Are any of those ideas something to consider testing at
my (Maple Leaf) CHC?
• Jot those ideas down on the exercise template
35
Debrief
www.HQOntario.ca
• What went well….even better if….
• Any ideas for us to try that would support you using
this information to help improve quality?
36
Additional Quality Improvement Resources
• http://qualitycompass.hqontario.ca/portal/getting-started
• http://www.ideasontario.ca/
• IHI Open School: http://www.hqontario.ca/Quality-Improvement/Health-
Links/Learning-Opportunities
www.HQOntario.ca