Embed Size (px)
Citation preview
BA441 – 1/14/08BA441 – 1/14/08
Dean’s Lecture SeriesDean’s Lecture Series– January 10January 10– Hand in notes (put name on paper)Hand in notes (put name on paper)
BA441 – 1/14/08BA441 – 1/14/08
Current EventsCurrent Events
– Earnings warningsEarnings warnings
– Mergers and acquisitionsMergers and acquisitions
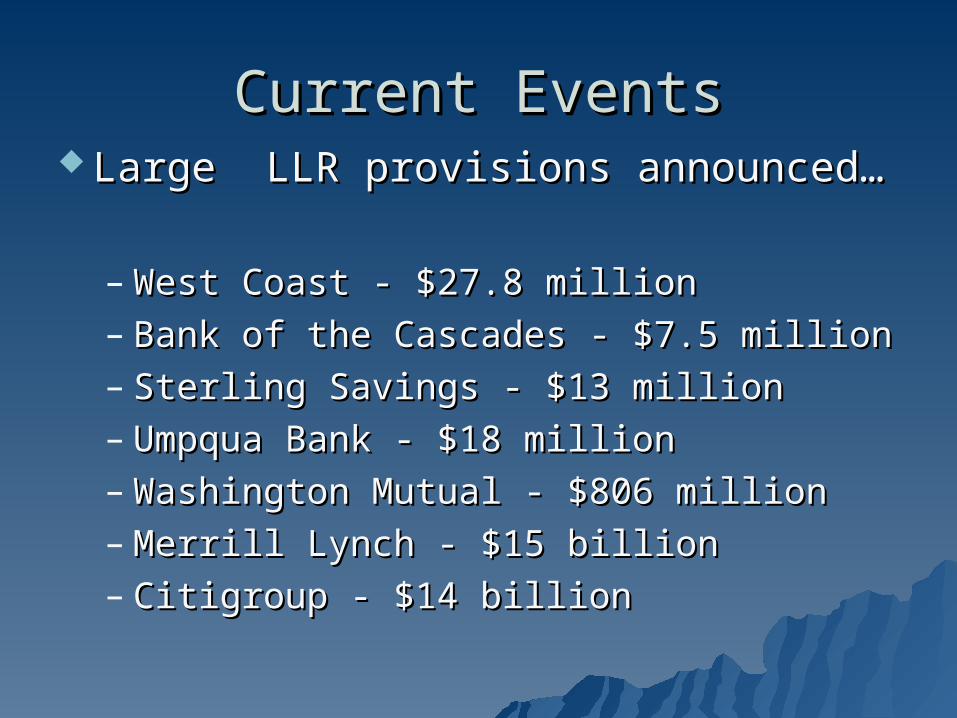
Current EventsCurrent Events Large LLR provisions announced…Large LLR provisions announced…
– West Coast - $27.8 millionWest Coast - $27.8 million– Bank of the Cascades - $7.5 millionBank of the Cascades - $7.5 million– Sterling Savings - $13 millionSterling Savings - $13 million– Umpqua Bank - $18 millionUmpqua Bank - $18 million– Washington Mutual - $806 millionWashington Mutual - $806 million– Merrill Lynch - $15 billionMerrill Lynch - $15 billion– Citigroup - $14 billionCitigroup - $14 billion
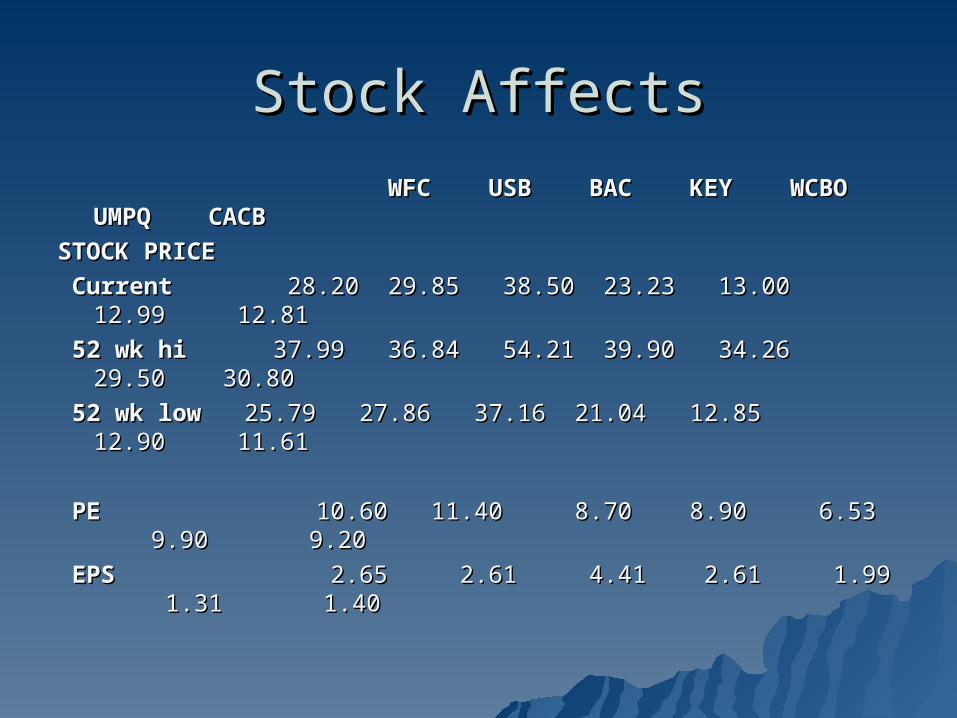
Stock AffectsStock Affects
WFC WFC USB USB BACBAC KEYKEY WCBO WCBO UMPQ UMPQ CACBCACB
STOCK PRICESTOCK PRICE
CurrentCurrent 28.20 29.85 38.50 23.23 13.00 12.99 12.81 28.20 29.85 38.50 23.23 13.00 12.99 12.81
52 wk hi52 wk hi 37.99 36.84 54.21 39.90 34.26 29.50 30.80 37.99 36.84 54.21 39.90 34.26 29.50 30.80
52 wk low52 wk low 25.79 27.86 37.16 21.04 12.85 12.90 11.61 25.79 27.86 37.16 21.04 12.85 12.90 11.61
PEPE 10.60 11.40 8.70 8.90 6.53 9.90 9.20 10.60 11.40 8.70 8.90 6.53 9.90 9.20
EPSEPS 2.65 2.61 4.41 2.61 1.99 1.31 1.40 2.65 2.61 4.41 2.61 1.99 1.31 1.40
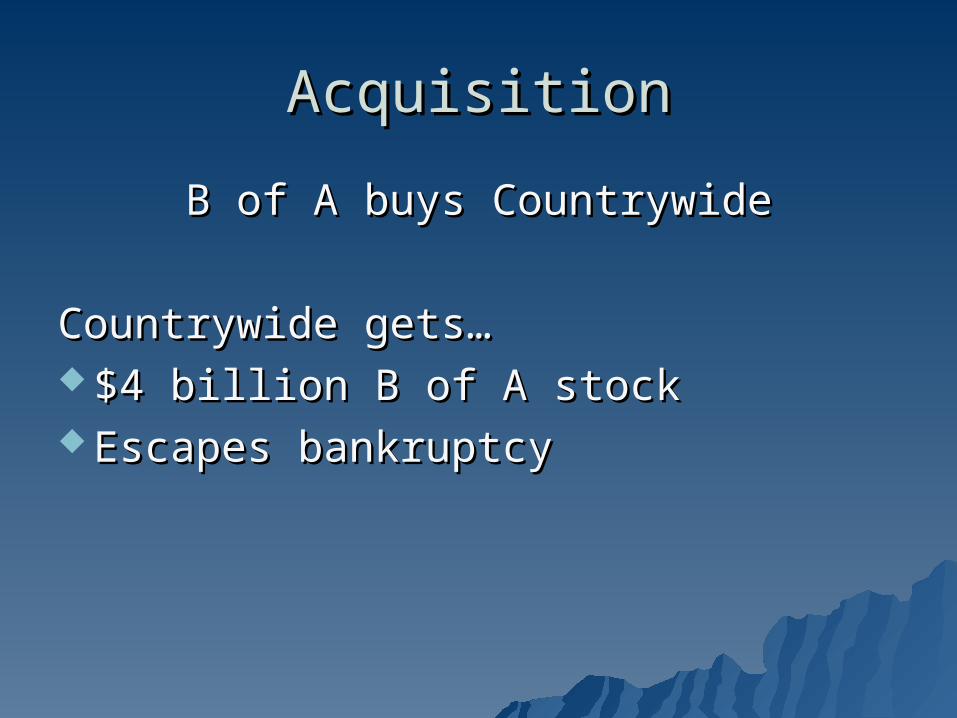
AcquisitionAcquisition
B of A buys CountrywideB of A buys Countrywide
Countrywide gets…Countrywide gets… $4 billion B of A stock$4 billion B of A stock Escapes bankruptcyEscapes bankruptcy
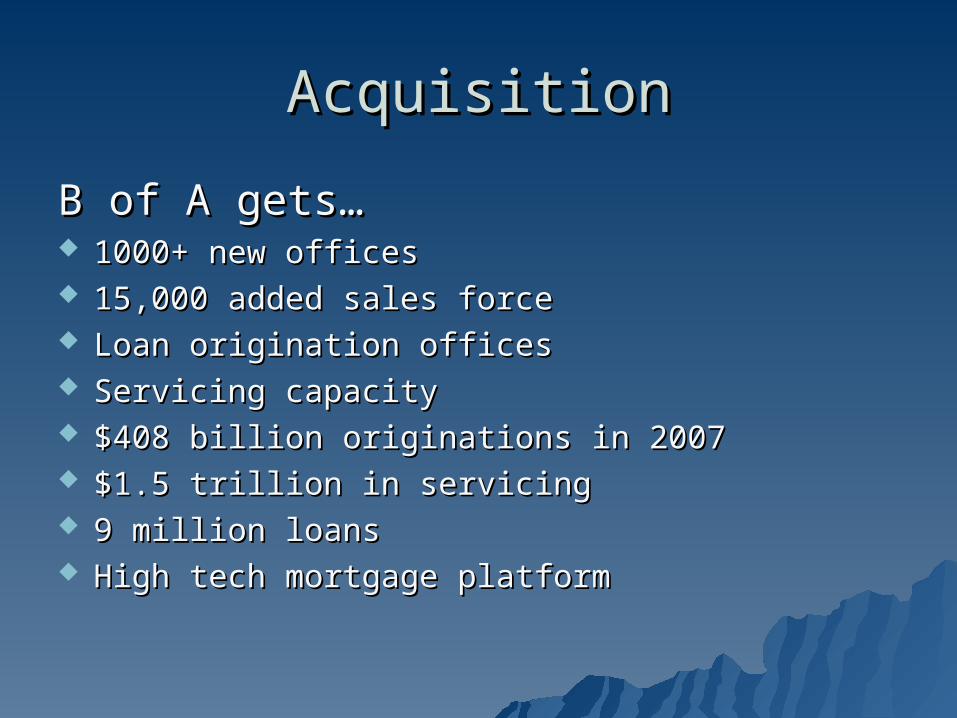
AcquisitionAcquisition
B of A gets…B of A gets… 1000+ new offices1000+ new offices 15,000 added sales force15,000 added sales force Loan origination officesLoan origination offices Servicing capacityServicing capacity $408 billion originations in 2007$408 billion originations in 2007 $1.5 trillion in servicing$1.5 trillion in servicing 9 million loans9 million loans High tech mortgage platformHigh tech mortgage platform

AcquisitionAcquisition
““affirms our position as the nation’s affirms our position as the nation’s premier lender to consumers”premier lender to consumers”
Ken Lewis, Chairman & CEO, BACKen Lewis, Chairman & CEO, BAC
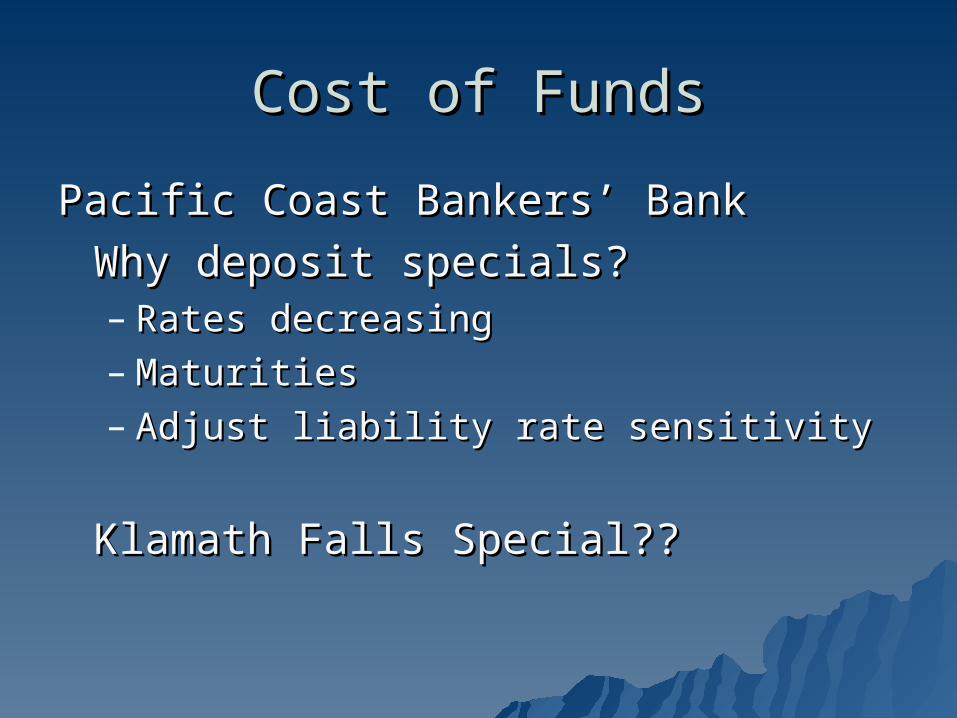
Cost of FundsCost of Funds
Pacific Coast Bankers’ BankPacific Coast Bankers’ Bank
Why deposit specials?Why deposit specials?– Rates decreasingRates decreasing– MaturitiesMaturities– Adjust liability rate sensitivityAdjust liability rate sensitivity
Klamath Falls Special??Klamath Falls Special??
Fundamental Analysis: Fundamental Analysis: RatiosRatios
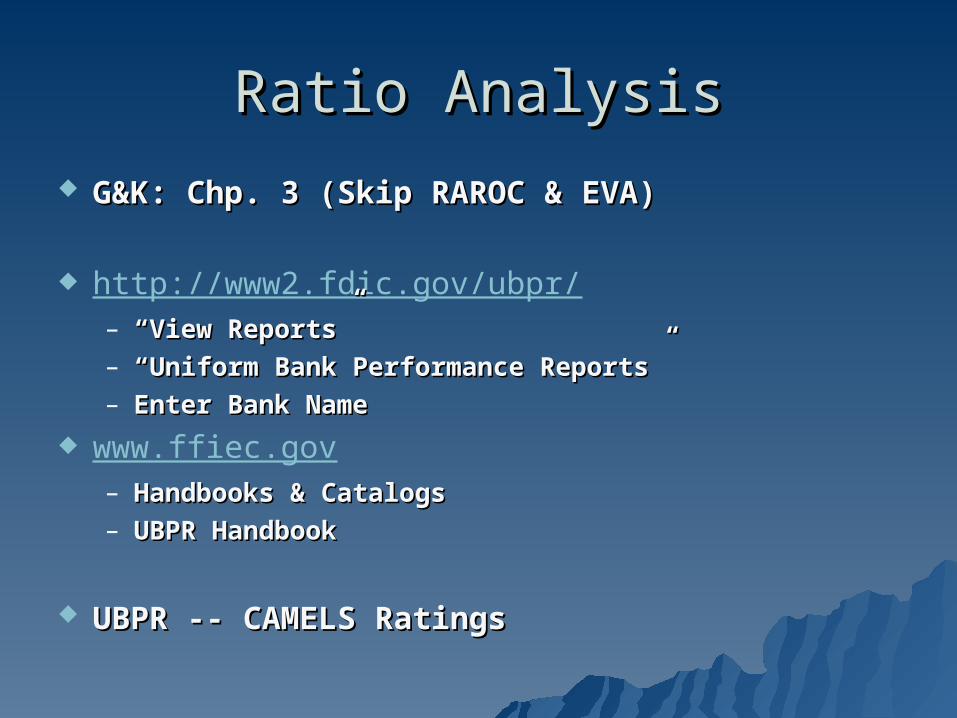
Ratio AnalysisRatio Analysis
G&K: Chp. 3 (Skip RAROC & EVA)G&K: Chp. 3 (Skip RAROC & EVA)
http://www2.fdic.gov/ubpr/– ““View Reports”View Reports”– ““Uniform Bank Performance Reports”Uniform Bank Performance Reports”– Enter Bank NameEnter Bank Name
www.ffiec.gov– Handbooks & CatalogsHandbooks & Catalogs– UBPR HandbookUBPR Handbook
UBPR -- CAMELS RatingsUBPR -- CAMELS Ratings
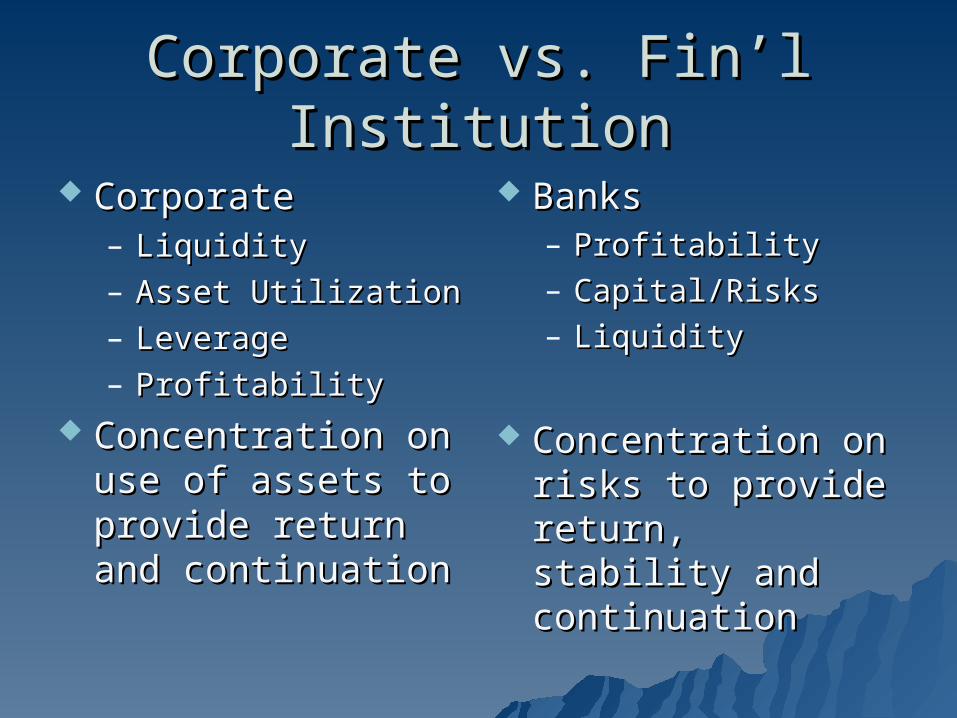
Corporate vs. Fin’l InstitutionCorporate vs. Fin’l Institution
CorporateCorporate– LiquidityLiquidity– Asset UtilizationAsset Utilization– LeverageLeverage– ProfitabilityProfitability
Concentration on Concentration on use of assets to use of assets to provide return and provide return and continuationcontinuation
BanksBanks– ProfitabilityProfitability– Capital/RisksCapital/Risks– LiquidityLiquidity
Concentration on Concentration on risks to provide risks to provide return, stability return, stability and continuationand continuation
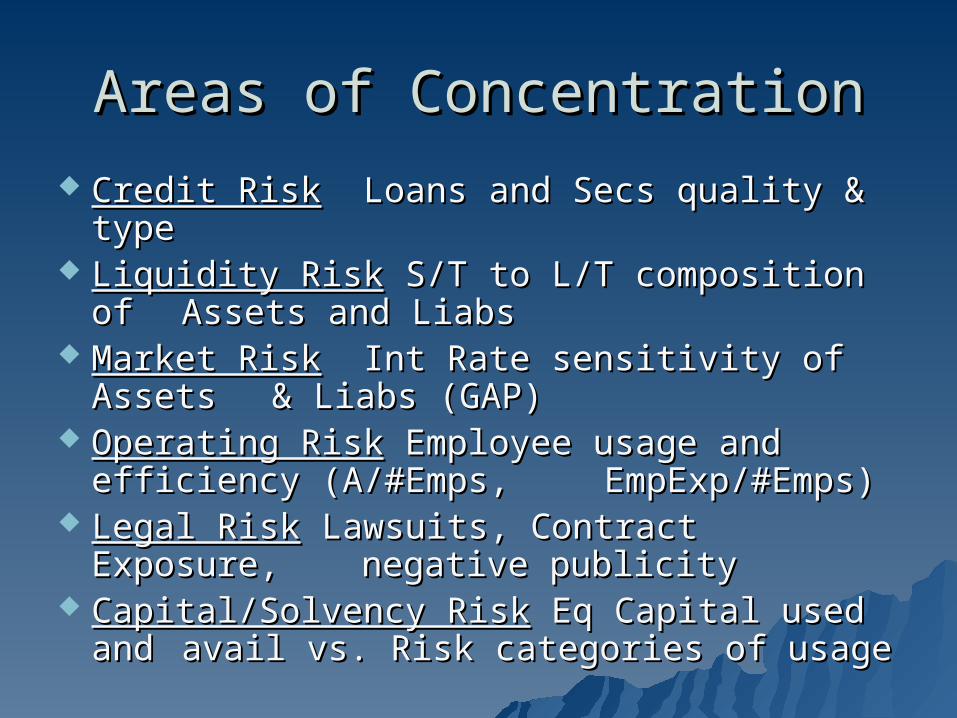
Areas of ConcentrationAreas of Concentration
Credit RiskCredit Risk Loans and Secs quality & type Loans and Secs quality & type Liquidity RiskLiquidity Risk S/T to L/T composition of S/T to L/T composition of
Assets and LiabsAssets and Liabs Market RiskMarket Risk Int Rate sensitivity of Assets Int Rate sensitivity of Assets
& Liabs (GAP)& Liabs (GAP) Operating RiskOperating Risk Employee usage and Employee usage and
efficiency (A/#Emps, efficiency (A/#Emps, EmpExp/#Emps) EmpExp/#Emps)
Legal RiskLegal Risk Lawsuits, Contract Exposure, Lawsuits, Contract Exposure, negative publicitynegative publicity
Capital/Solvency RiskCapital/Solvency Risk Eq Capital used and Eq Capital used and avail vs. Risk categories of usage avail vs. Risk categories of usage
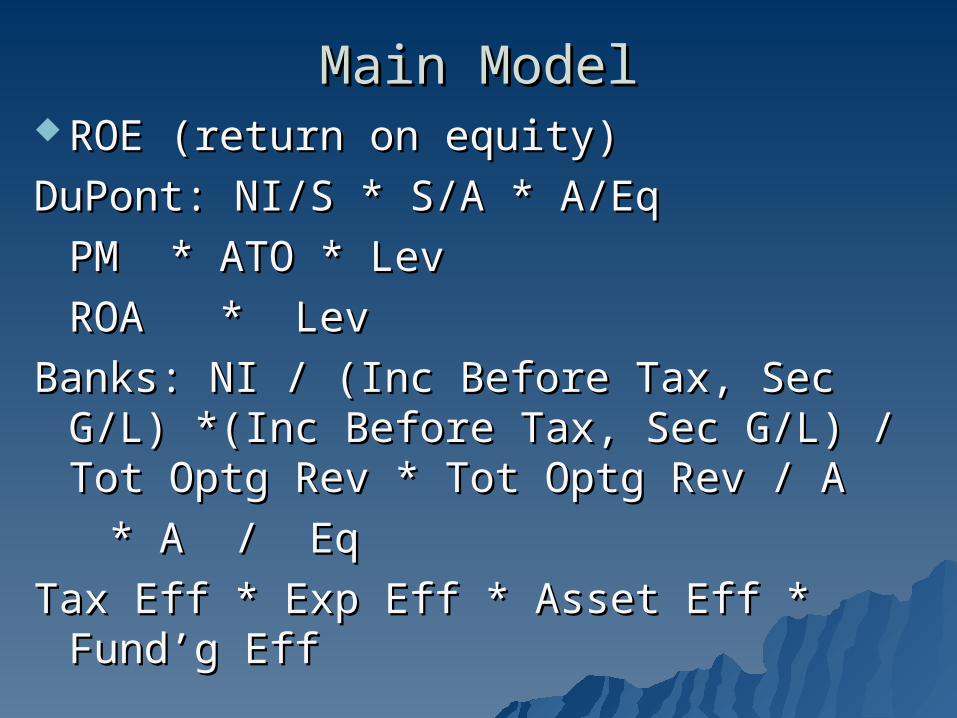
Main ModelMain Model ROE (return on equity)ROE (return on equity)
DuPont: NI/S * S/A * A/EqDuPont: NI/S * S/A * A/Eq
PM * ATO * LevPM * ATO * Lev
ROA * LevROA * Lev
Banks: NI / (Inc Before Tax, Sec G/L) Banks: NI / (Inc Before Tax, Sec G/L) *(Inc Before Tax, Sec G/L) / *(Inc Before Tax, Sec G/L) /
Tot Optg Rev * Tot Optg Rev / A Tot Optg Rev * Tot Optg Rev / A
* A / Eq* A / Eq
Tax Eff * Exp Eff * Asset Eff * Fund’g EffTax Eff * Exp Eff * Asset Eff * Fund’g Eff
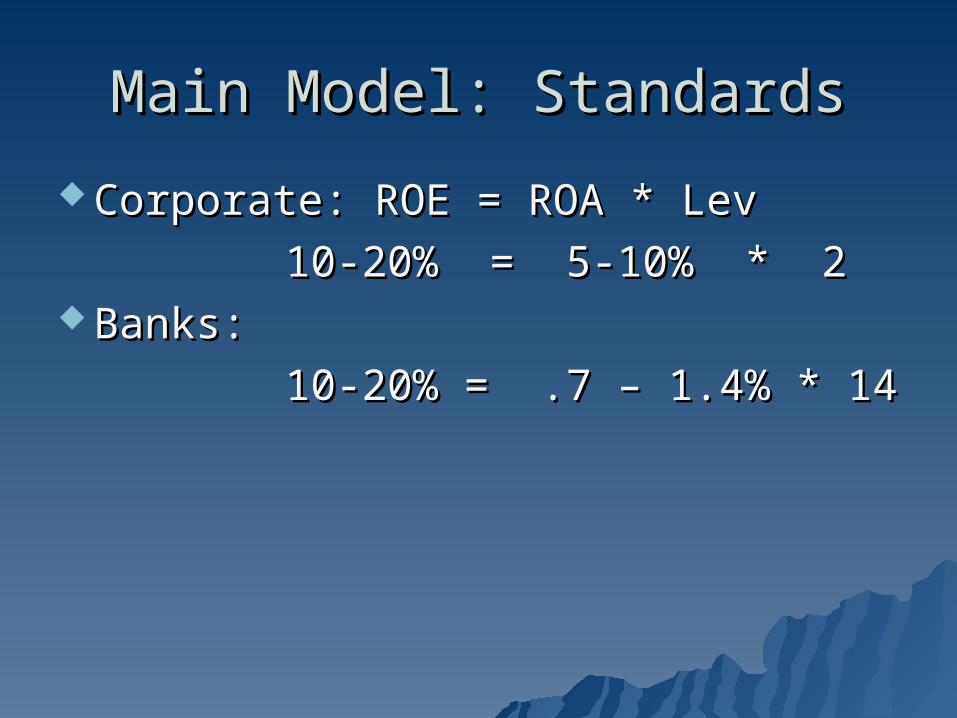
Main Model: StandardsMain Model: Standards
Corporate: ROE = ROA * LevCorporate: ROE = ROA * Lev
10-20% = 5-10% * 210-20% = 5-10% * 2 Banks:Banks:
10-20% = .7 – 1.4% * 1410-20% = .7 – 1.4% * 14
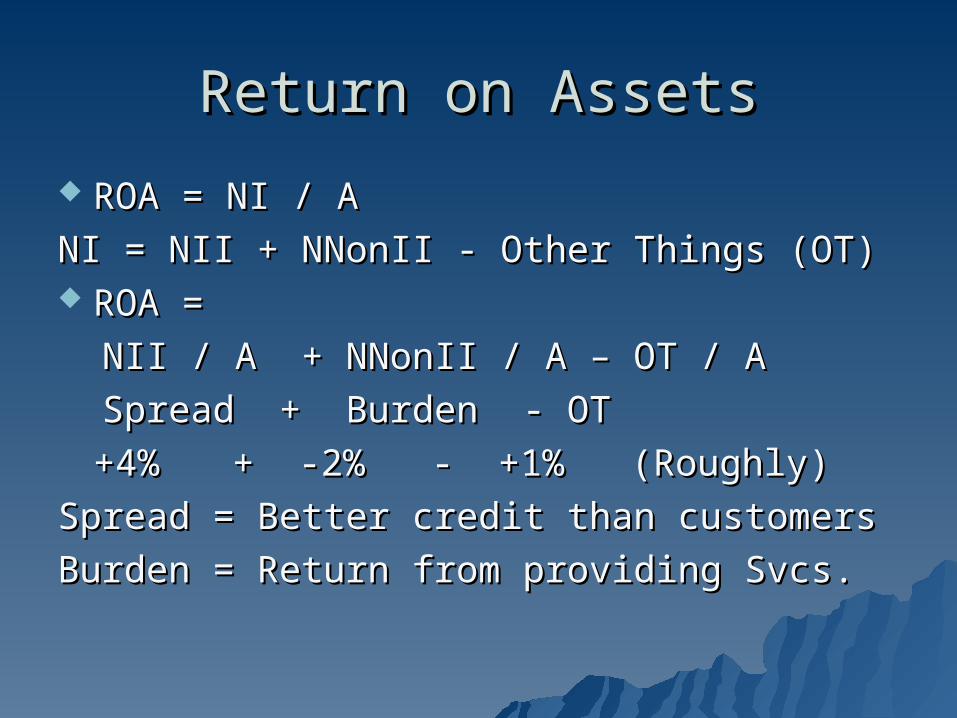
Return on AssetsReturn on Assets
ROA = NI / AROA = NI / A
NI = NII + NNonII - Other Things (OT)NI = NII + NNonII - Other Things (OT) ROA =ROA =
NII / A + NNonII / A – OT / ANII / A + NNonII / A – OT / A
Spread + Burden - OTSpread + Burden - OT
+4%+4% + -2% - +1% (Roughly) + -2% - +1% (Roughly)
Spread = Better credit than customersSpread = Better credit than customers
Burden = Return from providing Svcs.Burden = Return from providing Svcs.
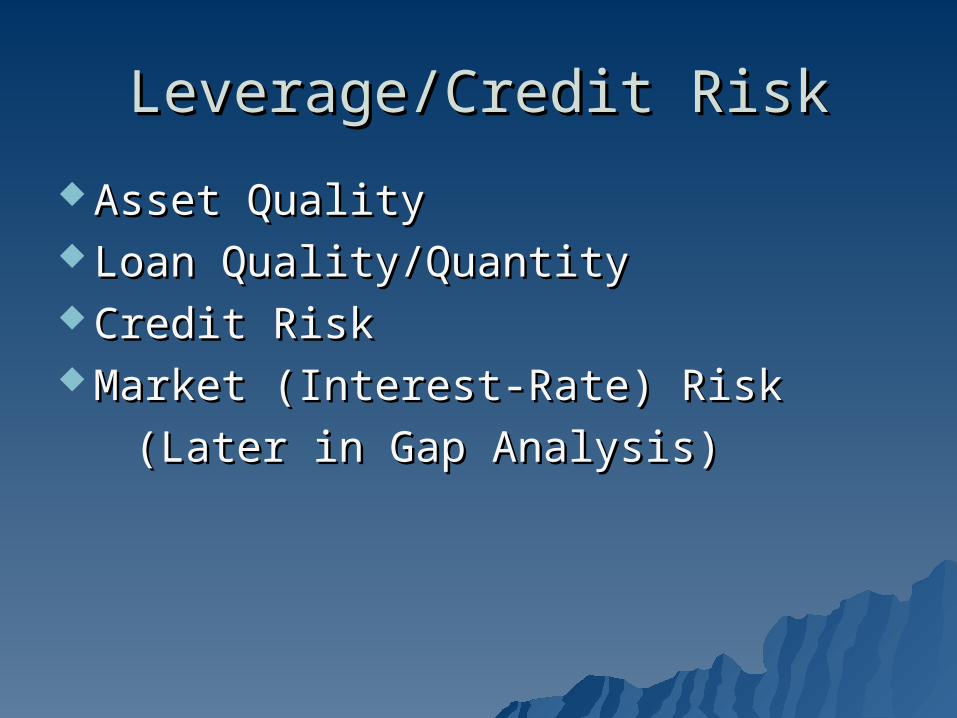
Leverage/Credit RiskLeverage/Credit Risk
Asset QualityAsset Quality Loan Quality/QuantityLoan Quality/Quantity Credit RiskCredit Risk Market (Interest-Rate) RiskMarket (Interest-Rate) Risk
(Later in Gap Analysis)(Later in Gap Analysis)
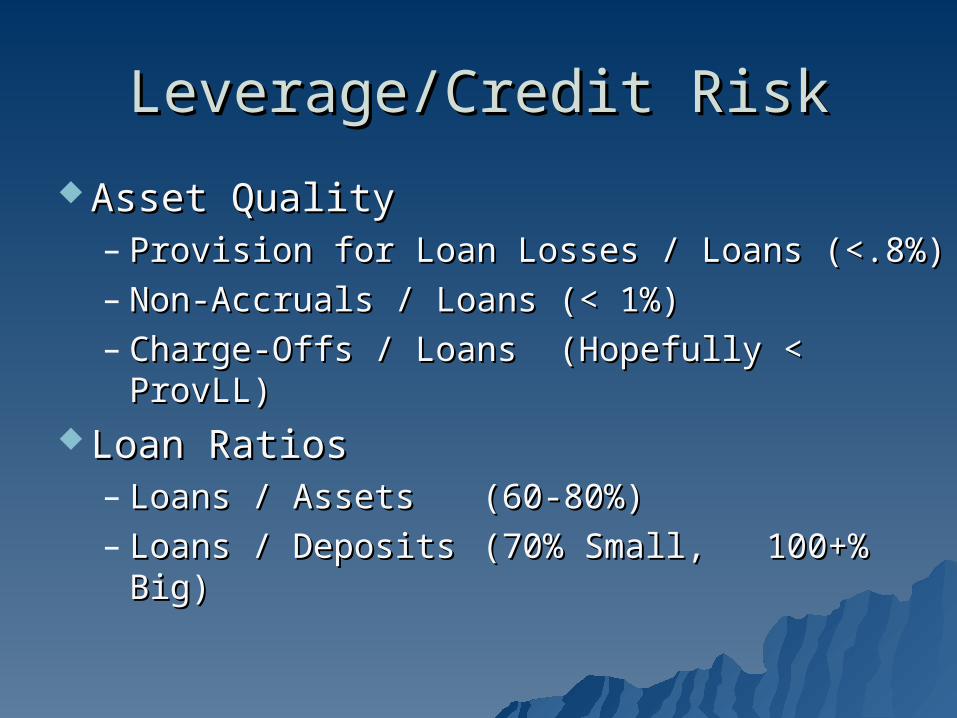
Leverage/Credit RiskLeverage/Credit Risk
Asset QualityAsset Quality– Provision for Loan Losses / Loans (<.8%)Provision for Loan Losses / Loans (<.8%)– Non-Accruals / Loans (< 1%)Non-Accruals / Loans (< 1%)– Charge-Offs / Loans (Hopefully < ProvLL)Charge-Offs / Loans (Hopefully < ProvLL)
Loan RatiosLoan Ratios– Loans / AssetsLoans / Assets (60-80%)(60-80%)– Loans / Deposits Loans / Deposits (70% Small,(70% Small,
100+% Big) 100+% Big)
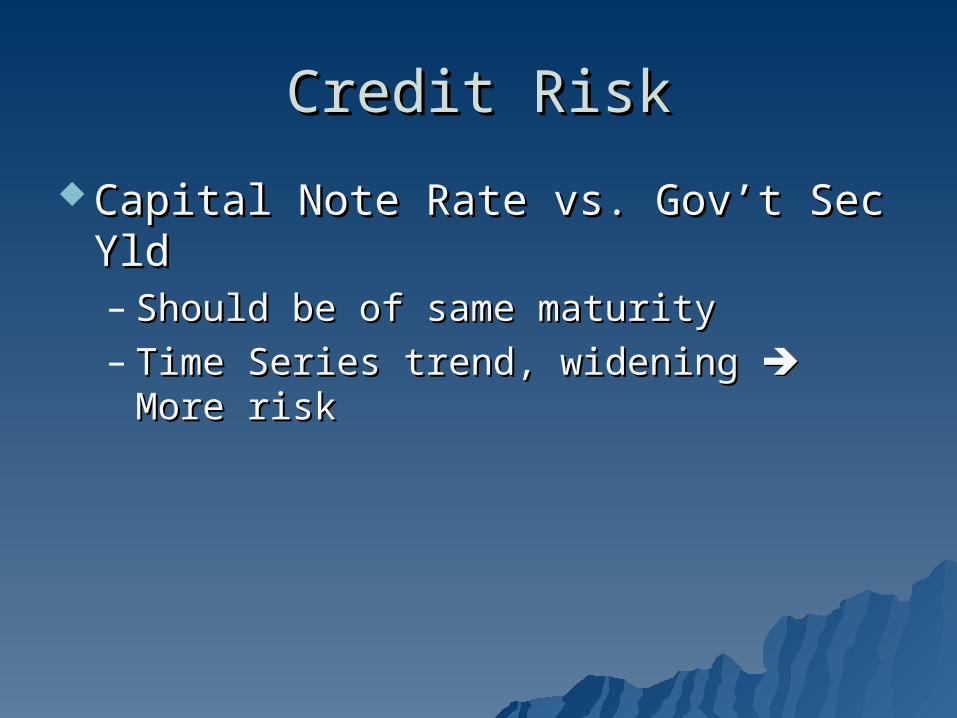
Credit RiskCredit Risk
Capital Note Rate vs. Gov’t Sec YldCapital Note Rate vs. Gov’t Sec Yld– Should be of same maturityShould be of same maturity– Time Series trend, widening Time Series trend, widening More risk More risk
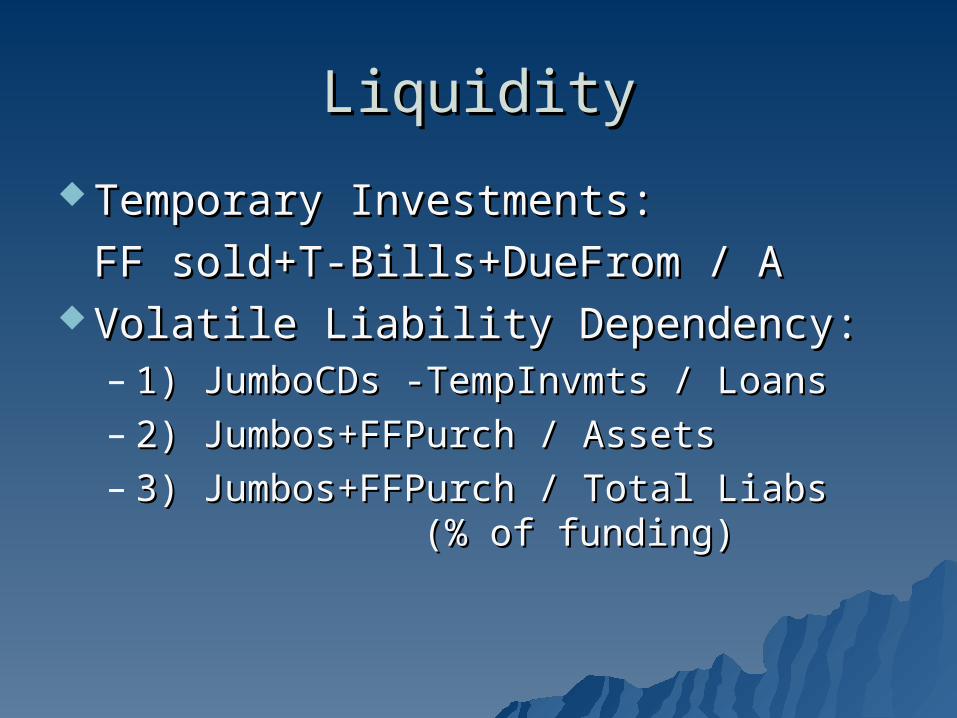
LiquidityLiquidity
Temporary Investments:Temporary Investments:
FF sold+T-Bills+DueFrom / AFF sold+T-Bills+DueFrom / A Volatile Liability Dependency: Volatile Liability Dependency:
– 1) JumboCDs -TempInvmts / Loans1) JumboCDs -TempInvmts / Loans– 2) Jumbos+FFPurch / Assets2) Jumbos+FFPurch / Assets– 3) Jumbos+FFPurch / Total Liabs 3) Jumbos+FFPurch / Total Liabs
(% of funding)(% of funding)
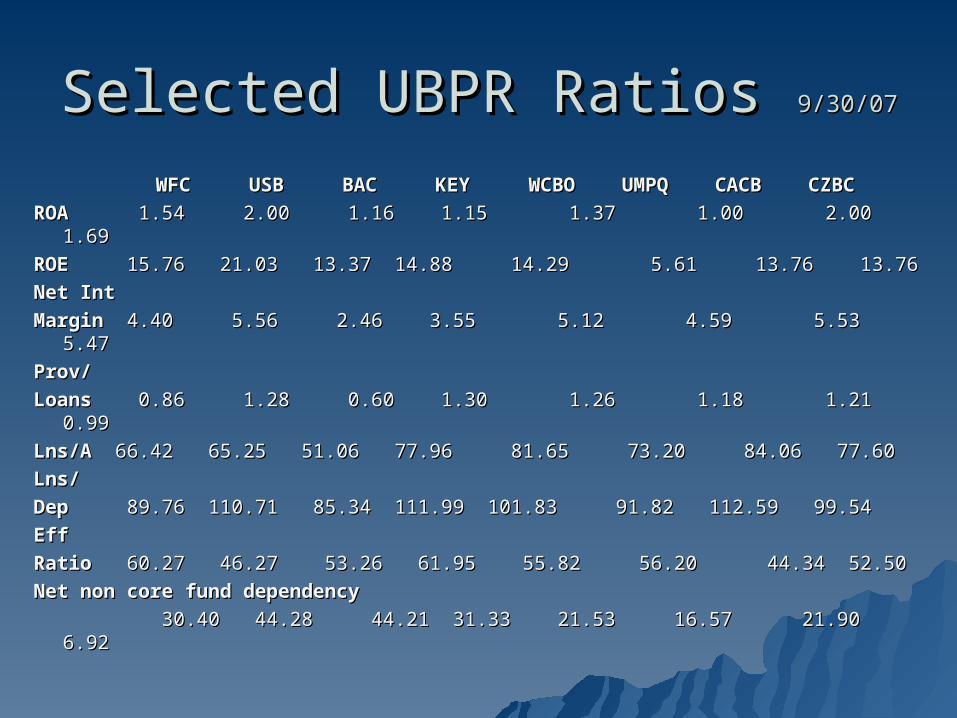
Selected UBPR Ratios Selected UBPR Ratios 9/30/079/30/07
WFC USB BAC KEY WFC USB BAC KEY WCBO WCBO UMPQ CACB CZBCUMPQ CACB CZBC
ROAROA 1.54 2.00 1.16 1.15 1.37 1.00 2.00 1.69 1.54 2.00 1.16 1.15 1.37 1.00 2.00 1.69
ROEROE 15.76 21.03 13.37 14.88 14.29 5.61 13.76 13.76 15.76 21.03 13.37 14.88 14.29 5.61 13.76 13.76
Net IntNet Int
MarginMargin 4.40 5.56 2.46 3.55 5.12 4.59 5.53 5.47 4.40 5.56 2.46 3.55 5.12 4.59 5.53 5.47
Prov/Prov/
LoansLoans 0.86 1.28 0.60 1.30 1.26 1.18 1.21 0.99 0.86 1.28 0.60 1.30 1.26 1.18 1.21 0.99
Lns/ALns/A 66.42 65.25 51.06 77.96 81.65 73.20 84.06 77.60 66.42 65.25 51.06 77.96 81.65 73.20 84.06 77.60
Lns/Lns/
DepDep 89.76 110.71 85.34 111.99 101.83 91.82 112.59 99.54 89.76 110.71 85.34 111.99 101.83 91.82 112.59 99.54
EffEff
RatioRatio 60.27 46.27 53.26 61.95 55.82 56.20 44.34 52.50 60.27 46.27 53.26 61.95 55.82 56.20 44.34 52.50
Net non core fund dependencyNet non core fund dependency
30.40 44.28 44.21 31.33 21.53 16.57 21.90 6.92 30.40 44.28 44.21 31.33 21.53 16.57 21.90 6.92
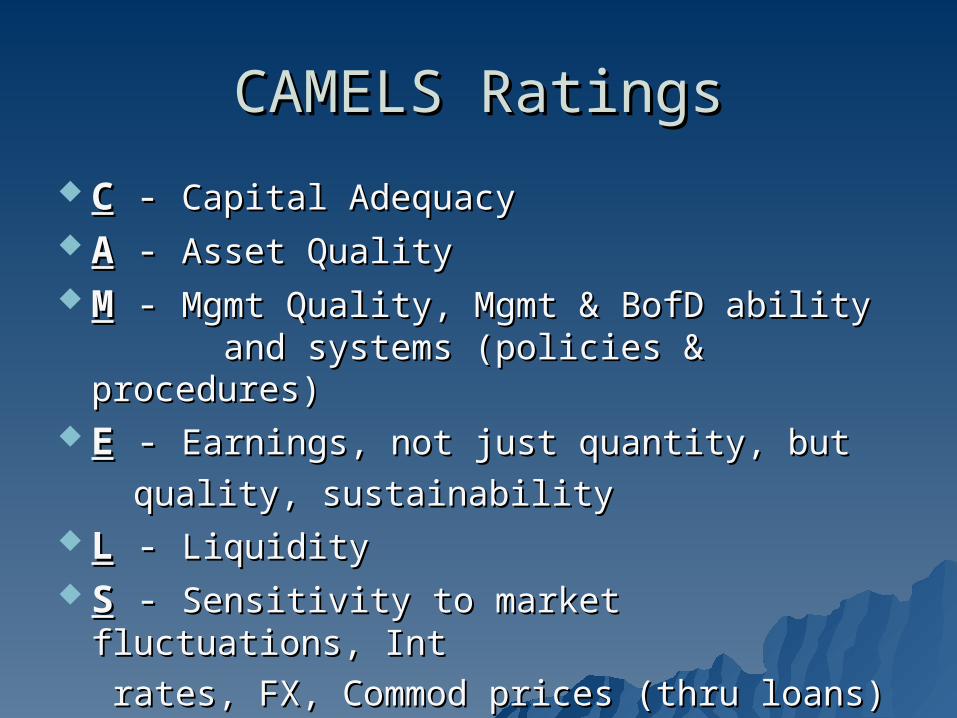
CAMELS RatingsCAMELS Ratings
CC - - Capital AdequacyCapital Adequacy AA - - Asset QualityAsset Quality MM - - Mgmt Quality, Mgmt & BofD ability Mgmt Quality, Mgmt & BofD ability
and systems (policies & procedures)and systems (policies & procedures) EE - - Earnings, not just quantity, but Earnings, not just quantity, but
quality, sustainabilityquality, sustainability LL - - LiquidityLiquidity SS - - Sensitivity to market fluctuations, IntSensitivity to market fluctuations, Int
rates, FX, Commod prices (thru rates, FX, Commod prices (thru loans)loans)


![[KUG Award 2009] I Phone I Put My Dream Into My Hand Sungjin Lee](https://img.pdfslide.net/doc/110x75/54b891d44a795982368b45a7/kug-award-2009-i-phone-i-put-my-dream-into-my-hand-sungjin-lee.jpg)