Embed Size (px)
Citation preview
Developing the future.
Baader Bank Investment Conference
Presentation, Facts & Figures
September 25, 2013
Developing the future.
Baader Bank Investment Conference September 25, 2013
1
Agenda
Presentation slides 2-11
Facts & Figures slides 15-62
Developing the future.
Baader Bank Investment Conference September 25, 2013
2
Significant cash flow
Low net financial debt
Investment grade
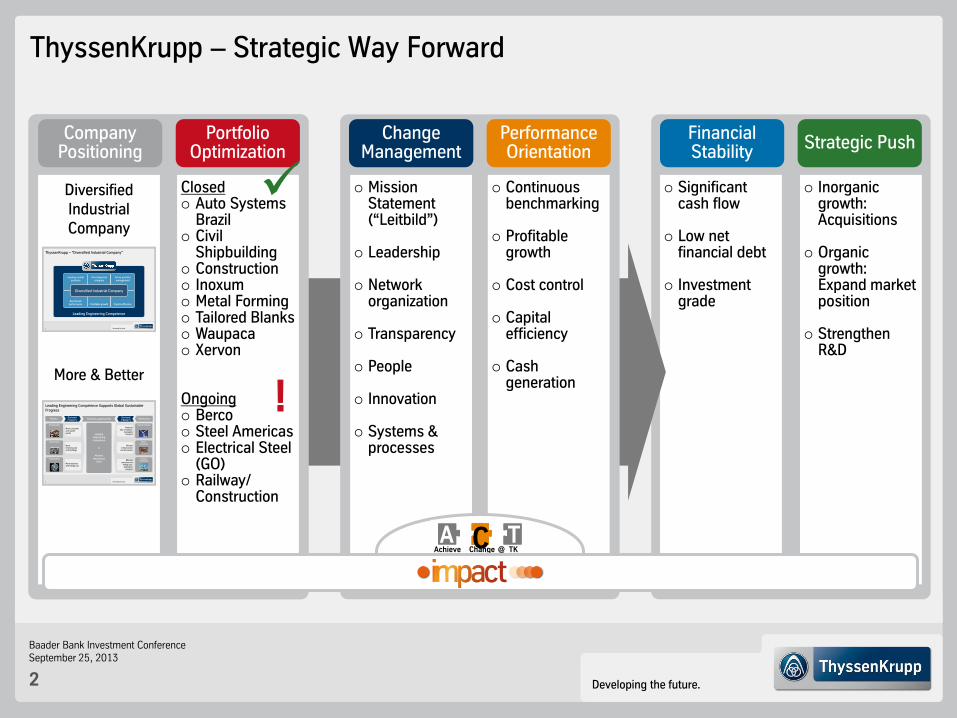
ThyssenKrupp – Strategic Way Forward
Financial Stability
Strategic Push
Inorganic growth: Acquisitions
Organic growth: Expand market position
Strengthen
R&D
Performance Orientation
Change Management
Portfolio Optimization
Company Positioning
Closed Auto Systems
Brazil Civil
Shipbuilding Construction Inoxum Metal Forming Tailored Blanks Waupaca Xervon Ongoing Berco Steel Americas Electrical Steel
(GO) Railway/
Construction
Mission Statement (“Leitbild”)
Leadership
Network organization
Transparency
People
Innovation
Systems & processes
Continuous benchmarking
Profitable growth
Cost control
Capital efficiency
Cash generation !
Diversified Industrial Company
More & Better
4 Developing the future.
ThyssenKrupp – “Diversified Industrial Company”
Leading Engineering Competence
Leading market positions
One integrated company
Active portfolio management
Benchmark performance Profitable growth Capital efficiency
Diversified Industrial Company
5 Developing the future.
Climate change
Urbanization
Globalization
Leading engineering competence
in
MaterialMechanical
Plant
More consumer and capital goods
More resource and energy use
More infrastructure and buildings
ReducedCO2 emissions,
renewable energies
Efficient resource and
energy use,alternative
energies
Efficient infrastructure
and processes
Demand (“more”)
Drivers
Demography
Finite resources
Political framework
Leading Engineering Competence Supports Global Sustainable Progress
Business opportunities RestrictionsDemand (“better”)
TKA C T
Achieve Change @ TKAA CC TT
Achieve Change @C
Developing the future.
Baader Bank Investment Conference September 25, 2013
3
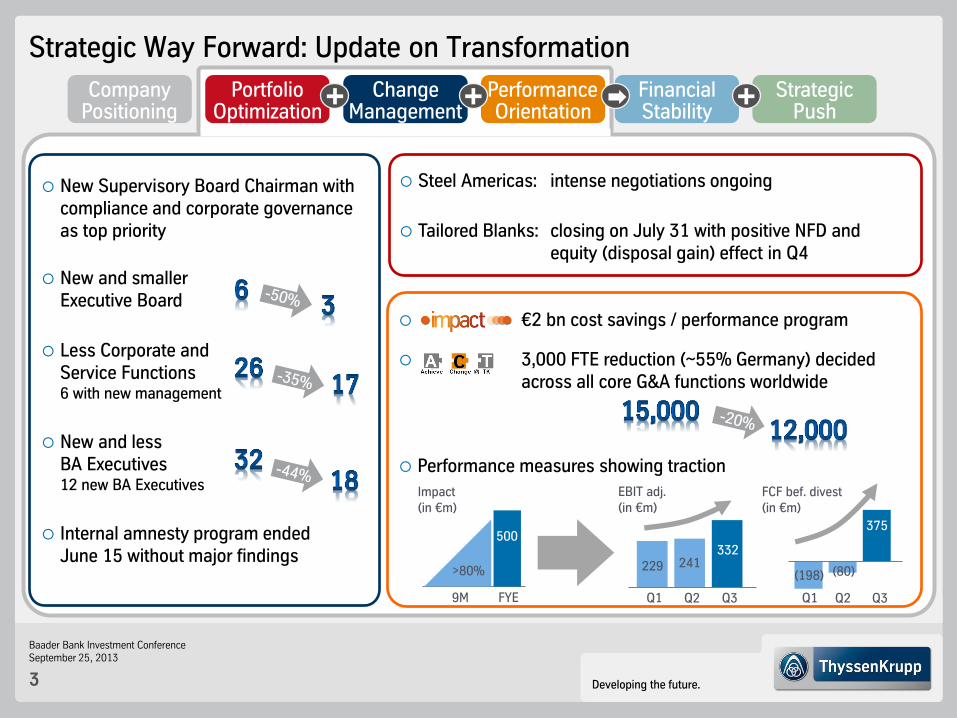
Strategic Way Forward: Update on Transformation
New Supervisory Board Chairman with compliance and corporate governance as top priority
New and smaller Executive Board
Less Corporate and Service Functions 6 with new management
New and less BA Executives 12 new BA Executives
Internal amnesty program ended June 15 without major findings
Financial Stability
Strategic Push
Performance Orientation
Change Management
Portfolio Optimization
Company Positioning + + +
€2 bn cost savings / performance program
3,000 FTE reduction (~55% Germany) decided across all core G&A functions worldwide
Performance measures showing traction
Steel Americas: intense negotiations ongoing
Tailored Blanks: closing on July 31 with positive NFD and equity (disposal gain) effect in Q4
Q1 Q2 Q3
229 241 332
EBIT adj. (in €m)
Q1 Q2 Q3
(198) (80)
375
FCF bef. divest (in €m)
9M
Impact (in €m)
500
FYE
>80%
Developing the future.
Baader Bank Investment Conference September 25, 2013
4
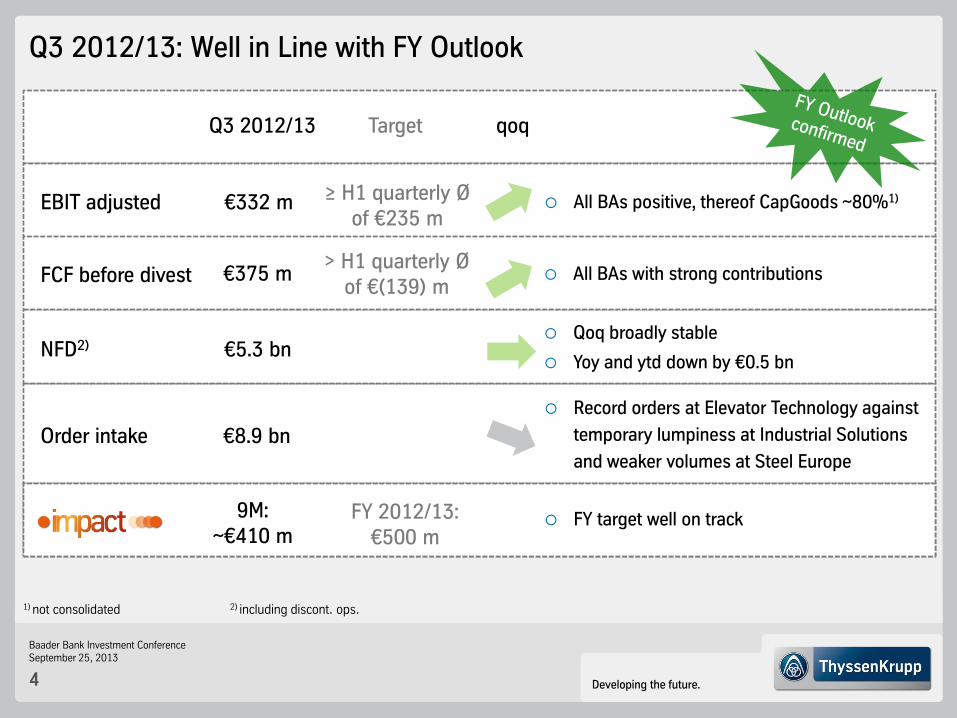
Q3 2012/13: Well in Line with FY Outlook
Q3 2012/13 Target qoq
EBIT adjusted
FCF before divest
NFD2)
Order intake
€332 m ≥ H1 quarterly Ø of €235 m
€375 m
€5.3 bn
€8.9 bn
Record orders at Elevator Technology against
temporary lumpiness at Industrial Solutions
and weaker volumes at Steel Europe
FY target well on track
All BAs positive, thereof CapGoods ~80%1)
FY 2012/13: €500 m
All BAs with strong contributions
Qoq broadly stable
Yoy and ytd down by €0.5 bn
1) not consolidated
> H1 quarterly Ø of €(139) m
9M: ~€410 m
2) including discont. ops.
Developing the future.
Baader Bank Investment Conference September 25, 2013
5
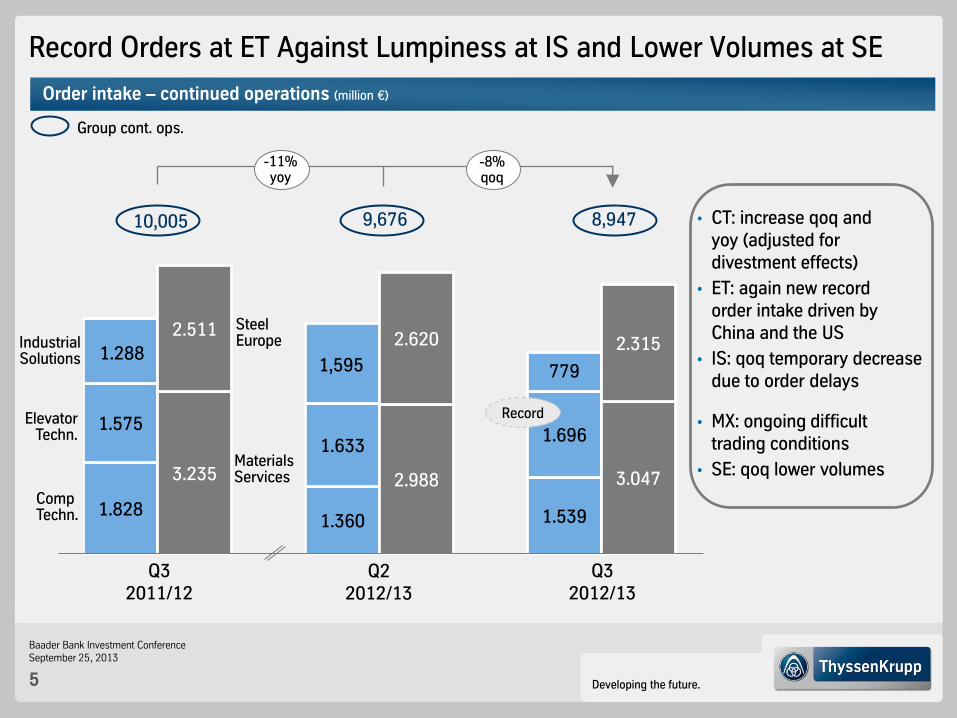
1.828 1.360 1.539
1.575 1.633
1.696
1.288 1,595 779
3.235 2.988 3.047
2.511 2.620 2.315
9,676 8,947
Record Orders at ET Against Lumpiness at IS and Lower Volumes at SE
10,005
Group cont. ops.
-8% qoq
Order intake – continued operations (million €)
• CT: increase qoq and yoy (adjusted for divestment effects)
• ET: again new record order intake driven by China and the US
• IS: qoq temporary decrease due to order delays
• MX: ongoing difficult trading conditions
• SE: qoq lower volumes
Q3 2012/13
Q3 2011/12
Q2 2012/13
-11% yoy
Industrial Solutions
Elevator Techn.
Comp Techn.
Materials Services
Steel Europe
Record
Developing the future.
Baader Bank Investment Conference September 25, 2013
6
3.697 3.778
13.331 15.761
4.568 4.495
5.464 4.223
4.582 4.945
4.046 4,376
10.009 8.800
8.206 7.338
28,265
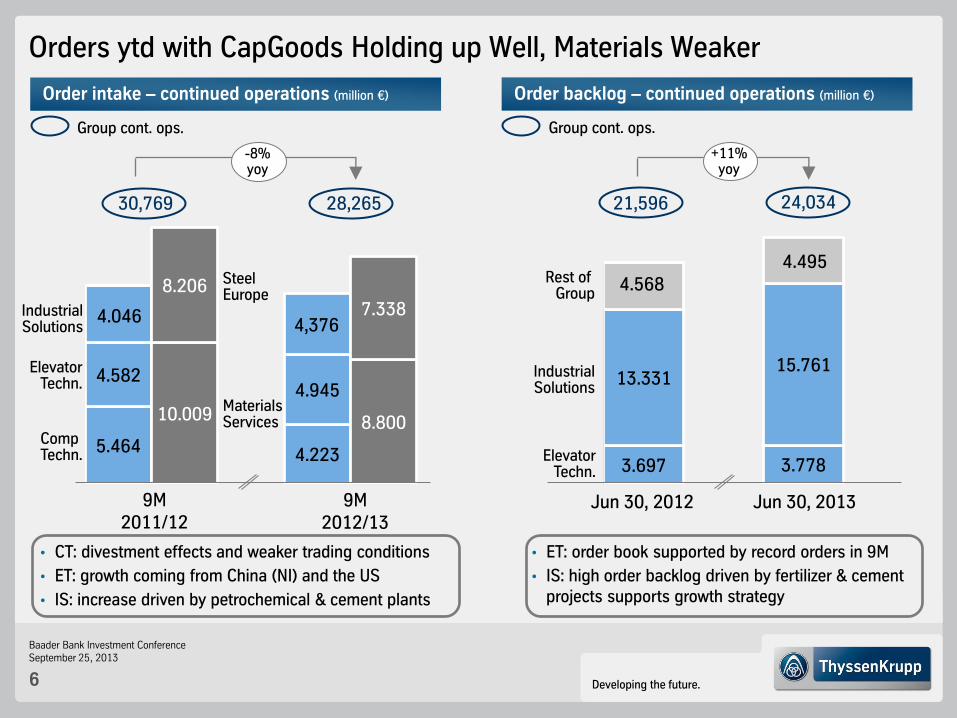
Orders ytd with CapGoods Holding up Well, Materials Weaker
30,769
Group cont. ops.
Order intake – continued operations (million €)
• CT: divestment effects and weaker trading conditions
• ET: growth coming from China (NI) and the US
• IS: increase driven by petrochemical & cement plants
9M 2011/12
9M 2012/13
-8% yoy
Industrial Solutions
Elevator Techn.
Comp Techn.
Materials Services
Steel Europe
24,034 21,596
Group cont. ops.
Order backlog – continued operations (million €)
• ET: order book supported by record orders in 9M
• IS: high order backlog driven by fertilizer & cement projects supports growth strategy
Jun 30, 2012 Jun 30, 2013
+11% yoy
Industrial Solutions
Elevator Techn.
Rest of Group
Developing the future.
Baader Bank Investment Conference September 25, 2013
7
134 63 81
147
146 172
163
180 156
92 58 62
52 9
62
Q3 2012/13
Q3 2011/12
Q2 2012/13
Elevator Techn.
Comp Techn. Materials
Services
Steel Europe
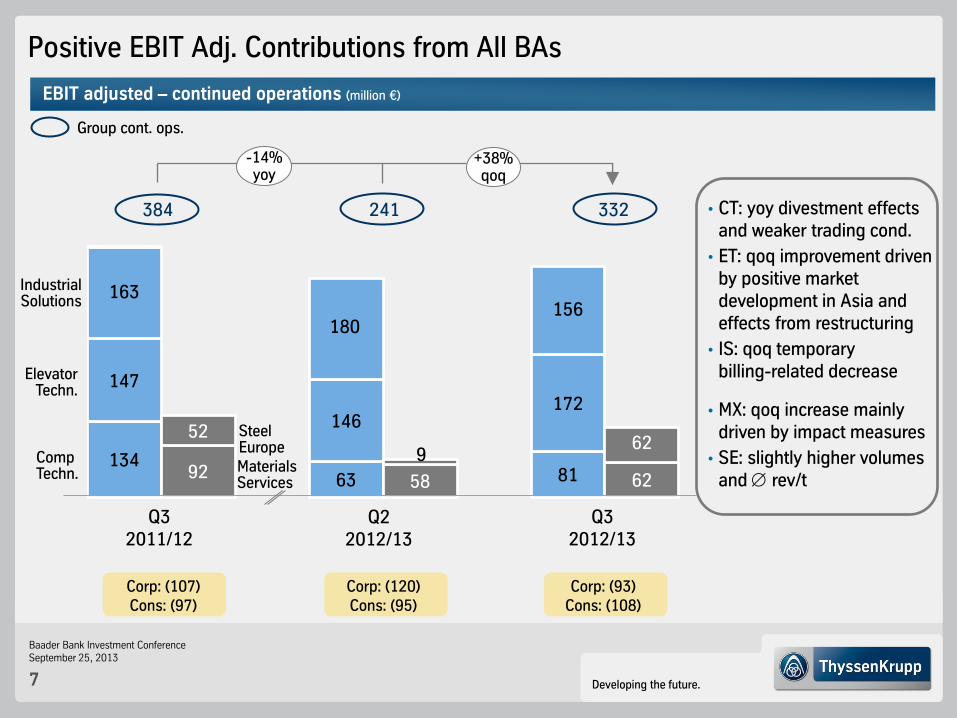
241 332
-14% yoy
384
+38% qoq
Corp: (107) Cons: (97)
Corp: (120) Cons: (95)
Corp: (93) Cons: (108)
• CT: yoy divestment effects and weaker trading cond.
• ET: qoq improvement driven by positive market development in Asia and effects from restructuring
• IS: qoq temporary billing-related decrease
• MX: qoq increase mainly driven by impact measures
• SE: slightly higher volumes and rev/t
Industrial Solutions
EBIT adjusted – continued operations (million €)
Group cont. ops.
Positive EBIT Adj. Contributions from All BAs
Developing the future.
Baader Bank Investment Conference September 25, 2013
8
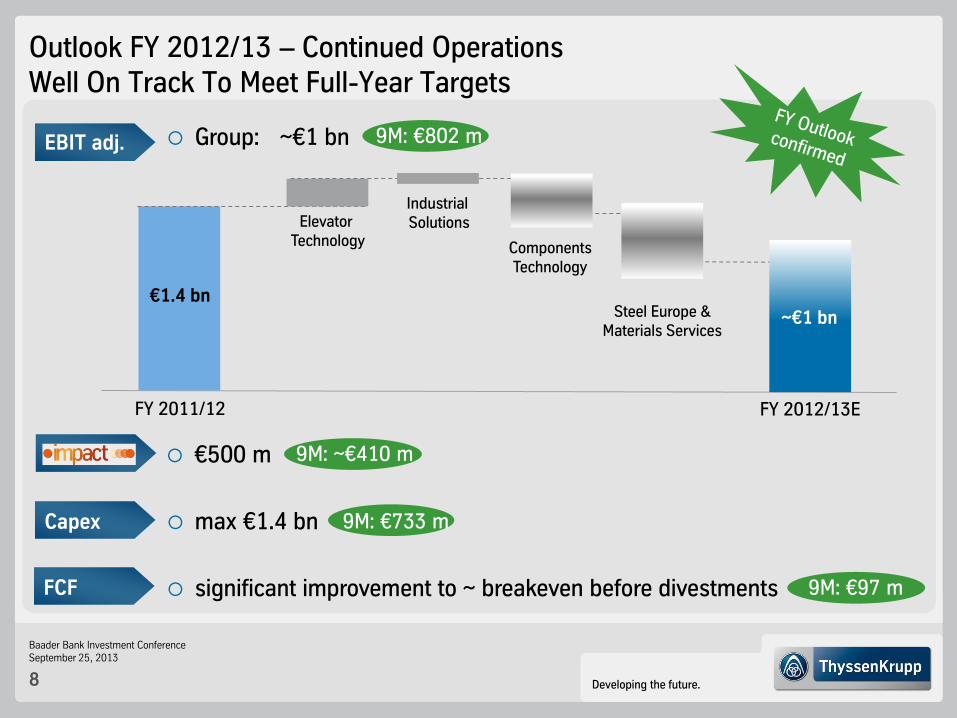
Outlook FY 2012/13 – Continued Operations Well On Track To Meet Full-Year Targets
FY 2011/12
€1.4 bn
Group: ~€1 bn EBIT adj.
Industrial Solutions Elevator
Technology Components Technology
Steel Europe & Materials Services
~€1 bn
FY 2012/13E
Capex
FCF
max €1.4 bn
significant improvement to ~ breakeven before divestments
9M: €802 m
9M: €733 m
9M: €97 m
€500 m 9M: ~€410 m
Developing the future.
Baader Bank Investment Conference September 25, 2013
9
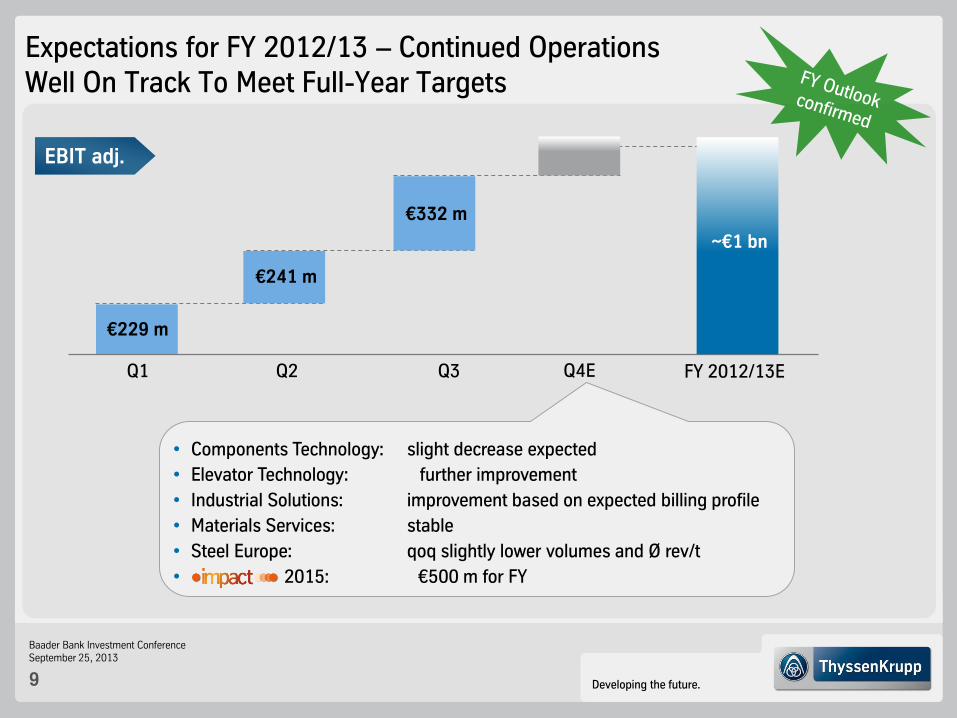
Expectations for FY 2012/13 – Continued Operations Well On Track To Meet Full-Year Targets
Q1
€229 m
EBIT adj.
FY 2012/13E
€241 m
Q2 Q3
• Components Technology: slight decrease expected
• Elevator Technology: further improvement
• Industrial Solutions: improvement based on expected billing profile
• Materials Services: stable
• Steel Europe: qoq slightly lower volumes and Ø rev/t
• 2015: €500 m for FY
€332 m
~€1 bn
Q4E
Developing the future.
Baader Bank Investment Conference September 25, 2013
10
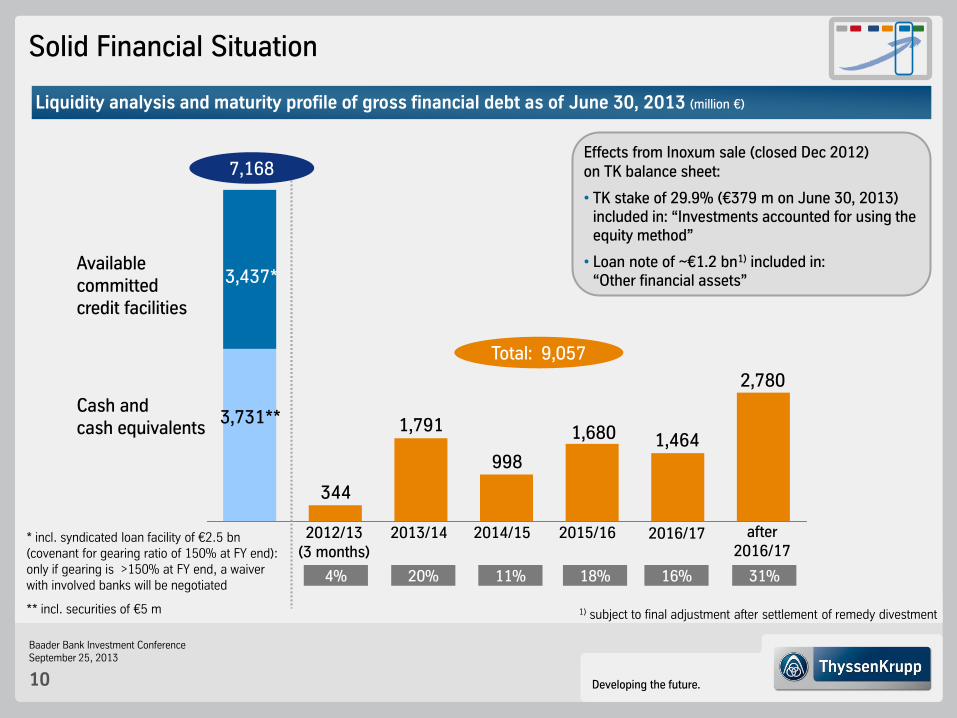
** incl. securities of €5 m
Solid Financial Situation
Liquidity analysis and maturity profile of gross financial debt as of June 30, 2013 (million €)
1) subject to final adjustment after settlement of remedy divestment
2013/14 2014/15 2015/16 after 2016/17
Available committed credit facilities
Cash and cash equivalents
344
1,791
998 1,464
2,780
3,437*
1,680
7,168
Total: 9,057
4% 20% 11% 18% 16% 31%
3,731**
2016/17 2012/13 (3 months)
Effects from Inoxum sale (closed Dec 2012) on TK balance sheet:
• TK stake of 29.9% (€379 m on June 30, 2013) included in: “Investments accounted for using the equity method”
• Loan note of ~€1.2 bn1) included in: “Other financial assets”
* incl. syndicated loan facility of €2.5 bn (covenant for gearing ratio of 150% at FY end): only if gearing is >150% at FY end, a waiver with involved banks will be negotiated
Developing the future.
Baader Bank Investment Conference September 25, 2013
11
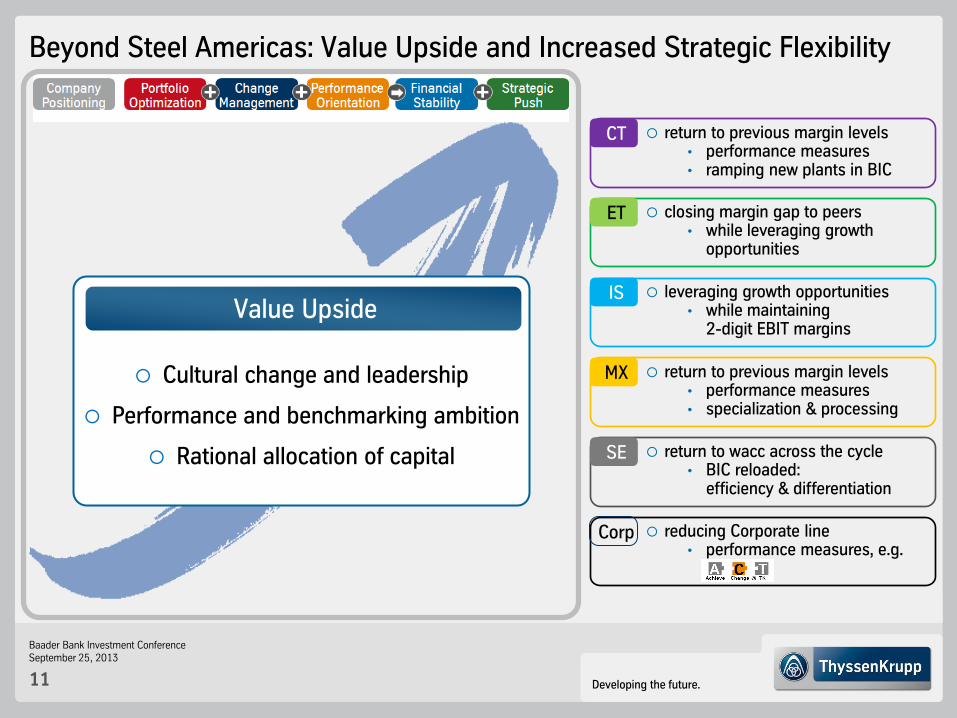
Beyond Steel Americas: Value Upside and Increased Strategic Flexibility
return to previous margin levels • performance measures • ramping new plants in BIC
CT
return to previous margin levels • performance measures • specialization & processing
MX
return to wacc across the cycle • BIC reloaded: efficiency & differentiation
SE
reducing Corporate line • performance measures, e.g.
Corp
Cultural change and leadership
Performance and benchmarking ambition
Rational allocation of capital
Value Upside leveraging growth opportunities
• while maintaining 2-digit EBIT margins
IS
closing margin gap to peers • while leveraging growth
opportunities
ET
Developing the future.
Baader Bank Investment Conference September 25, 2013
12
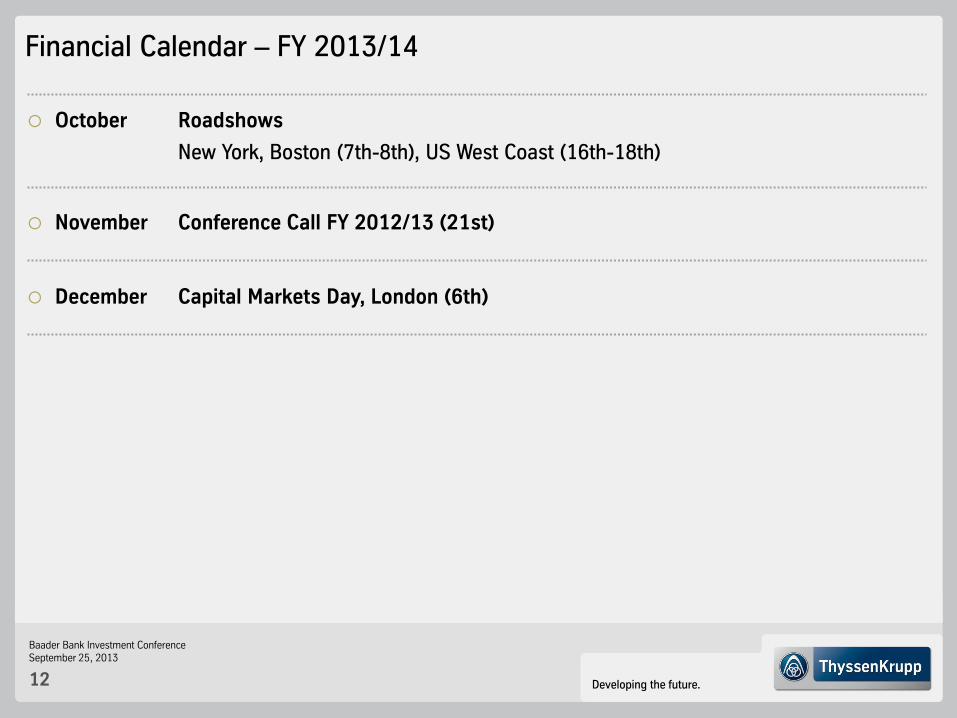
Financial Calendar – FY 2013/14
October Roadshows
New York, Boston (7th-8th), US West Coast (16th-18th)
November Conference Call FY 2012/13 (21st)
December Capital Markets Day, London (6th)
Developing the future.
Baader Bank Investment Conference September 25, 2013
13
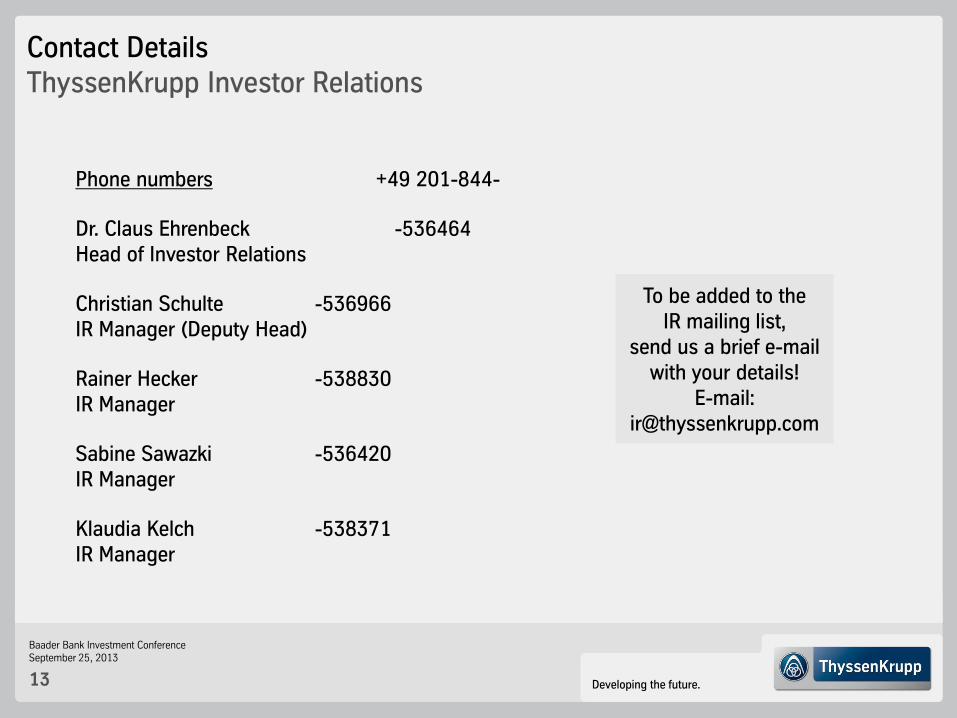
Contact Details ThyssenKrupp Investor Relations
Phone numbers +49 201-844-
Dr. Claus Ehrenbeck -536464 Head of Investor Relations
Christian Schulte -536966 IR Manager (Deputy Head)
Rainer Hecker -538830 IR Manager
Sabine Sawazki -536420 IR Manager
Klaudia Kelch -538371 IR Manager
To be added to the
IR mailing list, send us a brief e-mail
with your details! E-mail:
Developing the future.
Baader Bank Investment Conference September 25, 2013
14
Agenda
Presentation slides 2-11
Facts & Figures slides 15-62
Developing the future.
Baader Bank Investment Conference September 25, 2013
15
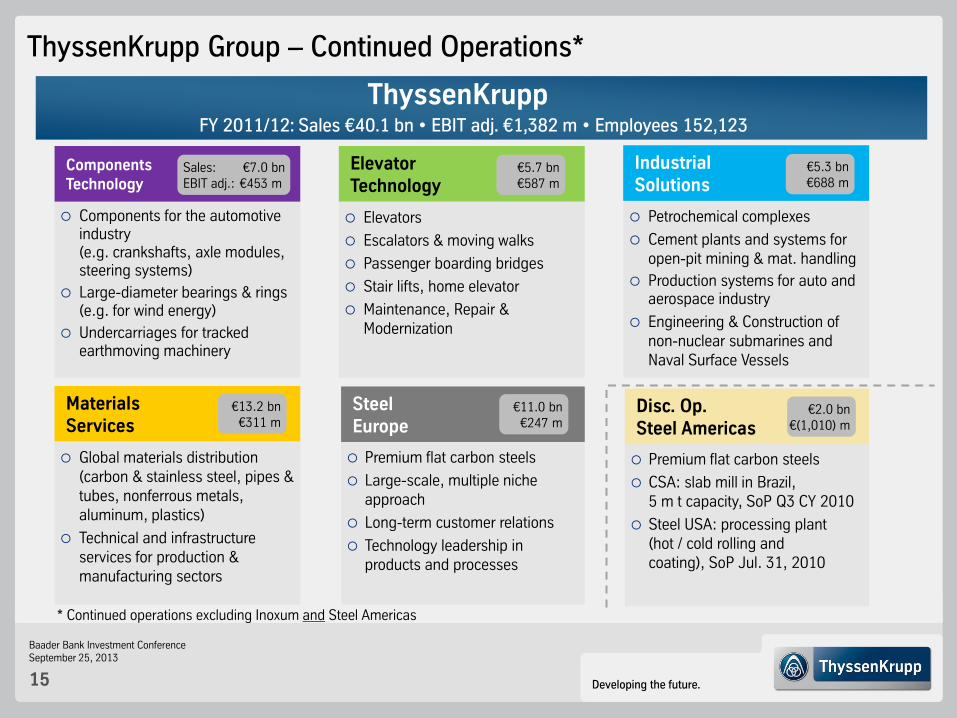
Premium flat carbon steels
Large-scale, multiple niche approach
Long-term customer relations
Technology leadership in products and processes
Premium flat carbon steels
CSA: slab mill in Brazil, 5 m t capacity, SoP Q3 CY 2010
Steel USA: processing plant (hot / cold rolling and coating), SoP Jul. 31, 2010
Global materials distribution (carbon & stainless steel, pipes & tubes, nonferrous metals, aluminum, plastics)
Technical and infrastructure services for production & manufacturing sectors
Elevators
Escalators & moving walks
Passenger boarding bridges
Stair lifts, home elevator
Maintenance, Repair & Modernization
Components for the automotive industry (e.g. crankshafts, axle modules, steering systems)
Large-diameter bearings & rings (e.g. for wind energy)
Undercarriages for tracked earthmoving machinery
Steel Europe
Disc. Op. Steel Americas
Materials Services
Elevator Technology
Components Technology
FY 2011/12: Sales €40.1 bn • EBIT adj. €1,382 m • Employees 152,123
ThyssenKrupp
ThyssenKrupp Group – Continued Operations*
€11.0 bn €247 m
€2.0 bn €(1,010) m
€13.2 bn €311 m
€5.7 bn €587 m
Petrochemical complexes
Cement plants and systems for open-pit mining & mat. handling
Production systems for auto and aerospace industry
Engineering & Construction of non-nuclear submarines and Naval Surface Vessels
* Continued operations excluding Inoxum and Steel Americas
Sales: €7.0 bn EBIT adj.: €453 m
Industrial Solutions
€5.3 bn €688 m
Developing the future.
Baader Bank Investment Conference September 25, 2013
16
Steel Europe
Elevator Techn.
Plant Techn.
Comp. Techn.
Marine Systems
Materials Services
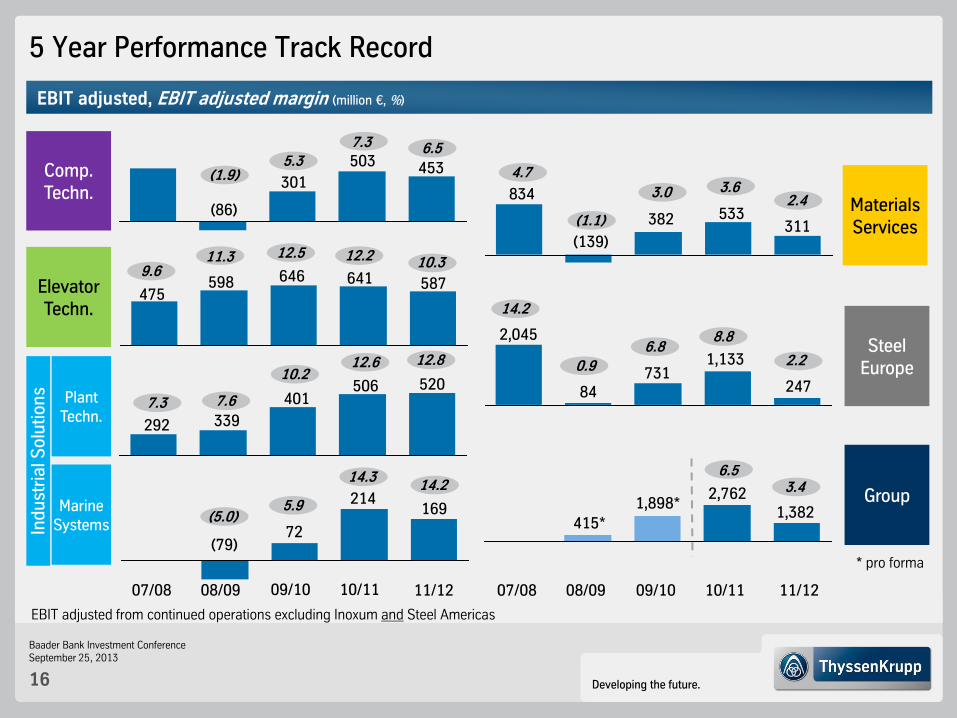
5 Year Performance Track Record
EBIT adjusted, EBIT adjusted margin (million €, %)
07/08 08/09
Group 2,762
09/10 10/11
1,382
2,045
731 84
1,133
834
311 382
(139)
533
475 587 646 598 641
292
520 401
339
506
301
(86)
503
72 (79)
214
6.5 3.4
14.2
0.9 6.8
8.8
2.4
4.7
(1.1)
3.0 3.6
10.3 9.6
11.3 12.5 12.2
12.8
7.3 7.6
10.2 12.6
(1.9) 5.3
7.3
(5.0) 5.9
14.3
247
2.2
11/12 07/08 08/09 09/10 10/11 11/12
453
6.5
169
14.2 1,898*
* pro forma
415*
EBIT adjusted from continued operations excluding Inoxum and Steel Americas
Ind
ust
rial S
olu
tio
ns
Developing the future.
Baader Bank Investment Conference September 25, 2013
17
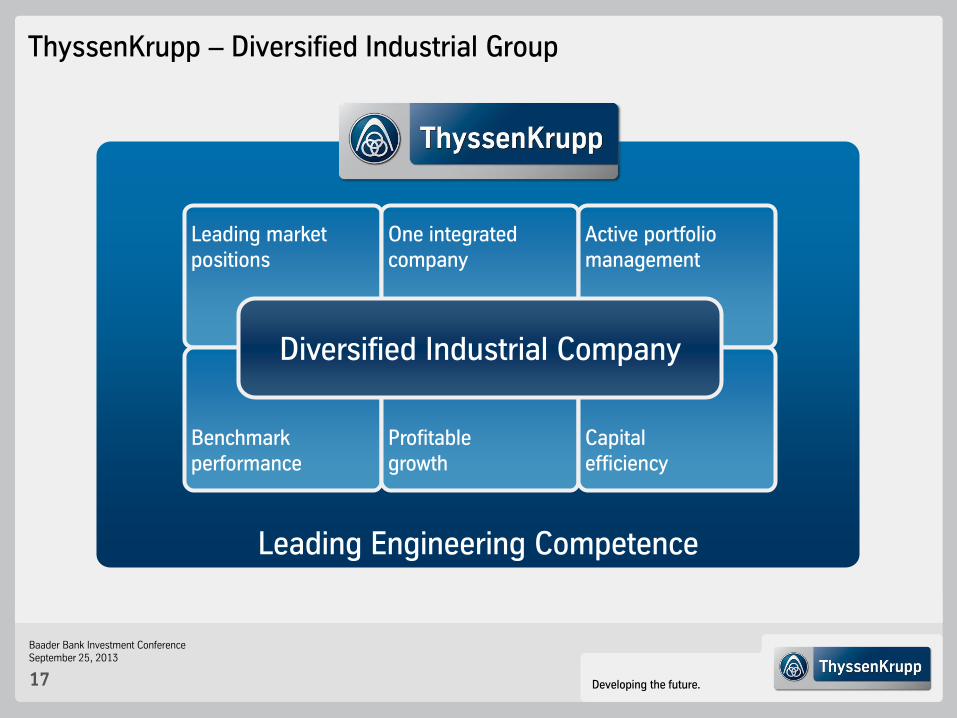
Leading Engineering Competence
Leading market positions
One integrated company
Active portfolio management
Benchmark performance
Profitable growth
Capital efficiency
Diversified Industrial Company
ThyssenKrupp – Diversified Industrial Group
Developing the future.
Baader Bank Investment Conference September 25, 2013
18
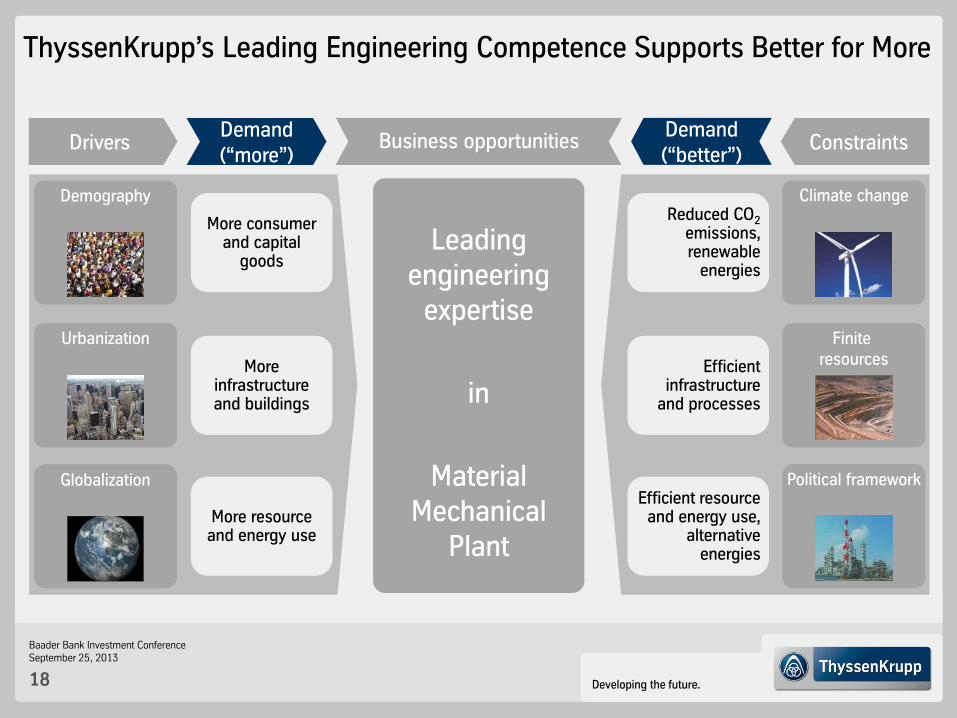
ThyssenKrupp’s Leading Engineering Competence Supports Better for More
Climate change
Urbanization
Globalization
Leading engineering
expertise
in
Material Mechanical
Plant
More consumer and capital
goods
More resource and energy use
More infrastructure and buildings
Reduced CO2 emissions, renewable
energies
Efficient resource and energy use,
alternative energies
Efficient infrastructure
and processes
Demand (“more”)
Drivers
Demography
Finite resources
Political framework
Business opportunities Constraints Demand (“better”)
Developing the future.
Baader Bank Investment Conference September 25, 2013
19
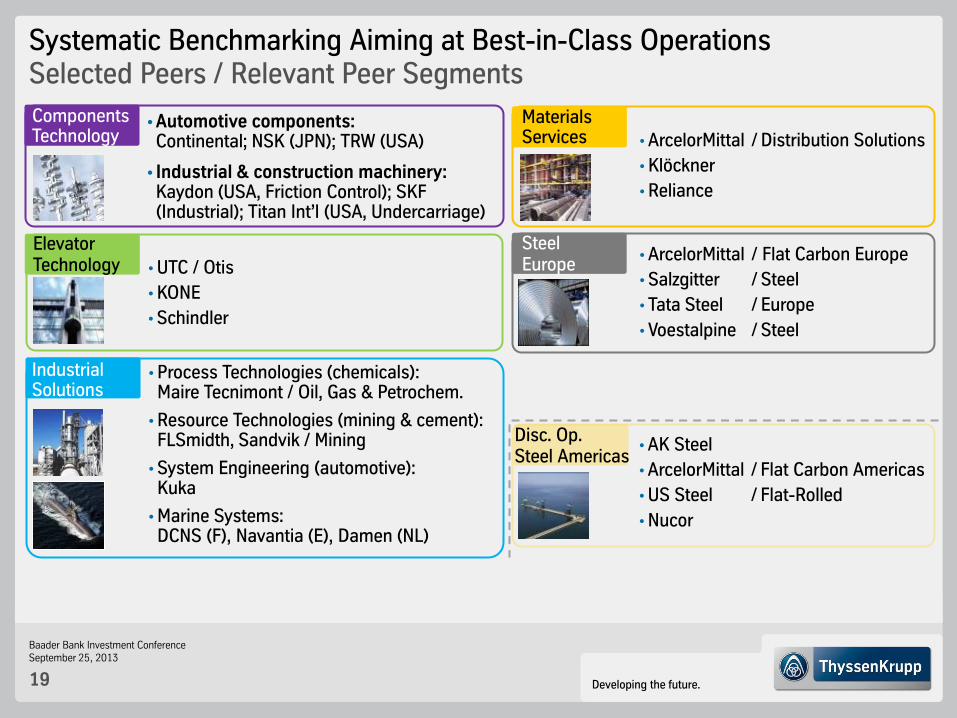
Systematic Benchmarking Aiming at Best-in-Class Operations Selected Peers / Relevant Peer Segments
• Process Technologies (chemicals): Maire Tecnimont / Oil, Gas & Petrochem.
• Resource Technologies (mining & cement): FLSmidth, Sandvik / Mining
• System Engineering (automotive): Kuka
• Marine Systems: DCNS (F), Navantia (E), Damen (NL)
• Automotive components: Continental; NSK (JPN); TRW (USA)
• Industrial & construction machinery: Kaydon (USA, Friction Control); SKF (Industrial); Titan Int’l (USA, Undercarriage)
• UTC / Otis
• KONE
• Schindler
Elevator Technology
Industrial Solutions
Components Technology
Steel Europe
• ArcelorMittal / Flat Carbon Europe
• Salzgitter / Steel
• Tata Steel / Europe
• Voestalpine / Steel
• AK Steel
• ArcelorMittal / Flat Carbon Americas
• US Steel / Flat-Rolled
• Nucor
Disc. Op. Steel Americas
• ArcelorMittal / Distribution Solutions
• Klöckner
• Reliance
Materials Services
Developing the future.
Baader Bank Investment Conference September 25, 2013
20
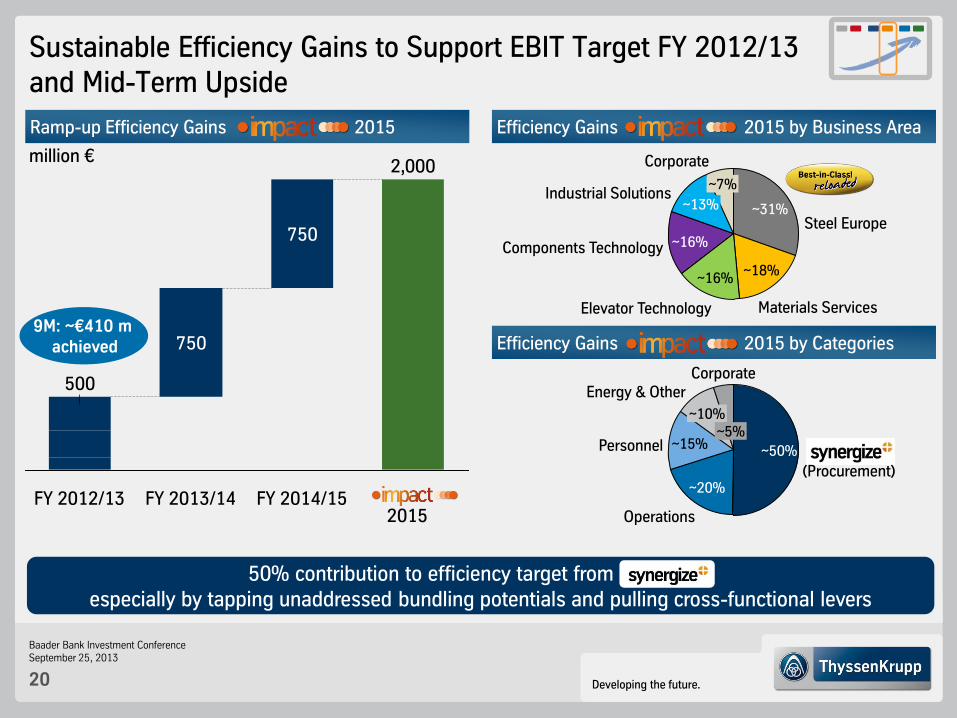
2,000
FY 2014/15
750
FY 2013/14
750
FY 2012/13
500
Ramp-up Efficiency Gains 2015
Sustainable Efficiency Gains to Support EBIT Target FY 2012/13 and Mid-Term Upside
50% contribution to efficiency target from synergize+ especially by tapping unaddressed bundling potentials and pulling cross-functional levers
Efficiency Gains 2015 by Business Area
Efficiency Gains 2015 by Categories
2015
~10%
Corporate
~5%
Energy & Other
Personnel ~15%
Operations
~20%
~50%
Corporate
~7% Industrial Solutions
~13%
Components Technology ~16% Steel Europe
Elevator Technology
~16%
Materials Services
~18%
~31%
million €
(Procurement)
9M: ~€410 m achieved
Developing the future.
Baader Bank Investment Conference September 25, 2013
21
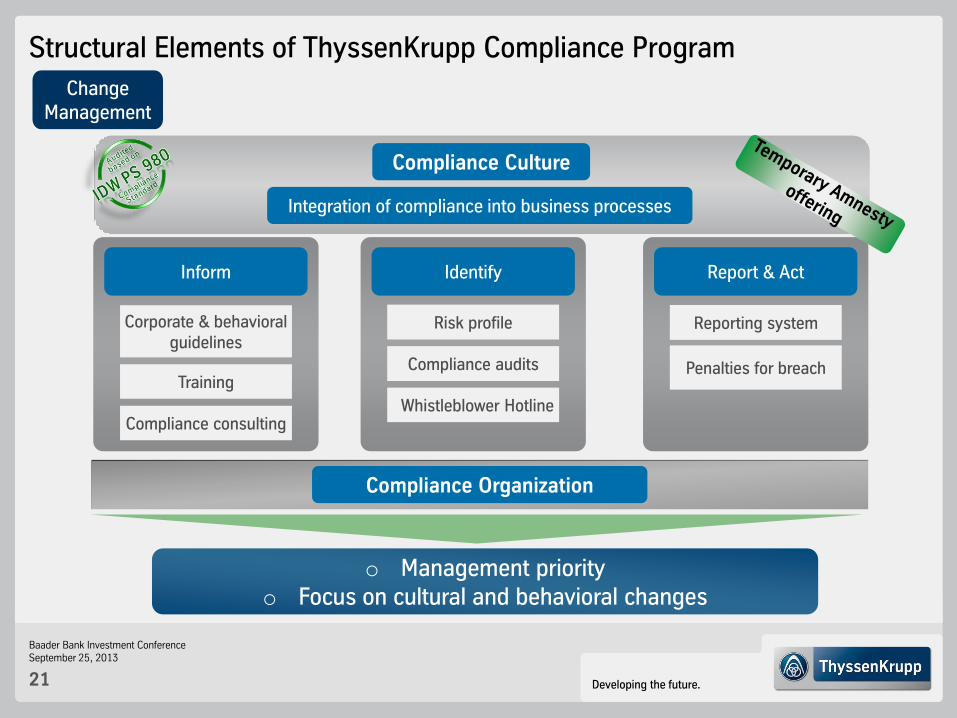
Change Management
Structural Elements of ThyssenKrupp Compliance Program
Integration of compliance into business processes
Training
Corporate & behavioral guidelines
Compliance consulting
Inform
Whistleblower Hotline
Compliance audits
Risk profile
Identify
Reporting system
Penalties for breach
Report & Act
Compliance Organization
o Management priority o Focus on cultural and behavioral changes
Compliance Culture
Developing the future.
Baader Bank Investment Conference September 25, 2013
22
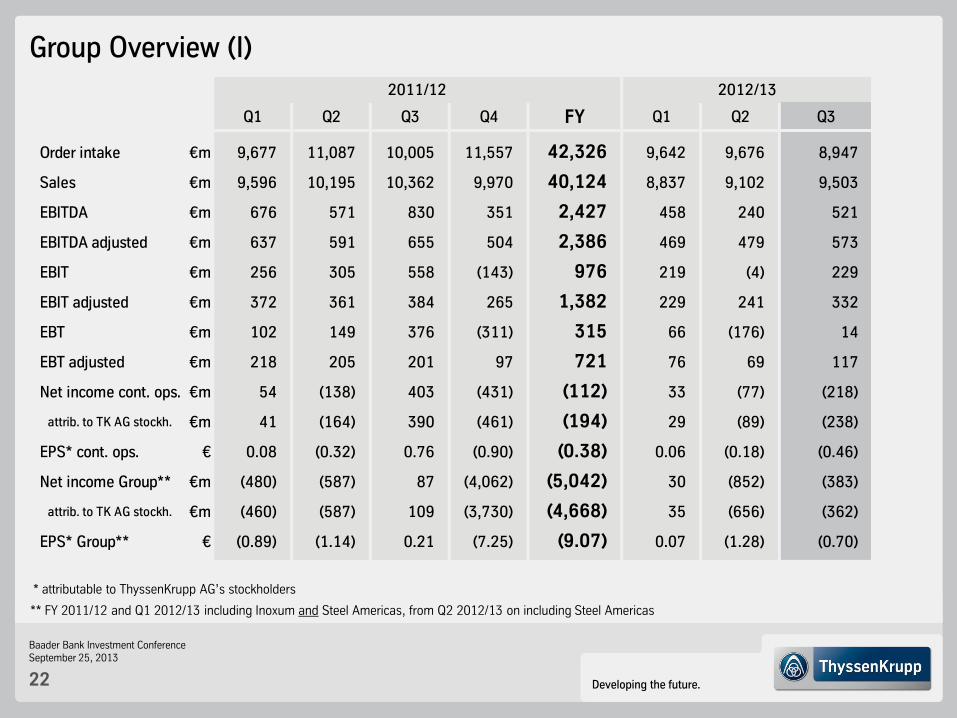
Group Overview (I)
* attributable to ThyssenKrupp AG’s stockholders
** FY 2011/12 and Q1 2012/13 including Inoxum and Steel Americas, from Q2 2012/13 on including Steel Americas
Q1 Q2 Q3 Q4 FY Q1 Q2 Q3
Order intake €m 9,677 11,087 10,005 11,557 42,326 9,642 9,676 8,947
Sales €m 9,596 10,195 10,362 9,970 40,124 8,837 9,102 9,503
EBITDA €m 676 571 830 351 2,427 458 240 521
EBITDA adjusted €m 637 591 655 504 2,386 469 479 573
EBIT €m 256 305 558 (143) 976 219 (4) 229
EBIT adjusted €m 372 361 384 265 1,382 229 241 332
EBT €m 102 149 376 (311) 315 66 (176) 14
EBT adjusted €m 218 205 201 97 721 76 69 117
Net income cont. ops. €m 54 (138) 403 (431) (112) 33 (77) (218)
attrib. to TK AG stockh. €m 41 (164) 390 (461) (194) 29 (89) (238)
EPS* cont. ops. € 0.08 (0.32) 0.76 (0.90) (0.38) 0.06 (0.18) (0.46)
Net income Group** €m (480) (587) 87 (4,062) (5,042) 30 (852) (383)
attrib. to TK AG stockh. €m (460) (587) 109 (3,730) (4,668) 35 (656) (362)
EPS* Group** € (0.89) (1.14) 0.21 (7.25) (9.07) 0.07 (1.28) (0.70)
2011/12 2012/13
Developing the future.
Baader Bank Investment Conference September 25, 2013
23
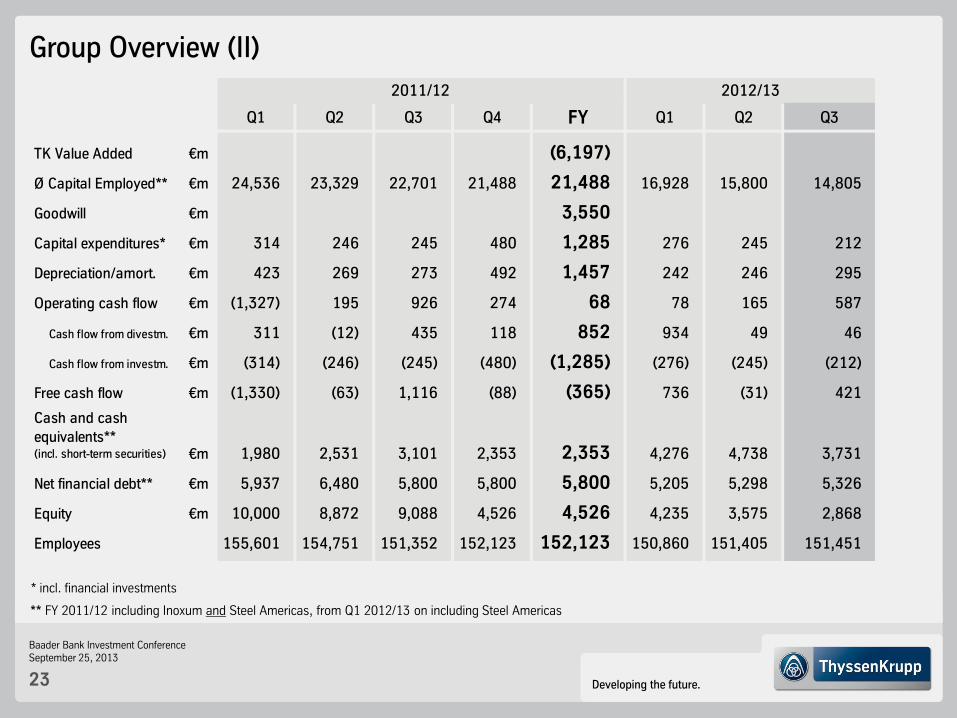
Group Overview (II)
* incl. financial investments
** FY 2011/12 including Inoxum and Steel Americas, from Q1 2012/13 on including Steel Americas
Q1 Q2 Q3 Q4 FY Q1 Q2 Q3
TK Value Added €m (6,197)
Ø Capital Employed** €m 24,536 23,329 22,701 21,488 21,488 16,928 15,800 14,805
Goodwill €m 3,550
Capital expenditures* €m 314 246 245 480 1,285 276 245 212
Depreciation/amort. €m 423 269 273 492 1,457 242 246 295
Operating cash flow €m (1,327) 195 926 274 68 78 165 587
Cash flow from divestm. €m 311 (12) 435 118 852 934 49 46
Cash flow from investm. €m (314) (246) (245) (480) (1,285) (276) (245) (212)
Free cash flow €m (1,330) (63) 1,116 (88) (365) 736 (31) 421
Cash and cash
equivalents** (incl. short-term securities) €m 1,980 2,531 3,101 2,353 2,353 4,276 4,738 3,731
Net financial debt** €m 5,937 6,480 5,800 5,800 5,800 5,205 5,298 5,326
Equity €m 10,000 8,872 9,088 4,526 4,526 4,235 3,575 2,868
Employees 155,601 154,751 151,352 152,123 152,123 150,860 151,405 151,451
2011/12 2012/13
Developing the future.
Baader Bank Investment Conference September 25, 2013
24
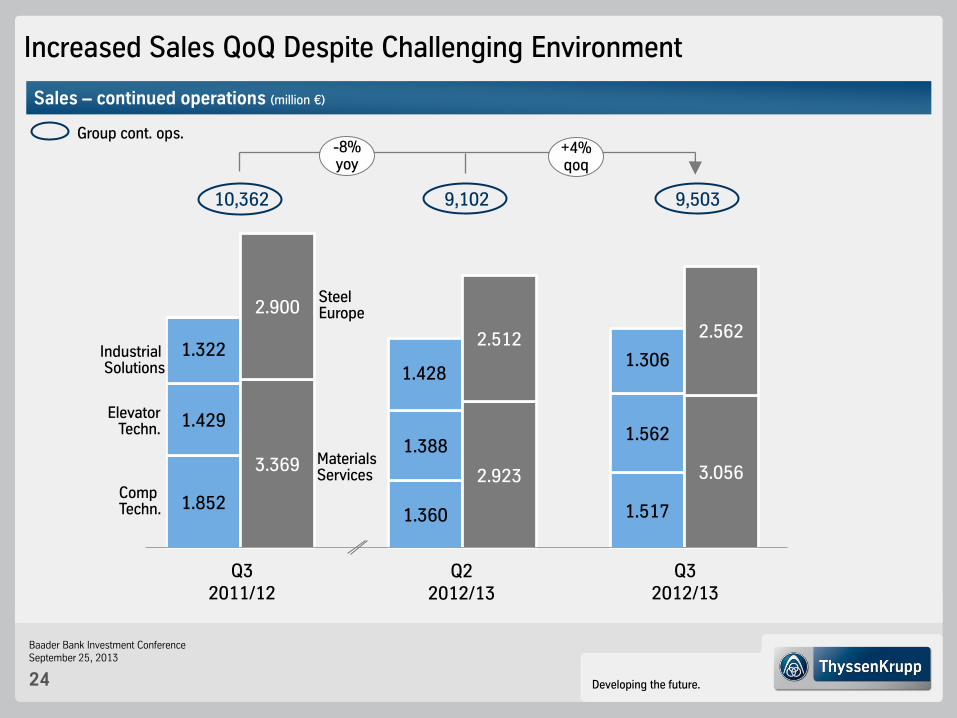
1.852 1.360 1.517
1.429
1.388 1.562
1.322
1.428 1.306
3.369 2.923 3.056
2.900
2.512 2.562
Sales – continued operations (million €)
Q3 2012/13
Q3 2011/12
Q2 2012/13
Elevator Techn.
Comp Techn.
Materials Services
Steel Europe
9,102 9,503
-8% yoy
10,362
+4% qoq
Industrial Solutions
Increased Sales QoQ Despite Challenging Environment
Group cont. ops.
Developing the future.
Baader Bank Investment Conference September 25, 2013
25
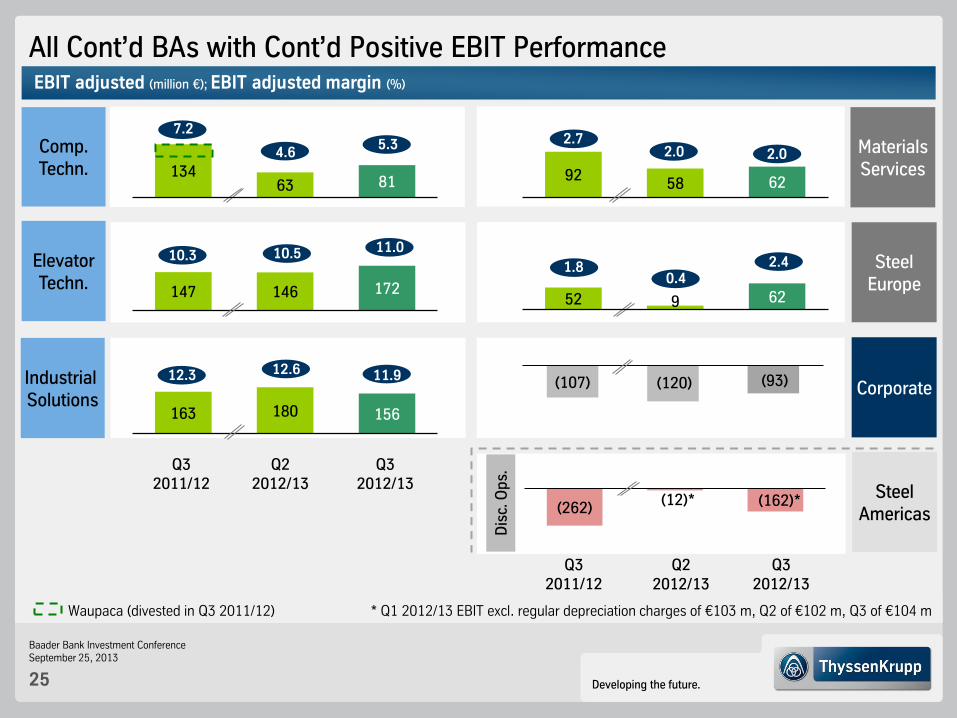
All Cont’d BAs with Cont’d Positive EBIT Performance
Q3 2011/12
Q2 2012/13
Q3 2012/13
Q3 2011/12
Q2 2012/13
Q3 2012/13
Steel Europe
Materials Services
Elevator Techn.
Comp. Techn.
EBIT adjusted (million €); EBIT adjusted margin (%)
147 146 172
10.5 10.3 11.0
163 180 156
12.6 12.3 11.9
92 58 62
2.0 2.7
2.0
Corporate (107) (120) (93)
134 63 81
4.6
7.2 5.3
(262) (12)*
Steel
Americas D
isc.
Op
s.
52 9 62
* Q1 2012/13 EBIT excl. regular depreciation charges of €103 m, Q2 of €102 m, Q3 of €104 m
1.8 0.4
2.4
Industrial Solutions
(162)*
Waupaca (divested in Q3 2011/12)
Developing the future.
Baader Bank Investment Conference September 25, 2013
26
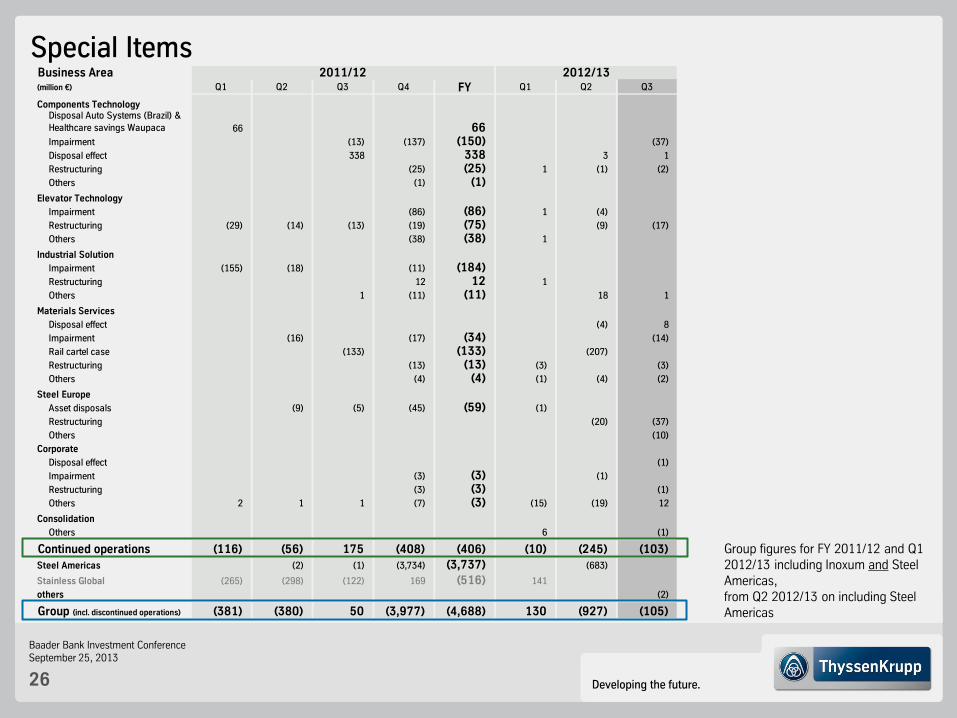
Business Area(million €) Q1 Q2 Q3 Q4 FY Q1 Q2 Q3
Components TechnologyDisposal Auto Systems (Brazil) &
Healthcare savings Waupaca 66 66Impairment (13) (137) (150) (37)
Disposal effect 338 338 3 1
Restructuring (25) (25) 1 (1) (2)
Others (1) (1)
Elevator Technology
Impairment (86) (86) 1 (4)
Restructuring (29) (14) (13) (19) (75) (9) (17)
Others (38) (38) 1
Industrial Solution
Impairment (155) (18) (11) (184)Restructuring 12 12 1
Others 1 (11) (11) 18 1
Materials Services
Disposal effect (4) 8
Impairment (16) (17) (34) (14)
Rail cartel case (133) (133) (207)
Restructuring (13) (13) (3) (3)
Others (4) (4) (1) (4) (2)
Steel Europe
Asset disposals (9) (5) (45) (59) (1)
Restructuring (20) (37)
Others (10)
Corporate
Disposal effect (1)
Impairment (3) (3) (1)
Restructuring (3) (3) (1)
Others 2 1 1 (7) (3) (15) (19) 12
Consolidation
Others 6 (1)
Continued operations (116) (56) 175 (408) (406) (10) (245) (103)
Steel Americas (2) (1) (3,734) (3,737) (683)
Stainless Global (265) (298) (122) 169 (516) 141
others (2)
Group (incl. discontinued operations) (381) (380) 50 (3,977) (4,688) 130 (927) (105)
2011/12 2012/13
Special Items
Group figures for FY 2011/12 and Q1 2012/13 including Inoxum and Steel Americas, from Q2 2012/13 on including Steel Americas
Developing the future.
Baader Bank Investment Conference September 25, 2013
27
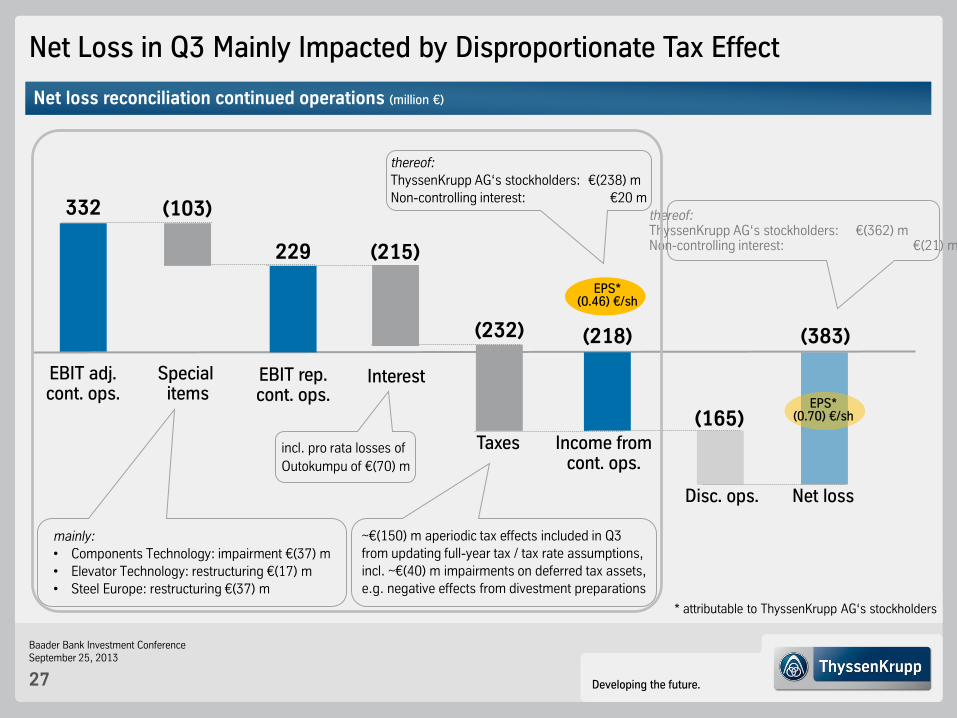
Net Loss in Q3 Mainly Impacted by Disproportionate Tax Effect
Net loss reconciliation continued operations (million €)
EBIT adj. cont. ops.
332
229
Income from cont. ops.
(218)
(215)
Interest Special items
(103)
(232)
Taxes
EBIT rep. cont. ops.
Disc. ops.
(165)
(383)
Net loss
mainly:
• Components Technology: impairment €(37) m
• Elevator Technology: restructuring €(17) m • Steel Europe: restructuring €(37) m
thereof:
ThyssenKrupp AG‘s stockholders: €(238) m
Non-controlling interest: €20 m thereof: ThyssenKrupp AG‘s stockholders: €(362) m Non-controlling interest: €(21) m
EPS* (0.46) €/sh
* attributable to ThyssenKrupp AG‘s stockholders
EPS* (0.70) €/sh
incl. pro rata losses of
Outokumpu of €(70) m
~€(150) m aperiodic tax effects included in Q3
from updating full-year tax / tax rate assumptions, incl. ~€(40) m impairments on deferred tax assets,
e.g. negative effects from divestment preparations
Developing the future.
Baader Bank Investment Conference September 25, 2013
28
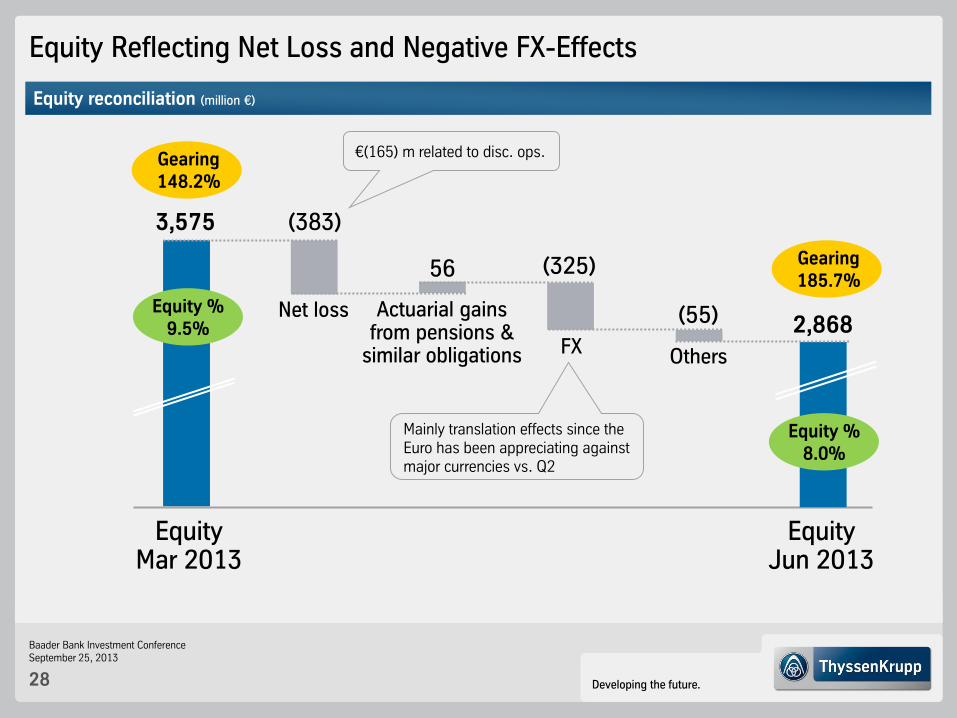
Equity Reflecting Net Loss and Negative FX-Effects
Equity Mar 2013
3,575
Actuarial gains from pensions &
similar obligations
56 (325)
FX
Equity % 9.5%
Gearing 148.2%
Equity reconciliation (million €)
€(165) m related to disc. ops.
Net loss
(383)
2,868
Equity Jun 2013
Equity % 8.0%
Gearing 185.7%
Mainly translation effects since the Euro has been appreciating against major currencies vs. Q2
Others
(55)
Developing the future.
Baader Bank Investment Conference September 25, 2013
29
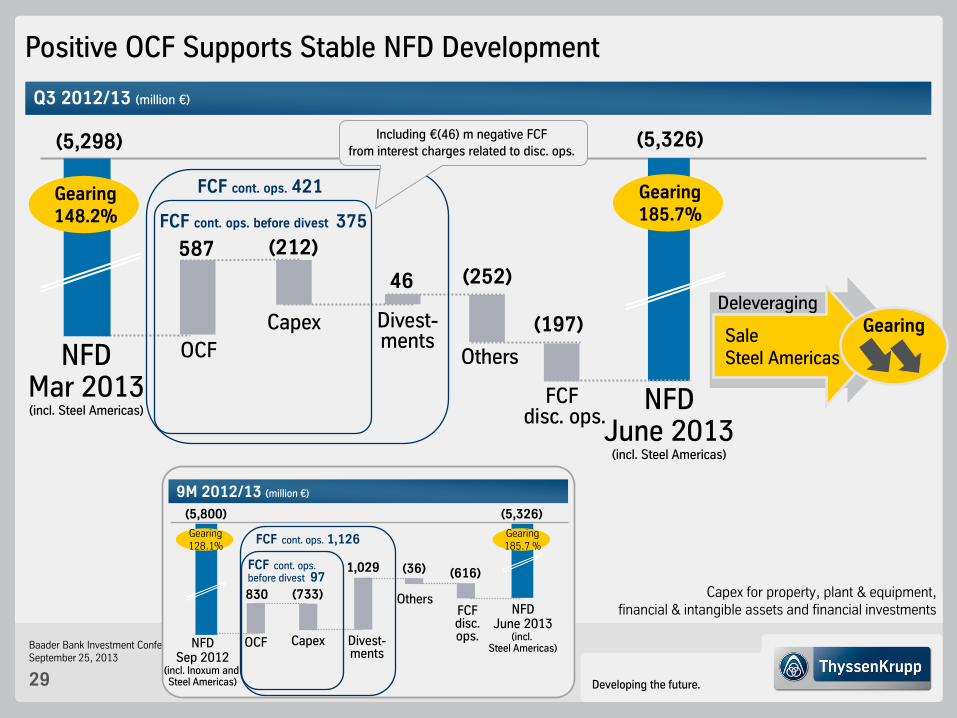
Divest- ments
NFD Mar 2013 (incl. Steel Americas) NFD
June 2013 (incl. Steel Americas)
(5,326) (5,298)
46
Capex
Q3 2012/13 (million €)
Capex for property, plant & equipment, financial & intangible assets and financial investments
Positive OCF Supports Stable NFD Development
OCF
587
(252)
FCF disc. ops.
(197)
Others
(212)
Gearing 148.2%
Gearing 185.7% FCF cont. ops. before divest 375
FCF cont. ops. 421
Including €(46) m negative FCF
from interest charges related to disc. ops.
9M 2012/13 (million €)
(5,800) (5,326)
(733)
(36)
830
1,029
NFD Sep 2012
(incl. Inoxum and Steel Americas)
OCF Capex Divest-ments
NFD June 2013
(incl. Steel Americas)
Others FCF disc. ops.
(616) FCF cont. ops. before divest 97
FCF cont. ops. 1,126 Gearing 128.1%
Gearing 185.7 %
Sale Steel Americas
Gearing Deleveraging
Developing the future.
Baader Bank Investment Conference September 25, 2013
30
(3)
(2)
(1)
0
1
2
3
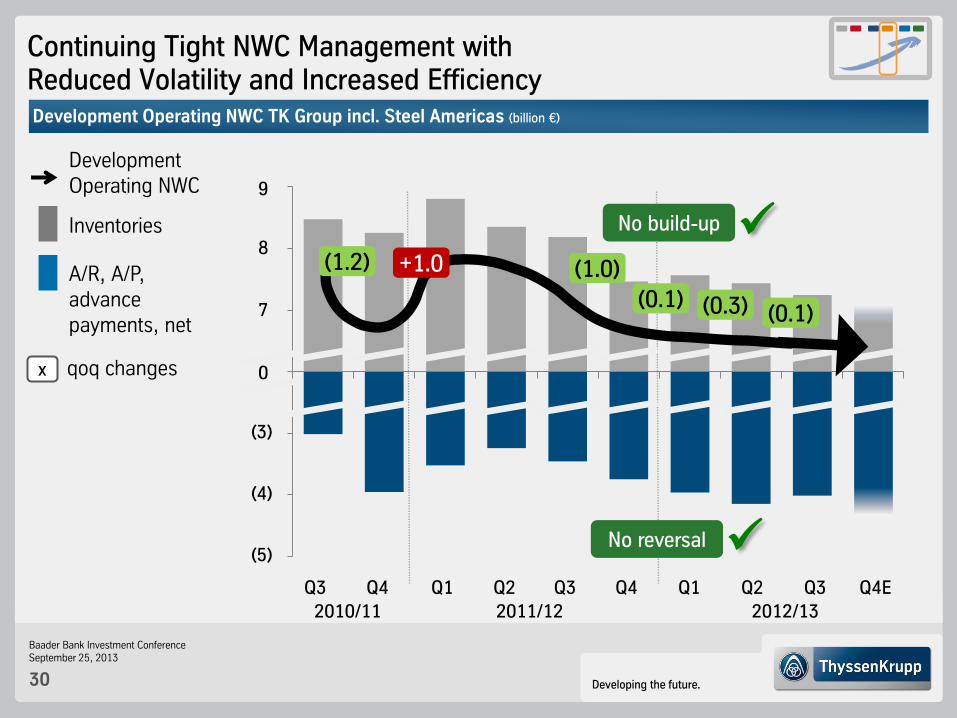
Continuing Tight NWC Management with Reduced Volatility and Increased Efficiency
Inventories
A/R, A/P, advance payments, net
Development Operating NWC
x qoq changes
Q3 Q4 Q1 Q3 Q4 Q2
Development Operating NWC TK Group incl. Steel Americas (billion €)
Q2 Q3
2010/11 2012/13 2011/12
Q1
(3)
(4)
(5)
7
8
9
0
(0.1)
No reversal
(1.0)
(0.3)
Q4E
(0.1)
No build-up
(1.2) +1.0
Developing the future.
Baader Bank Investment Conference September 25, 2013
31
0
40
80
120
0
2
4
6
8
10
12
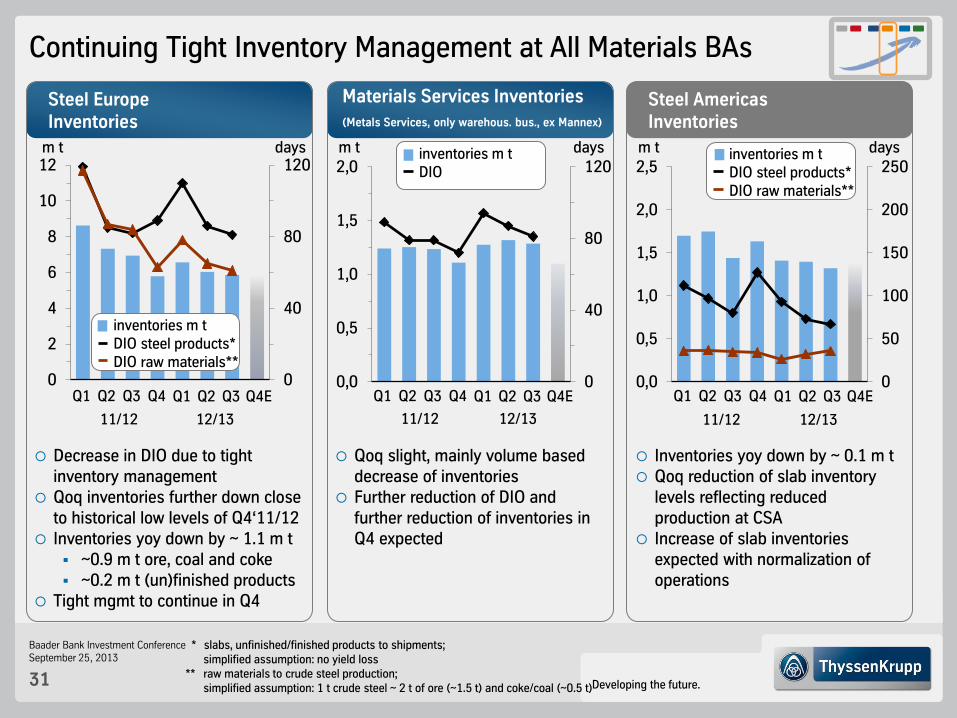
Continuing Tight Inventory Management at All Materials BAs
Steel Europe Inventories
11/12 12/13
Steel Americas Inventories
0
50
100
150
200
250
0,0
0,5
1,0
1,5
2,0
2,5
* slabs, unfinished/finished products to shipments; simplified assumption: no yield loss ** raw materials to crude steel production; simplified assumption: 1 t crude steel ~ 2 t of ore (~1.5 t) and coke/coal (~0.5 t)
11/12 12/13
Materials Services Inventories
(Metals Services, only warehous. bus., ex Mannex)
0
40
80
120
0,0
0,5
1,0
1,5
2,0
11/12 12/13
inventories m t DIO
m t days m t days days m t
Q2 Q1 Q3 Q4 Q2 Q1 Q3 Q4E Q2 Q1 Q3 Q4 Q2 Q1 Q3 Q4E Q2 Q1 Q3 Q4 Q2 Q1 Q3 Q4E
Inventories yoy down by ~ 0.1 m t Qoq reduction of slab inventory
levels reflecting reduced production at CSA
Increase of slab inventories expected with normalization of operations
Decrease in DIO due to tight inventory management
Qoq inventories further down close to historical low levels of Q4‘11/12
Inventories yoy down by ~ 1.1 m t ~0.9 m t ore, coal and coke ~0.2 m t (un)finished products
Tight mgmt to continue in Q4
Qoq slight, mainly volume based decrease of inventories
Further reduction of DIO and further reduction of inventories in Q4 expected
inventories m t DIO steel products* DIO raw materials**
inventories m t DIO steel products* DIO raw materials**
Developing the future.
Baader Bank Investment Conference September 25, 2013
32
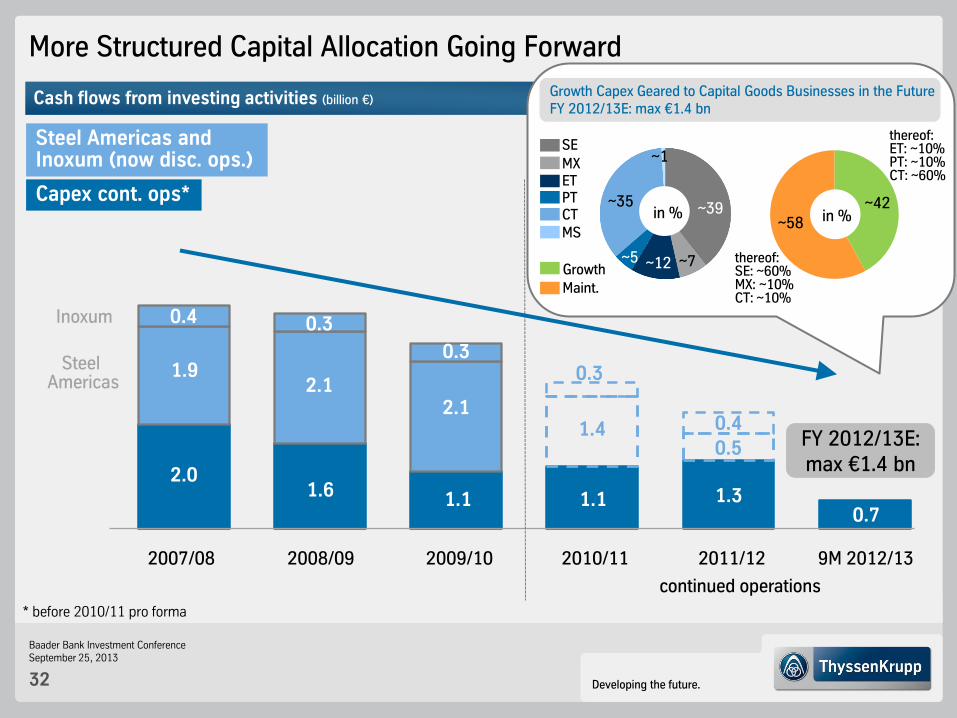
More Structured Capital Allocation Going Forward
2008/09 2007/08 2009/10
Capex cont. ops*
2010/11 2011/12
Steel Americas and Inoxum (now disc. ops.)
9M 2012/13
Cash flows from investing activities (billion €)
0.7
continued operations
1.3
0.5
1.1
~39
~7 ~12 ~5
~35
~1 SE
MX ET PT CT MS
Maint.
Growth
~42 ~58
Growth Capex Geared to Capital Goods Businesses in the Future FY 2012/13E: max €1.4 bn
thereof: SE: ~60% MX: ~10% CT: ~10%
thereof: ET: ~10% PT: ~10% CT: ~60%
1.4
1.9 2.1
2.1
2.0 1.6 1.1
* before 2010/11 pro forma
FY 2012/13E: max €1.4 bn
Steel Americas
Inoxum 0.4 0.3
0.3 0.3
0.4
in % in %
Developing the future.
Baader Bank Investment Conference September 25, 2013
33
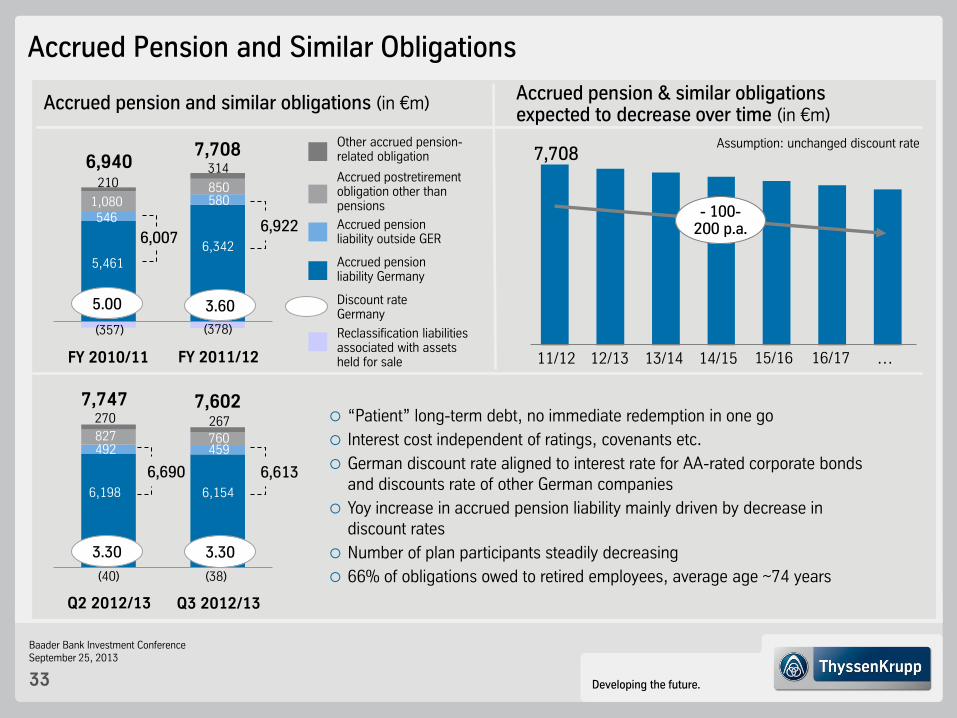
Accrued Pension and Similar Obligations
Accrued pension liability Germany
Accrued postretirement obligation other than pensions
Other accrued pension-related obligation
Accrued pension and similar obligations (in €m)
FY 2011/12
Accrued pension liability outside GER
Discount rate Germany
5.00
Reclassification liabilities associated with assets held for sale
6,940
6,007
FY 2010/11
6,922
3.60
7,708 314
850
(378)
6,342
580
210
1,080
(357)
5,461
546
7,708
11/12 12/13 13/14 14/15 …
- 100- 200 p.a.
Assumption: unchanged discount rate
“Patient” long-term debt, no immediate redemption in one go
Interest cost independent of ratings, covenants etc.
German discount rate aligned to interest rate for AA-rated corporate bonds and discounts rate of other German companies
Yoy increase in accrued pension liability mainly driven by decrease in discount rates
Number of plan participants steadily decreasing
66% of obligations owed to retired employees, average age ~74 years
15/16
Accrued pension & similar obligations expected to decrease over time (in €m)
16/17
Q3 2012/13
6,613
3.30
7,602 267
760
(38)
6,154
459
Q2 2012/13
6,690
3.30
7,747 270
827
(40)
6,198
492
Developing the future.
Baader Bank Investment Conference September 25, 2013
34
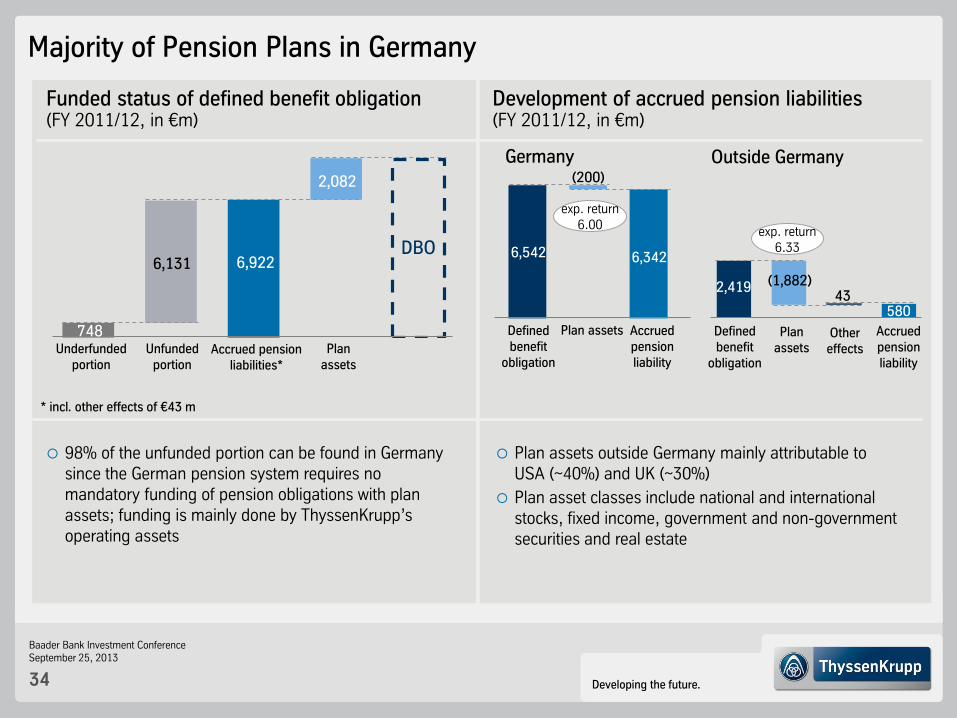
Majority of Pension Plans in Germany
Funded status of defined benefit obligation (FY 2011/12, in €m)
* incl. other effects of €43 m
98% of the unfunded portion can be found in Germany since the German pension system requires no mandatory funding of pension obligations with plan assets; funding is mainly done by ThyssenKrupp’s operating assets
Accrued pension liabilities*
Underfunded portion
748 Unfunded
portion
6,131 6,922
Plan assets
2,082
DBO
Development of accrued pension liabilities (FY 2011/12, in €m)
Germany
6,542
Defined benefit
obligation
Plan assets Accrued pension liability
(200)
6,342
Outside Germany
2,419
Defined benefit
obligation
Plan assets
Accrued pension liability
(1,882)
580
Plan assets outside Germany mainly attributable to USA (~40%) and UK (~30%)
Plan asset classes include national and international stocks, fixed income, government and non-government securities and real estate
exp. return 6.00
exp. return 6.33
Other effects
43
Developing the future.
Baader Bank Investment Conference September 25, 2013
35
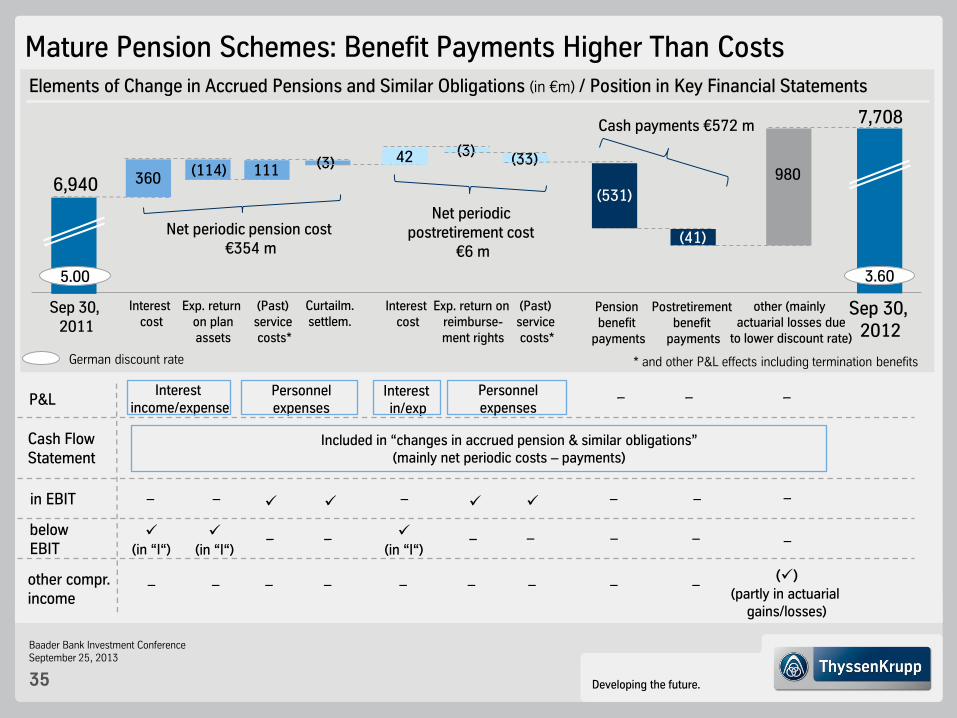
Elements of Change in Accrued Pensions and Similar Obligations (in €m) / Position in Key Financial Statements
6,940
Sep 30, 2011
7,708
Sep 30, 2012
Net periodic pension cost €354 m
Interest cost
360 (114)
Exp. return on plan assets
111
(Past) service costs*
* and other P&L effects including termination benefits
(3)
Curtailm. settlem.
(531)
Pension benefit
payments
980
other (mainly actuarial losses due
to lower discount rate)
P&L
Cash Flow Statement
in EBIT
Interest income/expense
Personnel expenses
– – –
Included in “changes in accrued pension & similar obligations” (mainly net periodic costs – payments)
below EBIT
(in “I“)
(3)
(41)
Postretirement benefit
payments
other compr. income
– – – – –
(in “I“)
– – – –
42
Interest cost
(33)
(Past) service costs*
Net periodic postretirement cost
€6 m
Exp. return on reimburse- ment rights
Interest in/exp
Personnel expenses
(in “I“)
–
– – – – – – – – –
–
–
() (partly in actuarial
gains/losses)
Mature Pension Schemes: Benefit Payments Higher Than Costs
5.00
German discount rate
3.60
–
Cash payments €572 m
Developing the future.
Baader Bank Investment Conference September 25, 2013
36
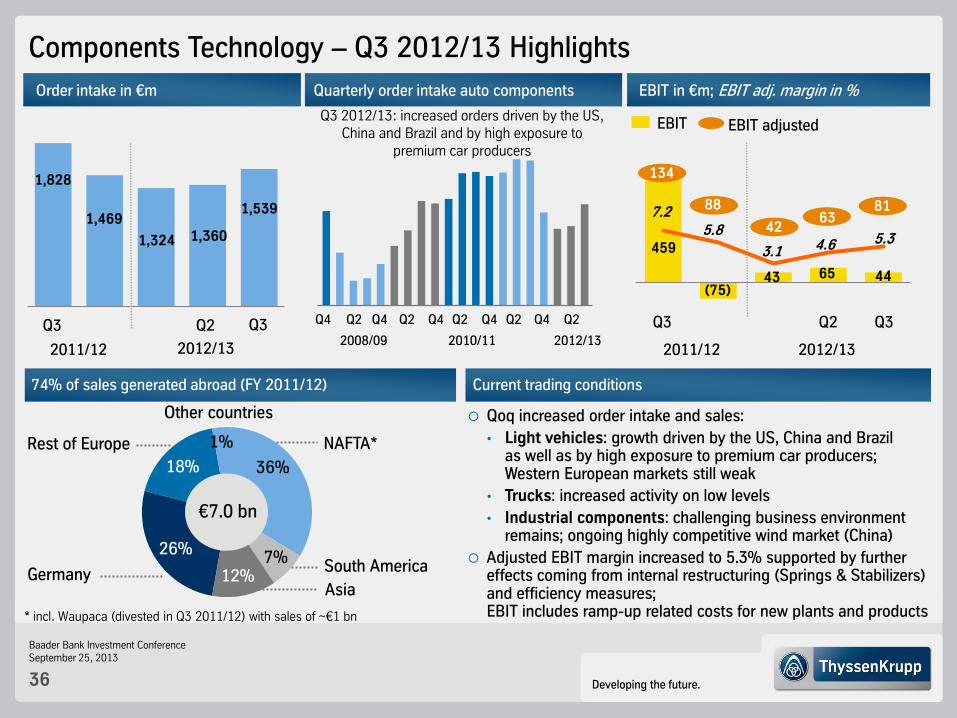
1,324
Current trading conditions 74% of sales generated abroad (FY 2011/12)
Components Technology – Q3 2012/13 Highlights
Order intake in €m Quarterly order intake auto components EBIT in €m; EBIT adj. margin in %
Q3 2012/13: increased orders driven by the US, China and Brazil and by high exposure to
premium car producers
EBIT adjusted EBIT
Q2
2011/12 2012/13
7.2 5.8
134
88
3.1
Q3
2011/12
Q2
2012/13
Q3
459
(75) 43
42
Qoq increased order intake and sales:
• Light vehicles: growth driven by the US, China and Brazil as well as by high exposure to premium car producers; Western European markets still weak
• Trucks: increased activity on low levels
• Industrial components: challenging business environment remains; ongoing highly competitive wind market (China)
Adjusted EBIT margin increased to 5.3% supported by further effects coming from internal restructuring (Springs & Stabilizers) and efficiency measures; EBIT includes ramp-up related costs for new plants and products
Q4 Q2
2008/09
Q2 Q4 Q4 Q2
2010/11
Q4 Q2 Q4
2012/13
1,360 1,469
Q2
4.6
65
63 1,539
Q3
44
81
5.3
Germany
NAFTA* Rest of Europe
€7.0 bn
South America
Asia
Other countries
36%
26% 7%
18%
12%
1%
* incl. Waupaca (divested in Q3 2011/12) with sales of ~€1 bn
Q3
1,828
Developing the future.
Baader Bank Investment Conference September 25, 2013
37
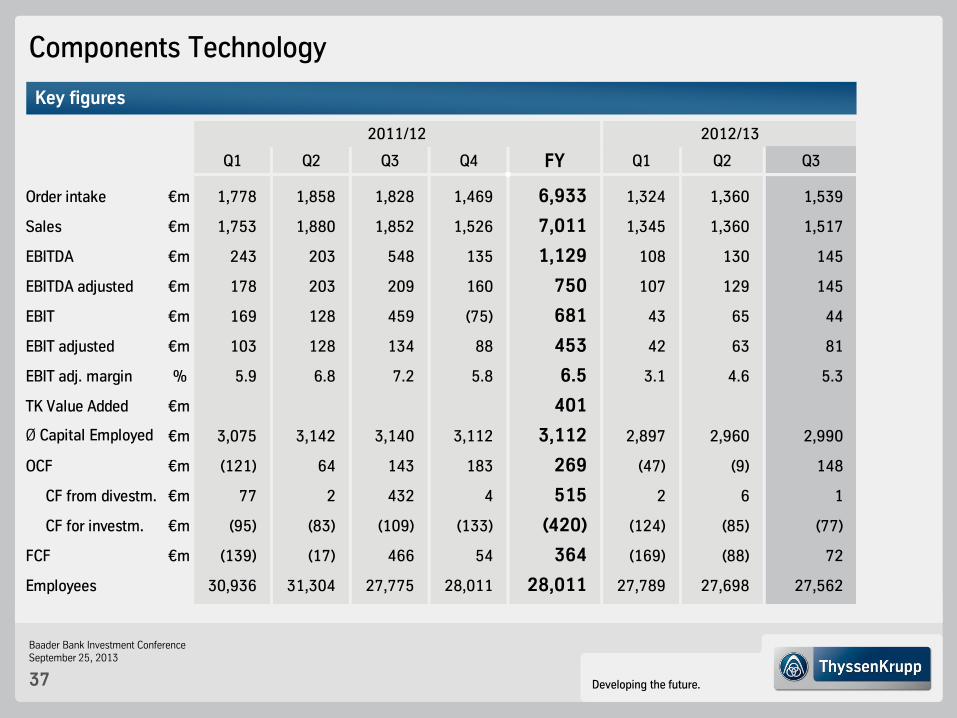
Components Technology
Key figures
Q1 Q2 Q3 Q4 FY Q1 Q2 Q3
Order intake €m 1,778 1,858 1,828 1,469 6,933 1,324 1,360 1,539
Sales €m 1,753 1,880 1,852 1,526 7,011 1,345 1,360 1,517
EBITDA €m 243 203 548 135 1,129 108 130 145
EBITDA adjusted €m 178 203 209 160 750 107 129 145
EBIT €m 169 128 459 (75) 681 43 65 44
EBIT adjusted €m 103 128 134 88 453 42 63 81
EBIT adj. margin % 5.9 6.8 7.2 5.8 6.5 3.1 4.6 5.3
TK Value Added €m 401
Ø Capital Employed €m 3,075 3,142 3,140 3,112 3,112 2,897 2,960 2,990
OCF €m (121) 64 143 183 269 (47) (9) 148
CF from divestm. €m 77 2 432 4 515 2 6 1
CF for investm. €m (95) (83) (109) (133) (420) (124) (85) (77)
FCF €m (139) (17) 466 54 364 (169) (88) 72
30,936 31,304 27,775 28,011 28,011 27,789 27,698 27,562Employees
2011/12 2012/13
Developing the future.
Baader Bank Investment Conference September 25, 2013
38
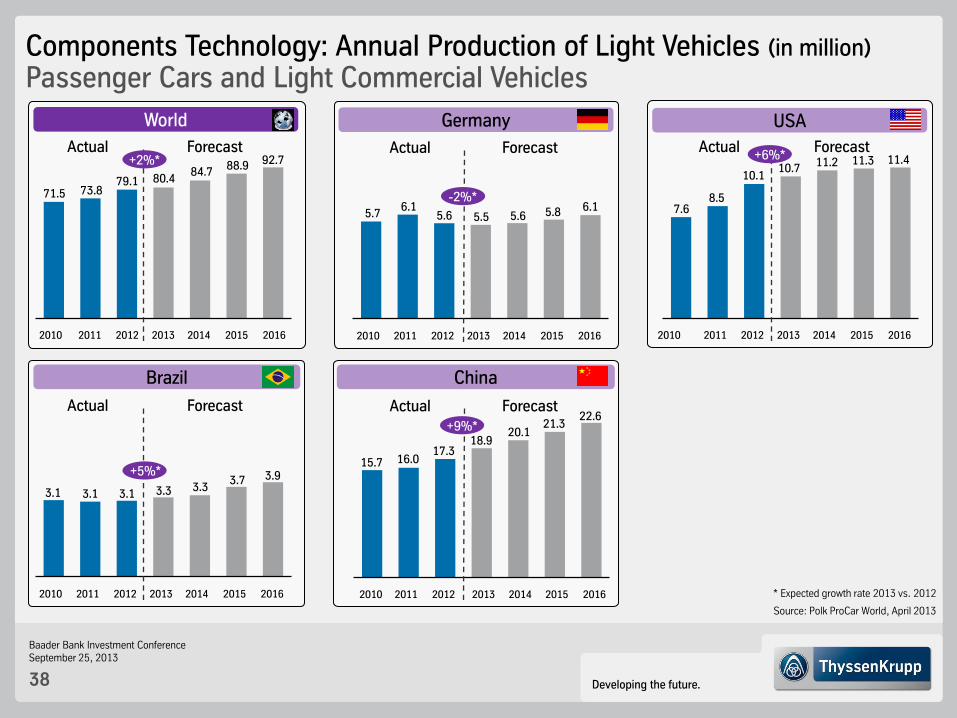
Components Technology: Annual Production of Light Vehicles (in million)
Passenger Cars and Light Commercial Vehicles
China
* Expected growth rate 2013 vs. 2012
Source: Polk ProCar World, April 2013
Brazil
World
2016
92.7
2015
88.9
2014
84.7
2013
80.4
2012
79.1
2011
73.8
2010
71.5
Germany
Actual Forecast
2016
6.1
2015
5.8
2014
5.6
2013
5.5
2012
5.6
2011
6.1
2010
5.7
Actual Forecast
2016
11.4
2015
11.3
2014
11.2
2013
10.7
2012
10.1
2011
8.5
2010
7.6
Actual Forecast
USA
2016
22.6
2015
21.3
2014
20.1
2013
18.9
2012
17.3
2011
16.0
2010
15.7
Actual Forecast
2016
3.9
2015
3.7
2014
3.3
2013
3.3
2012
3.1
2011
3.1
2010
3.1
Actual Forecast
+2%*
-2%*
+6%*
+9%*
+5%*
Developing the future.
Baader Bank Investment Conference September 25, 2013
39
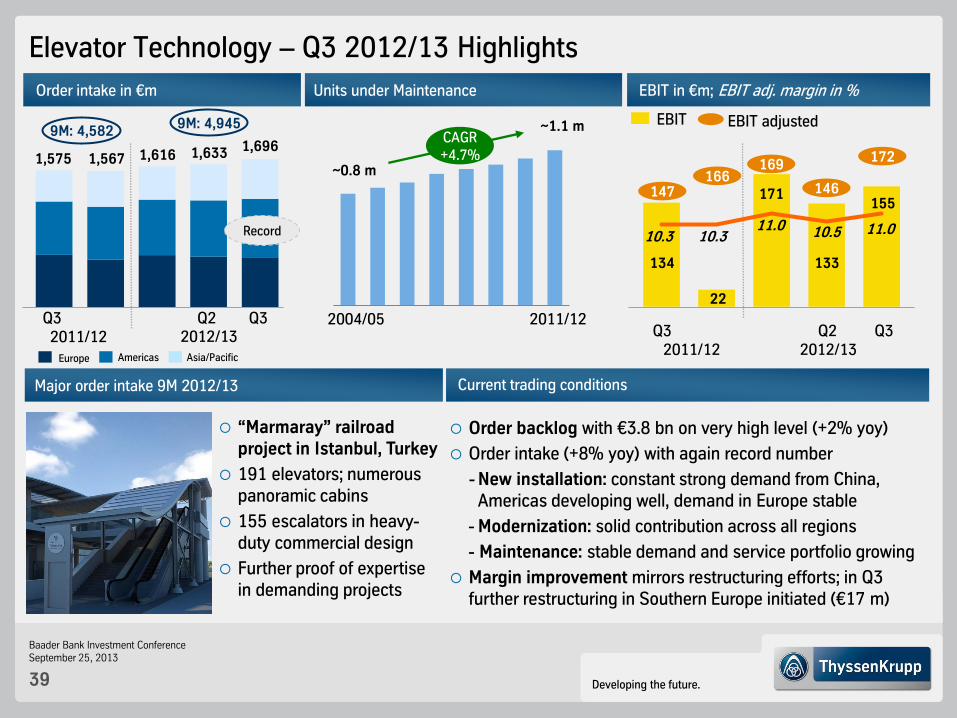
Elevator Technology – Q3 2012/13 Highlights
Order intake in €m Units under Maintenance EBIT in €m; EBIT adj. margin in %
EBIT adjusted EBIT
2004/05 2011/12
~0.8 m
~1.1 m CAGR +4.7%
172
155
11.0
147
134
10.3 10.3
166
22
11.0
171
169
Q3 2011/12
Q2 2012/13
Q3
10.5
133
146
Current trading conditions Major order intake 9M 2012/13
Order backlog with €3.8 bn on very high level (+2% yoy)
Order intake (+8% yoy) with again record number
- New installation: constant strong demand from China, Americas developing well, demand in Europe stable
- Modernization: solid contribution across all regions
- Maintenance: stable demand and service portfolio growing
Margin improvement mirrors restructuring efforts; in Q3 further restructuring in Southern Europe initiated (€17 m)
“Marmaray” railroad project in Istanbul, Turkey
191 elevators; numerous panoramic cabins
155 escalators in heavy-duty commercial design
Further proof of expertise in demanding projects
1,696 1,575 1,567 1,616
Record
Q3 Q2 Q3 2011/12 2012/13
1,633
9M: 4,582 9M: 4,945
Americas Europe Asia/Pacific

Developing the future.
Baader Bank Investment Conference September 25, 2013
40
Elevator Technology
Key figures
Q1 Q2 Q3 Q4 FY Q1 Q2 Q3
Order intake €m 1,466 1,541 1,575 1,567 6,149 1,616 1,633 1,696
Sales €m 1,348 1,322 1,429 1,607 5,705 1,532 1,388 1,562
EBITDA €m 132 139 156 118 545 190 159 179
EBITDA adjusted €m 161 149 168 175 651 188 166 197
EBIT €m 113 118 134 22 387 171 133 155
EBIT adjusted €m 142 132 147 166 587 169 146 172
EBIT adj. margin % 10.5 10.0 10.3 10.3 10.3 11.0 10.5 11.0
TK Value Added €m 193
Ø Capital Employed €m 2,322 2,393 2,425 2,427 2,427 2,359 2,371 2,372
OCF €m (49) 169 89 127 336 123 265 169
CF from divestm. €m 2 0 0 4 6 3 3 1
CF for investm. €m (77) (26) (17) (58) (178) (23) (20) (25)
FCF €m (124) 143 72 73 164 103 248 145
46,581 46,605 46,656 47,561 47,561 47,897 48,150 48,488Employees
2011/12 2012/13
Developing the future.
Baader Bank Investment Conference September 25, 2013
41
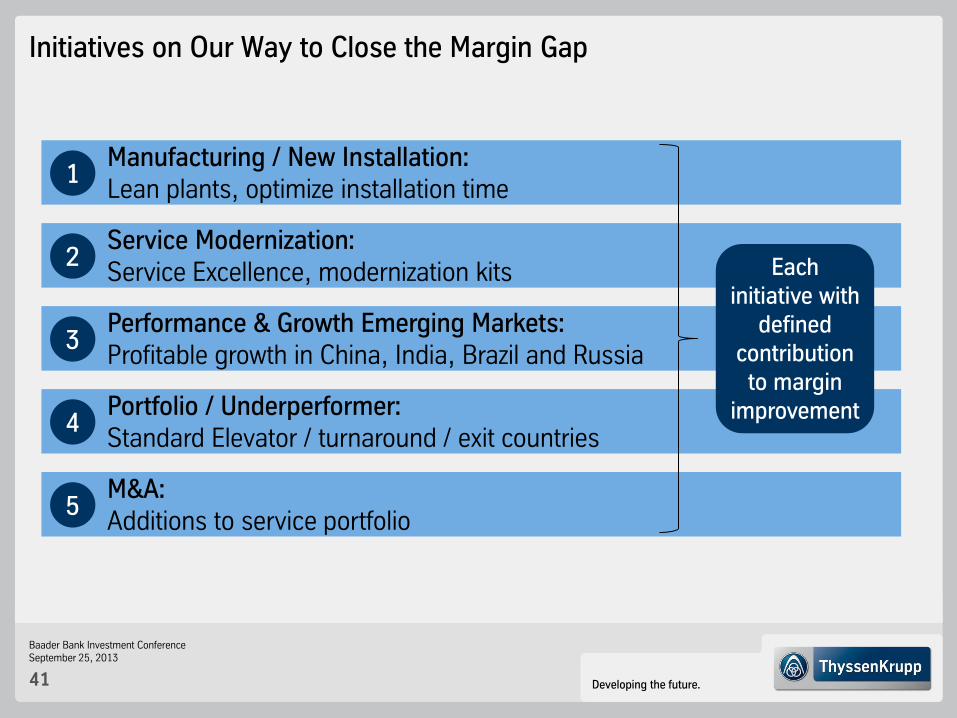
Initiatives on Our Way to Close the Margin Gap
Manufacturing / New Installation: Lean plants, optimize installation time
1
Service Modernization: Service Excellence, modernization kits
2
Performance & Growth Emerging Markets: Profitable growth in China, India, Brazil and Russia
3
Portfolio / Underperformer: Standard Elevator / turnaround / exit countries
4
M&A: Additions to service portfolio
5
Each initiative with
defined contribution to margin
improvement
Developing the future.
Baader Bank Investment Conference September 25, 2013
42
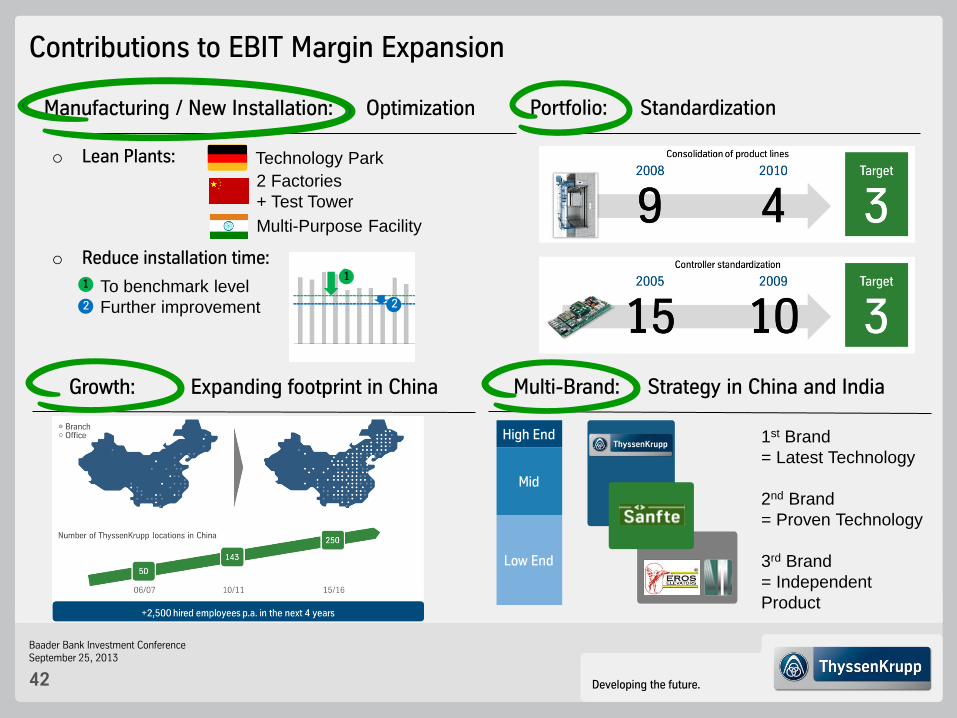
o Lean Plants:
Contributions to EBIT Margin Expansion
Manufacturing / New Installation: Optimization
Multi-Brand: Strategy in China and India
Portfolio: Standardization
Technology Park
Low End
Mid
High End 1st Brand
= Latest Technology
2nd Brand
= Proven Technology
3rd Brand
= Independent
Product
2 Factories
+ Test Tower
Multi-Purpose Facility
Growth: Expanding footprint in China
o Reduce installation time:
To benchmark level
Further improvement
1 1
2 2
Developing the future.
Baader Bank Investment Conference September 25, 2013
43
Industrial Solutions – Q3 2012/13 Highlights
Order intake in €m Order backlog in €bn EBIT* in €m; EBIT* adj. margin in %
157
11.9
156
164
12.3 11.8
168
158
Q3 Q2 Q3
2011/12 2012/13
10.7 779
16.3 15.6
13.3 15.8
141
Major order intake 9M 2012/13 Current trading conditions
Q3 Q2 Q3
2011/12 2012/13
3,585
1,595
16.4
Q3
2011/12
Q2
2012/13
Q3
12.6
198
180
EBIT* adjusted EBIT*
9M: 4,046
1,288
2,002
9M: 4,376
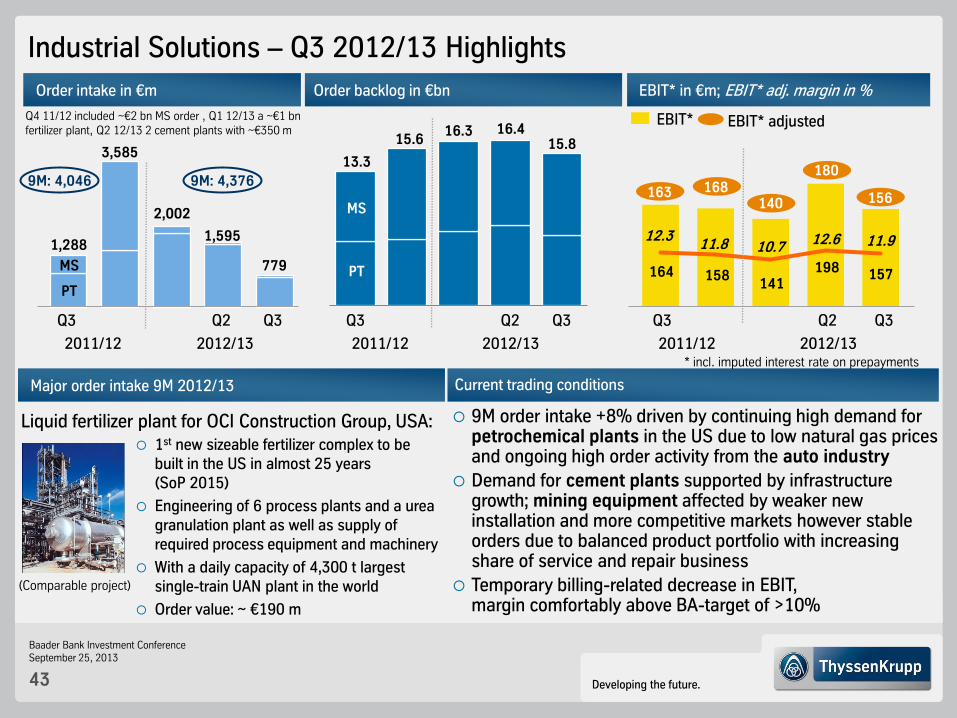
Q4 11/12 included ~€2 bn MS order , Q1 12/13 a ~€1 bn fertilizer plant, Q2 12/13 2 cement plants with ~€350 m
(Comparable project)
PT
MS PT
MS
9M order intake +8% driven by continuing high demand for petrochemical plants in the US due to low natural gas prices and ongoing high order activity from the auto industry
Demand for cement plants supported by infrastructure growth; mining equipment affected by weaker new installation and more competitive markets however stable orders due to balanced product portfolio with increasing share of service and repair business
Temporary billing-related decrease in EBIT, margin comfortably above BA-target of >10%
140
* incl. imputed interest rate on prepayments
1st new sizeable fertilizer complex to be built in the US in almost 25 years (SoP 2015)
Engineering of 6 process plants and a urea granulation plant as well as supply of required process equipment and machinery
With a daily capacity of 4,300 t largest single-train UAN plant in the world
Order value: ~ €190 m
Liquid fertilizer plant for OCI Construction Group, USA:
163
Developing the future.
Baader Bank Investment Conference September 25, 2013
44
Industrial Solutions
Key figures
Q1 Q2 Q3 Q4 FY Q1 Q2 Q3
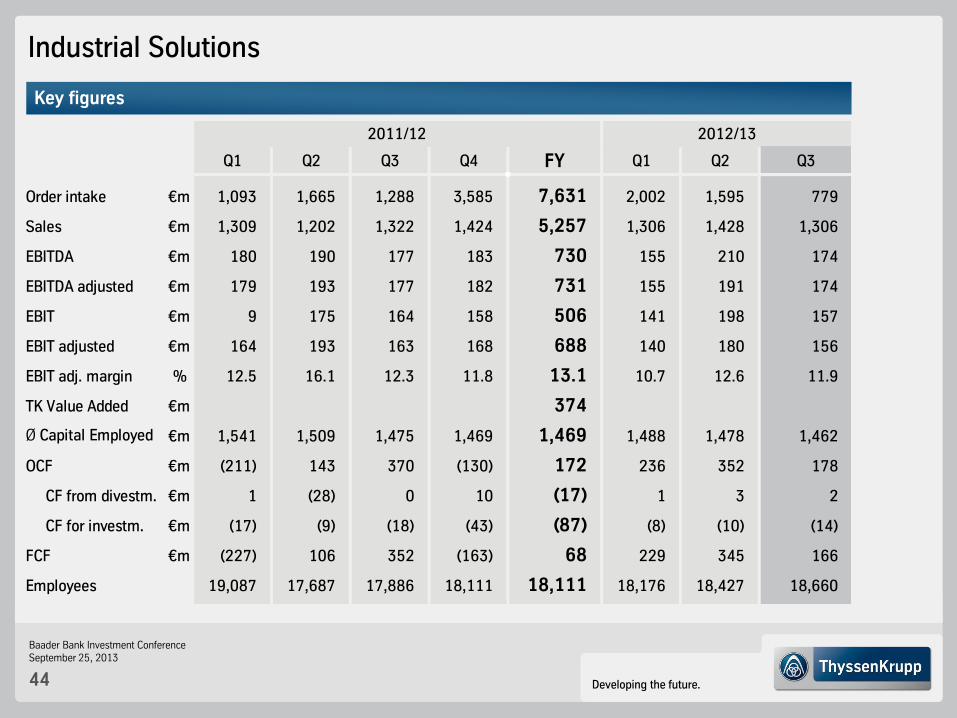
Order intake €m 1,093 1,665 1,288 3,585 7,631 2,002 1,595 779
Sales €m 1,309 1,202 1,322 1,424 5,257 1,306 1,428 1,306
EBITDA €m 180 190 177 183 730 155 210 174
EBITDA adjusted €m 179 193 177 182 731 155 191 174
EBIT €m 9 175 164 158 506 141 198 157
EBIT adjusted €m 164 193 163 168 688 140 180 156
EBIT adj. margin % 12.5 16.1 12.3 11.8 13.1 10.7 12.6 11.9
TK Value Added €m 374
Ø Capital Employed €m 1,541 1,509 1,475 1,469 1,469 1,488 1,478 1,462
OCF €m (211) 143 370 (130) 172 236 352 178
CF from divestm. €m 1 (28) 0 10 (17) 1 3 2
CF for investm. €m (17) (9) (18) (43) (87) (8) (10) (14)
FCF €m (227) 106 352 (163) 68 229 345 166
19,087 17,687 17,886 18,111 18,111 18,176 18,427 18,660Employees
2011/12 2012/13
Developing the future.
Baader Bank Investment Conference September 25, 2013
45
Industrial Solutions: Selected Orders 9M 2012/13
Chemicals
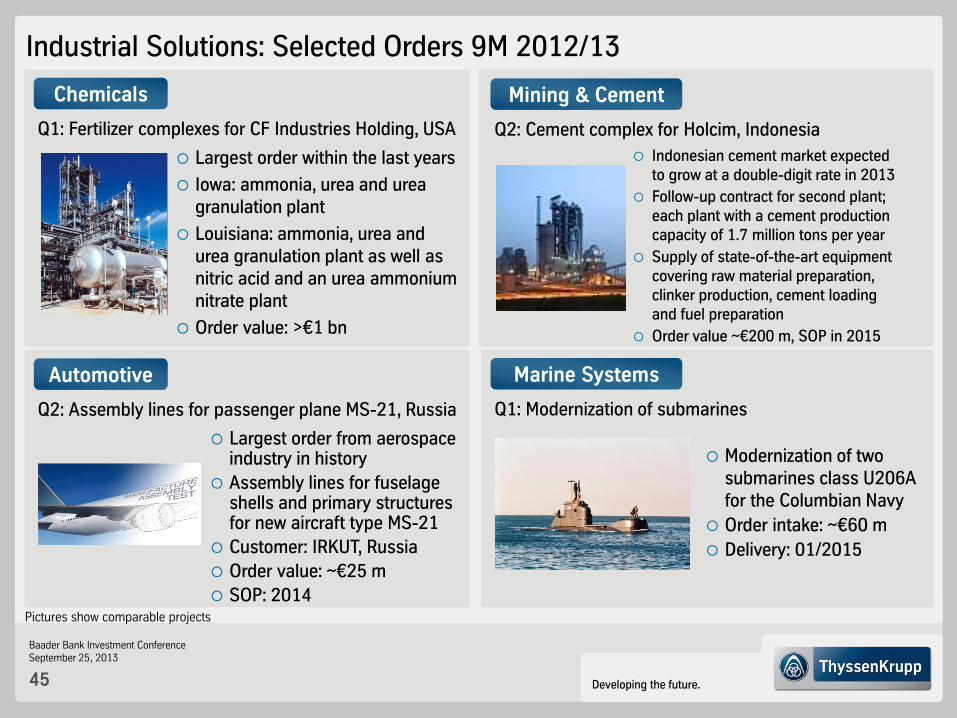
Q1: Fertilizer complexes for CF Industries Holding, USA
Largest order within the last years
Iowa: ammonia, urea and urea granulation plant
Louisiana: ammonia, urea and urea granulation plant as well as nitric acid and an urea ammonium nitrate plant
Order value: >€1 bn
Pictures show comparable projects
Mining & Cement
Q2: Cement complex for Holcim, Indonesia
Indonesian cement market expected to grow at a double-digit rate in 2013
Follow-up contract for second plant; each plant with a cement production capacity of 1.7 million tons per year
Supply of state-of-the-art equipment covering raw material preparation, clinker production, cement loading and fuel preparation
Order value ~€200 m, SOP in 2015
Automotive
Q2: Assembly lines for passenger plane MS-21, Russia
Largest order from aerospace industry in history
Assembly lines for fuselage shells and primary structures for new aircraft type MS-21
Customer: IRKUT, Russia
Order value: ~€25 m
SOP: 2014
Marine Systems
Q1: Modernization of submarines
Modernization of two submarines class U206A for the Columbian Navy
Order intake: ~€60 m
Delivery: 01/2015
Developing the future.
Baader Bank Investment Conference September 25, 2013
46
Materials Services – Q3 2012/13 Highlights
Order intake* in €m Materials warehousing shipments in 1,000 t EBIT in €m; EBIT adj. margin in %
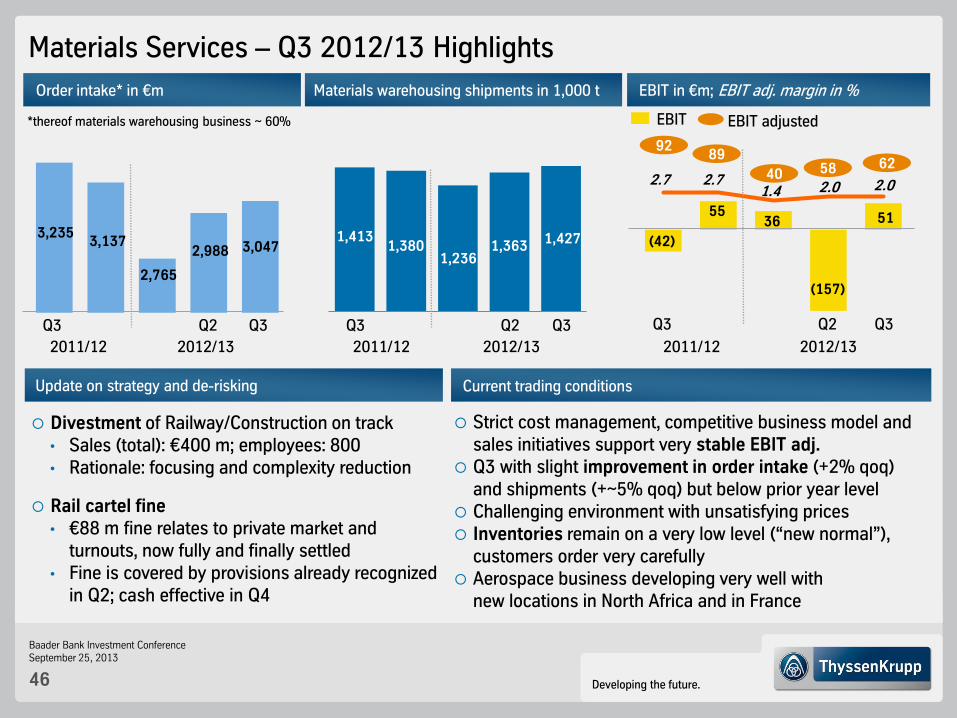
*thereof materials warehousing business ~ 60% EBIT adjusted EBIT
2.7 2.0
51
2.7
(42)
55
62 92
89
36
1.4 40
Q3
2011/12
Q2
2012/13
Q3 Q3 Q3
2011/12 2012/13
3,047 3,235
3,137
2,765
1,413 1,380
1,236
Q3 Q2 Q3
2011/12 2012/13
1,363
Q2
2,988 1,427
(157)
2.0 58
Current trading conditions Update on strategy and de-risking
Divestment of Railway/Construction on track • Sales (total): €400 m; employees: 800 • Rationale: focusing and complexity reduction
Rail cartel fine • €88 m fine relates to private market and
turnouts, now fully and finally settled • Fine is covered by provisions already recognized
in Q2; cash effective in Q4
Strict cost management, competitive business model and sales initiatives support very stable EBIT adj.
Q3 with slight improvement in order intake (+2% qoq) and shipments (+~5% qoq) but below prior year level
Challenging environment with unsatisfying prices Inventories remain on a very low level (“new normal”),
customers order very carefully Aerospace business developing very well with
new locations in North Africa and in France

Developing the future.
Baader Bank Investment Conference September 25, 2013
47
Materials Services
Key figures
Q1 Q2 Q3 Q4 FY Q1 Q2 Q3
Order intake €m 3,201 3,573 3,235 3,137 13,146 2,765 2,988 3,047
Sales €m 3,145 3,408 3,369 3,243 13,165 2,815 2,923 3,056
EBITDA €m 65 98 (20) 96 240 59 (134) 87
EBITDA adjusted €m 65 98 130 113 406 63 80 84
EBIT €m 40 74 (42) 55 127 36 (157) 51
EBIT adjusted €m 40 90 92 89 311 40 58 62
EBIT adj. margin % 1.3 2.6 2.7 2.7 2.4 1.4 2.0 2.0
TK Value Added €m (123)
Ø Capital Employed €m 2,861 2,966 2,971 2,945 2,945 2,913 2,925 2,881
OCF €m (441) 23 11 232 (175) (206) (28) 106
CF from divestm. €m 197 42 2 1 242 2 8 34
CF for investm. €m (17) (18) (16) (40) (91) (19) (13) (8)
FCF €m (261) 47 (3) 193 (24) (223) (33) 132
27,910 28,123 27,945 27,595 27,595 26,280 26,230 25,994Employees
2011/12 2012/13
Developing the future.
Baader Bank Investment Conference September 25, 2013
48
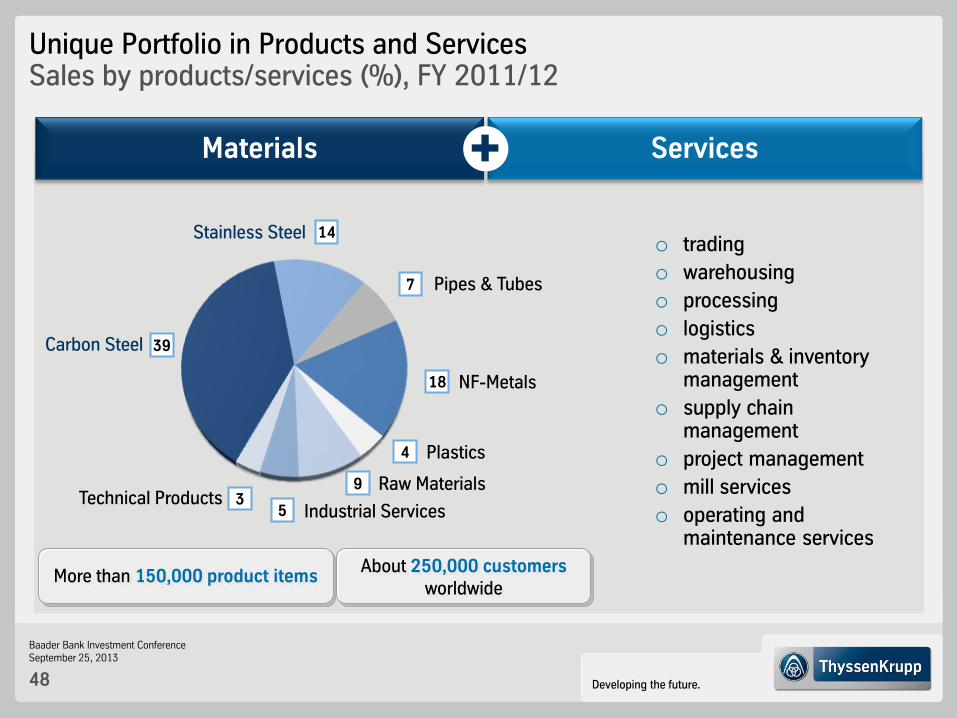
Unique Portfolio in Products and Services Sales by products/services (%), FY 2011/12
Carbon Steel
Pipes & Tubes
Stainless Steel
NF-Metals
Plastics
Raw Materials
Industrial Services Technical Products
18
4
9
5 3
39
7
14
More than 150,000 product items About 250,000 customers
worldwide
Materials Services
o trading
o warehousing
o processing
o logistics
o materials & inventory management
o supply chain management
o project management
o mill services
o operating and maintenance services
Developing the future.
Baader Bank Investment Conference September 25, 2013
49
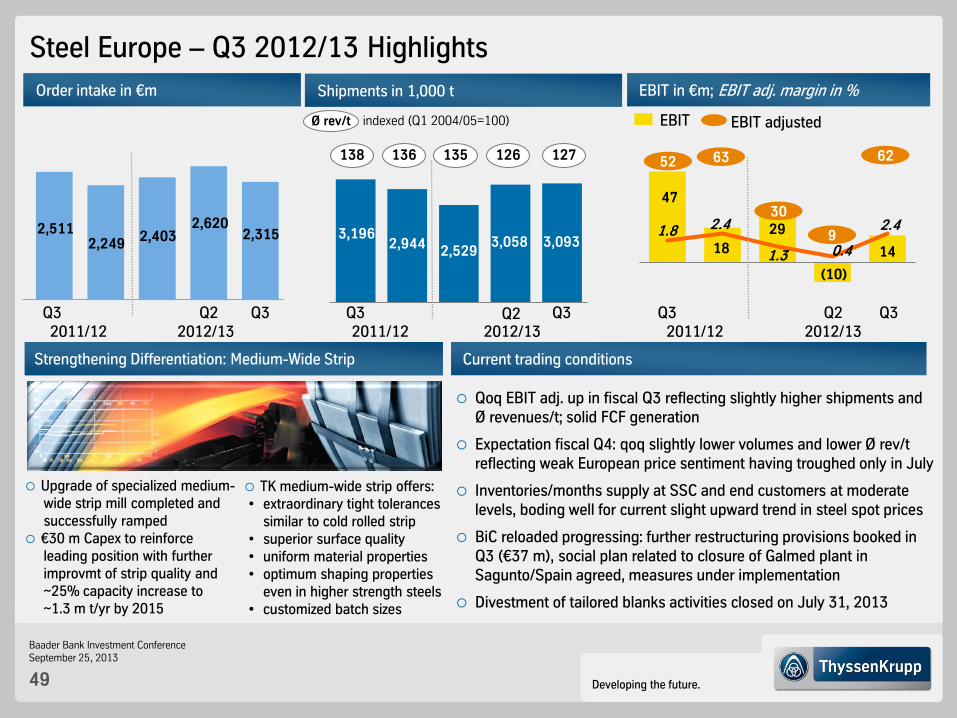
Steel Europe – Q3 2012/13 Highlights
Shipments in 1,000 t
138
indexed (Q1 2004/05=100) Ø rev/t
136 135
Q3 Q2 Q3 2011/12 2012/13
3,196
126
2,529 2,944 3,058
127
Order intake in €m EBIT in €m; EBIT adj. margin in %
EBIT adjusted EBIT
Q3 2011/12
Q2 2012/13
Q3 Q3 Q2 Q3 2011/12 2012/13
2,315 2,511 2,249
2,403 2.4
14
63 52
47
1.8 2.4
18
62
29
1.3
30 2,620
(10)
0.4 9 3,093
Upgrade of specialized medium- wide strip mill completed and successfully ramped €30 m Capex to reinforce leading position with further improvmt of strip quality and ~25% capacity increase to ~1.3 m t/yr by 2015
Current trading conditions
Qoq EBIT adj. up in fiscal Q3 reflecting slightly higher shipments and Ø revenues/t; solid FCF generation
Expectation fiscal Q4: qoq slightly lower volumes and lower Ø rev/t reflecting weak European price sentiment having troughed only in July
Inventories/months supply at SSC and end customers at moderate levels, boding well for current slight upward trend in steel spot prices
BiC reloaded progressing: further restructuring provisions booked in Q3 (€37 m), social plan related to closure of Galmed plant in Sagunto/Spain agreed, measures under implementation
Divestment of tailored blanks activities closed on July 31, 2013
Inventories and Months of Supply - Europe Strengthening Differentiation: Medium-Wide Strip
TK medium-wide strip offers: • extraordinary tight tolerances similar to cold rolled strip • superior surface quality • uniform material properties • optimum shaping properties even in higher strength steels • customized batch sizes
Developing the future.
Baader Bank Investment Conference September 25, 2013
50
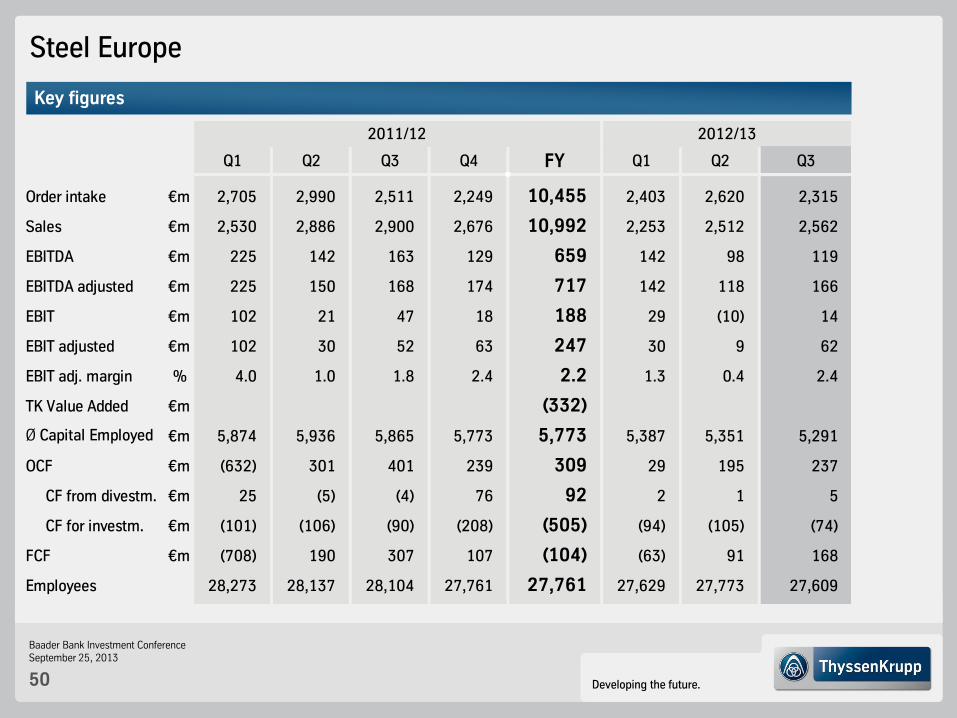
Steel Europe
Key figures
Q1 Q2 Q3 Q4 FY Q1 Q2 Q3
Order intake €m 2,705 2,990 2,511 2,249 10,455 2,403 2,620 2,315
Sales €m 2,530 2,886 2,900 2,676 10,992 2,253 2,512 2,562
EBITDA €m 225 142 163 129 659 142 98 119
EBITDA adjusted €m 225 150 168 174 717 142 118 166
EBIT €m 102 21 47 18 188 29 (10) 14
EBIT adjusted €m 102 30 52 63 247 30 9 62
EBIT adj. margin % 4.0 1.0 1.8 2.4 2.2 1.3 0.4 2.4
TK Value Added €m (332)
Ø Capital Employed €m 5,874 5,936 5,865 5,773 5,773 5,387 5,351 5,291
OCF €m (632) 301 401 239 309 29 195 237
CF from divestm. €m 25 (5) (4) 76 92 2 1 5
CF for investm. €m (101) (106) (90) (208) (505) (94) (105) (74)
FCF €m (708) 190 307 107 (104) (63) 91 168
28,273 28,137 28,104 27,761 27,761 27,629 27,773 27,609Employees
2011/12 2012/13
Developing the future.
Baader Bank Investment Conference September 25, 2013
51
125 133
156
122 130 147
135 129 136 153
116 135 136
126 133 138 139 120
140 138 127 134
150
120 129
146 136
816 875 908 852
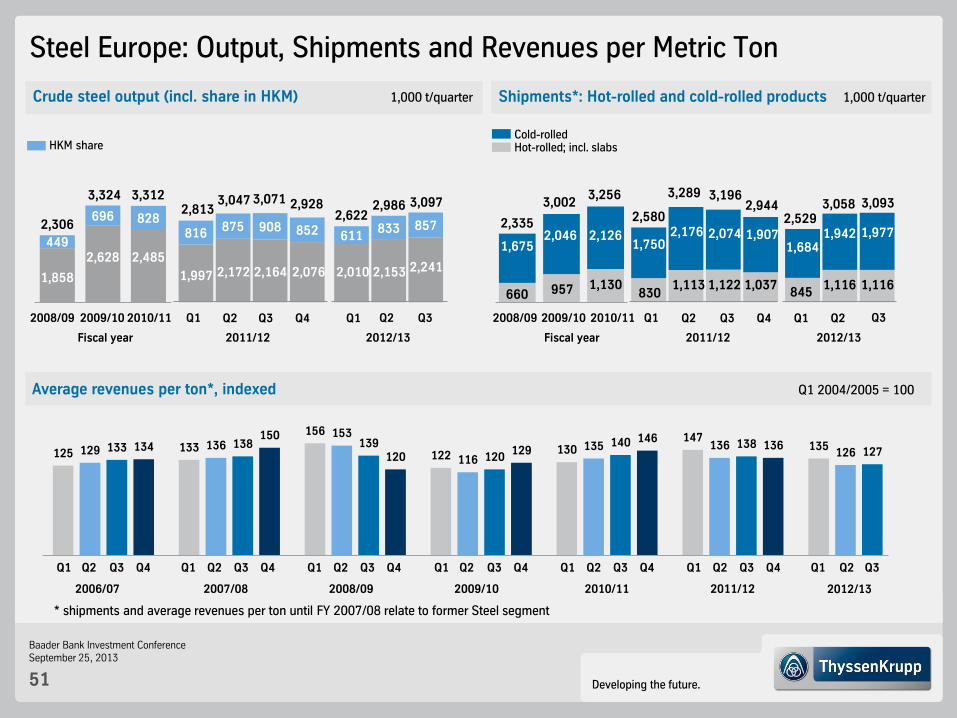
Average revenues per ton*, indexed Q1 2004/2005 = 100
HKM share
Steel Europe: Output, Shipments and Revenues per Metric Ton
Cold-rolled Hot-rolled; incl. slabs
2006/07 2007/08 2008/09
Crude steel output (incl. share in HKM) 1,000 t/quarter Shipments*: Hot-rolled and cold-rolled products 1,000 t/quarter
2009/10
* shipments and average revenues per ton until FY 2007/08 relate to former Steel segment
2010/11 2011/12 2012/13
Q1 Q1 Q2 Q3 Q4 Q1 Q2 Q3 Q4 Q1 Q2 Q3 Q4 Q1 Q2 Q3 Q4 Q1 Q2 Q3 Q4 Q1 Q2 Q3 Q4
449
696 828
Q2
Fiscal year
2008/09 2009/10 Q1
2011/12
2,306
Q3 Q4 2010/11 Q1
2012/13
2,628
1,858
2,813 3,324
1,997
3,071
2,172 2,164
3,047
2,076
2,928
Q1
2012/13 Fiscal year
2008/09 2009/10 2010/11
2,335
660
1,675
Q1
2011/12
2,529
845
1,684
Q2 Q3 Q4
3,002
957
2,046
2,485
3,312
611 833 857
2,010
2,622
3,256
1,130
2,126
2,580
830
1,750
3,289
1,113
2,176
3,196
1,122
2,074
2,944
1,037
1,907
Q2 Q2
Q2
2,153
2,986 3,058
1,116
1,942
Q3
3,097
2,241
Q3
3,093
1,116
1,977
Q3
Developing the future.
Baader Bank Investment Conference September 25, 2013
52
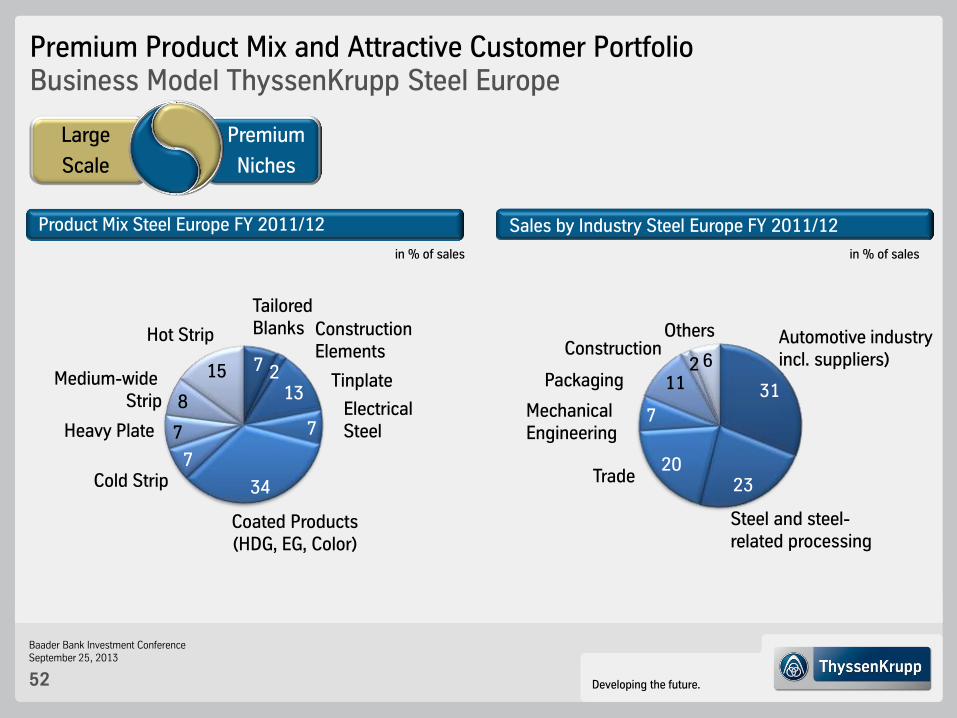
Premium Product Mix and Attractive Customer Portfolio Business Model ThyssenKrupp Steel Europe
Product Mix Steel Europe FY 2011/12
in % of sales
7 213
7
34
7
7
8
15
Tailored Blanks Construction
Elements
Electrical Steel
Medium-wide Strip
Hot Strip
Tinplate
Coated Products (HDG, EG, Color)
Cold Strip
Heavy Plate
Sales by Industry Steel Europe FY 2011/12
in % of sales
Construction
31
2
23 20
7
11 6
Others Automotive industry incl. suppliers)
Packaging
Trade
Mechanical Engineering
Steel and steel-related processing
Premium
Niches
Large
Scale
Developing the future.
Baader Bank Investment Conference September 25, 2013
53
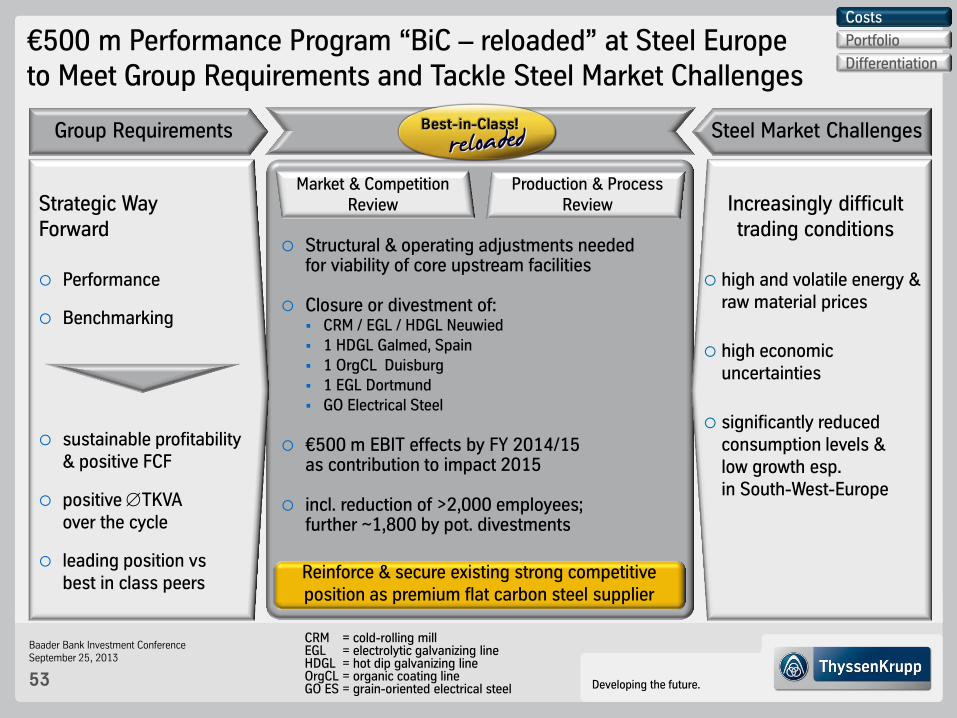
€500 m Performance Program “BiC – reloaded” at Steel Europe to Meet Group Requirements and Tackle Steel Market Challenges
Strategic Way Forward
Performance
Benchmarking
sustainable profitability & positive FCF
positive TKVA over the cycle
leading position vs best in class peers
Increasingly difficult trading conditions
high and volatile energy & raw material prices
high economic uncertainties
significantly reduced consumption levels & low growth esp. in South-West-Europe
Group Requirements Steel Market Challenges
Reinforce & secure existing strong competitive position as premium flat carbon steel supplier
Market & Competition Review
Production & Process Review
Structural & operating adjustments needed for viability of core upstream facilities
Closure or divestment of:
CRM / EGL / HDGL Neuwied 1 HDGL Galmed, Spain
1 OrgCL Duisburg 1 EGL Dortmund GO Electrical Steel
€500 m EBIT effects by FY 2014/15 as contribution to impact 2015
incl. reduction of >2,000 employees; further ~1,800 by pot. divestments
CRM = cold-rolling mill EGL = electrolytic galvanizing line HDGL = hot dip galvanizing line OrgCL = organic coating line GO ES = grain-oriented electrical steel
Costs
Portfolio
Differentiation
Developing the future.
Baader Bank Investment Conference September 25, 2013
54
-1
-0.5
0
0.5
1
1.5
-1
-0.5
0
0.5
1
1.5
00/01 02/03 04/05 06/07 08/09 10/11 12/13e 14/15e
-0.5
0
0.5
1
1.5
2
-0.5
0
0.5
1
1.5
2
00/01 02/03 04/05 06/07 08/09 10/11 12/13e 14/15e
-0.5
0
0.5
1
1.5
2
2.5
3
-0.5
0
0.5
1
1.5
2
2.5
3
00/01 02/03 04/05 06/07 08/09 10/11 12/13e 14/15e
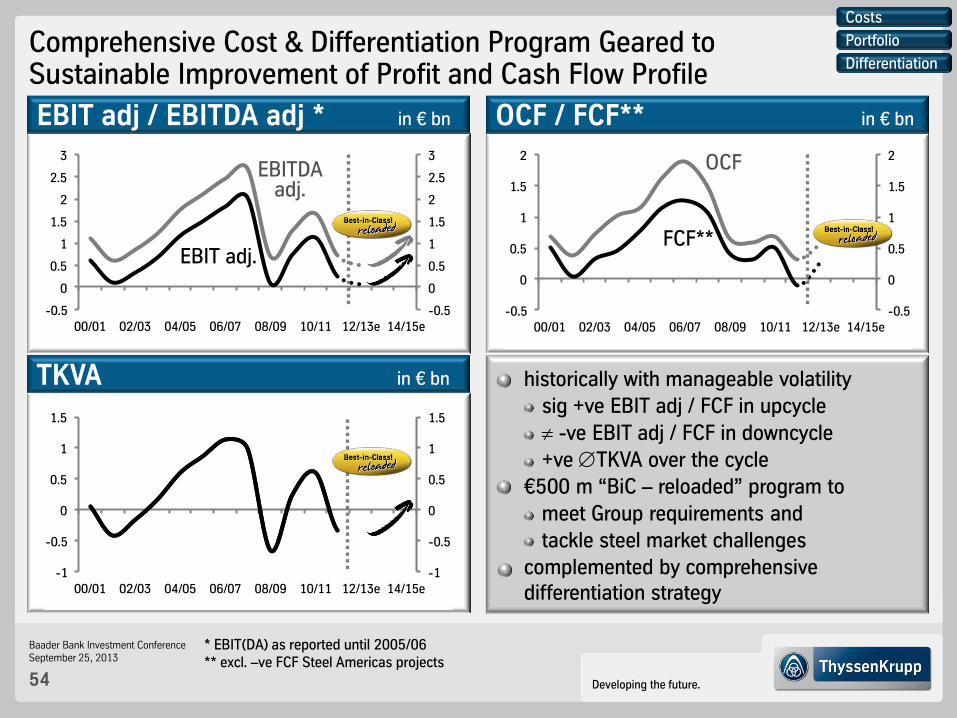
Comprehensive Cost & Differentiation Program Geared to Sustainable Improvement of Profit and Cash Flow Profile
EBIT adj / EBITDA adj * in € bn OCF / FCF** in € bn
TKVA in € bn
OCF
FCF**
* EBIT(DA) as reported until 2005/06 ** excl. –ve FCF Steel Americas projects
EBIT adj.
historically with manageable volatility
sig +ve EBIT adj / FCF in upcycle
-ve EBIT adj / FCF in downcycle
+ve TKVA over the cycle
€500 m “BiC – reloaded” program to
meet Group requirements and
tackle steel market challenges
complemented by comprehensive differentiation strategy
EBITDA adj.
Costs
Portfolio
Differentiation
Developing the future.
Baader Bank Investment Conference September 25, 2013
55
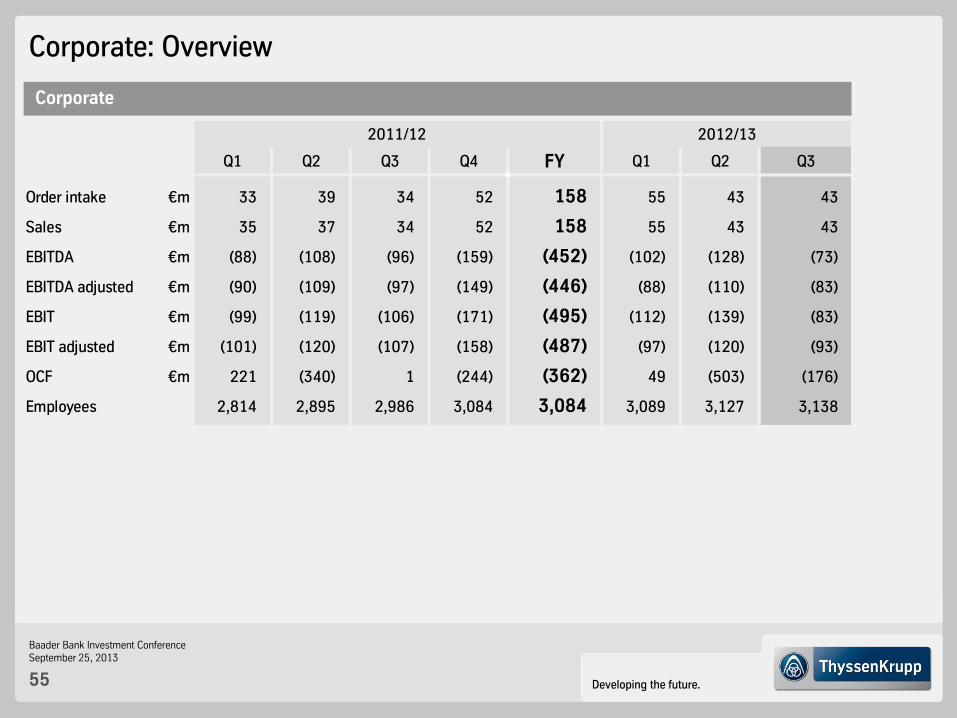
Corporate: Overview
Corporate
Q1 Q2 Q3 Q4 FY Q1 Q2 Q3
Order intake €m 33 39 34 52 158 55 43 43
Sales €m 35 37 34 52 158 55 43 43
EBITDA €m (88) (108) (96) (159) (452) (102) (128) (73)
EBITDA adjusted €m (90) (109) (97) (149) (446) (88) (110) (83)
EBIT €m (99) (119) (106) (171) (495) (112) (139) (83)
EBIT adjusted €m (101) (120) (107) (158) (487) (97) (120) (93)
OCF €m 221 (340) 1 (244) (362) 49 (503) (176)
2,814 2,895 2,986 3,084 3,084 3,089 3,127 3,138Employees
2011/12 2012/13
Developing the future.
Baader Bank Investment Conference September 25, 2013
56
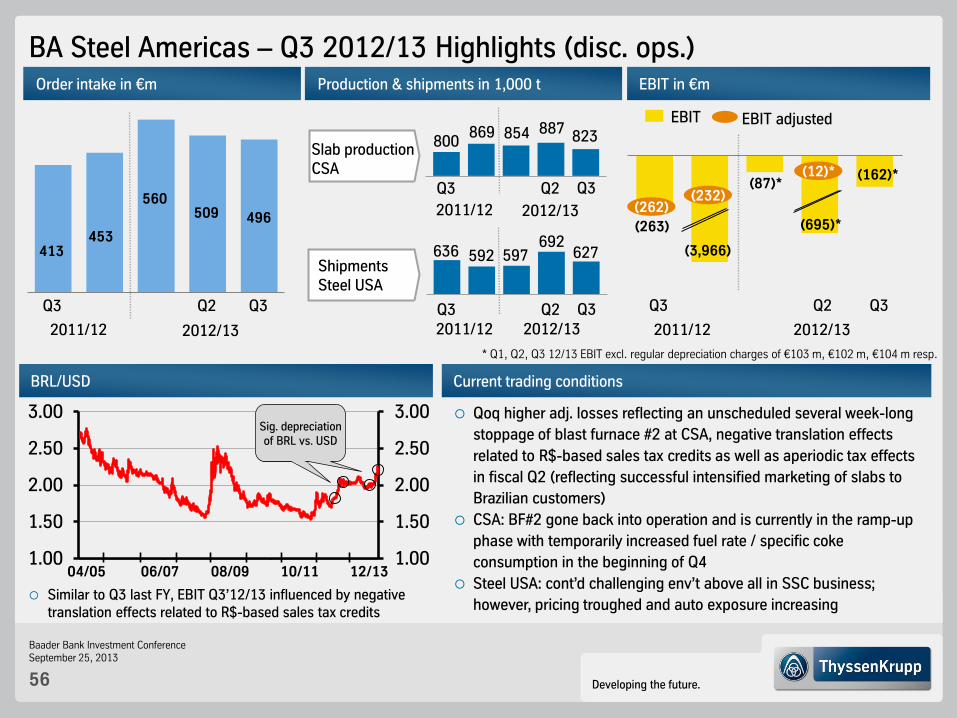
BA Steel Americas – Q3 2012/13 Highlights (disc. ops.) Production & shipments in 1,000 t
Slab production CSA
Shipments Steel USA
800 869
Q3 Q2
2011/12 2012/13
Q3
636 592
Q3 Q2 Q3 2011/12 2012/13
597
854
692
887
Order intake in €m EBIT in €m
EBIT adjusted EBIT
496
413 453
Q3 Q2 Q3
2011/12 2012/13
560
Q3
2011/12 2012/13
(263)
(262)
(3,966)
(232) (87)*
Q2 Q3
* Q1, Q2, Q3 12/13 EBIT excl. regular depreciation charges of €103 m, €102 m, €104 m resp.
(695)* 509
(12)* (162)*
627
823
Qoq higher adj. losses reflecting an unscheduled several week-long
stoppage of blast furnace #2 at CSA, negative translation effects
related to R$-based sales tax credits as well as aperiodic tax effects
in fiscal Q2 (reflecting successful intensified marketing of slabs to
Brazilian customers)
CSA: BF#2 gone back into operation and is currently in the ramp-up
phase with temporarily increased fuel rate / specific coke
consumption in the beginning of Q4
Steel USA: cont’d challenging env’t above all in SSC business;
however, pricing troughed and auto exposure increasing
Current trading conditions
Similar to Q3 last FY, EBIT Q3’12/13 influenced by negative translation effects related to R$-based sales tax credits
BRL/USD
1.00
1.50
2.00
2.50
3.00
1.00
1.50
2.00
2.50
3.00
04/05 06/07 08/09 10/11 12/13
Sig. depreciation of BRL vs. USD
Developing the future.
Baader Bank Investment Conference September 25, 2013
57
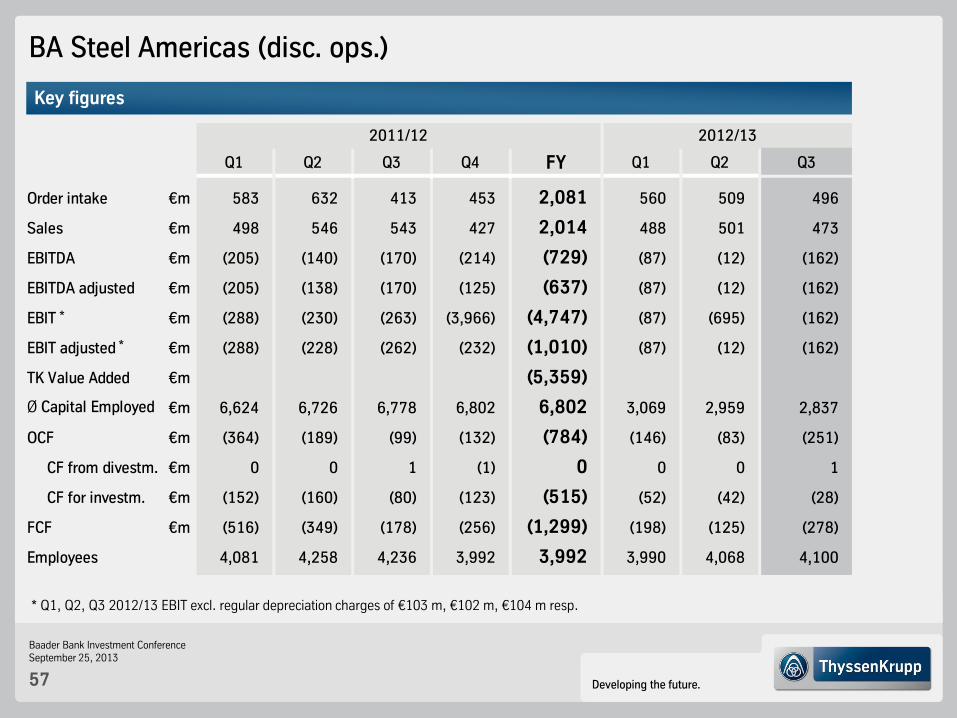
BA Steel Americas (disc. ops.)
Key figures
Q1 Q2 Q3 Q4 FY Q1 Q2 Q3
Order intake €m 583 632 413 453 2,081 560 509 496
Sales €m 498 546 543 427 2,014 488 501 473
EBITDA €m (205) (140) (170) (214) (729) (87) (12) (162)
EBITDA adjusted €m (205) (138) (170) (125) (637) (87) (12) (162)
EBIT €m (288) (230) (263) (3,966) (4,747) (87) (695) (162)
EBIT adjusted €m (288) (228) (262) (232) (1,010) (87) (12) (162)
TK Value Added €m (5,359)
Ø Capital Employed €m 6,624 6,726 6,778 6,802 6,802 3,069 2,959 2,837
OCF €m (364) (189) (99) (132) (784) (146) (83) (251)
CF from divestm. €m 0 0 1 (1) 0 0 0 1
CF for investm. €m (152) (160) (80) (123) (515) (52) (42) (28)
FCF €m (516) (349) (178) (256) (1,299) (198) (125) (278)
4,081 4,258 4,236 3,992 3,992 3,990 4,068 4,100Employees
2011/12 2012/13
* Q1, Q2, Q3 2012/13 EBIT excl. regular depreciation charges of €103 m, €102 m, €104 m resp.
*
*
Developing the future.
Baader Bank Investment Conference September 25, 2013
58
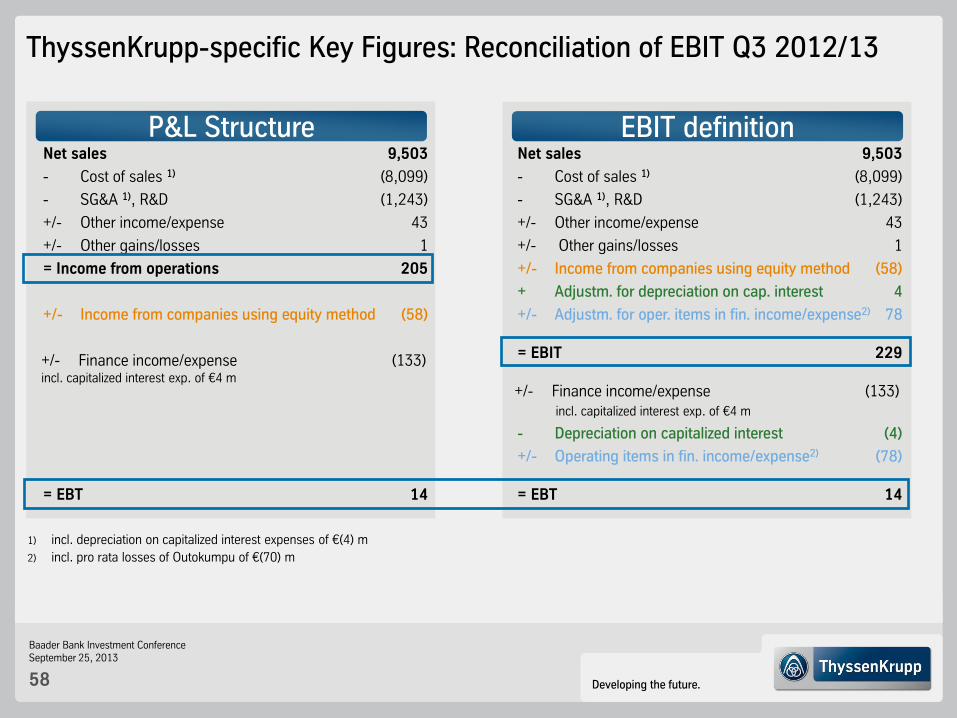
P&L Structure
ThyssenKrupp-specific Key Figures: Reconciliation of EBIT Q3 2012/13
Net sales 9,503
- Cost of sales 1) (8,099)
- SG&A 1), R&D (1,243)
+/- Other income/expense 43
+/- Other gains/losses 1
= Income from operations 205
+/- Income from companies using equity method (58)
+/- Finance income/expense (133) incl. capitalized interest exp. of €4 m
= EBT 14
EBIT definition Net sales 9,503
- Cost of sales 1) (8,099)
- SG&A 1), R&D (1,243)
+/- Other income/expense 43
+/- Other gains/losses 1
+/- Income from companies using equity method (58)
+ Adjustm. for depreciation on cap. interest 4
+/- Adjustm. for oper. items in fin. income/expense2) 78
= EBIT 229
+/- Finance income/expense (133) incl. capitalized interest exp. of €4 m
- Depreciation on capitalized interest (4)
+/- Operating items in fin. income/expense2) (78)
= EBT 14
1) incl. depreciation on capitalized interest expenses of €(4) m
2) incl. pro rata losses of Outokumpu of €(70) m
Developing the future.
Baader Bank Investment Conference September 25, 2013
59
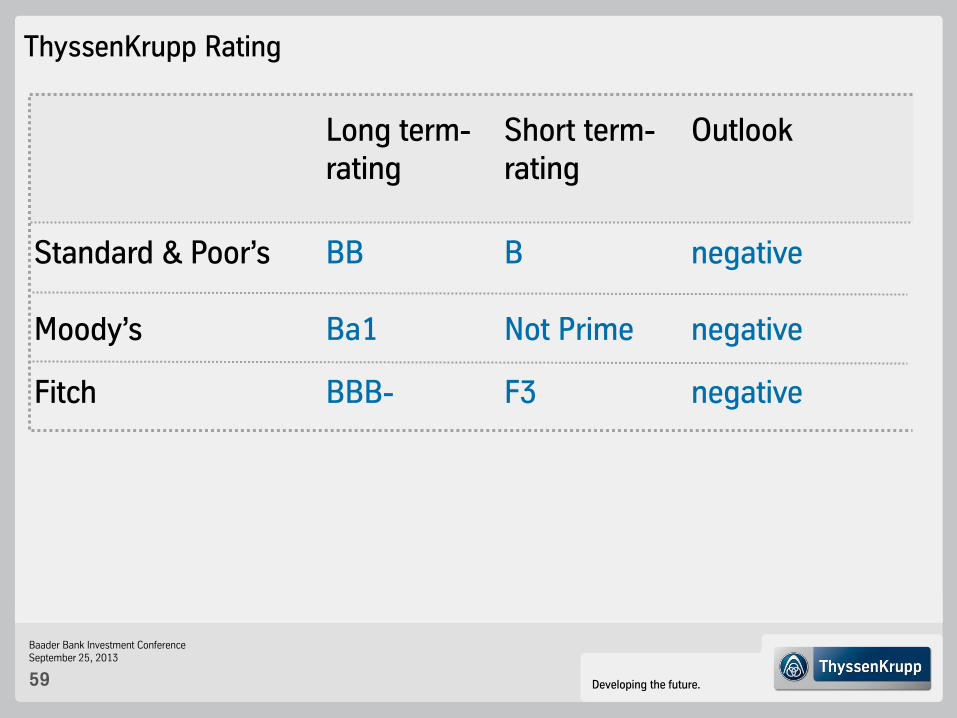
Long term- Short term- Outlook rating rating
Standard & Poor’s BB B negative Moody’s Ba1 Not Prime negative
Fitch BBB- F3 negative
ThyssenKrupp Rating
Developing the future.
Baader Bank Investment Conference September 25, 2013
60
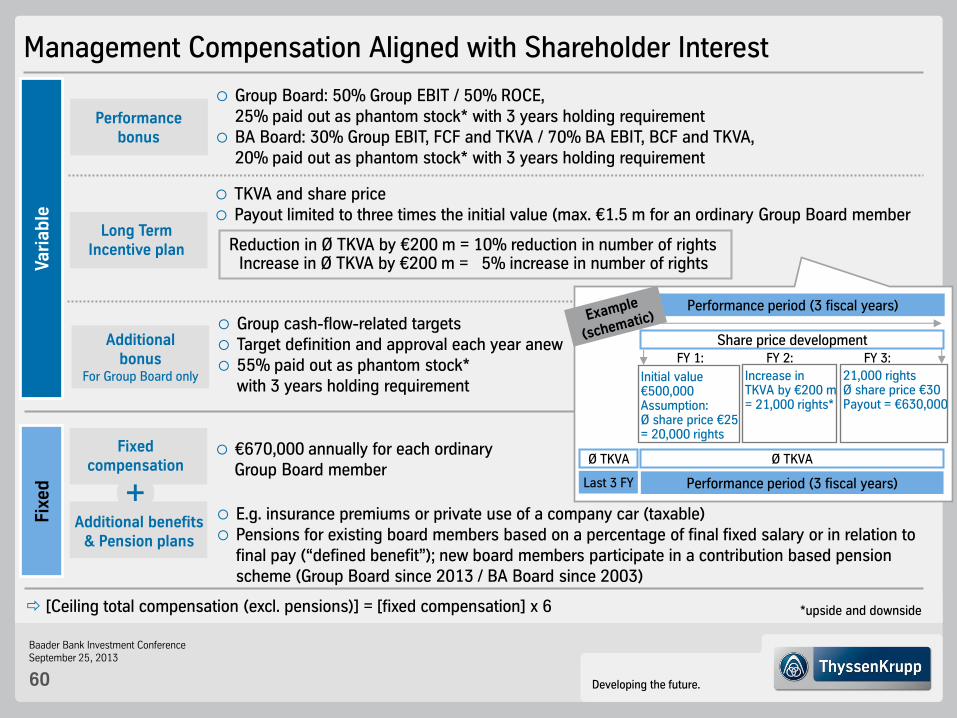
Management Compensation Aligned with Shareholder Interest Fix
ed
Va
ria
ble
€670,000 annually for each ordinary Group Board member
E.g. insurance premiums or private use of a company car (taxable) Pensions for existing board members based on a percentage of final fixed salary or in relation to
final pay (“defined benefit”); new board members participate in a contribution based pension scheme (Group Board since 2013 / BA Board since 2003)
Long Term Incentive plan
Additional bonus
For Group Board only
Group cash-flow-related targets Target definition and approval each year anew 55% paid out as phantom stock*
with 3 years holding requirement
Fixed compensation
Additional benefits & Pension plans
TKVA and share price Payout limited to three times the initial value (max. €1.5 m for an ordinary Group Board member
Performance bonus
Group Board: 50% Group EBIT / 50% ROCE, 25% paid out as phantom stock* with 3 years holding requirement
BA Board: 30% Group EBIT, FCF and TKVA / 70% BA EBIT, BCF and TKVA, 20% paid out as phantom stock* with 3 years holding requirement
Performance period (3 fiscal years)
Share price development
Performance period (3 fiscal years) Last 3 FY
Ø TKVA Ø TKVA
Initial value €500,000 Assumption: Ø share price €25 = 20,000 rights
Increase in TKVA by €200 m = 21,000 rights*
21,000 rights Ø share price €30 Payout = €630,000
FY 1: FY 2: FY 3:
[Ceiling total compensation (excl. pensions)] = [fixed compensation] x 6
Reduction in Ø TKVA by €200 m = 10% reduction in number of rights Increase in Ø TKVA by €200 m = 5% increase in number of rights
*upside and downside
Developing the future.
Baader Bank Investment Conference September 25, 2013
61
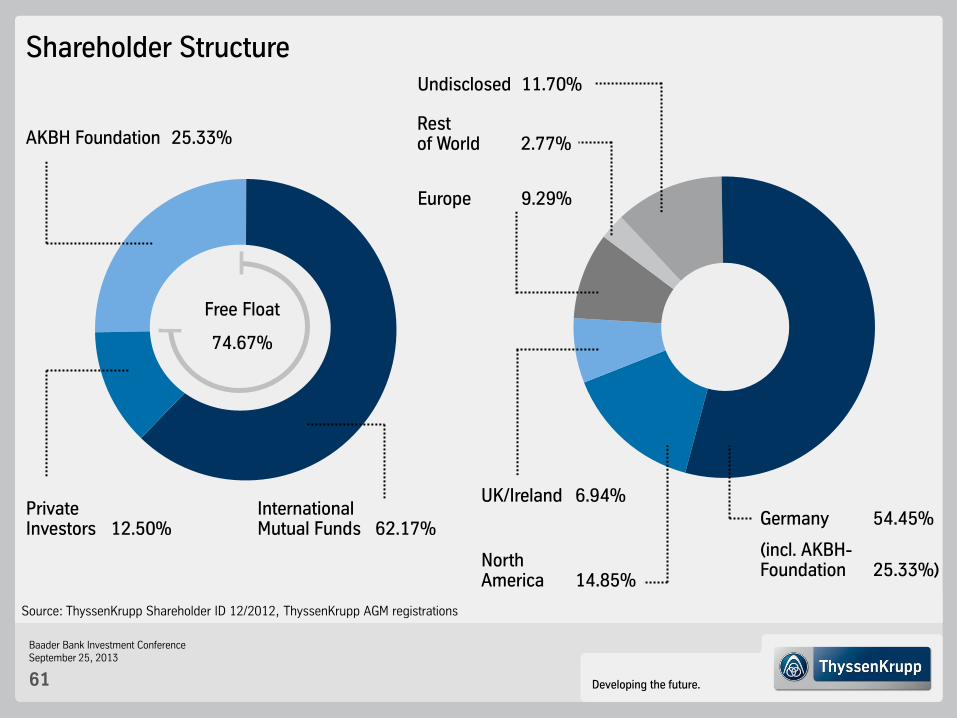
Source: ThyssenKrupp Shareholder ID 12/2012, ThyssenKrupp AGM registrations
Free Float
74.67%
International Mutual Funds 62.17%
AKBH Foundation 25.33%
Private Investors 12.50%
Shareholder Structure
Germany 54.45%
(incl. AKBH- Foundation 25.33%)
Rest of World 2.77%
Europe 9.29%
UK/Ireland 6.94%
North America 14.85%
Undisclosed 11.70%
Developing the future.
Baader Bank Investment Conference September 25, 2013
62
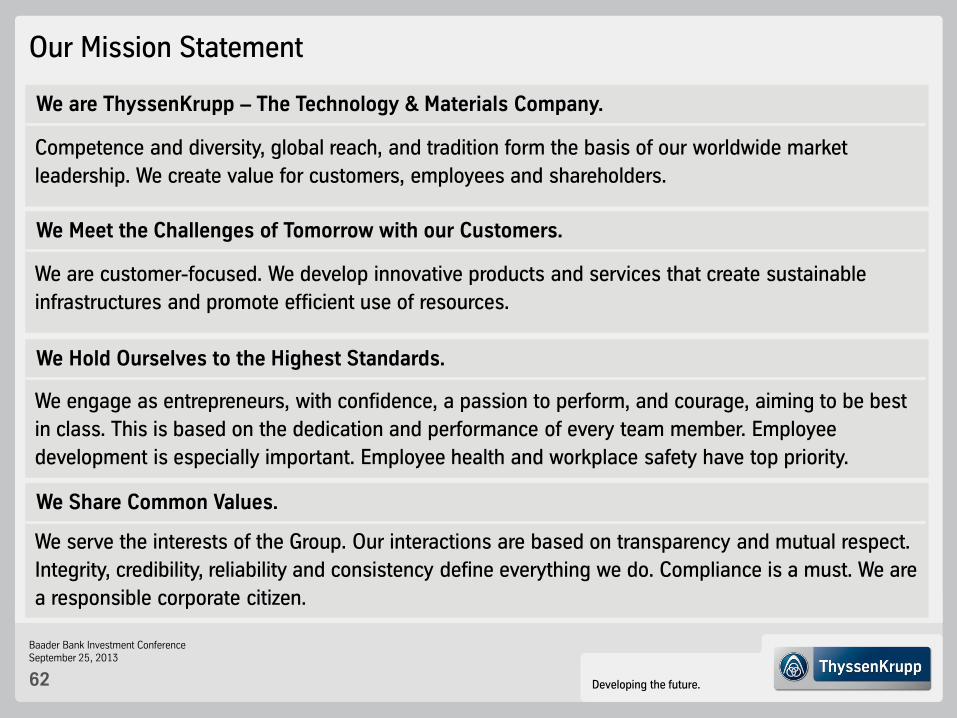
Our Mission Statement
Competence and diversity, global reach, and tradition form the basis of our worldwide market
leadership. We create value for customers, employees and shareholders.
We are ThyssenKrupp – The Technology & Materials Company.
We are customer-focused. We develop innovative products and services that create sustainable
infrastructures and promote efficient use of resources.
We Meet the Challenges of Tomorrow with our Customers.
We engage as entrepreneurs, with confidence, a passion to perform, and courage, aiming to be best
in class. This is based on the dedication and performance of every team member. Employee
development is especially important. Employee health and workplace safety have top priority.
We Hold Ourselves to the Highest Standards.
We serve the interests of the Group. Our interactions are based on transparency and mutual respect.
Integrity, credibility, reliability and consistency define everything we do. Compliance is a must. We are
a responsible corporate citizen.
We Share Common Values.
Developing the future.
Baader Bank Investment Conference September 25, 2013
63
Disclaimer ThyssenKrupp AG
“The information set forth and included in this presentation is not provided in connection with an offer or solicitation for the purchase
or sale of a security and is intended for informational purposes only.
This presentation contains forward-looking statements that are subject to risks and uncertainties. Statements contained herein that
are not statements of historical fact may be deemed to be forward-looking information. When we use words such as “plan,” “believe,”
“expect,” “anticipate,” “intend,” “estimate,” “may” or similar expressions, we are making forward-looking statements. You should not
rely on forward-looking statements because they are subject to a number of assumptions concerning future events, and are subject to
a number of uncertainties and other factors, many of which are outside of our control, that could cause actual results to differ
materially from those indicated. These factors include, but are not limited to, the following:
(i) market risks: principally economic price and volume developments,
(ii) dependence on performance of major customers and industries,
(iii) our level of debt, management of interest rate risk and hedging against commodity price risks;
(iv) costs associated with, and regulation relating to, our pension liabilities and healthcare measures,
(v) environmental protection and remediation of real estate and associated with rising standards for real estate environmental
protection,
(vi) volatility of steel prices and dependence on the automotive industry,
(vii) availability of raw materials;
(viii) inflation, interest rate levels and fluctuations in exchange rates;
(ix) general economic, political and business conditions and existing and future governmental regulation; and
(x) the effects of competition.
Please note that we disclaim any intention or obligation to update or revise any forward-looking statements whether as a result of new
information, future events or otherwise.”